Submitted:
13 April 2017
Posted:
14 April 2017
You are already at the latest version
Abstract
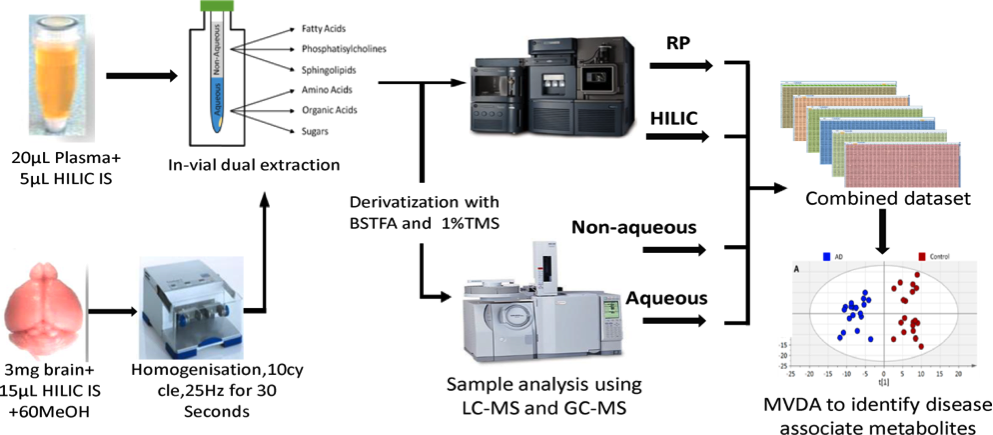
Metabolomic analysis of biological fluids and tissues has become an increasingly routine tool in the biological toolbox. However, challenges remain to be overcome, including developing strategies to maximise coverage of the metabolome without requiring large sample volumes. Here we describe a multimodal strategy that combines data using both LC-MS and GC-MS from a unique vial with a sample of plasma (20µl) or a sample of brain tissue (3mg). Using a split phase extraction the non-aqueous phase was analyzed by reversed phase (RP) LC-MS, whilst the aqueous phase was analyzed using hydrophilic liquid interaction chromatography (HILIC)LC-MS, with both phases also analysed using GC-MS after derivatization of the extract. Analytical performance was assessed in 7 rat cerebellum samples and a pilot study of 40 plasma samples (20 vs. 20: AD vs. healthy controls). The method, which uses four hours of instrument time, measured 20,707 metabolite features in brain samples and 17,266 in plasma samples, from those 44.1% features displayed CV’s below 15% and 75.2% below 30%. The method has potential to resolve subtle biological differences and to correlate metabolite composition directly to clinical outcomes including MMSE, age and ADCS-ADL. This method can acquire in the order of 20K metabolic features when low volumes are available.
Keywords:
metabolomics
; LC-MS
; GC-MS
; plasma
; brain tissue
Copyright: This open access article is published under a Creative Commons CC BY 4.0 license, which permit the free download, distribution, and reuse, provided that the author and preprint are cited in any reuse.


