Preprint
Article

A Case Study of Familiar Gastrointestinal Pathologies at Risk of Cancer. Early Detection of Degenerative Signals by Oxidative Stress Biomarkers

Altmetrics

Downloads

416

Views

262

Comments

0

A peer-reviewed article of this preprint also exists.

Submitted:

12 February 2024

Posted:

13 February 2024

You are already at the latest version

Alerts
Abstract
Beyond factors such as smoking and obesity, the risk of getting gastrointestinal cancer is passed down from parents to offspring, inherited by a gene mutation, predisposing them to develop cancer in their lifetime. Here we describe the clinical history of family members affected by gastrointestinal pathologies often leading to cancer. In the epidemiological study, the cohort of members of this family shared a high risk of developing gastrointestinal diseases. The subjects were monitored from May 2006 to December 2017 by collecting periodically clinical and endoscopic data, and determining both auto-modification of lymphocyte Poly(ADP-ribose)Polymerase as early signal of DNA damage, and erythrocyte membrane lipid composition (Fat Profile). Both biomarkers were demonstrated to be non invasive and easy tools, to monitor over time family members, first the oldest members (nine siblings), and thereafter their offspring, whose cell status evolved from physiological even to cancerous one. All subjects developed gastrointestinal pathologies of different kind and seriousness. Some diseases evolved to cancer, sometimes as a sudden and lethal event. The results of the two molecular approaches, agreed and even predicted the clinical and imaging paths. This cohort study supported the hypothesis that both noninvasive molecular analyses can predict altered cell states and support clinical and imaging tests.
Keywords: 
Subject: Biology and Life Sciences  -   Biochemistry and Molecular Biology

1. Introduction

Functional disorders are those in which the gastrointestinal (GI) tract looks normal but doesn’t work properly [1]. They are the most common problems affecting the GI tract (including the colon and rectum). GI disorders include such conditions as constipation, irritable bowel syndrome, hemorrhoids, anal fissures, perianal abscesses, anal fistulas, perianal infections, diverticular diseases, colitis, colon polyps and cancer [1]. Hereditary cancer syndromes are the result of specific inherited genetic mutations that contribute to a person‘s lifetime risk of cancer. Sometimes, cancer-predisposing mutations are inherited giving rise to hereditary cancer syndromes [2,3]. Almost all colorectal cancers begin as polyps, benign (non-cancerous) growths in the tissues lining the colon and rectum. Cancer develops when these polyps grow and abnormal cells develop and start to invade surrounding tissue. Most early forms of colorectal cancer do not cause symptoms, which makes screening especially important. When symptoms do occur, the cancer might already be quite advanced. Gastro-intestinal (GI) cancers remain among the most common forms of cancer worldwide and are an excellent model for the investigation of hereditary factors in cancer [4]. Gastro-intestinal cancer belongs to the neoplastic spectrum of hereditary non-polyposis colorectal cancer, a genetic disease with an autosomal dominant pattern of inheritance. Familial polyposis (FAP) and hereditary non-polyposis colorectal cancer (HNPCC) are the two main hereditary colon cancer syndromes [5]. Dysplasia is still today the mainstay of cancer prediction in most inflammatory disorders of the gastro-intestinal tract and is an independent marker of cancer risk. Epidemiological studies on high risk populations evidenced a strong familiarity for esophageal cancer with up to 60% of the affected patients reporting a positive familiary history [6]. The initial alterations which are not detectable on histologic examination, are subtle changes in the normal balance between cell growth and cell death. The genes responsible for these syndromes have recently been identified; as a result, genetic testing has become the most important determining factor in clinical decisions. In fact with current diagnostic and clinical approaches the prognosis of gastric cancer is very poor. Similar to other solid cancers, GI, in particular gastric cancer, is a complex disease resulting from combinatorial interactions among diverse factors including environmental, host-genetic and molecular mechanisms. For instance, persistent infection of the gastric mucosa by Helicobacter pylori can initiate an inflammatory cascade that progresses into atrophic gastritis, a condition associated with reduced capacity for secretion of gastric acid and an increased risk of developing gastric cancer [7]. H. pylori infection promotes gastric cell death and reduced epithelial cell turnover in the majority of infected cells, resulting in primary tissue lesions associated with an initial inflammatory response [8]. The role of H. pylori infection in early stages of gastric carcinogenesis is to increase the incidence of precancerous lesions [8]. GI cancers arise in part because of disruption of cell death mechanisms including apoptosis that contributes to cell expansion. Altered expression of cell cycle/apoptosis key regulators may promote tumor progression, reflect secondary genetic/epigenetic events, and impair the effectiveness of therapy [9]. A key enzyme in the apoptotic process of cells is poly-ADP-ribose polymerase (PARP), the specific target of caspase 3 [10]. PARP is a multifaceted enzyme that through its product poly(ADP-ribose) is directly involved in the regulation of chromatin architecture and functions, with a main and prevalent role in DNA repair [11,12,13]. The synthesis of the polyanion poly(ADP-ribose) by the nuclear PARP 1, the main member of PARP family, starts after the first ADP-ribose unit has been transferred from NAD+ to an acceptor protein [14]. The transition from modified to unmodified targets is granted by poly(ADPribose) glycohydrolase, that shuttles from cytoplasm to nuclei and viceversa [15]. This enzyme degrades the polymer with both endo- and exoglycosidic activity. PARP activation provides a rapid, post-translational signal that can halt the transcriptionand replication machineries and mobilize DNA repair apparatus. When the DNA of a cell is damaged at low level, the cell will activate mechanisms to arrest the cell cycle and repair the DNA lesions [16]. If the level of DNA damage is very high, the cell will activate the process of death (apoptosis or necrosis). Inhability of cell to undergo apoptosis results in cancer and autoimmune diseases [17,18]. PARP1 has a main role in DNA damage signaling and cell death pathways [16]: the equilibrium between specific pathways andthe local cellular environment leads to the net result, such as proliferation or terminal differentiation, survival or cell death [16,18]. On the basis of these data, cell cycle/apoptosis maintenance is considered instrumental for optimal therapy response. Given the role of PARP as biomarker of DNA damage in in vitro diastereomeric recognition of 5′,8-cyclo-2′-deoxyadenosine lesion [19], and in pre-apoptotic and apoptotic events, and its recognized importance as a signal of oxidative stress, it is conceivable that its activity levels/expression in the cell nucleus can help in defining the cellular physio-pathological state.
Another cell feature able to give information at molecular level is the membrane lipid composition [20 and references there in]. Generally lipidomics describes and quantitatively analyses the full complement of lipids in the human body (body fluids, cells, tissues), and integrates these data with knowledge of their protein targets, i.e., the metabolic enzymes and transporters, and of the relevant genes and the regulatory aspects of these physiological systems [20]. Lipids are the building blocks of cell membranes, providing them with a homeostatic system through their physical characteristics as well as with their reactivity due to the unsaturated fatty acid residues. An understanding of cell membranes is only possible with a comprehensive understanding of their lipid constituents [20]. The cell membrane is highly organized and extremely important for a correct performance of the functions of the cell; it is a sensor that changes and adapts continuously to metabolic stimuli and the external environment (diet, stress, physical and chemical agents) and the fatty acid (FA) composition has a predominant role for this accomplishment. The membrane FA asset, i.e., saturated (SFA), monounsaturated (MUFA) andpolyunsaturated (PUFA) FAs, present in the phospholipids is characteristicof each tissue [20]. A natural adaptation response is active and the appropriate changes of the FAs microenvironment ensure the best functioning of membrane proteins, receptors, pumps and signals in tissues, according to environmental and metabolic needs [21].The important role of changes to the membrane structure and corresponding physical-chemical properties are well established [22,23]. A recent report gave evidence that PARP-1 ablation alters eicosanoid and docosanoid signaling and metabolism in a murine model of contact hypersensitivity [24]. More over both molecular events drive epigenetic mechanisms [25]. These observations highlight that PARP automodification (PAR-PARP) and membrane fatty acid composition (Fat Profile) are molecular aspects which can be taken together as complementary information of the healthy/pathological state of the cell. Infact each of the two have been independently used by authors to look at membrane status and DNA damage in the cell [26,27]. We have previously reported the parallel and synergic involvement of two crucial cell compartments, nucleus and membrane, to build up an integrated panel for evaluating cell molecular health [27]. This possibly preventive strategy can utilize both biomarkers in order to stratify cancer patients into appropriate screening or surveillance programs; the combination of noninvasive both PARP immuno test and lipidomic analysis on blood samples as biomarkers has been helpful in different pathologies, beside cancer [28]. The present survey started as an epidemiological cohort study. The cohort of subjects was made up of members of the same family with a high risk of developing GI diseases, their common feature; they underwent the two mentioned molecular tests, which represent the experimental part of the investigation. Different features of the cohort were age and pathophysiological condition (affected and not affected by pathologies). The long duration of the study (2006-2017), and the possibility of monitoring over time the subjects offered the possibility of evaluating the effectiveness of molecular analyzes (auto-modified poly (ADP-ribose) polymerase, PAR-PARP, and erythrocyte membrane fatty acid composition, Fat Profile®) in defining the individual’s pathophysiological state, their predictive potential and the usefulness in giving support to clinical and endoscopic diagnoses. Moreover, the investigation developed also as a case / control study for the need to consider a reference group (controls), whose results of the molecular analyzes fell within a physiological range.
Thus, the present work was aimed establishing whether the analyses of PAR-PARP and Fat Profile®, could help monitoring the progression of the pathological state of the cell, in the family model system at high risk of GI pathologies often changed into cancer. The rationale of this approach was to compare the results of both analyses obtained and to consider their possible relationship with clinical data of patients. Therefore, the data were treated taking into account the declared/diagnosed diseases. In the light of results from molecular analyses, we suggest that the worsening of the pathological condition could be predictable and later followed up by the combination of the two analyses.

2. Results

This study was initially considered to be an epidemiological cohort study. The cohort of subjects were members of the same family with a high risk of developing GI diseases, up to cancer. They underwent two molecular tests, which represent the experimental part of the investigation. Different features of the cohort subjects were their age and pathophysiological condition (affected and not affected by pathologies). The long duration and the possibility of monitoring over time the subjects offered the possibility of evaluating the effectiveness of molecular analyzes in defining the individual’s pathophysiological state, their predictive potential and the usefulness in giving support to clinical and endoscopic diagnoses. More over the investigation developed as a case / control study for the need to consider a reference group (controls), whose results of the molecular analyzes fell within a physiological range.
The survey began on 2006 and went on up to 2017 for old and young people. To simplify the description of the results, we initially discuss about the elderly members of the family, nine siblings, which the largest number of information was available for. Afterwards, the clinical pictures of some of the youngest family members are evaluated.
Lastly we provide a statistical approach to determine the significance of all results.

2.1. Anamnestic and Clinical Data of the Family’s Elderly Members

The parents of the nine siblings had deceased for acute myocardial infarction (father) and ischemic stroke (mother). No further information about their general status was available.
Table 1 shows the anamnesis of the nine siblings (three brothers and six sisters) at beginning of the survey (2006). At time of the first interview, most family members were already affected by GI pathologies. The presence of apparently non-cancerous gastro-enteric diseases was common quite to all, except to subjects 1 and 5 (Table 1). Before the survey, on 1999, one of the sisters had undergone gastric resection following cancer evolution of previous gastritis, still suffering of intestinal inflammations and being under therapy (Table 1, patient N° 7).
Subject 4 had already died before the investigation (on 2003) and here information collected from relatives is reported. He was enclosed to get a complete picture of all siblings’ medical histories, and in a next section, of his children.
All the eight alive subjects in Table 1 underwent to a careful family and personal history interview, accompanied by the results of common clinical analyzes and general information on their lifestyle. They worked in different fields and lived in the same geographical area, had very similar lifestyles, without excess of smoke and alcohol, and common diet habits due to the presence in the territory of cultivations and breeding of typical products of the Mediterranean diet.
H. pylori, an important hallmark in gastrointestinal disorders, which occurs in the most advanced stages of the pathologies, initially, was negative for all the brothers (Table 1).
Hyperthension and high levels of hematic cholesterol were frequent clinic symptoms among siblings, suggesting familiar predisposition to cardiovascular pathologies too (Table S1 in Supplementary Material).
The predisposition to gastro-intestinal pathologies with clear evolutions towards tumors required, over the years, a close surveillance of these subjects with periodic (every three-six months) endoscopies (gastro- and colonoscopy).

2.2. Poly(ADP-Ribose) Polymerase Auto Modification (PAR-PARP) in Lymphocyte Lysates of Elderly Family Members

Controls and family members were subjected to the first molecular investigation with the measure of the hyper-modification of PARP (PAR-PARP).
After electrophoresis and western blotting, the blotted proteins (20 µg) were analyzed with anti-PARP catalytic site antibodies. The use of anti-PARP antibodies allowed to get evidence of both PARP automodification, of native PARPs and of the apoptotic PARP fragment, where present. For few samples we confirmed the results with anti-PAR antibodies too (data not shown).
Here we underline that proteins loaded on the gel were constant (20 µg). So, the difference in intensity of immunobands depended only on the level of endogenous automodification.
In §4.4 the method of densitometric measures is reported, and in Supplementary Material (§ S2.2.1) interpretation of data is described, with a scheme of immunopattern (Figure S1). The results of PAR-PARP densitometric analysis obtained for the controls are reported too (§ S2.2.2, and Figure S2). In each immunoblot two – three healthy controls were analyzed with patient samples, to compare them in the same experiment.

2.2.1. First PAR-PARP Analysis in Lymphocyte Lysates of Elderly Family Members. Immunological and Densitometry Profiles

PAR-PARP already proved to be a good indicator of DNA damage measurable from physiological to massive levels [28]. The ranges of densitometries corresponding to different DNA damage levels are reported in § S2.2.1.
Figure 1a shows the immunological profiles of subjects 1-3 and 5-9 of Table 1. In a previous paper we already evidenced that PARP 2 (62 kDa) is particularly abundant in lymphocyte lysates and that the measured PAR-PARP enclosed also automodification of PARP 2 [27,28].
The molecular analysis of the siblings’ lymphocytes clearly showed that, compared to the controls, samples had from moderate to very high levels of modified PARP, corresponding to DNA damage of different degrees [28]. The densitometric analysis of PAR-PARP bands allowed to quantify hypermodification levels (Figure 1b). For subjects 2, 7 and 8 the values were within those of controls, below the upper limit for 7 and 8, and for subject 2, very close to cut-off. The endoscopies of these subjects were all negative for cancer, even if the subject 2 declared gastroenterical pathologies and the subject 7 had already been submitted to gastrectomy. In the latter case, PAR-PARP is at physiological levels probably because DNA damage was mainly resolved with surgery and subsequent therapy. We feel to state this as peripheral blood lymphocytes are often used instead of affected tissues, as a mirror of their behaviour.
It is worth noting that sister 1, not declaring any diseases, showed the highest PAR-PARP value, corresponding to massive DNA damage.
Similarly, very high was PARP hypermodification of subject 3 in the absence of cancer endoscopic diagnoses. In the latter two cases, especially in 1, the molecular analysis suggested a non-physiological condition which did not correspond to a macroscopic tissue alteration, as indicated by the negative clinical and endoscopic reports provided by the subjects. In particular, subjects 3, 6 and 9 who declared gastrointestinal diseases showed PAR-PARP levels among the highest ones.

2.2.2. Second PAR-PARP Analysis of Elderly Members

On 2009 a second molecular analysis was carried out and further information was collected to update the situation of the siblings.
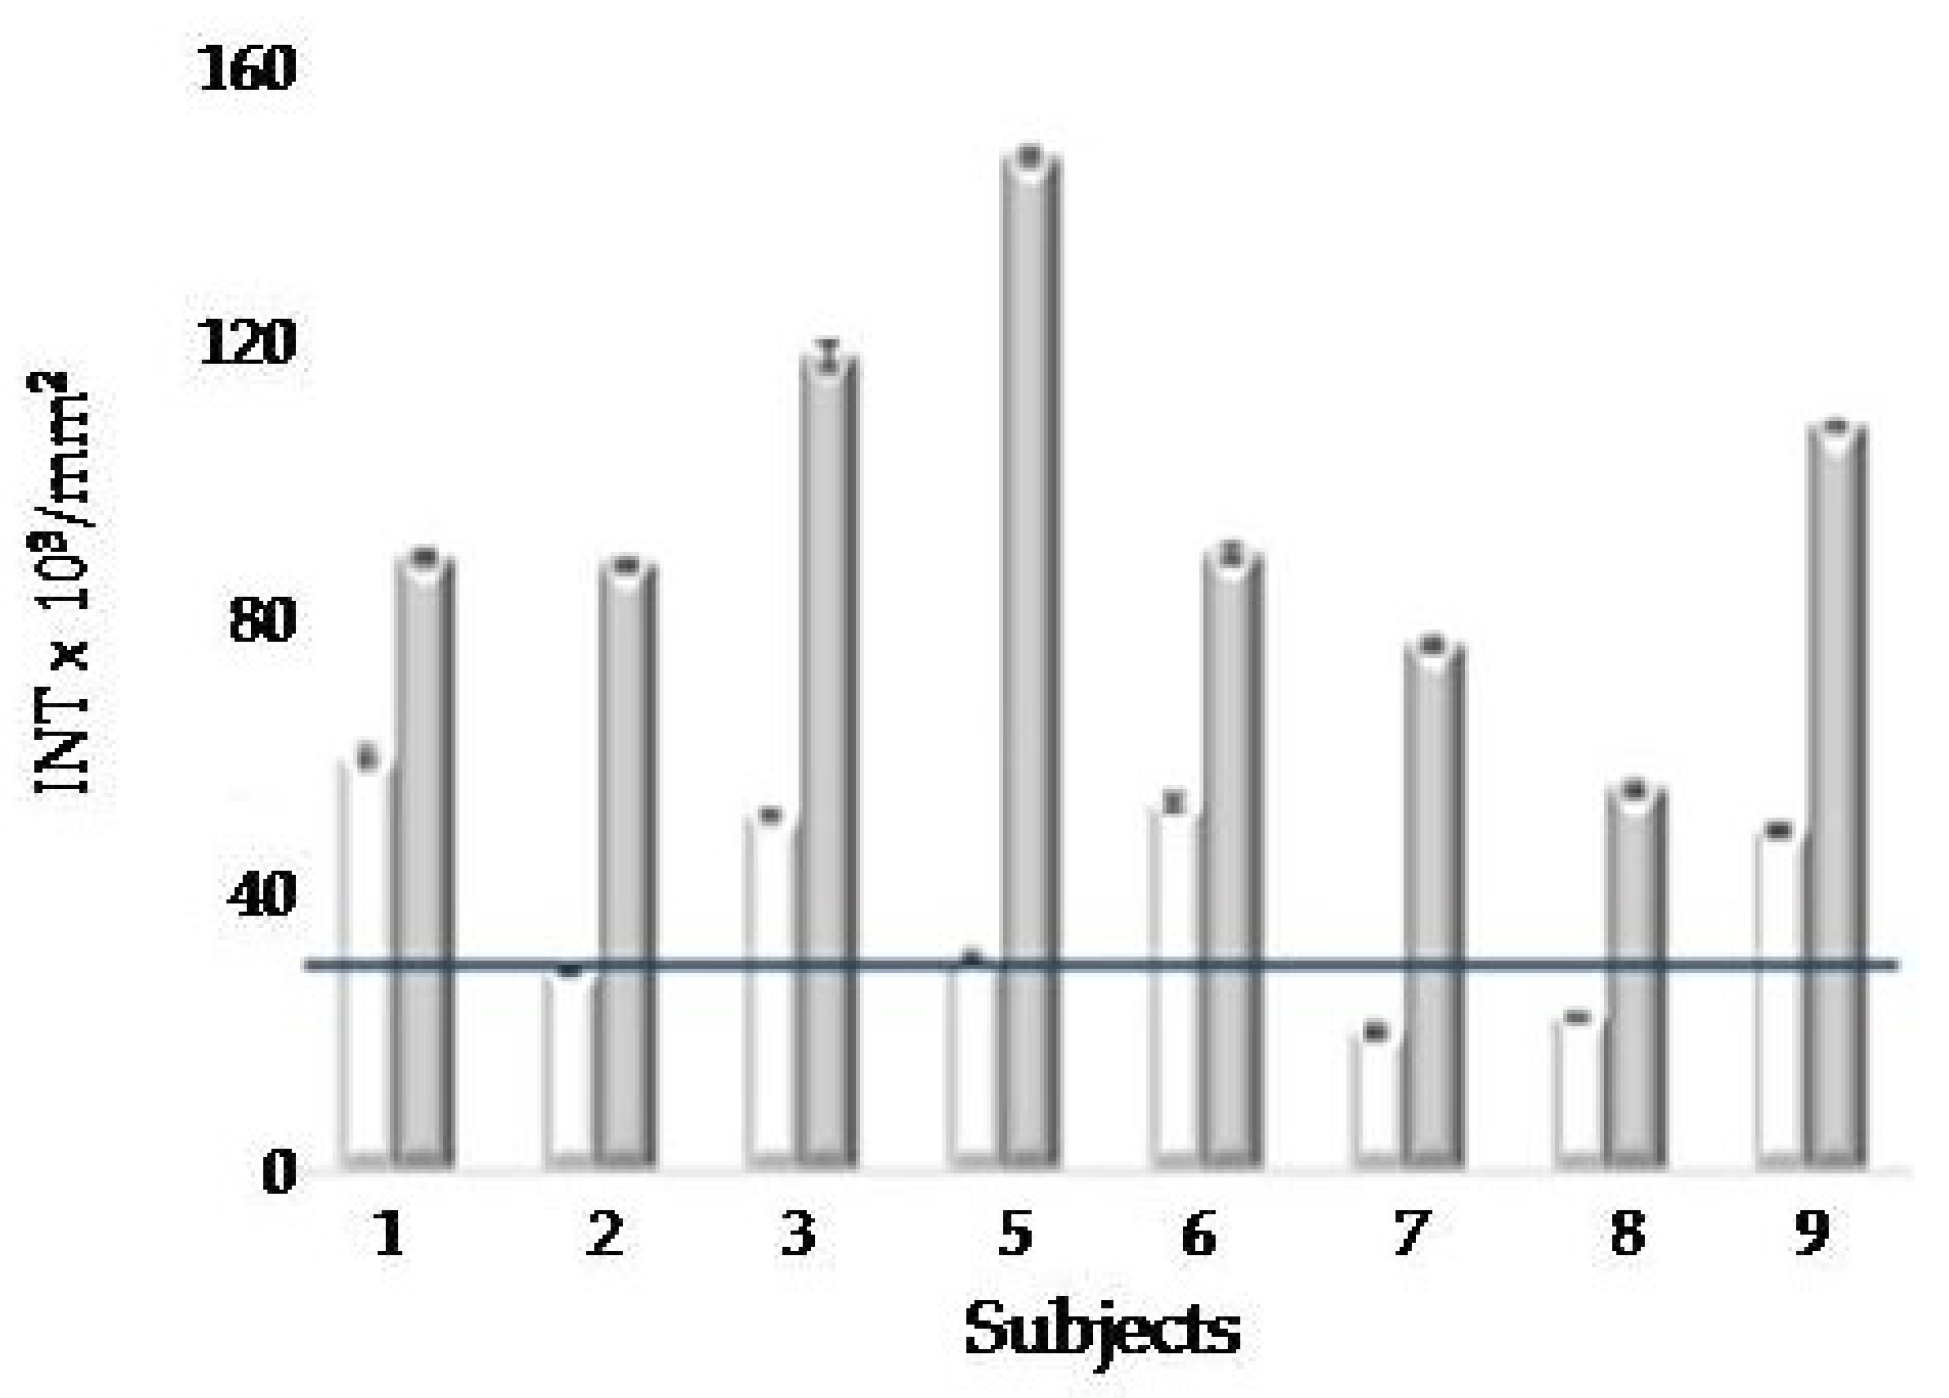
Figure 2 shows, in comparison, the PAR-PARP values of Figure 1b, and those determined on 2009.
The level of hypermodification of PARP is considerably increased for all subjects, highly above the cut-off. Except for subject 8 for which densitometry is still in the range of moderate damage, all others show values corresponding to very high DNA damage. For subjects 1-3, 5, 7, 8 and 9, densitometry measures were two to five times higher than in the first analysis. This group included both subjects who did not declare diseases of the digestive system (N°1, N°5), and those with gastro-enteric diseases of various kinds, especially diverticulosis and diverticulitis. In particular the increased PAR-PARP level measured for subject 7 who had previously undergone gastrectomy and had shown to recover, could be explained by the subsequent diagnosis of colon carcinoma (see §2.4).

2.3. Erythrocyte Membrane Fatty Acid (FA) Analysis (Fat Profile®) of Elderly Members

The erythrocyte membrane has a characteristic FA asset; all FAs are present in specific amounts in the phospholipids of the bilayer. The response of lipid analysis, considered herein, is the FAT PROFILE® (more details in Supplementary Material, §S2.3). In particular we focused our attention to the FAs which are mostly involved in inflammatory pathways, either as pro-(n6 FA), and anti (n3 FA)-inflammatory mediators [22]. There fore the n (omega)-6 DGLA and ARA, the n (omega)-3 EPA and DHA were mainly considered in this study.
As an example, the Fat Profiles (2006) of old subjects are reported in Table 3S (Supplementary Material). Table S4 compares the results of n6 and n3 PUFAs of the two analyses (2006 and 2009). The pro-inflammatory pathway leading to DGLA as precursor of ARA is altered for all subjects, being above the upper normal limit (2.4). Neverthless the levels of ARA result in the range of normality or lower. A explanation is that DGLA is also precursor of prostaglandins (PG) which inhibit inflammation and favor the immune response, therefore its increase can be correlated to cell protection [22]. Signals of an inflammatory condition are the low levels of antioxidants n3, DHA and EPA, for all subjects highly below the lowest normal value. Calculating the n6/n3 ratios they are in favour of pro-inflammatory compounds.
Table 2 shows the unbalance (%) of pro- inflammatory (n6 FA), and anti–inflammatory (n3 FA) mediators measured on 2009.
Table S4 shows a common feature of the first FAT Profile (2006) of all siblings, the high deficiency of n3 FA (EPA, DHA), which indicated a high inflammatory status and splitted n6/n3 ratios above the normal range (3.5-5.5%), despite the levels of ARAwere normal or slightly above the normal range. One exception was for subject N° 9, who showed a great ARA increase.
The results of the second analysis (2009), showed a high reduction of n6/n3 ratio for subjects 1-6-7-8-9, apparently in favour of an anti-inflammatory condition (Table 2). Looking at the relative unbalance of n6 and n3 compounds, it is evident that the lack of n3 FA is still relevant and the ratio is influenced (reduced) by any increase of n6 compounds.
In other subjects the n6/n3 ratios of both analyses were always above the normal range suggesting that the inflammatory condition still occurred on 2009 and was general for all subjects (Table S3, Table 2).

2.4. Follow up of Siblings’ GI Pathologies

From 2009 to 2017, the clinical condition of some subjects underwent a further, sometimes lethal evolution. Table 3 shows the update of the pathological history of the siblings up to 2017.
It is interesting that subjects 1 and 5, who at the first analysis already showed altered levels of modified auto PARP, and a permanent pro-inflammatory FAT Profile, despite the absence of clinical and morphological GI alterations, showed new gastrointestinal diseases. Subject 1 declared foveolar hyperplasia and intestinal metaplasia, but up to the last check on 2015, her endoscopies were negative for neoplasies. Subject 5 developed gastric mucosa dysplasia. Both sisters were positive to H. pylorii.
Other subjects developed tumoral forms. On september 2011 brother 2 was diagnosed with a pancreatic head tumor, fatal on october 2011.
On december 2009 sister 3 was diagnosed with a gastric carcinoma; gastric resection followed on January 2010 with degeneration to peritoneal carcinosis and ascites. Meanwhile ovaric carcinoma (Krukhenberg tumor) was discovered and removed. She deceased on June 2010.
Subject 7, who had normal PAR-PARP values, showed new gastrointestinal pathologies, with sigmoid resection (2009) and subsequent colon carcinoma (2012). No onset of pathologies for subject 8, which however showed alterations in PAR-PARP levels, together with a positive H. Pylorii, and to which attention had been paid with more frequent monitoring. On 2009 sister 9 underwent gastrectomy joint with flogosis and inflammation.
Subject 6, diagnosed with breast cancer on march 2009, underwent mastectomy. On 2013 colon carcinoma, and on 2016 pulmonary carcinoma were discovered.
In cases where tumor degenerations had occurred, genetic tests were recommended, in particular performed for patients 6, 7, 9 (§S2.4 in Supplemental Material).

2.3. Molecular Analyses of Some Young Family Members

2.3.1. PAR-PARP. Densitometry of the Immunological Profiles

The PAR-PARP analysis was extended to the young members of the family, sons and daughters of people in Table 1.
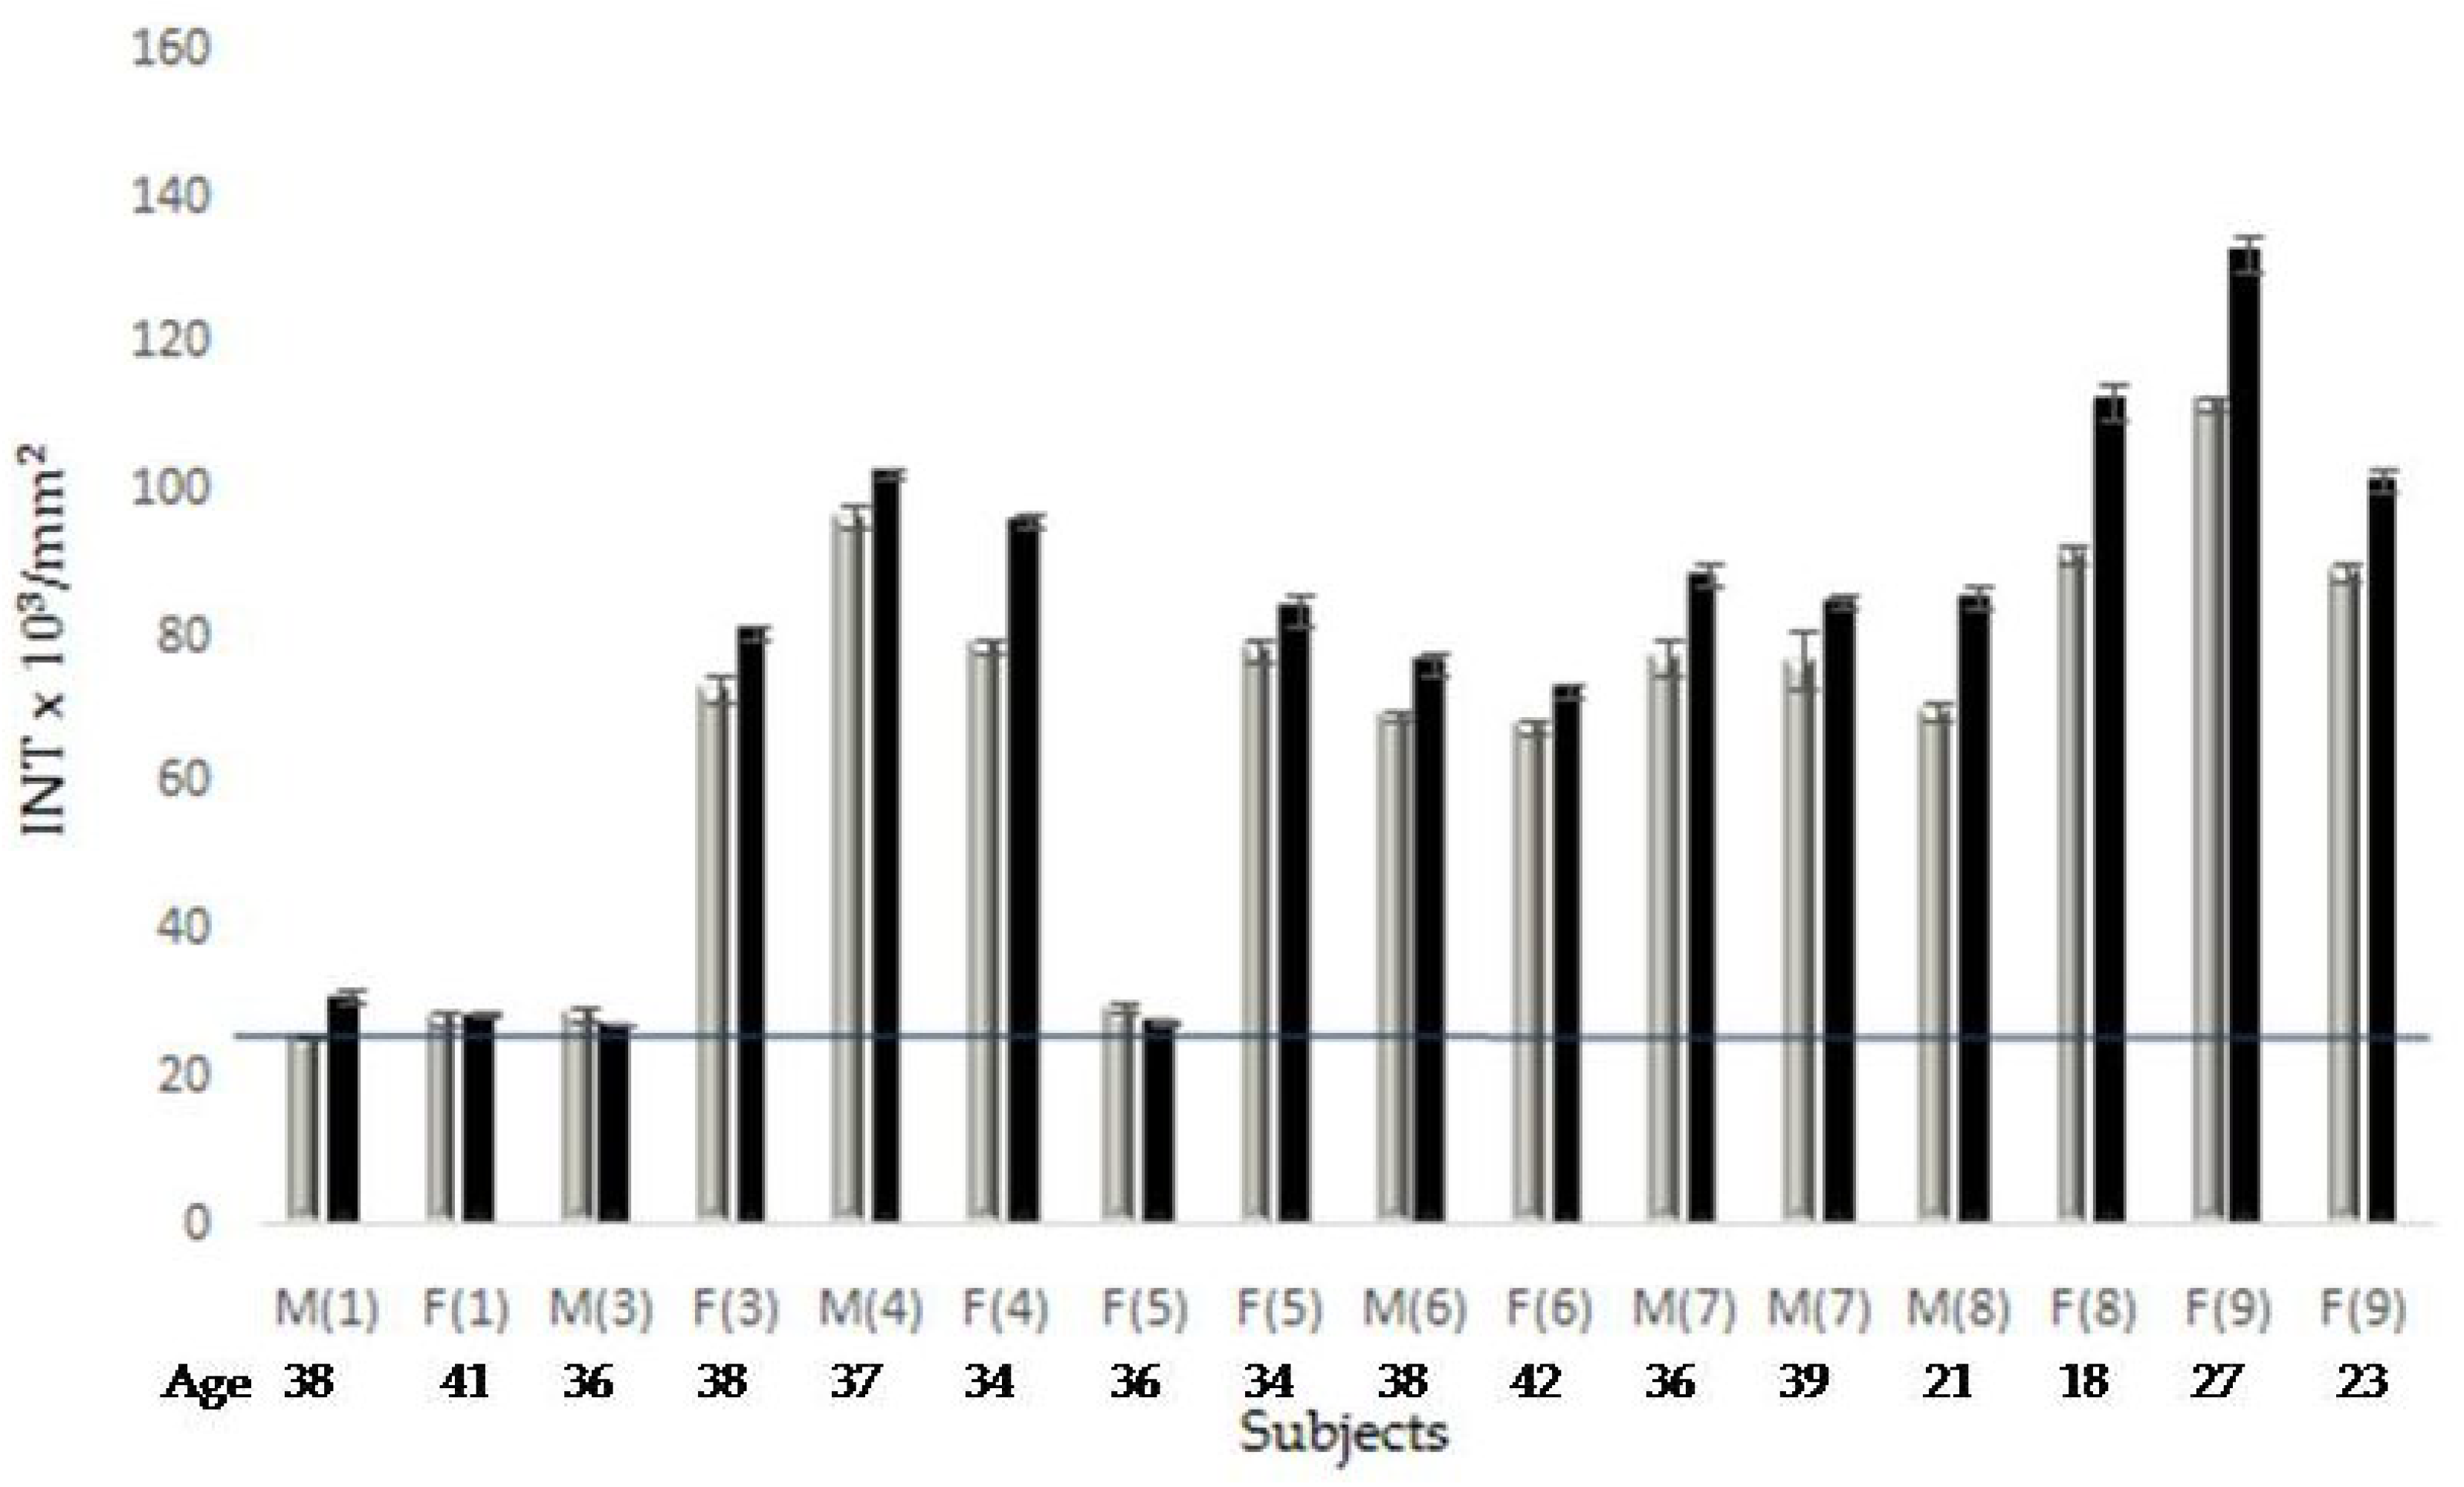
Figure 3 shows the results of densitometric analyzes at the beginning of the survey, compared with those obtained on 2009. No results are available at later times since all subjects (elderly and young) refused to undergo further molecular analysis.
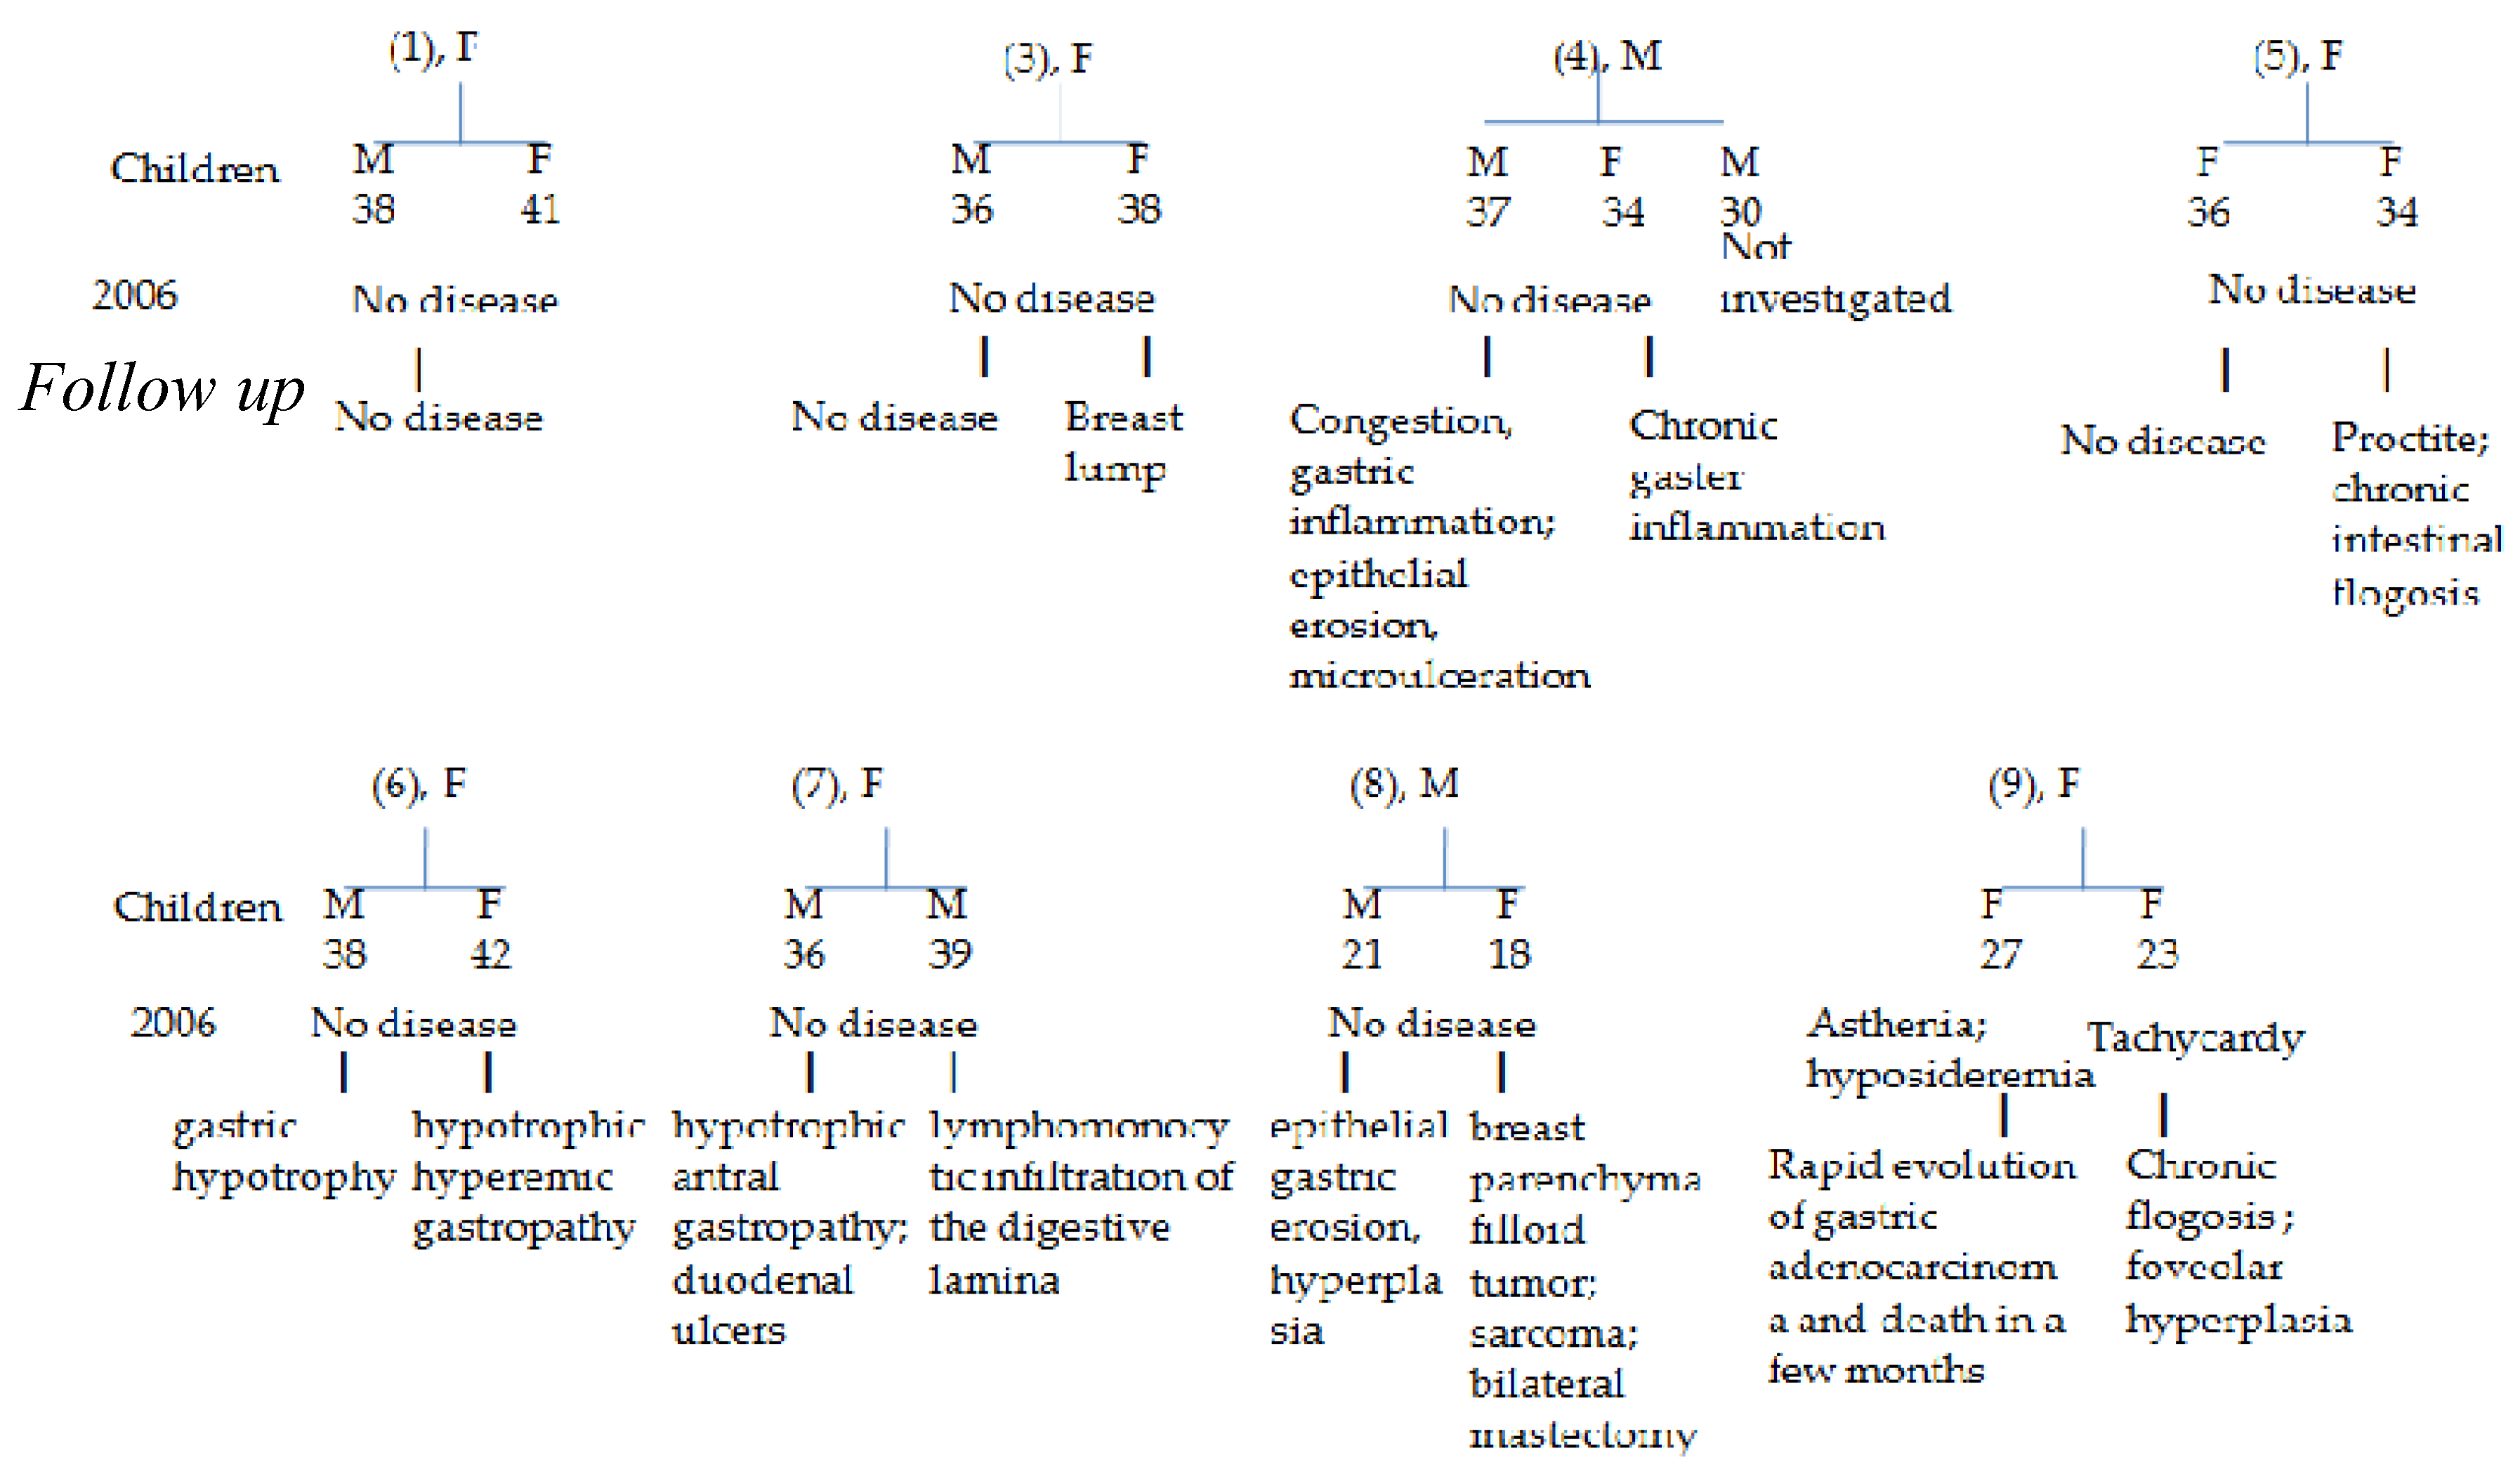
Therefore, later on, further information was collected only from the endoscopic analyzes and reported in Figure 4.
Most densitometry values fell in the range of high damage degree (> 60 O.D.x102 / mm2), in both analyzes. With the first determination of PAR-PARP it was highlighted that, for subjects who declared no pathology or clinical parameters alteration, the molecular signals suggested a non-physiological condition, confirmed by the subsequent determination. Only in some subjects the values were around the cut-off in both analyses.

2.3.2. Anamnestic and Clinical Data

Figure 4 shows the clinical condition of young people and allows to correlate it with the PAR-PARP analysis. There are reported the lineages of each sibling with the indication of gender (F, M), age (18-42 years), and results of the initial and subsequent history, at different times.
The information collected at the beginning of the survey did not indicate the presence of pathologies. All subjects declared themselves healthy, except for one case, subject 9, affected by asthenia and favism, inherited from the Sardinian father, (Figure 4). Favism affected also the other sister.
A subject (not investigated) always refused to undergo endoscopic, clinical and PAR-PARP analysis.
Subsequent endoscopic checks were carried out, in the years of investigation, at different times for all subjects (n = 16) adhering to the survey, and with a variable frequency depending on the need of subjects.
Three people showed no onset of pathologies, in particular of the gastrointestinal tract, in line with the values at the cut-off point of Figure 3.
The diagnoses of the remaining patients changed to different degrees of severity (Figure 4). In one case (F, 18, daughter of sibling 8, Table 1), there was a rapid evolution towards tumors (initial filloid tumor at the mammary parenchyma; cellular pleomorphism, sarcoma), which required a bilateral mastectomy on 2017.
Fatal epilogue had the condition of the young woman who initially suffered from asthenia and favism, and, in the earliest years of investigation, developed a gastric adenocarcinoma with very rapid worsening which led to her death in three months. The rapid evolution of the tumor and her great weakness did not allow surgery (Figure 4).
In general, the altered PAR-PARP values corresponded to a pathological severity of the subjects initially declared healthy, of varying degrees up to the tumor forms, with an even lethal outcome (Figure 3).
The results of Figure 3, in many cases, preceeded the evidence of worsening of the pathologies diagnosed with endoscopies

2.3.3. Lipidomic Analysis

n6 and n3 PUFA profiles of most subjects showed inflammatory conditions, despite all young people declared to be healthy (Tables 4 and S5). With some exceptions (3M, 6F, 8F, 8M, 9F age 23), n6/n3 ratios of all samples were altered at different levels, but always indicating either an increase of pro-inflammatory n6 mediators (arachidonic acid) ora deficit of anti-inflammatory n3 compounds (EPA, DHA). The follow up on 2009 (profiles not shown), confirmed this trend. It is worth noting the very high n6/n3 unbalance measured for the subject 9 F (age 27) (Table 4), the woman who developed a gastric carcinoma and deceased at the end of 2009.

2.4. Statistcal Analysis of Results

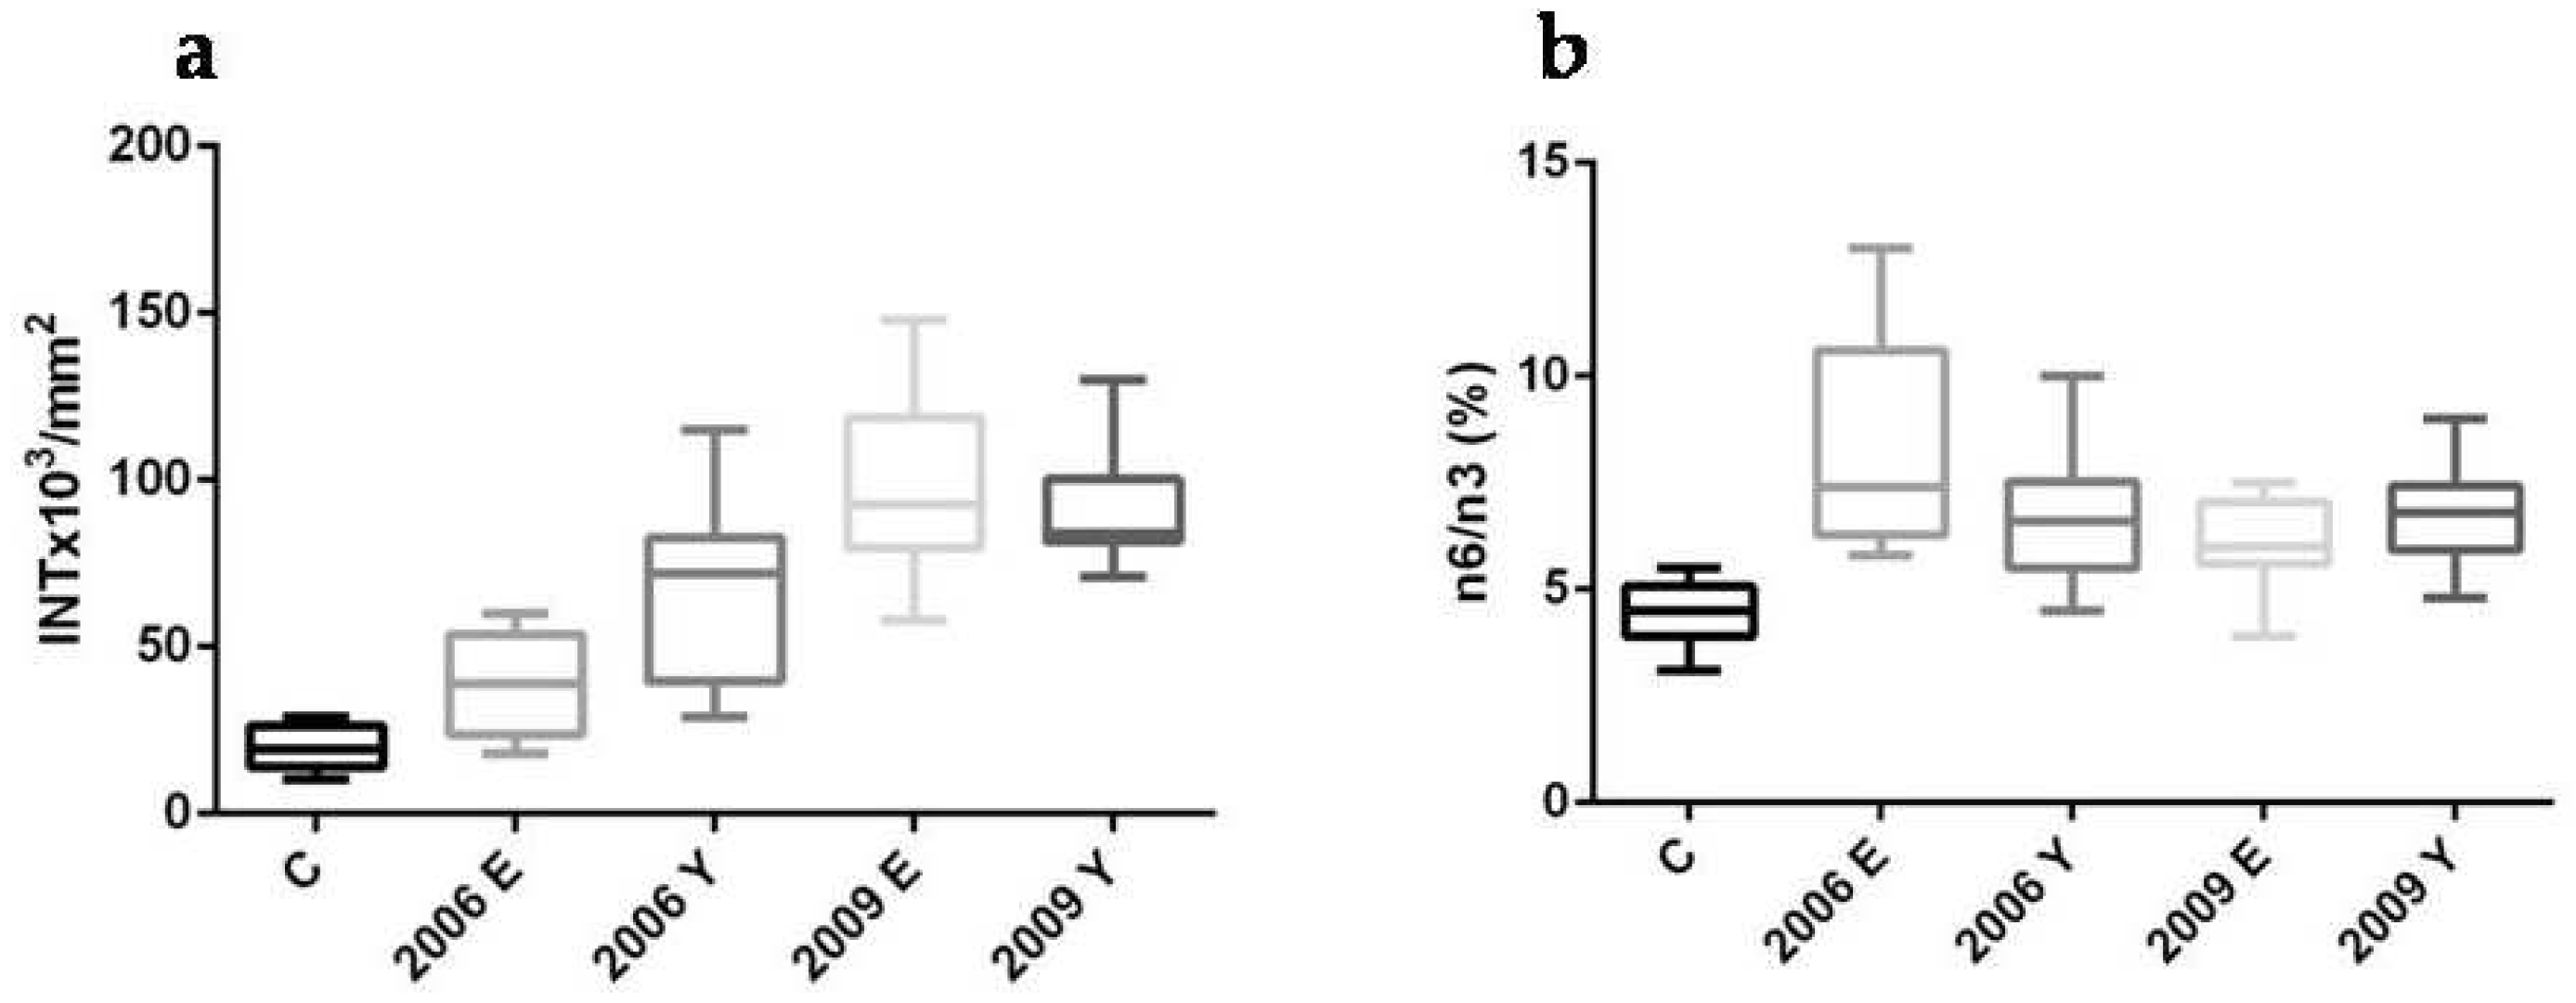
The results were analyzed with the boxplot method. Three groups were initially identified, a control group (C, healthy subjects); the elderly family members as group already affected by GI pathologies on 2006 (2006E); the offspring, i.e., the youngest people, who were healthy at time of the first analyses (2006Y)
Figure 5 shows both range and area for pathological (2006E) and healthy (2006Y) family groups compared with the control group (C).
In either PAR-PARP (panel a) or n6/n3 ratios (panel b) both 2006E and 2006Y cover an area largely above that of controls, even if none of the young members declared pathologies. The boxes support the trend shown in the histograms of previous figures: the two analyses can be useful not only to monitor the ongoing of diseases (2006E) but also to be predictive of pathologies not yet revealed with clincal and imaging tests. The box plots corresponding to the second analysis (2009) showed a worsening of the conditions for both elderly and young people. In the latter case it corresponded to a change of this group from healthy to almost all pathological subjects.

3. Discussion

This study raised from the knowledge that the hyper-modification of PARP (PAR-PARP), known as a sensor of lesions on DNA, and Fat Profile are direct measures of the degree of damage of the nucleic acid and of altered erythrocyte membrane lipid composition, respectively. Both molecular analyses can reflect the pathophysiological state of the cell, being used separately in the last decade by several authors [26,28,29]. Much evidence available in the literature suggests that an increase in oxidative stress and genomic instability may be monitored as early signs of prevention, although these molecular aspects have rarely been examined in epidemiological and clinical contexts [28,30].
This survey had the features of an epidemiological cohort study, with the members of the same family at a high risk of developing GI diseases, differently serious. Variable features of the cohort were their age and pathophysiological condition (affected and not affected by pathologies). The long duration of the study and the possibility of monitoring over time the subjects offered the possibility of evaluating the effectiveness of molecular analyzes in defining the individual’s pathophysiological state, their predictive potential and the usefulness in giving support to clinical and endoscopic diagnoses. The two molecular tests represent the experimental part of the investigation. Moreover, the investigation developed also as a case / control study for the need to consider a reference group (controls), whose results of the molecular analyzes fell within a physiological range. Box plot analysis allowed to highlight the epidemiological cohort feature of this study.
The interest to examine the family model and their diseases provides evidence that the two noninvasive analyses can be alerting signals before any morphological tissue alteration could be evidenced. The present work was aimed establishing whether the two molecular analyses could help monitoring the progression of the pathological state of the cell, in the family members at high risk of cancer. Their diagnostic relevance in a wide range of diseases had been confirmed in previous papers [27,28]), as we got evidence that the parallel and synergic involvement of two crucial cell compartments, nucleus and membrane, allowed to build up an integrated panel for evaluating cell molecular health. The present work supported the hypothesis that these two tests can be used as noninvasive and easy tools, to monitor over time family members whose cell status evolved from physiological even to cancerous one.
More over the opportunity of a case study over a long period, in particular of a whole family, is not frequent. Monitoring the family covered more than 10 years and allowed to follow the evolution of GI pathologies up to cancer where it occurred, in elderly and young members.
Given the role of PARP as a biomarker of DNA damage in pre-apoptotic and apoptotic events, and its recognized importance as a signal of oxidative stress, it is conceivable that its activity / expression levels in the nucleus may help to define the pathophysiological state of the cell, offering a range of opportunities for therapeutic intervention in both cancer and other pathological states [28,29,30,31,32].On the other side the asset of FAs determined by FAT PROFILE allows to determine the level of their unbalance and define any inflammatory condition in occurring diseases as signal of altered membrane functionality.
The case of the family examined in this work represents a particularly interesting experimental model and allowed to confirm both analyses as effective markers of altered cell state, able to evidence at least inflammation, even before endoscopies. In fact, endoscopies did not allow a diagnosis of serious pathology before morphological alterations of the tissue occurred. Hence the need to study whether any molecular marker could allow an earlier diagnosis, before tissue degeneration occurred.
Despite the careful endoscopic surveillance of all members of the family, sufficiently early diagnoses of tumor evolution of pathologies, sometimes fatal, could not be formulated. In some of the cases examined, the initial symptomatology, especially for the digestive system, could constitute a pre-alarm, but in other subjects, especially younger ones, with a diagnostic-clinical picture apparently in the norm, there were no elements that aroused any suspect.
Even the genetic analyzes carried out on the members considered most at risk, did not allow to identify hereditary factors, which, however, cannot be excluded when the inevitable fate of many members of this family has been observed. In this regard, in genetic reports it is stated that gene analysis is not conclusive, and that the risk of the family members cannot be determined only through this type of test. The analysts reccommended a careful surveillance of the digestive system, in particular, frequent endoscopic investigations and biopsies aimed at identifying initial lesions. To date, these methods have not proved to be sufficient for a predictive diagnosis (endoscopy) or are particularly invasive (biopsies).
On the contrary, already the first molecular analysis of PAR-PARP gave indications of increase in DNA damage (from moderate to high), with values higher than the cut-off, for individuals who would have gone through the most serious degenerative forms, results confirmed with the second analysis of PAR-PARP levels and FAT PROFILE. We highlight that both analyzes are noninvasive being performed on peripheral blood samples and can be used for monitoring subjects more often than genetic and endoscopic tests. Peripheral lymphocytes and mature erythrocytes are cells circulating all over the body and are sensible to its general state. Infact they are frequently used instead of affected tissues as mirror of the cell physio-pathological state.
These biomarkers proved to be particularly sensitive both in the phase in which the morphological alterations were not yet defined with endoscopy, but also for the follow-up of the subjects in the progression of the pathologies. Even in the case of sister 7 subjected to gastrectomy and subsequent therapies, the molecular analysis gave an indication of the remission phase, with PAR-PARP levels returned to the physiological range (Table 1), to increase again in the second analysis, predicting the colon carcinoma diagnosed thereafter. Similarly, in the case of the clinically healthy young woman (Table 3), the first analysis gave very high DNA damage results, and high pro-inflammatory condition confirmed with the second FAT Profile, on 2009, and with the subsequent diagnosis of gastric adenocarcinoma, with a final fatal result.
From the above observations and in light of previous investigations, the importance of these analyses as biomarker is confirmed, being both able to discriminate between physiological and pathological conditions.
With a view to the implementation of personalized medicine, this molecular investigation offers non-invasive and easily reproducible characteristics particularly useful for defining prevention and screening strategies for patients, for example, suffering from cancer.

4. Materials and Methods

4.1. Patients

The patients object of this survey belonged to the same family (the oldest were 9 people, all siblings; the youngest, their descendants), monitored from May 2006 to December 2017. They all signed an informed consent for anonimous treatment of their data, according to the rules about privacy. Authorization (N°131/11) for this survey was obtained from the ethics Committee “C. Romano” for biomedical activities. Each of the nine siblings was identified with a number, ordered from the oldest to the youngest subject. The descendants were identified with a capital letter (M, male; F, female) followed by the number corresponding to the parent (one of the siblings), in brackets. All subjects were periodically invited to the Diagnostic Laboratory “Filippo Bottazzi” of Azienda Sanitaria Locale 5 (ASL NA5, nowadays renamed ASL NA3 sud, District 57), in Torre del Greco, a town in the sorrounding of Naples, Italy, for interview and blood collection by venepuncture. Over survey time, some patients refused to undergo molecular analyses again. Thus, only two complete sets of results were performed.
As a control group 30 anonimous volunteers were selected among habitual donors at the transfusional Center of the Hospital “Agostino Maresca” (ASL NA3, Torre del Greco); their blood samples were provided with results of routine clinical analyses. These subjects were defined “healthy” and suitable as blood donors as they did not suffer any serious disease and gave clinical results within the normal range of values. This group enclosed also those people giving responses to our specific analyses within values enclosed in normal ranges, but at upper limit.

4.2. Blood Collection and Treatment

Blood (15 ml) was collected by vene puncture in the presence of EDTA and aliquoted. Samples were stored at 4 °C until use. One aliquot (5 ml) was used to define the clinical state of each subject; the other aliquots (5ml) were used to prepare lymphocyte and erythrocyte fractions.
Routine clinical analyses (azotemia, cholesterolemia, glicemia, triglyceridemia, transaminases, hemochrome, serum proteins, etc.) were performed at “F. Bottazzi” laboratory, where lymphocyte fraction for PARP analysis was prepared within two hours from blood uptake, to avoid hemolysis. Erythrocyte fraction was prepared at Lipinutragen laboratory (Bologna, Italy) [27].

4.3. Lymphocyte Preparation and Lysis

All operations were performed at 4 °C. Three to five blood aliquots (1 ml) of each sample were separately used to prepare lymphocytes according to [27], after counting the cells per blood ml by hematic cell counter. In this way taking into account a comparable loss of lymphocytes during preparation under the same conditions for all samples, the results were referred to the initial number of cells/ml.
Lymphocytes were prepared according to GE Healthcare protocol,provided with Ficoll. Briefly each blood aliquot (1 ml) was layered on a Ficoll-Hypaque (GE Healthcare) cushion (1: 0.7, v/v) and centrifuged at 2,500 rpm for 10 minutes. Because of their lowerdensity, lymphocytes were found at the interface between theplasma and the Ficoll-Paque PLUS with other slowly sedimentingparticles (platelets and monocytes). The lymphocytes were recoveredfrom the interface and subjected to short washing steps to remove contaminatingplatelets, Ficoll-Paque PLUS and plasma. Crude lymphocyte fractionwas washed twice with 0.9% NaCl, followed by 10 min centrifugationat 1,500 rpm. Pelleted pure lymphocytes were suspended in 0.9%NaCl (100 μl/blood ml). Few microliters of the suspension were usedfor counting pure lymphocytes. In general a 20% loss was measured.
Pure lymphocytes were often used as freshly prepared fraction or stored at – 80 °C until used.
Cells from 1 ml blood were lysed by suspension in lysis buffer (300 μl; 10mM Tris-HCl pH 7.5, 1%Nonidet P40, 2mM Spermidine-HCl, 10mM Na2EDTA, protease inhibitor cocktail (2μg/ml; Sigma, Milan), 1mM Phenyl Methyl SulphonylFluoride, PMSF), and incubated for 30 minutes at 4 °C. The whole lysate was further analysed.
Protein content was determined by Bradford’s reagent (BioRad) according to the provided instructions. DNA damage in some samples was assayed by Comet assay procedure [35].

4.4. SDS-PAGE and Western Blotting

Lymphocyte fraction (20µg protein) was analyzed on 12% polyacrylamide slab gel in the presence of 0.1% SDS according to [27].Gels were stained in 0.1% Coomassie G in 10% acetic acid/ 30% methanol. For immunoblotting electrophoresed proteins were transferred onto polyvinylidene fluoride (PVDF) membrane (Biorad) at 200 V for 1.5 h at 4°C in the same buffer used for electophoretic run.For immunoblot experiments procedures and buffers were according to [27] and references therein. PVDF sheets were treated for 1.5 h with blocking solution (50mM Tris-HCl buffer, pH 8.0; 150mM NaCl; 0.5% (v/v)Tween 20 and 3% gelatine). Incubation with commercial polyclonal anti-PARP 1 (Santa Cruz Biotechnology, Heidelberg, Germany), was performed for 2 h at room temperature in the same solution supplemented with 0.3% gelatine.The filter was washed several times with TBS-Tween and antibody binding was detected by using anti-mouse IgG (H+L) horseradish peroxidase (1:1000, v/v). The reaction was revealed by using a kit for chemiluminescence (Super signal West Dura, Extended Substrate, Pierce Manufacturing Inc. US) and reading by a Quantitaty One program in a Chemidoc apparatus (Bio-Rad, Segrate, Milan, Italy). The procedure to measure the densitometric values was the following. Considering that PAR-PARP band above PARP-1 may be spread because of the presence of ADPR polymers of different lengths, the density of PAR-PARP bands measured in the area comprised between the shortest polymers (>5 ADP-ribose units) to the longest ones, at the top of the filter, indicates PAR-PARP levels that can be quantified by densitometry.
Thus to measure the densitometric values a rectangle was drawn encircling the band to be quantified. The area of the rectangle was taken with the broadest immune band and was always constant. Therefore the variable parameter was the intensity of the band in the rectangle. A background value was automatically subtracted by QuantityOne program software. A second manual blank was measured by using the above described rectangle on a zone of the filter without bands. In addition, the results were normalized by performing densitometric measures of images with the same time of development (2 seconds) and chemiluminescent capture signals, as determined by preliminary analyses. In this way the results could be easily compared for all experiments.

4.5. Erythrocyte Membrane Fatty Acid Determination

An aliquot (1ml) of each blood sample was used for the fatty acid analysis of erythrocyte membrane performed by the procedure described in [27,36].
This procedure is effected by an automatism set up at Lipinutragen [33], a spin-off company of the National Council of Research (CNR) in Bologna (Italy), connected with the calculation ofthe membrane unbalance index. The membrane fatty acid cluster used in the analysis is made of ten cis-fatty acids and two trans fatty acids [36]. This analysis is commercialized as FAT PROFILE®. Fat Profile examines the molecular fatty acid asset, in particular the personal membrane lipidomic profile. The processing of the blood sample at the Lipidomic Laboratory of Lipinutragen, authorized by the Italian Health Authority, takes place by means of a high-performance system, i.e., the robotic unit that performs the blood sample work-up, with selection and chemical transformations of mature red blood cell membranes (reporter cell with an average life of 120 days). It renders the analysis repeatable and reliable, so that a large number of samples can be processed with high performance.

4.6. Statistics

Box plot analysis of data was performed using the GraphPad Prism program.

5. Conclusions

This work done in the peculiar context of a family with gastro-intestinal and cancer disease development points attention to two non-invasive blood tests checking specific molecular indicators in two cellular compartments, in particular concerning DNA protection and cell membrane balance given by the hydrophobic fatty acid residues. The DNA-membrane correspondence has been demonstrated recently in tumor-bearing mice using purine-5′,8-cyclonucleosides, as the DNA damage biomarker, together with lipidomic profiles [37], and is a promising multidisciplinary approach to cancer. PARP automodification and membrane fatty acid balance alteration checked in the family members along a time frame of more than 10 years evidenced the early response of these two indicators, with high PARP automodification and pro-inflammatory molecular profiles in apparently healthy individuals that later on developed cancer and had lethal events. Further work in large cohorts is needed, also in view of the application of anti-inflammatory and nutrition-based strategies to follow-up the individuated biomarkers. This work foresees the efficiency of the DNA-membrane investigation also as preventive strategy for re-establishing control of cellular damages.

Supplementary Materials

The following supporting information can be downloaded at the website of this paper posted on Preprints.org, Table S1: Altered Hematic Parameters of brothers, starting the survey in 2006;§S2.2.1: Densitometric analysis and methods of result evaluation; Figure S1: Scheme of PARP 1 and 2 immunoblotting; § S2.2.2: SDS-PAGE and immunoblotting of control lymphocyte extracts; Figure S2: Immunoblotting of control lymphocyte extracts; Figure S3: Immunoblotting of nine siblings’ lysates (analysis 2009); Figure S4: Immunoblotting profiles of the youngest people. Analyses on 2006 and 2009).§S2.3: Fat Profile; Table S3: Fat Profiles of the elderly members (2006); Table S4: Comparison of pro and anti inflammatory PUFAs unbalance (%) from Fat Profiles of the elderly members; Figure S4- Immunoblottings of the youngest people; Table S5. n6 and n3 PUFA patterns of offspring.

Author Contributions

conceptualization, C.F. and M.R.F.M..; methodology, C.F., E.C., A.D.M. and M.M; formal analysis, C.F., E.C., A.D.M. and M.M.; investigation, E.C.; formal analysis, ARB; resources, C.F., C.C. and M.R.F.M.; writing—original draft preparation, M.R.F.M..; writing—review and editing, C.F, M.R.F.M.and C.C..; supervision, C.F., C.C. and M.R.F.M; funding acquisition, M.R.F.M.

Funding

This work received the financial support of Regione Campania, Italy (Projects N° L5/2003 and 2007).

Acknowledgments

We wish to thank Dr Filippo Figalli, head of the transfusional Centre of the Hospital “A. Maresca” (Torre del Greco) for providing control samples. We are grateful to Dr Claudio Bufi, past head of the Laboratory “F.Bottazzi”, to members of the staff, Drs G. Di Bernardo, G. Di Giacomo and T. Sollo for technical support and use of the ASL laboratory, and to the nurse, Mrs Maria Cirillo for assistance in blood sampling.

Conflicts of Interest

CF and CC are co-founders of the company Lipinutragensrl which is involved in commercial use of the membrane lipidomic analysis. The other authors declare no conflict of interest.

References

  1. Holtmann, G.; Shah, A.; Morrison, M. Pathophysiology of Functional Gastrointestinal Disorders: A Holistic Overview. Dig Dis 2018, 35(1), 5–13. [Google Scholar] [CrossRef]
  2. Frank, T.S. Hereditary Cancer Syndromes. Arch Pathol Lab Med 2001, 125, 85–90. [Google Scholar] [CrossRef]
  3. Stadler, Z.K.; Schrader, K.A.; Vijai, J.; Robson, M.E.; Offit, K. Cancer Genomics and Inherited Risk. J Clin Onc 2014, 32, 687–698. [Google Scholar] [CrossRef] [PubMed]
  4. Chintalacheruvu, L.M.; Shaw, T.; Buddam, A.; Linch, H.T. Major hereditary gastrointestinal cancer syndromes: A narrative review. JGLD 2017, 26(2), 157–163. [Google Scholar] [CrossRef] [PubMed]
  5. Venkata, S.; Katabathina, C.; Menias, O.; Khanna, L.; Murphy, L.; Dasyam, A.K.; Lubner, M.G.; Prasad, S.R. Hereditary Gastrointestinal Cancer Syndromes: Role of Imaging in Screening, Diagnosis, and Management. RadioGraph 2019, 39, 5. [Google Scholar] [CrossRef]
  6. Yousefi, M.S.; Sharifi-Esfahani, M.; Pourgholam-Amiji, N.; Afshar, M.; Sadeghi-Gandomani, H.; Otroshi, O.; Salehiniya, H. Esophageal cancer in the world: incidence, mortality and risk factors. Biom Res Ther 2018, 5(7), 2504–2517. [Google Scholar] [CrossRef]
  7. Polk, D.B.; *Peek, R.M. Helicobacter pylori: gastric cancer and beyond. Nat Rev Cancer. 2010, 10(6), 403–414. [Google Scholar] [CrossRef]
  8. Díaz,P.;Valenzuela Valderrama, M.; Bravo, J.; Quest, A.F.G.Helicobacter pylori and Gastric Cancer: Adaptive Cellular Mechanisms Involved in Disease Progression. Front. Microbiol 2018. [CrossRef]
  9. Romeo, S.;Debiec-Rychter, M.; Van Glabbeke, M.; Van Paassen, H.;Comite, P.; Van Eijk, R.; Oosting, J.; Verweij, J.; Terrier, P.; Schneider, U.;Sciot, R.; Blay J.Y.;Hogendoorn,P.C.W. Cell Cycle/Apoptosis Molecule Expression Correlates with ImatinibResponse in Patients with Advanced GastrointestinalStromal Tumors. Clin Cancer Res2009, 15(12). [CrossRef]
  10. Chaitanya, G.V.; Alexander, J.S.; Prakash Babu, P. PARP-1 cleavage fragments: signatures of cell-death proteases in neurodegeneration. Cell Commun Signal 2010, 8, 31. [Google Scholar] [CrossRef]
  11. Eleazer R; Fondufe-Mittendorf YN. The multifaceted role of PARP1 in RNA biogenesis. Wiley Interdiscip Rev RNA. 2021, 12(2), e1617. [CrossRef]
  12. Hottiger, M.O.Nuclear ADP-Ribosylation and Its Role in Chromatin Plasticity, Cell Differentiation, and Epigenetics. Ann Rev Biochem2015,84,227-263. [CrossRef]
  13. Rodríguez-Vargas, J.M.; Oliver-Pozo, J.O.; Dantzer, F. PARP1 and Poly(ADP-ribosyl)ation Signaling during Autophagy in Response to Nutrient Deprivation. Oxid Med Cell Longev 2019, Article ID 2641712. [Google Scholar] [CrossRef]
  14. Lin, K.Y.; Huang, D.; Kraus, W.L. Generating Protein-Linked and Protein-Free Mono-, Oligo-, and Poly(ADP-Ribose) In Vitro. Meth Mol Biol.2018, 1813:91-108. [CrossRef]
  15. Bonicalzi, M.E.; Vodenicharov, M.; Coulombe, M.; Gagné, J.P.; Poirier., G.G. Alteration of poly(ADP-ribose) glycohydrolase nucleocytoplasmicshuttling characteristics upon cleavage by apoptotic proteases. Biol Cell 2003, 95, 635–644. [Google Scholar] [CrossRef]
  16. Pedrioli, D.M.L.; Leutert, M.; Bilan, V.; Nowak, K.; Gunasekera, K.; Ferrari, E.; Imhof, R.; Malmström, L.; Hottiger, M.O. Comprehensive ADP-ribosylome analysis identifies tyrosine as an ADP-ribose acceptor site. EMBO Rep 2018, 19, e45310. [Google Scholar] [CrossRef] [PubMed]
  17. Bai, P.; Cantò, C. The Role of PARP-1 and PARP-2 Enzymes in Metabolic Regulation and Disease. Cell Metab 2012, 16(3), 290–295. [Google Scholar] [CrossRef]
  18. Conrad, L.B.; Lin, K.Y.; Nandu, T.; Gibson, B.A.; Lea, J.S.; Kraus, W.L. ADP-ribosylation Levels and Patterns Correlate with Gene Expression and Clinical Outcomes in Ovarian Cancers. Mol Cancer Ther 2019, pii: molcanther.0569.2019. [Google Scholar] [CrossRef]
  19. Masi, A.; Sabbia, A.; Ferreri, C.; Manoli, F.; Lai, Y.; Laverde, E.; Liu, Y.; Krokidis, M.G.; Chatgilialoglu, C.; Faraone Mennella, M.R. Diastereomeric Recognition of 5’,8-cyclo-2’-Deoxyadenosine Lesions by Human Poly (ADP-ribose) Polymerase 1 in a Biomimetic Model. Cells 2019, 8, 116. [Google Scholar] [CrossRef]
  20. Smilowitz, J.T.; Zivkovic, A.M.; Wan, Y.J.; Watkins, S.M.; Nording, M.L.; Hammock, B.D.; German, J.B. Nutritionallipidomics:molecular metabolism,analytics, anddiagnostics. MolNutr Food Res 2013, 57, 1319–1335. [Google Scholar] [CrossRef]
  21. Wang, X.; Lin, H.; Gu, Y. Multiple roles of dihomo-ɣ-linolenic acid in proliferation diseases. Lipids Health Dis2012, 11, 25 http://www.lipidworld.com/content/11/1/25. [CrossRef]
  22. Chatgilialoglu, C.; Ferreri, C: Nutrilipidomics: A Tool for PersonalizedHealth. J. GlycomLipidom 2012, 2, e109(2012). [CrossRef]
  23. Calder, P.C. Polyunsaturated fatty acids and inflammatory processes: New twists in an old tale. Biochimie 2009, 91, 791–795. [Google Scholar] [CrossRef] [PubMed]
  24. Kiss, B.; Szántó, M.; Szklenár, M.; Brunyánszki, A.; Marosvölgyi, T.; Sárosi, E.; Remenyik, E.; Gergely, P.; Virág, L.; Decsi, T.; Rühl, R.; Bai, P. Poly(ADP-ribose) polymerase-1 ablation alters eicosanoid and docosanoid signaling and metabolism in a murine model of contact hypersensitivity. Mol Med Rep 2015, 11(4), 2861–2867. [Google Scholar] [CrossRef]
  25. Sutcu HH; Matta E; Ishchenko AA. Role of PARP-catalyzed ADP-ribosylation in the Crosstalk Between DNA Strand Breaks and Epigenetic Regulation. J Mol Biol. 2020, 432(6), 1769-1791. [CrossRef]
  26. Sansone, A.; Tolika, E.; Louka, M.;.; Sunda, V.; Deplano, S.; Melchiorre, M.; Anagnostopoulos, D.; Chatgilialoglu, C.; Formisano, C.; Di Micco, R.; Faraone Mennella, M.R.; Ferreri, C. Hexadecenoic Fatty Acid Isomers in Human Blood Lipids and Their Relevance for the Interpretation of Lipidomic Profiles. PLOS One2016, 11(4), e0152378. [CrossRef]
  27. Imperato, S:;Mistretta, C.; Marone, M; Migliaccio, I.;Pulcinelli, I.; Faraone Mennella, M.R.Automodified Poly(ADP-Ribose) Polymerase Analysisto Monitor DNA Damagein Peripheral Lymphocytes of Floriculturists Occupationally Exposed to Pesticides. Cells2019,8(2), 137. [CrossRef]
  28. Giansanti, V.; Donà, F.; Tillhon, M.; Scovassi, A.I. PARP inhibitors: new tools to protect from inflammation. BiochemPharmacol 2010, 80(12), 1869–1877. [Google Scholar] [CrossRef]
  29. Adaikalakoteswari, A.; Rema, M.; Mohan, V.; Balasubramanyam, M. Oxidative DNA damage and augmentation of poly(ADP-ribose)polymerase/nuclear factor-kappa B signaling in patients with type 2 diabetes and microangiopathy. Int J Biochem Cell Biol 2007, 39(9), 1673–1684. [Google Scholar] [CrossRef]
  30. Morales, J.C.; Li, L.; Fattah, F.J.; Dong, Y.; Bey, E.A.; Patel, M.; Gao, J.B. Review of Poly (ADP-ribose) Polymerase (PARP) Mechanisms of Action and Rationale for Targeting in Cancer and Other Diseases. Crit Rev Eukaryot Gene Expr 2014, 24(1), 15–28. [Google Scholar] [CrossRef] [PubMed]
  31. D’Onofrio, G.; Tramontano, F.; Dorio, A.S.; Muzi, A.; Maselli, V.; Fulgione, D.; Graziani, G; Malanga, M.; Quesada, P. Poly (ADP-ribose) polymerase signaling of topoisomerase 1-dependent DNA damage in carcinoma cells.Biochem. Pharmacol.2011, 81, 194-202. [CrossRef]
  32. Pazzaglia, S.; Pioli, C. Multifaceted Role of PARP-1 in DNA Repair and Inflammation: Pathological and Therapeutic Implications in Cancer and Non-Cancer Diseases. Cells 2019, 9(1), 41. [Google Scholar] [CrossRef] [PubMed]
  33. Pang, J.; Cui, J.; Xi, C.; Shen, T.; Gong, H.; Dou, L.; Lin, Y.; Zhang, T. Inhibition of Poly(ADP-Ribose) Polymerase Increased Lipid Accumulation Through SREBP1 Modulation. Cell Physiol Biochem. 2018, 49(2), 645–652. [Google Scholar] [CrossRef]
  34. Szántó M.; Gupte R.; Kraus WL.; Pacher P.; Bai P. PARPs in lipid metabolism and related diseases. Prog Lipid Res. 2021 84:101117. [CrossRef]
  35. Clementi E;Garajova Z, Markkanen E. Measuring DNA Damage Using the Alkaline Comet Assay in Cultured Cells. Bio Protoc. , 11(16), :e4119. [CrossRef]
  36. Ferreri, C.; Masi, A.; Sansone, A.; Giacometti, G.; Larocca, A.V.; Menounou, G.; Scanferlato, R.; Tortorella, S.; Rota, D.; Conti, M.; Deplano, S.; Louka, M.; Maranini, A.R.; Salati, A.; Sunda, V.; Chatgilialoglu, C. Fatty acids in membranes as homeostatic, metabolic and nutritional biomarkers: recent advancements in analytics and diagnostics. Diagnostics2017,7(1). [CrossRef]
  37. Krokidis, M.G.; Louka, M.; Efthimiadou, E.K.; Zervou, S.K.; Papadopoulos, K.; Hiskia, A.; Ferreri, C.; Chatgilialoglu, C. Membrane Lipidome Reorganization and Accumulation of Tissue DNA Lesions in Tumor-Bearing Mice: An Exploratory Study. Cancers 2019, 11, 480. [Google Scholar] [CrossRef]
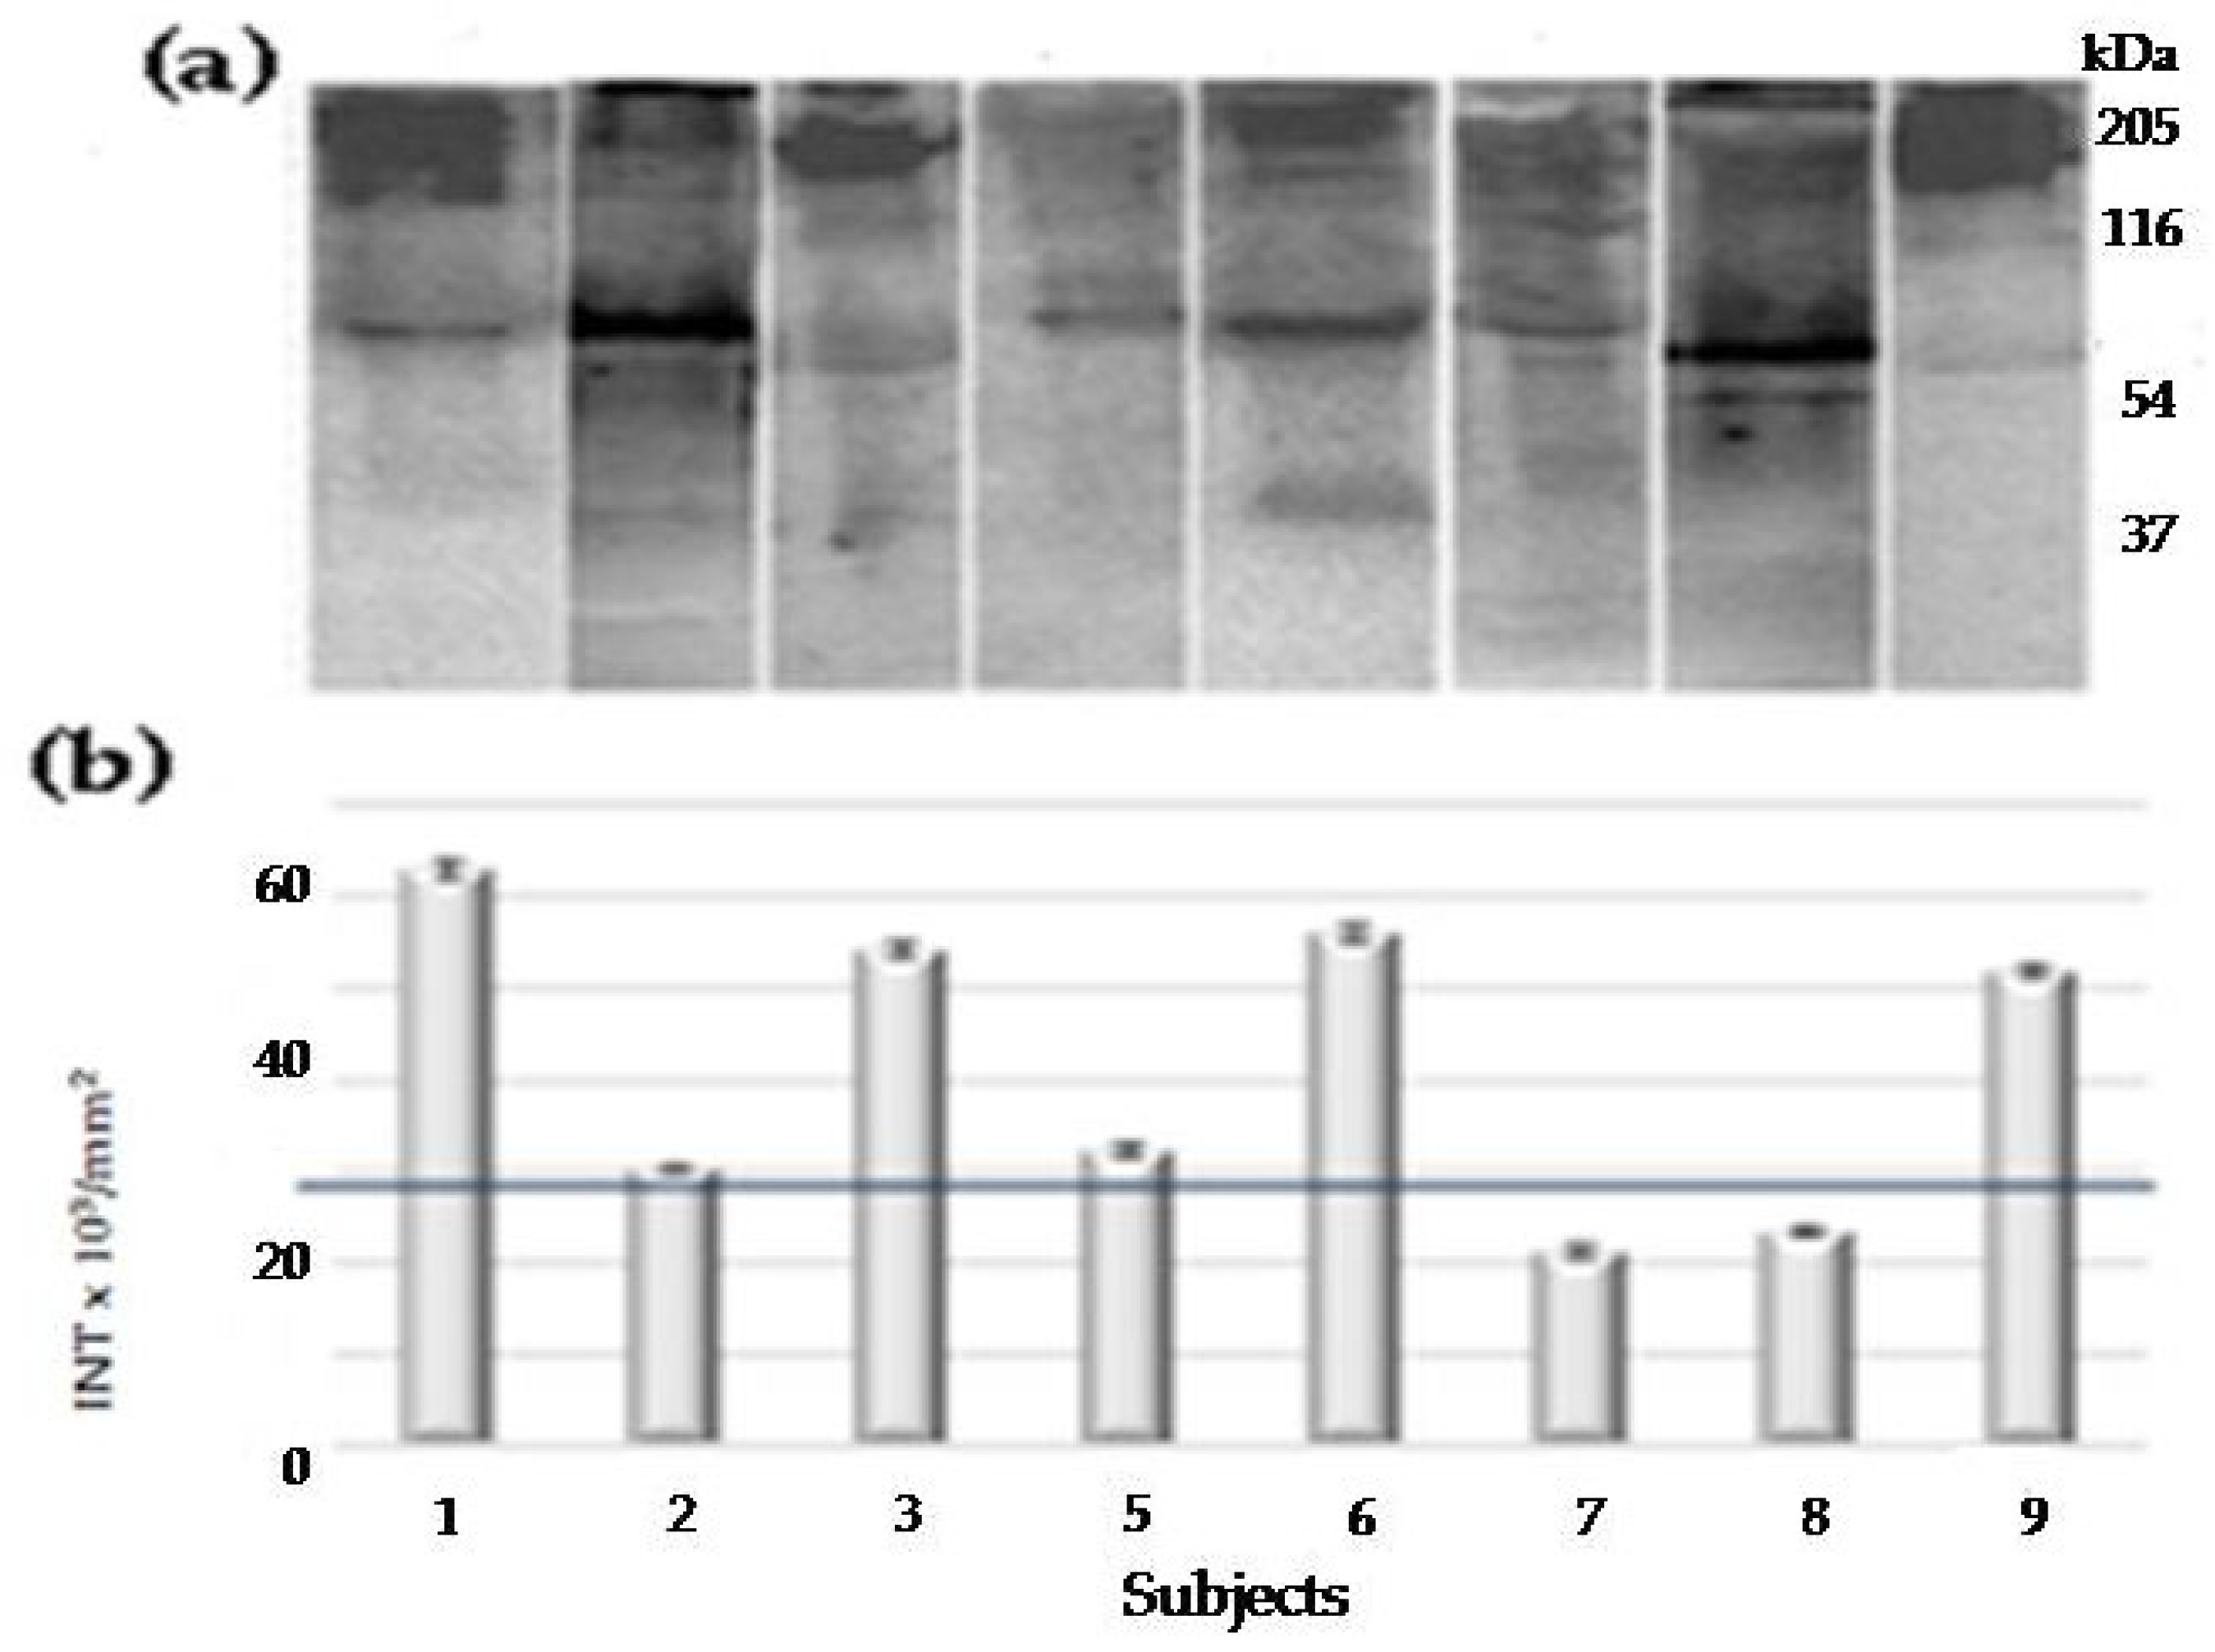
Figure 1. (a) Anti-PARP Immunopatterns of siblings’ lymphocyte lysates, on 2006. (b) Densitometries of PAR-PARP of samples in panel (a). The numbers correspond to siblings of Table 1. The black line is the control cut-off (§ 2.2.2S, Figure 2S). The reported values were the mean of three different measures. Ranges of PAR-PARP variability corresponding to different levels of DNA damage are reported in § S 2.2.1.
Preprints 98758 g001
Figure 2. Comparison of PAR-PARP analysis of siblings’ lymphocyte lysates starting the survey (2006, white) and on 2009 (grey). The numbers correspond to subjects of Table 1. The black line is the control cut-off. Ranges of PAR-PARP variability corresponding to different levels of DNA damage are reported in §S2.2.1 (Supplementary Material). Immunoblotting patterns and densitometric values are in Figure S3.
Preprints 98758 g002
Figure 3. Densitometric analyses of PAR-PARP levels in family’s young members, on 2006 (grey) and on 2009 (black). The numbers in brackets correspond to siblings in Table 1, parents of young people. M, male; F, female: sons and daughters examined, respectively. Age refers to siblings as shown in Figure 4. The line corresponds to the cut-off value. Immunoblottings and densitometric values are in Figure S4.
Preprints 98758 g003
Figure 4. Scheme of development of young people’s pathologies from 2006. The numbers in brackets correspond to siblings in Table 1, their parents. M, male; F, female. Further details of subjects are in the legend of Figure 3.
Preprints 98758 g004
Figure 5. Box plot analysis of PAR-PARP (a) and n6/n3 ratios (b) of all samples. C, controls; E, elderly members, and Y, the youngest people, analysed on 2006 and 2009.
Preprints 98758 g005
Table 1. Main Anamnestic Data of siblings, starting the survey on 2006.
Sibling
1
Age/
gender
Job GE Desease/ Surgery Other Deseases/
Surgery
H. pylori
1 69, F Postal Clerk None Cholecystectomy Hypertension No
2 66, M Unemployed Diverticulosis, rectal/ sigmoidal polyposis, hiatal hernia Meningitis No
3 63, F Postal Clerk Diverticulitis, rectal/ sigmoidal polyposis None No
4 59, M Postal Clerk Diverticulitis Hypertension, adrenal adenoma, Hypercholesterolemia, epindemoma with lateral hematoma Not available
5 60, F Farmer None Hypertension, Hypercholesterolemia No
6 58, F Housekeeper Diverticulitis Surgery at the Botallo duct No
7 50, F Dealer Hemorrhoidal Thrombophlebitis, Gastrectomy Hypercholesterolemia No
8 52, M Railroader Esophagitis, hiatal hernia Cholecystectomy, Carotid plaques No
9 54, F Railroader Diverticulitis, Intestinal adhesions None No
1Parents deceased by: ischemic stroke (mother); acute myocardial infarction (father); M, male; F, female.
Table 2. Pro and anti inflammatory PUFAs unbalance (%) from Fat Profiles of the elderly members (year 2009).
Sibling FATTY ACID n6/n32
Linoleic ac. DGLA ARA EPA DHA
1 0 -5.3 +18 0 0 5.5
2 0 +12.5 +19.4 -20 0 6.0
3 0 0 +4.7 -20 -6 6.6
5 0 -5.26 +9.4 -20 -16 7.5
6 0 0 +5.9 -20 -18 7.2
7 0 -15.8 +0.59 0 -2 5.9
8 -11 0 +16.5 0 +4.3 3.9
9 0 -10.5 +3.5 -20 -4 6.0
Abbreviations: ARA, arachidonic acid (5,8,11,14-eicosatetraenoic acid); DGLA, Dihomo-gamma-linolenic acid (8,11,14-eicosatrienoic acid);DHA, Docosahexaenoic acid; EPA, Eicosapentaenoicacid. 1The percentage of FA variation above (+) or below (-) the normal range. 2n6/n3 normal range: 3.5-5.5%.
Table 3. Follow up of clinical data of siblings.
Sibling N° Age/
gender
Follow-up GI
Disease/ Surgery
Follow-up
H. pylori
1 69, F Foveolar hyperplasia and intestinal metaplasia Positive
2 66, M Pancreatic head cancer and death within six months of being diagnosed with cancer Positive
3 63, F Gaster cancer with peritoneal carcinosis and ascites, followed by ovarian cancer and death in six months from the first diagnosis Not determined
5 60, F Gastric mucosa dysplasia Positive
6 58, F Breast cancer followed by colon cancer Positive
7 50, F Sigma resection followed by colon carcinoma Not determined
8 52, M No further disease Positive
9 54, F Gastrectomy Negative
Table 4. n6/n3 Ratios of red cell membrane from offspring (2006).
Parent1 Child 2 (Age) n6/n3
(%)3
1 M (38) 6.7 (+22.2)
1 F (41) 5.7 (+3.9)
3 M (36) 4.5 (0)
3 F (38) 7.6 (+38)
4 M (37) 8.3 (+50)
4 F (34) 6.5 (+18.3)
5 F (36) 7.0 (+24.7)
5 F (34) 7.35 (+33.6)
6 M (38) 10 (+83)
6 F (42) 5.5 (0)
7 M (39) 6.2 (+13.3)
7 M (37) 6.8 (+23.3)
8 M (21) 5.5 (0)
8 F (18) 5.45 (0)
9 F (23) 5.2 (0)
9 F (27) 8.6 (+56.8)
1Siblings in Table 1.2 Labeling of children is according to Figure 3 and Figure 4. 3In brackets, unbalance %.
Disclaimer/Publisher’s Note: The statements, opinions and data contained in all publications are solely those of the individual author(s) and contributor(s) and not of MDPI and/or the editor(s). MDPI and/or the editor(s) disclaim responsibility for any injury to people or property resulting from any ideas, methods, instructions or products referred to in the content.
Copyright: This open access article is published under a Creative Commons CC BY 4.0 license, which permit the free download, distribution, and reuse, provided that the author and preprint are cited in any reuse.
Prerpints.org logo

Preprints.org is a free preprint server supported by MDPI in Basel, Switzerland.

Subscribe

© 2024 MDPI (Basel, Switzerland) unless otherwise stated