1. Introduction
Climate change contributes to natural hazards and extreme weather: accelerated sea level rise, storm surge, land subsidence and tectonic movement [
1,
2,
3,
4]. This complicates further especially in low laying, coastal urban areas with rapid and unconscious socio-economic development via urbanisation, agglomeration, population growth which increase demand for space and resources (e.g. excessive groundwater extraction, minerals, oil, gas, coal mining), surface development load, water demand and carbon emissions [
4,
5,
6]. Taking land subsidence as a silent killer and underrated issue in coastal megacity, the cause-effects are diverse from the excessive groundwater extraction, mining, natural subsidence: tectonic movements to urbanisation induced subsidence such as population growth; surface development load and currently, dangerous or unconscious UUS development [
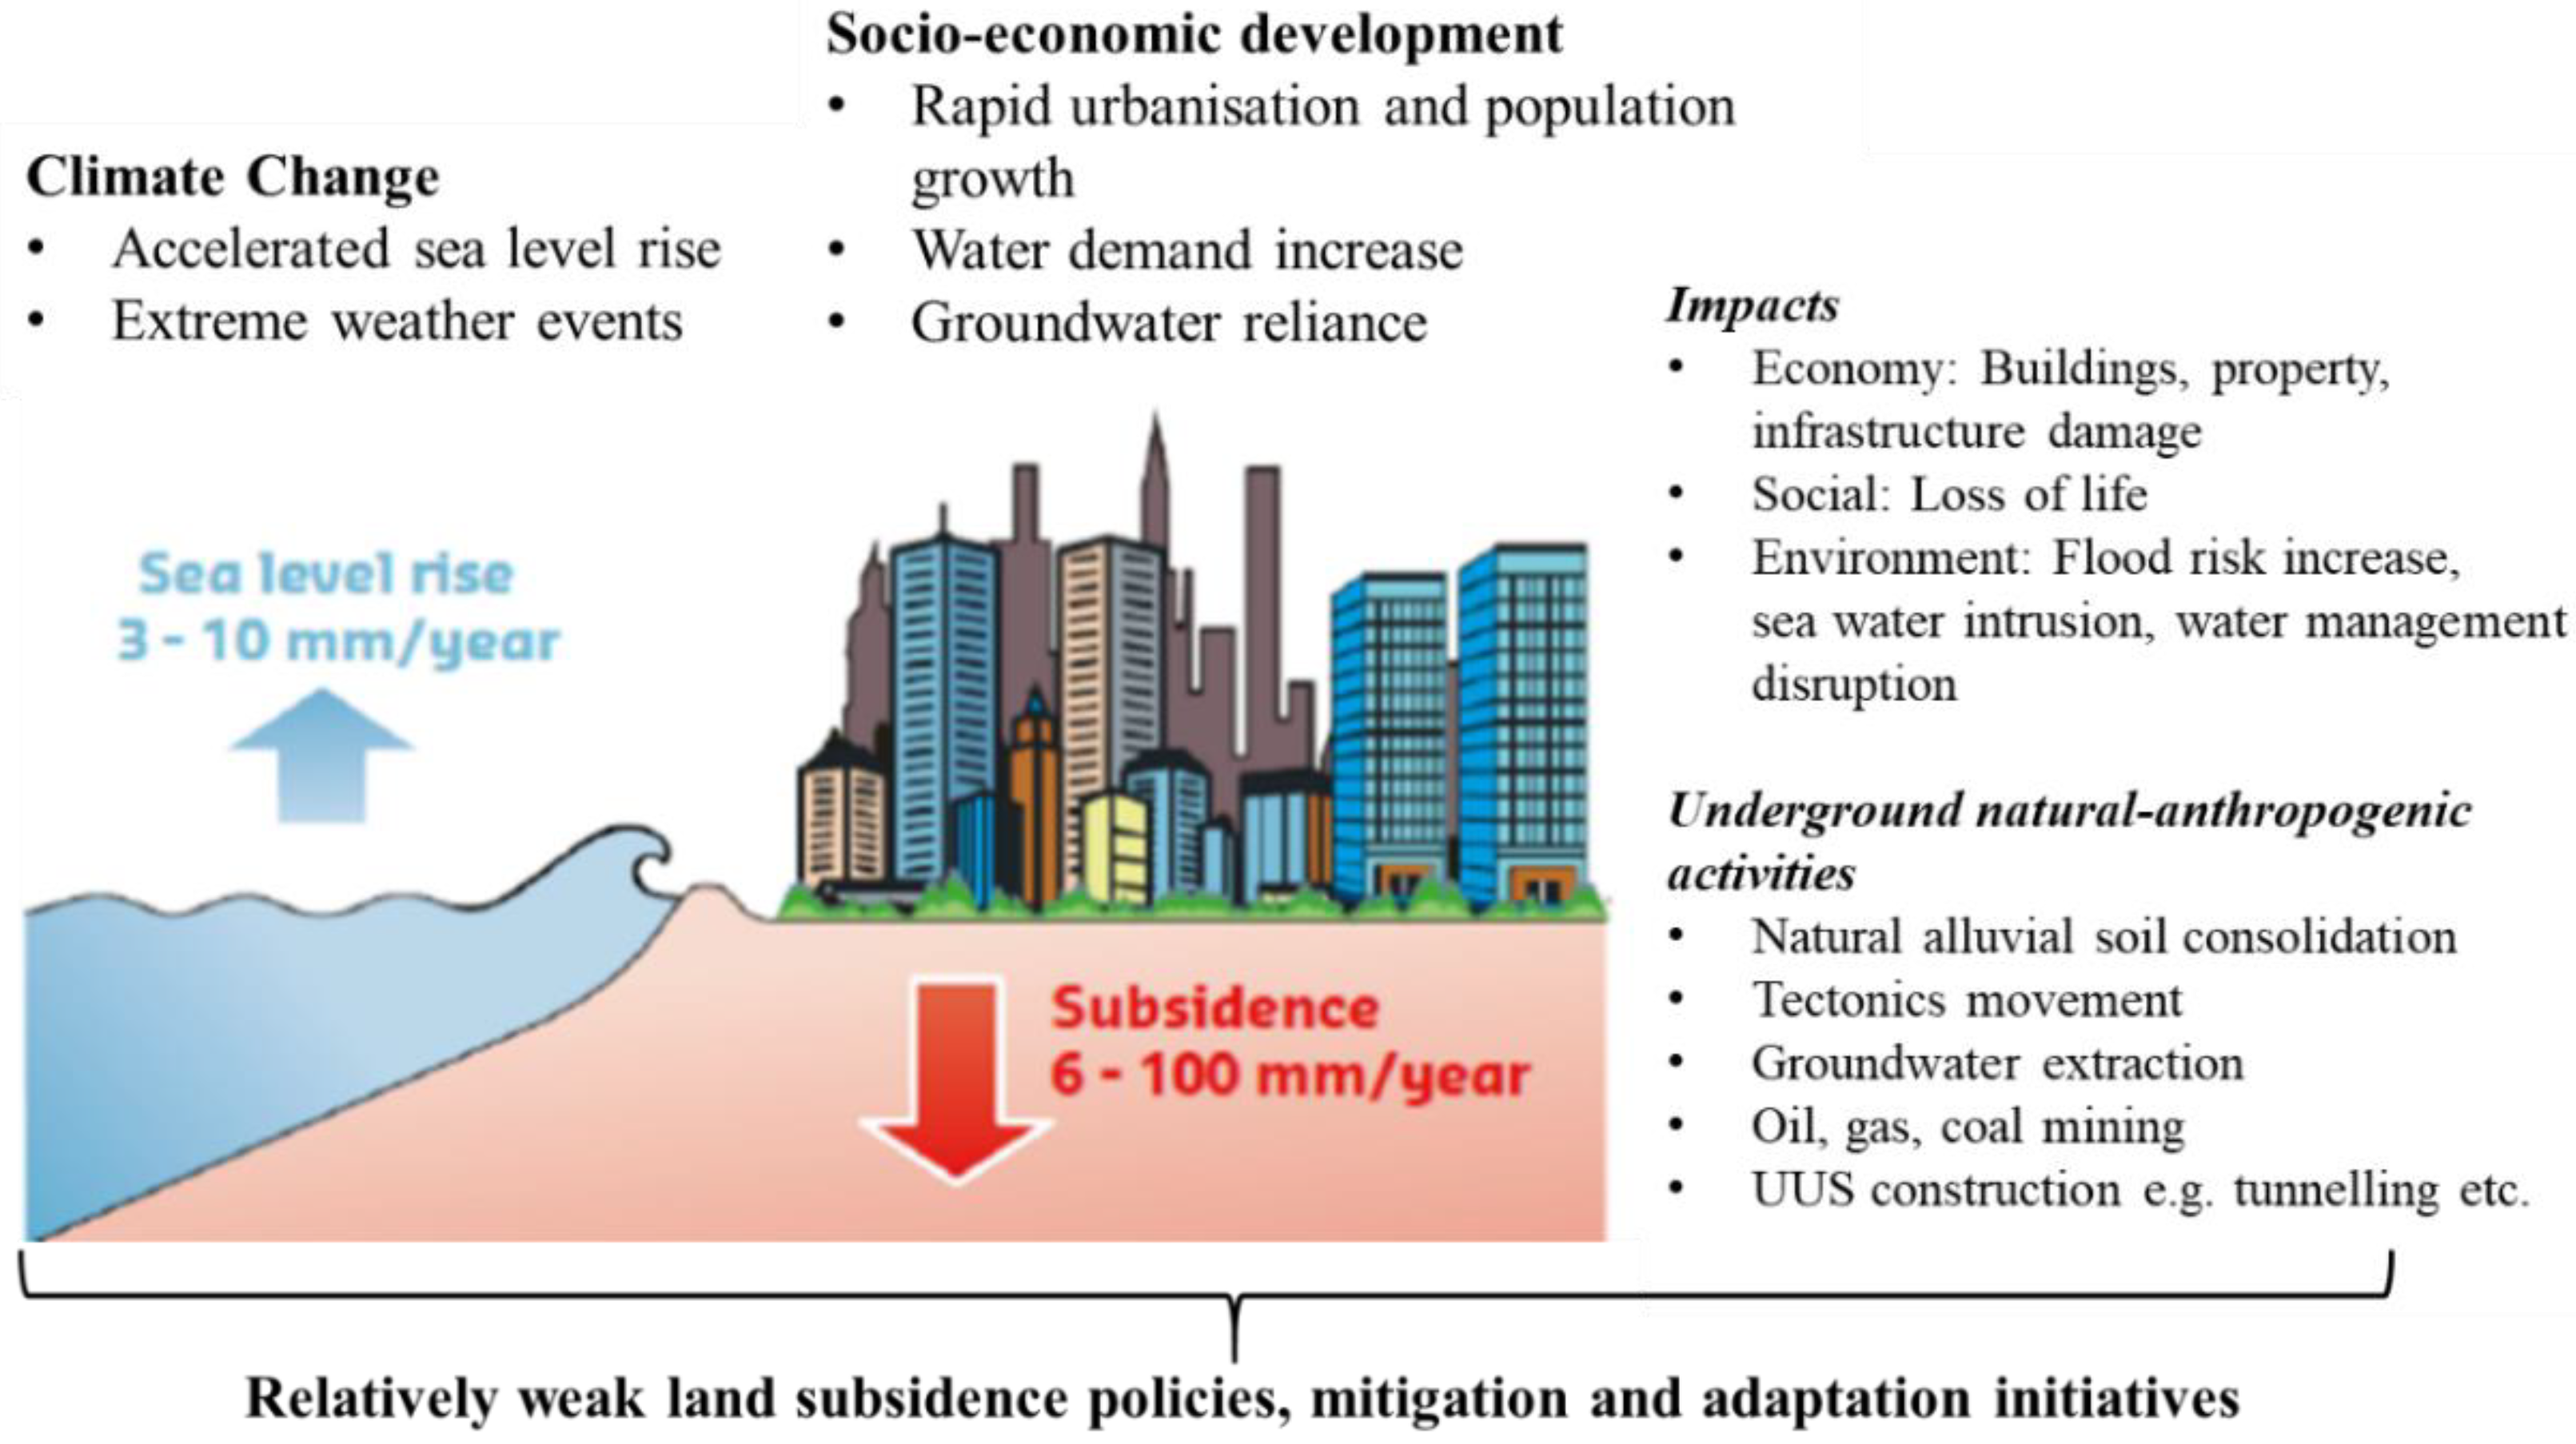
7]. The impacts are direct and indirect on all aspects of sustainability spectrum which can include Economic, Environment and Social [
8,
9] (refer
Figure 1). With all due respect, economic impact is the most visible, monetary and quantifiable by the local decision makers or authorities to justify how feasible, sustainable and cost-saving a certain impact and perhaps, future planning or modelling to realise a feasible, sustainable and cost saving projects in line with the challenging effect of land subsidence.
For Shanghai, as a coastal megacity, is facing serious challenges based on previous records, current and possible future of time [
10,
12]. Functioning as a major economic megacity, socio-economic development and dangerous urban underground space (UUS) exploration have put further stress to the megacity [
13,
14]. With continuous land subsidence rate of 6-100mm per year and increasing flood risks have significantly create damage to urban economic spectrum e.g. buildings, properties, infrastructures and land. Putting forward the idea of urban spatial planning for the megacity towards future adaptive and resilient state of scenario in spite with the promising function of UUS development is indeed inevitable. The International Geoscience Programme (IGCP) Plan by the United Nations Educational, Scientific and Cultural Organization (UNESCO) [
15] is continuously monitoring and funding research projects towards investigating the land subsidence issues especially in coastal megacities like Shanghai. In theory, different urban areas have different loads and anthropogenic activities that presents different land subsidence impact rate [
16]. The cause-effect relationships in rapid urban settings are hard to define due many independent factors and undesirable impacts [
17].
UUS exploration in a compact Shanghai megacity, offers three-dimensional (3D) development with promising role of
big, deep, long, fast and
dense [
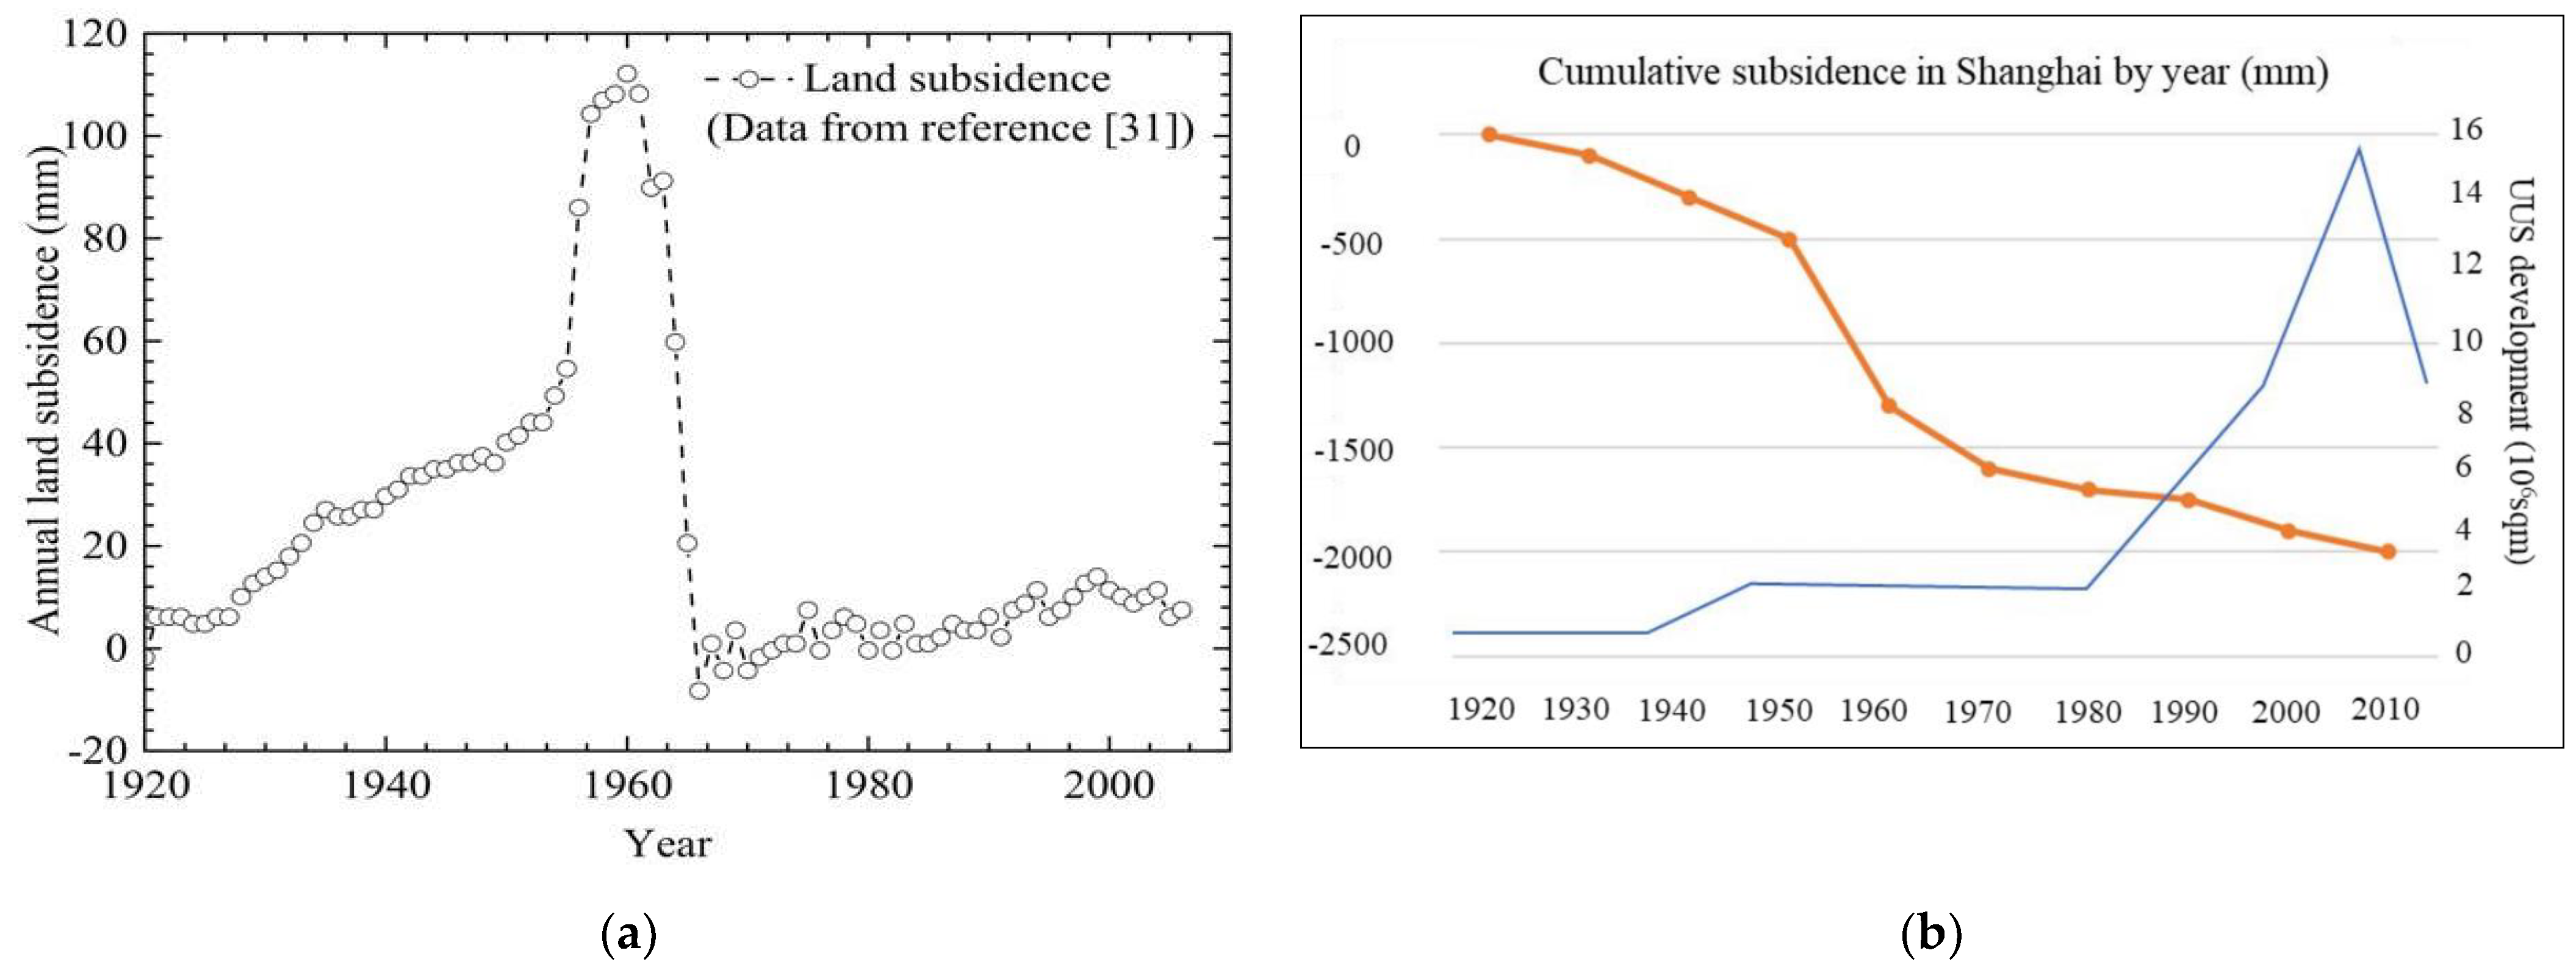
20]. As a rapidly growing coastal megacity, Shanghai is continuously threatened with land subsidence issues since 1920s [
12,
21]. Starting in 1960s, land subsidence was controlled through groundwater banning in the urban area, however in 1990s, unconscious and dangerous urban underground space (UUS) exploration and tunneling development are causing further land subsidence [
22,
23,
24] (refer
Figure 3). The UUS exploration, land subsidence, economic impact and spatial modelling is a complex multidisciplinary field of research. There is still limited research on the integrated modelling of future potential socio-economic impact damages by UUS exploration from land subsidence in coastal megacities. Hence, this paper presents the understanding of development extent and impact of UUS-subsidence to economic via cause-effect analysis and spatiotemporal. As different urban areas may possess different causes, load and activities that represent different impact, it is imperative to study the ever-complex multidisciplinary spectrum [
25]. The investigation of the past and current situation can potentially provide basis for future scenario modelling.
2. Materials and Methods
The methods used in this research consist of understanding the relations of multi-factors through cause-effect and spatiotemporal analysis for the study period of 1960-2020. The reason of selecting 1960 as base year is because that was when the control of land subsidence through groundwater banning was successfully implemented. Most of the data for cause-effect multi-factors are secondarily gathered and synthesised from various open sourced databases e.g. scientific journal articles and reports. Factors are selected based on various existing UUS-subsidence-economic impact (USEM) framework: subsidence-economic impact framework [
28,
29], digital land price model (DLPM) [
30], property values [
31], UUS evaluation database [
31], infrastructure vulnerabilities [
22,
33] as well as modification and adaptation from the Shanghai Masterplan 2017-2035 (SM 2035) and Sustainable Development Goals (SDGs) 2030. The multi-factors for cause-effect analysis are derived and integrated into the USEM framework [
31,
33,
34,
35,
36,
37,
38]. The framework basically involves (refer
Figure 4):
2.1. Multi-Regression Analysis of USEM’s Cause-Effect Multi-factors
The cause-effect analysis is used to study the relation of the multifactor which comprise of causing factors (selected based on the previous literatures on local condition of Shanghai megacity) in relation specifically, with the economic impact factors (e.g. land, building, properties, UUS development and infrastructures). It can be considered as a complex method [
39]. The cause-effect multi-factors are preliminary determined by constructing ‘Ishikawa cause-effect diagram’ [
40] to provide a clear framework of the cause-effect situations.
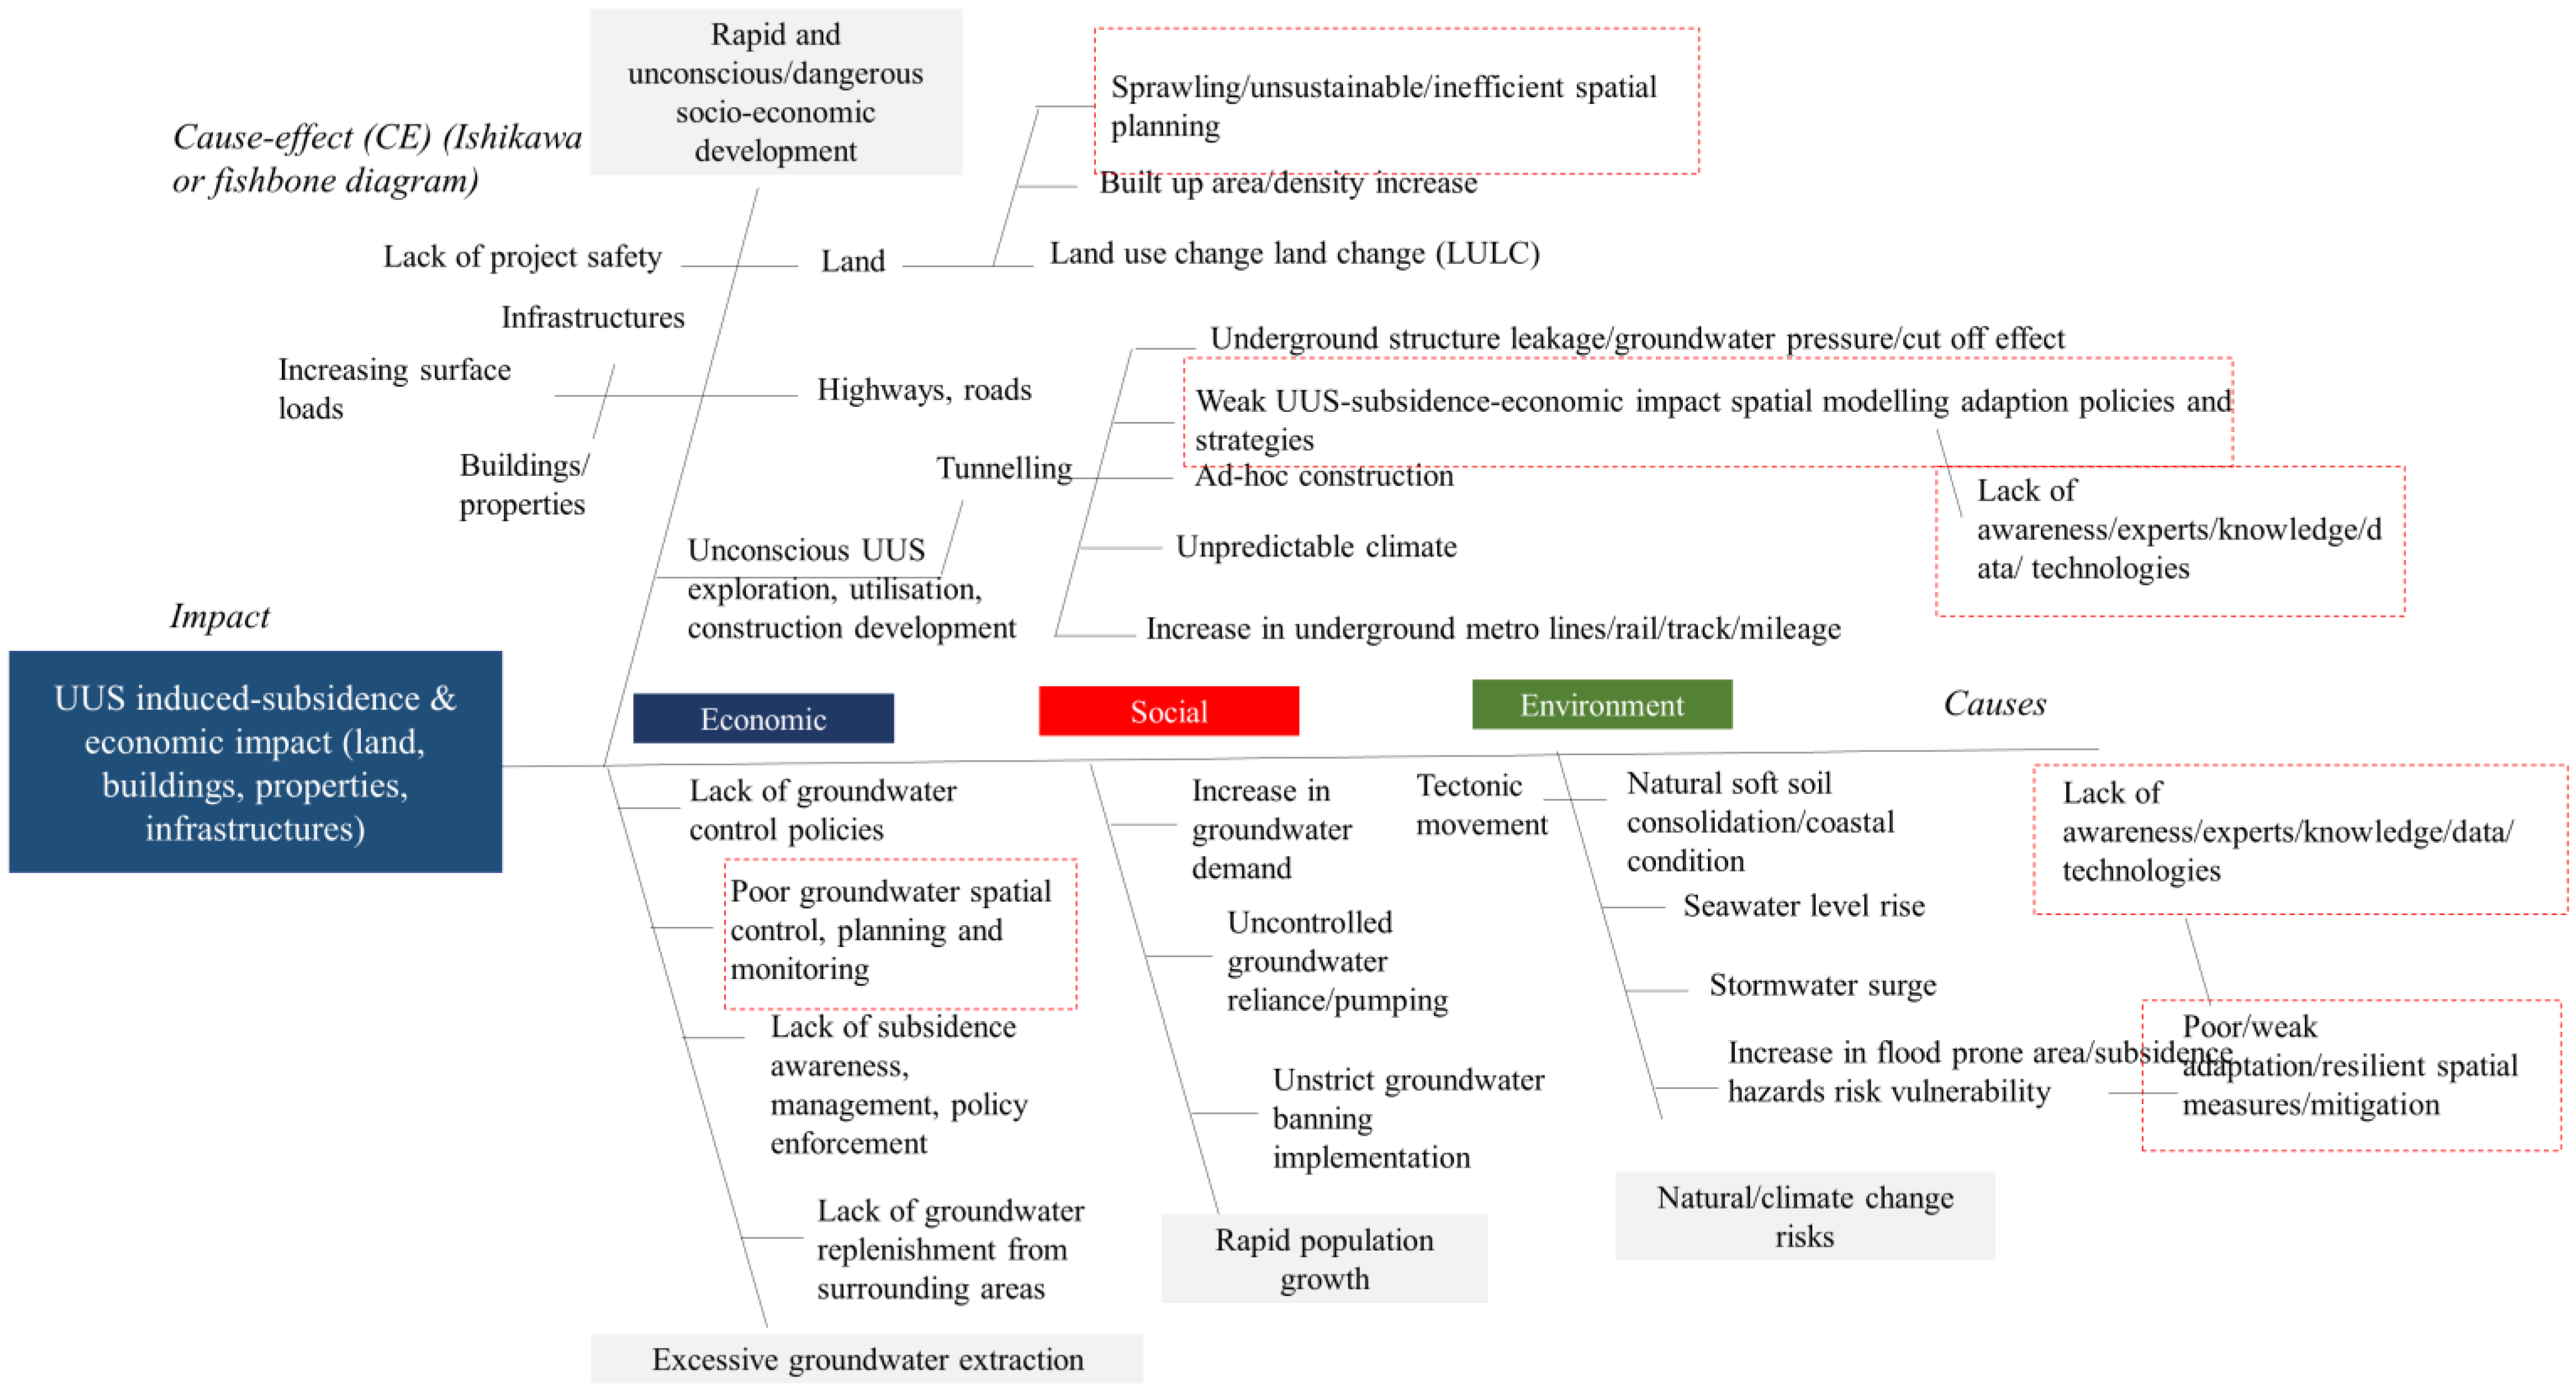
2.1.1. Ishikawa Cause-Effect Diagram
Based on preliminary and thorough continuous literature reviews, the main causing factors and economic impact factors for land subsidence in Shanghai megacity have been structurally determined using ‘Ishikawa fish bone method’ for easy interpretation into the USEM framework. With integration from SDG 2030 and SM 2035, the concrete cause-effect factors and indicators are determined and integrated into the USEM framework (refer
Figure 5).
After careful selection and in line with the Sustainable Development Goal 2030 (SDGs 2030) and Shanghai Masterplan 2017-2035 (SM 2035), there are 38 determined causing factors and 28 economic impact factors. The multi-factors are as well derived from previous and existing literature framework on land subsidence and economic impact. Data are then, secondarily syntehsised from online databases, scientific journals and statistical reports for year 1960, 1990 and 2020. Datasets are input in Excel sheets and each factor has varied type of measurement unit from mathematical (e.g. km per year) and scoring (e.g. Full (F) = 100%, Intermediate (I) = 60% or Low (L) = 40%) by year. The causing and economic impact factors are then analysed via multiple regression to analyse the relationship between a single dependent variable (
y) and several independent variables (
x). The objective of multiple regression analysis is to use the independent variables whose values are known to predict the value of the single dependent value via the common following equation:
Y is dependent variable;
β0 is intercept,
βi is slope for
Xi and
X is independent variable. To provide simplicity, only the main causing factors and their factors are shown, whilst the second tier are not. The main causing factors cover: increasing surface load; UUS development, groundwater extraction and natural disaster probability. Whilst, direct-indirect economic impact factors include: land, underground, infrastructure, buildings/properties, socio-economic activities and further land subsidence. As mentioned, these factors are identified, adapted, modified, simplified and integrated to the USEM framework from various existing framework, SDG 2030 and SM 2035 to provide relevancy, comprehensiveness, and inclusivity towards adaptivity and resilience. The detailed causing (
x) and economic impact factors (
y) are enlisted in the following
Table 1 and
Table 2.
2.2. Spatiotemporal Analysis with ArcGIS Pro
It is acknowledged to produce reliable and goods results out of Geographic Information System (GIS) analysis require extensive set of data. Hence, it is almost limited to impossible to be able to visual spatiotemporally each determined causing and economic impact factors. Hence, after multiple regression analysis was conducted, only those factors with high R values (depicts high regression relationships) from 0.90 and above are selected to be spatiotemporally visualise in ArcGIS. The tool used in this analysis is ArcGIS Pro. With limited data availability and highly depending on secondary open sourced data bases, scientific journals and reports, however, a series of spatiotemporal maps for each selected high regression factors are visualised successfully for year 1960-2020. Selected highly regression causing and economic impact factors are:
2.2.1. High Regression Causing Factors with 0.90 and above R values
Population density (no./km2/year);
Total construction of tunnel/rapid transit/metro in operation (km/year);
Underground tunnel leakage (L/m2/day/year);
Cumulative UUS development (hectare);
Cumulative land subsidence (mm/year/hectare)
2.2.2. High Regression Economic Impact Factors with 0.90 and above R values
Average land price (yuan/m2/year);
Loss of arable land (mill.km2/year);
Tunnel/metro settlement (mm/year);
Reconstruction area ratio ($/m2/year);
Average building price ($/m2/year);
GDP growth/revenue by district of governance ($/district/year)
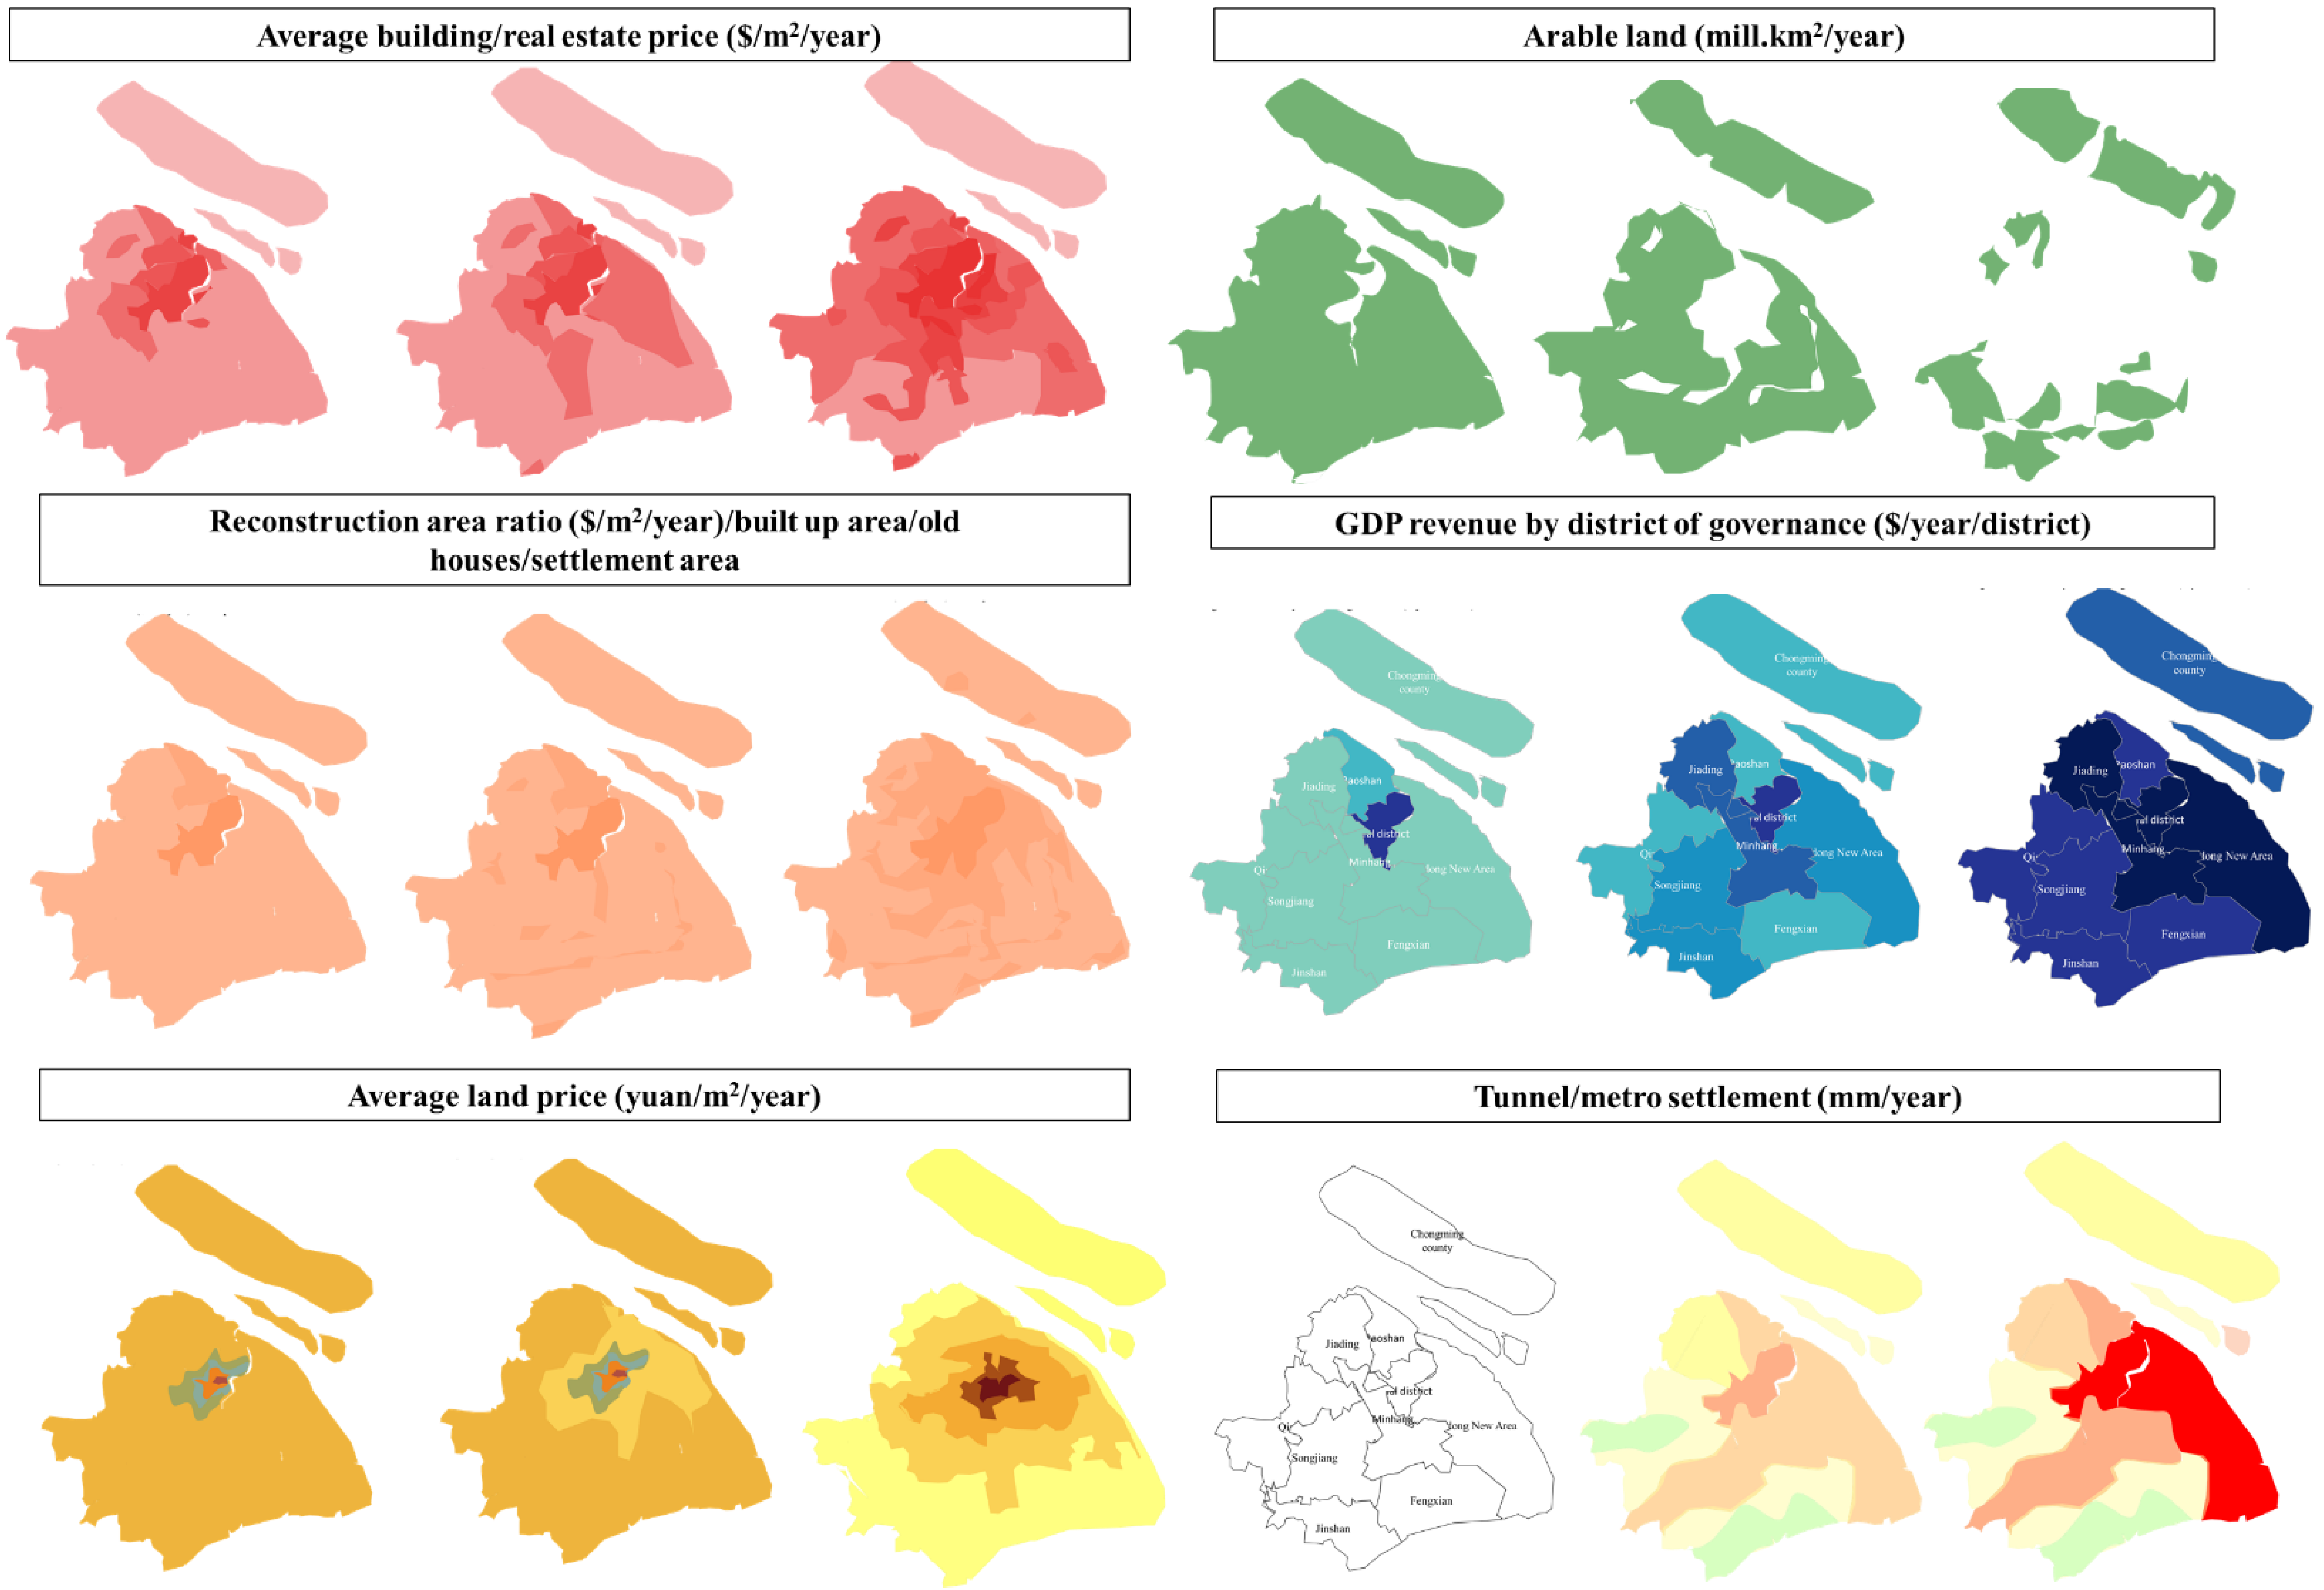
After determining which cause-effect factors are highly regressed, specific spatiotemporal analysis are conducted using ArcGIS Pro platform and edited with Microsoft PowerPoint graphics by gathering most geospatial data components (e.g. vector, raster, imagery, features, and base maps linked to spreadsheets and tables) and assumptions based on the considerations of existing available raster and vector data on UUS development, land subsidence, previous and current land use and spatial planning, interdependence of land use and human activity changes in coastal areas, economic impact and socio-economic factors for year 1960-2020, to strengthen the spatiotemporal visual relationships. The purposes of learning the spatiotemporal relationship is to determine disaster risks and scenario spatial simulation or modelling by identifying possible countermeasures, planning options, land use changes and consequence mitigation strategies. It involves:
3. Results
The results determine that the cause-effect of UUS-subsidence-economic impact factors in Shanghai megacity in 1960-2020, has been and are still being influenced due to high regression values of causing factors: weak spatial modelling and experts’ knowledge, population, cumulative UUS development, subsidence and tunneling leakage. Meanwhile, the low regression includes seawater level rise, tunneling construction and metro length. Kindly note that these results are based on Business as Usual (BaU) while scenarios such as Countermeasures (CM) with full adaptive measures and Worst Case (WC) scenario are yet to be analysed.
3.2. High R squared value 0.92-1.00
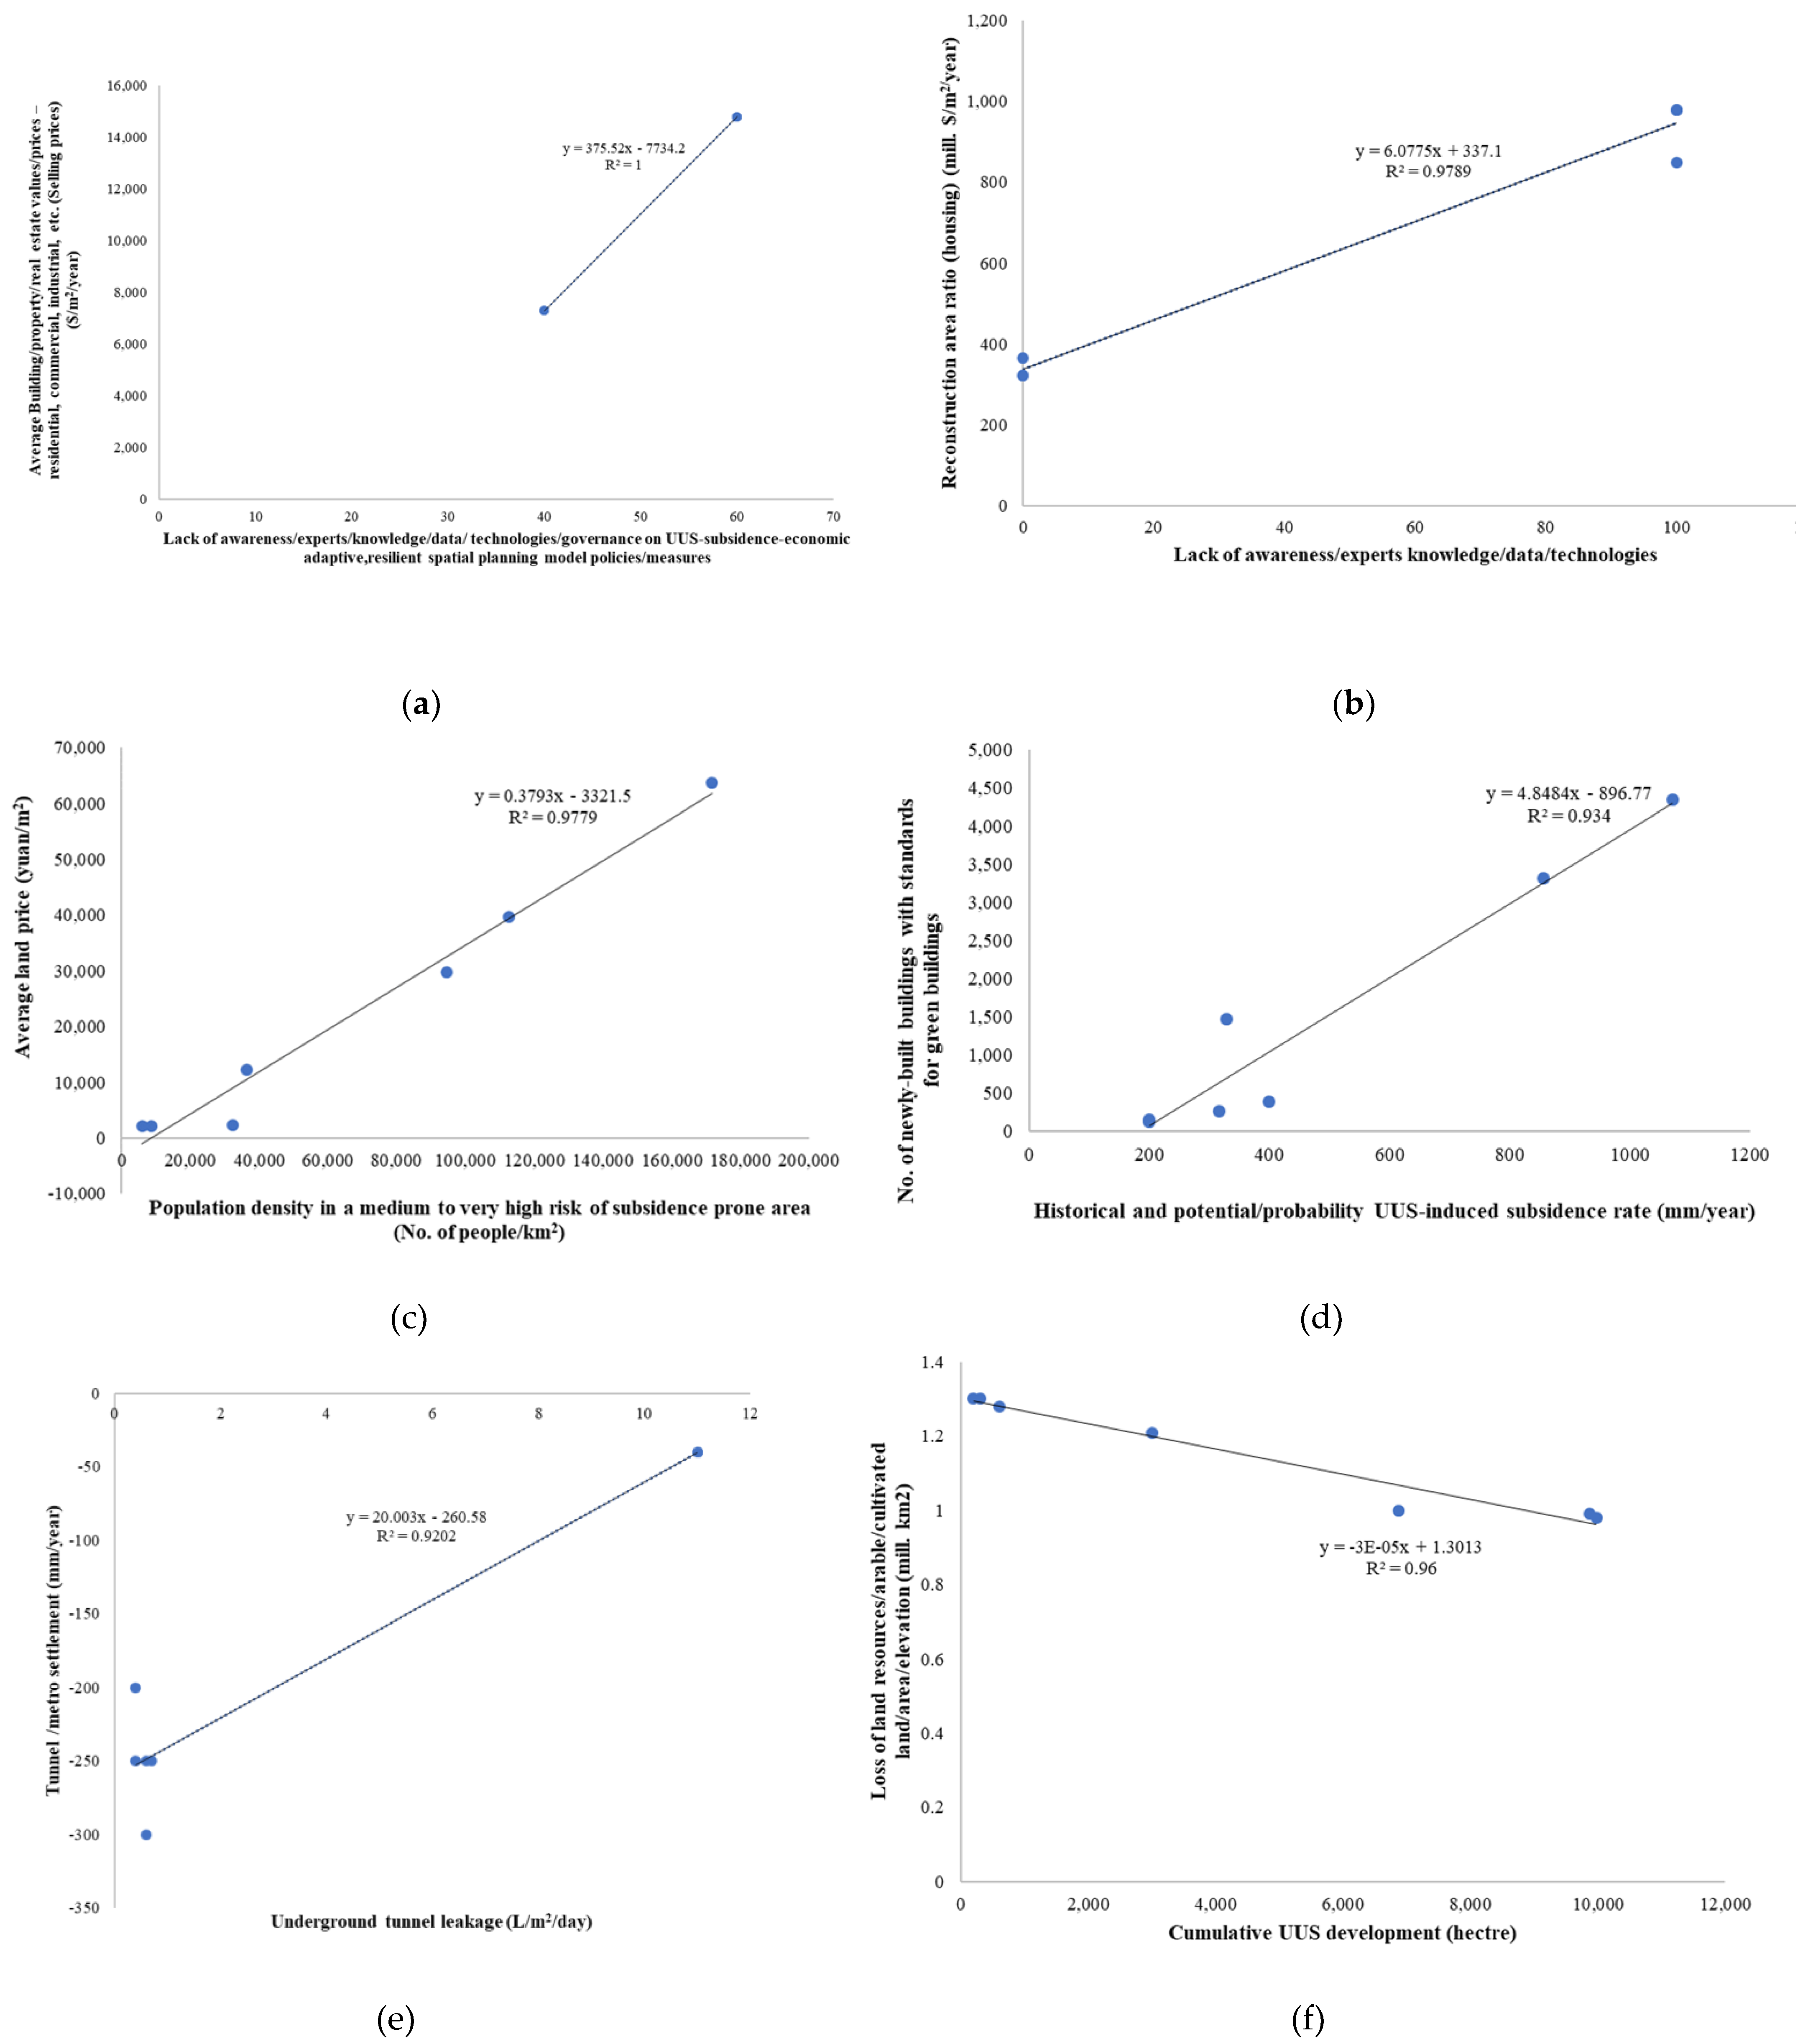
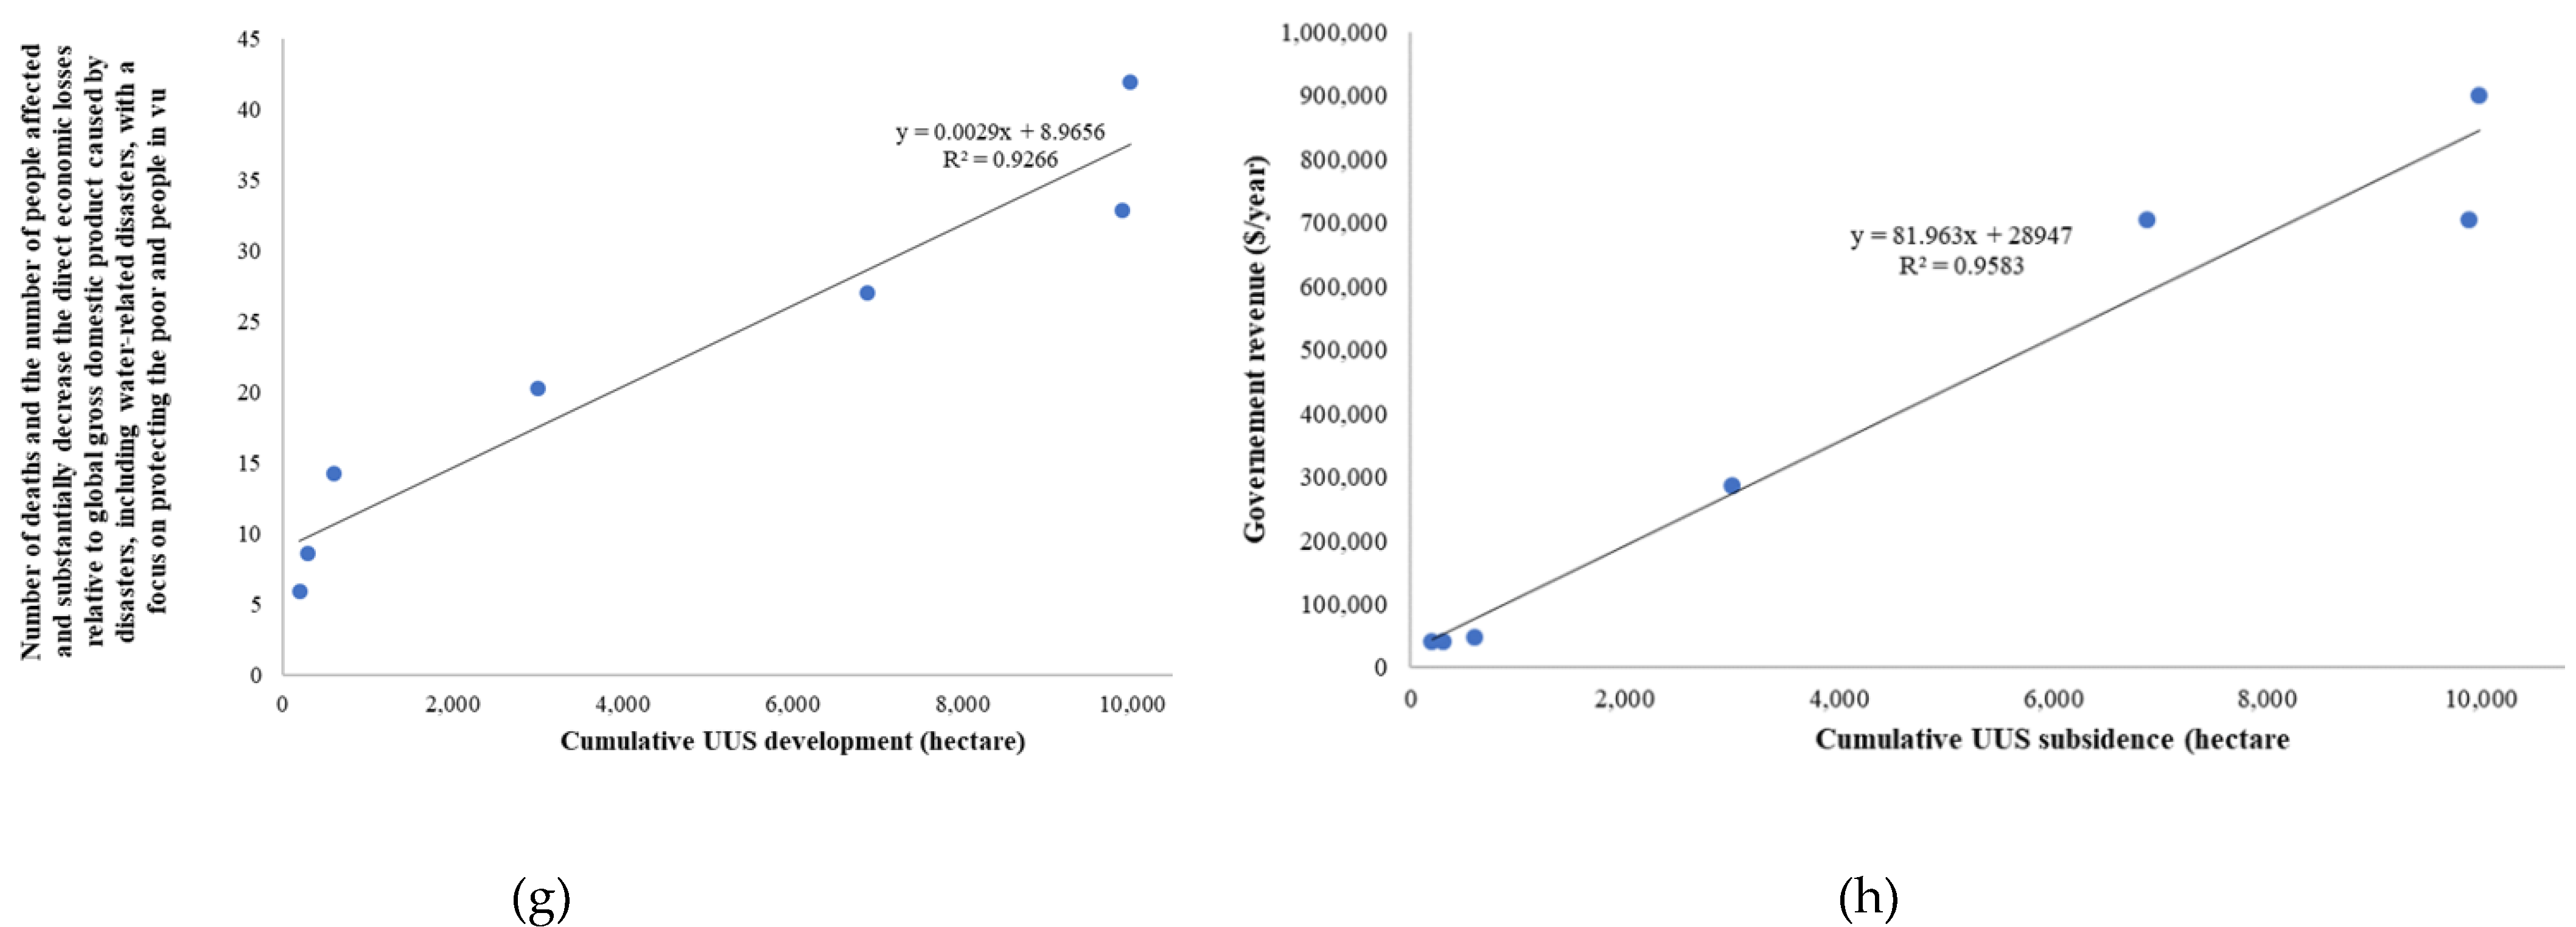
Based on the multi-regression analysis, it is found that the following factors: weak USEM spatial modelling, experts’ knowledge, population density, cumulative UUS development, land subsidence, and underground tunneling leakage have high R squared values with values between 0.90-1.00 on the economic impact factors: average building prices, reconstruction area ratio, average land price, number of newly built green buildings, tunnel settlement, arable land and government revenue by districts. The causing factors: population density, UUS-subsidence and tunneling leakage have high impact on the economic factors: on averaged land price, no. of green buildings built and tunneling settlement with 0.97,0.94 and 0.92 R squared values, respectively (refer
Figure 7). This indicates the multi-regression relationships are distributed mostly on main causing factors: 1.0 Increasing surface load; 2.0 UUS development and 3.0 Groundwater extraction, with even main economic impact factors: 1.0 Land, 2.0 Underground; 3.0 Infrastructure; 4.0 Buildings/properties and 5.0 Socio-economic activities. These multi-regression relationships are crucial towards sustainable, adaptive and resilient built environment in Shanghai megacity, whereby it shows that the USEM awareness has the most regression influenced on the building selling prices. This is followed by lack of spatial planning awareness/knowledge and technologies (0.9789) which have impact further to the increase of reconstruction area ratio (housing) increase due to damages.
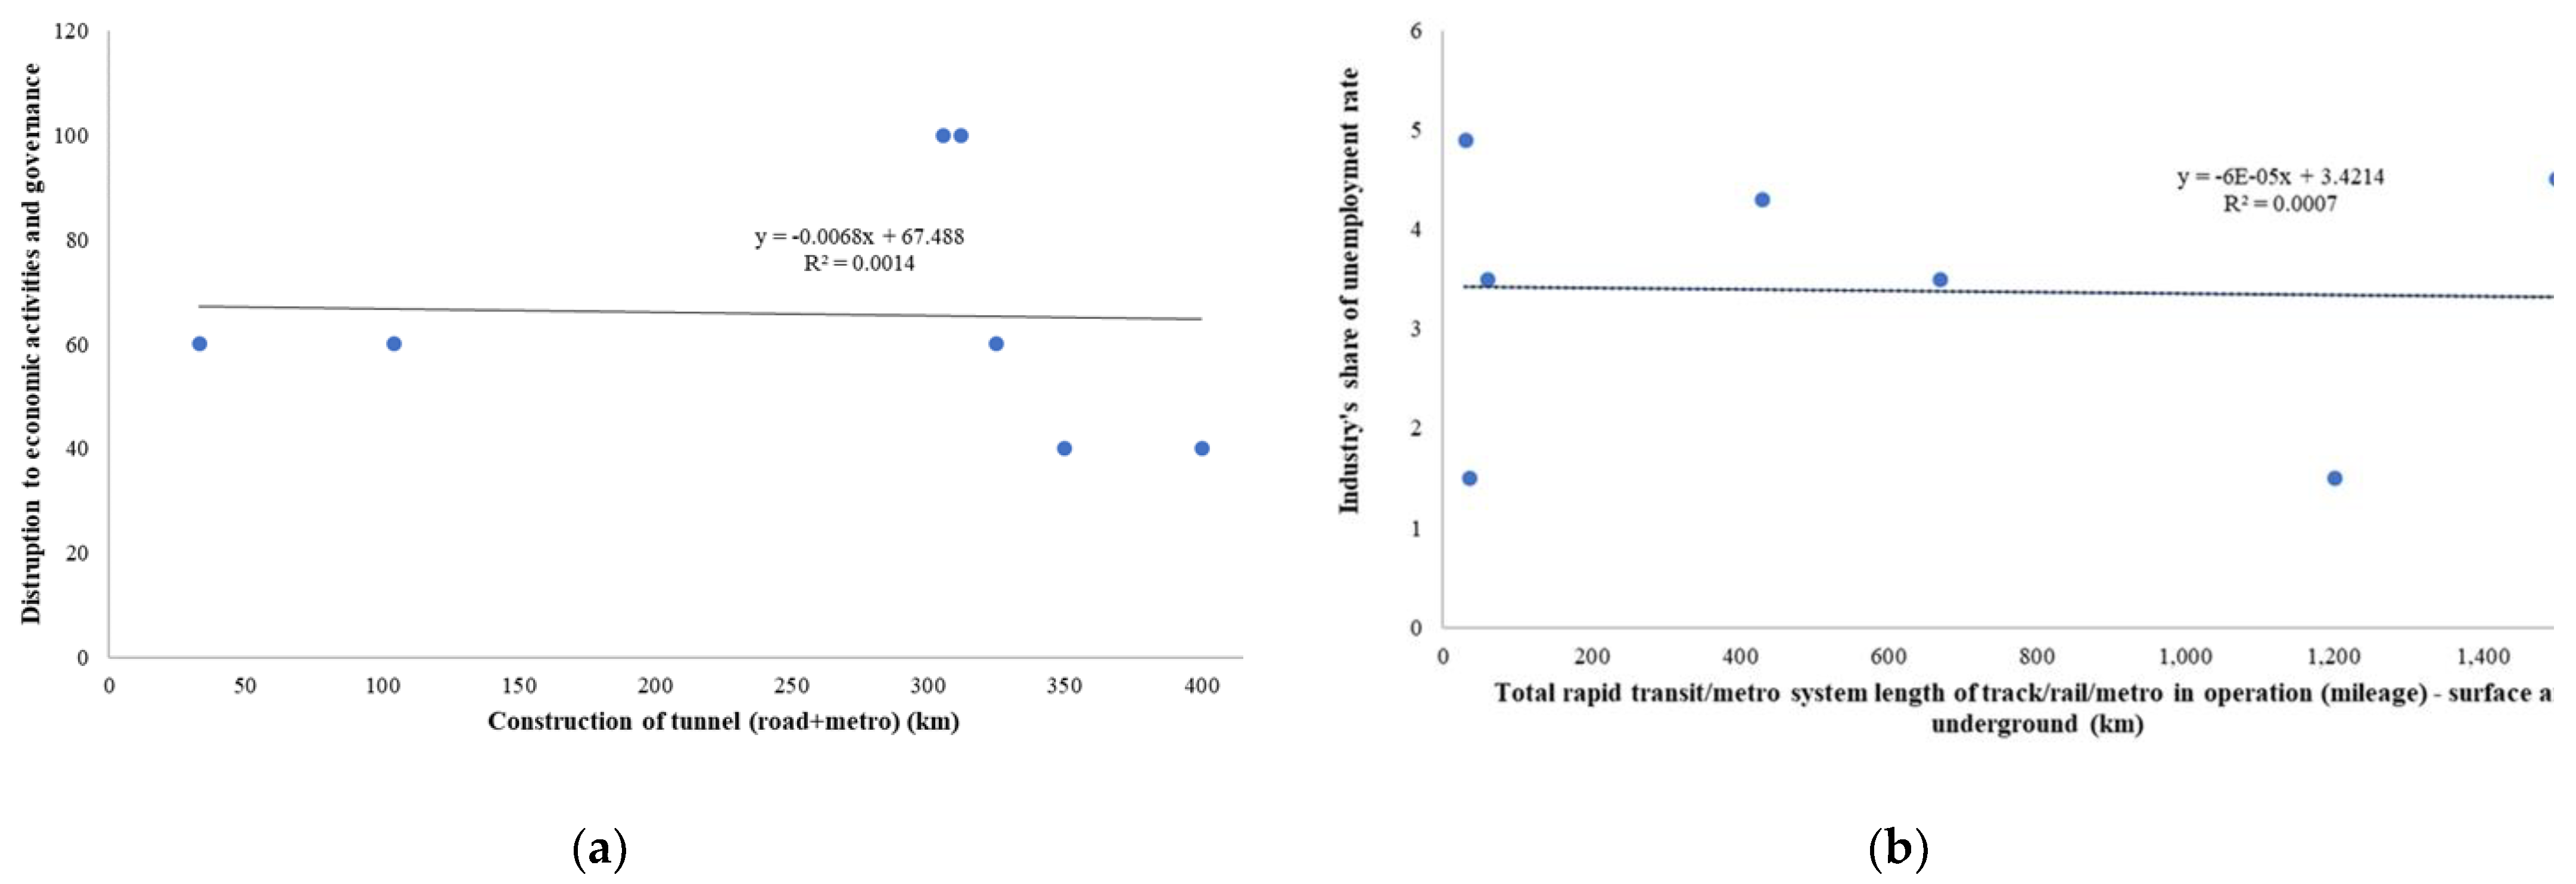
3.2. Least R squared value 0.0007-0.0014
Meanwhile for the least regressions, to provide simplicity, the causing factors of tunnel construction and total metro length are selected. The causing factors have least regression impact to the economic disruption and unemployment rate, respectively perhaps due to good construction mechanism of tunneling development in Shanghai megacity.
3.3. Spatiotemporal Analysis for High Regression Cause-Effect Factors between 1960-2020
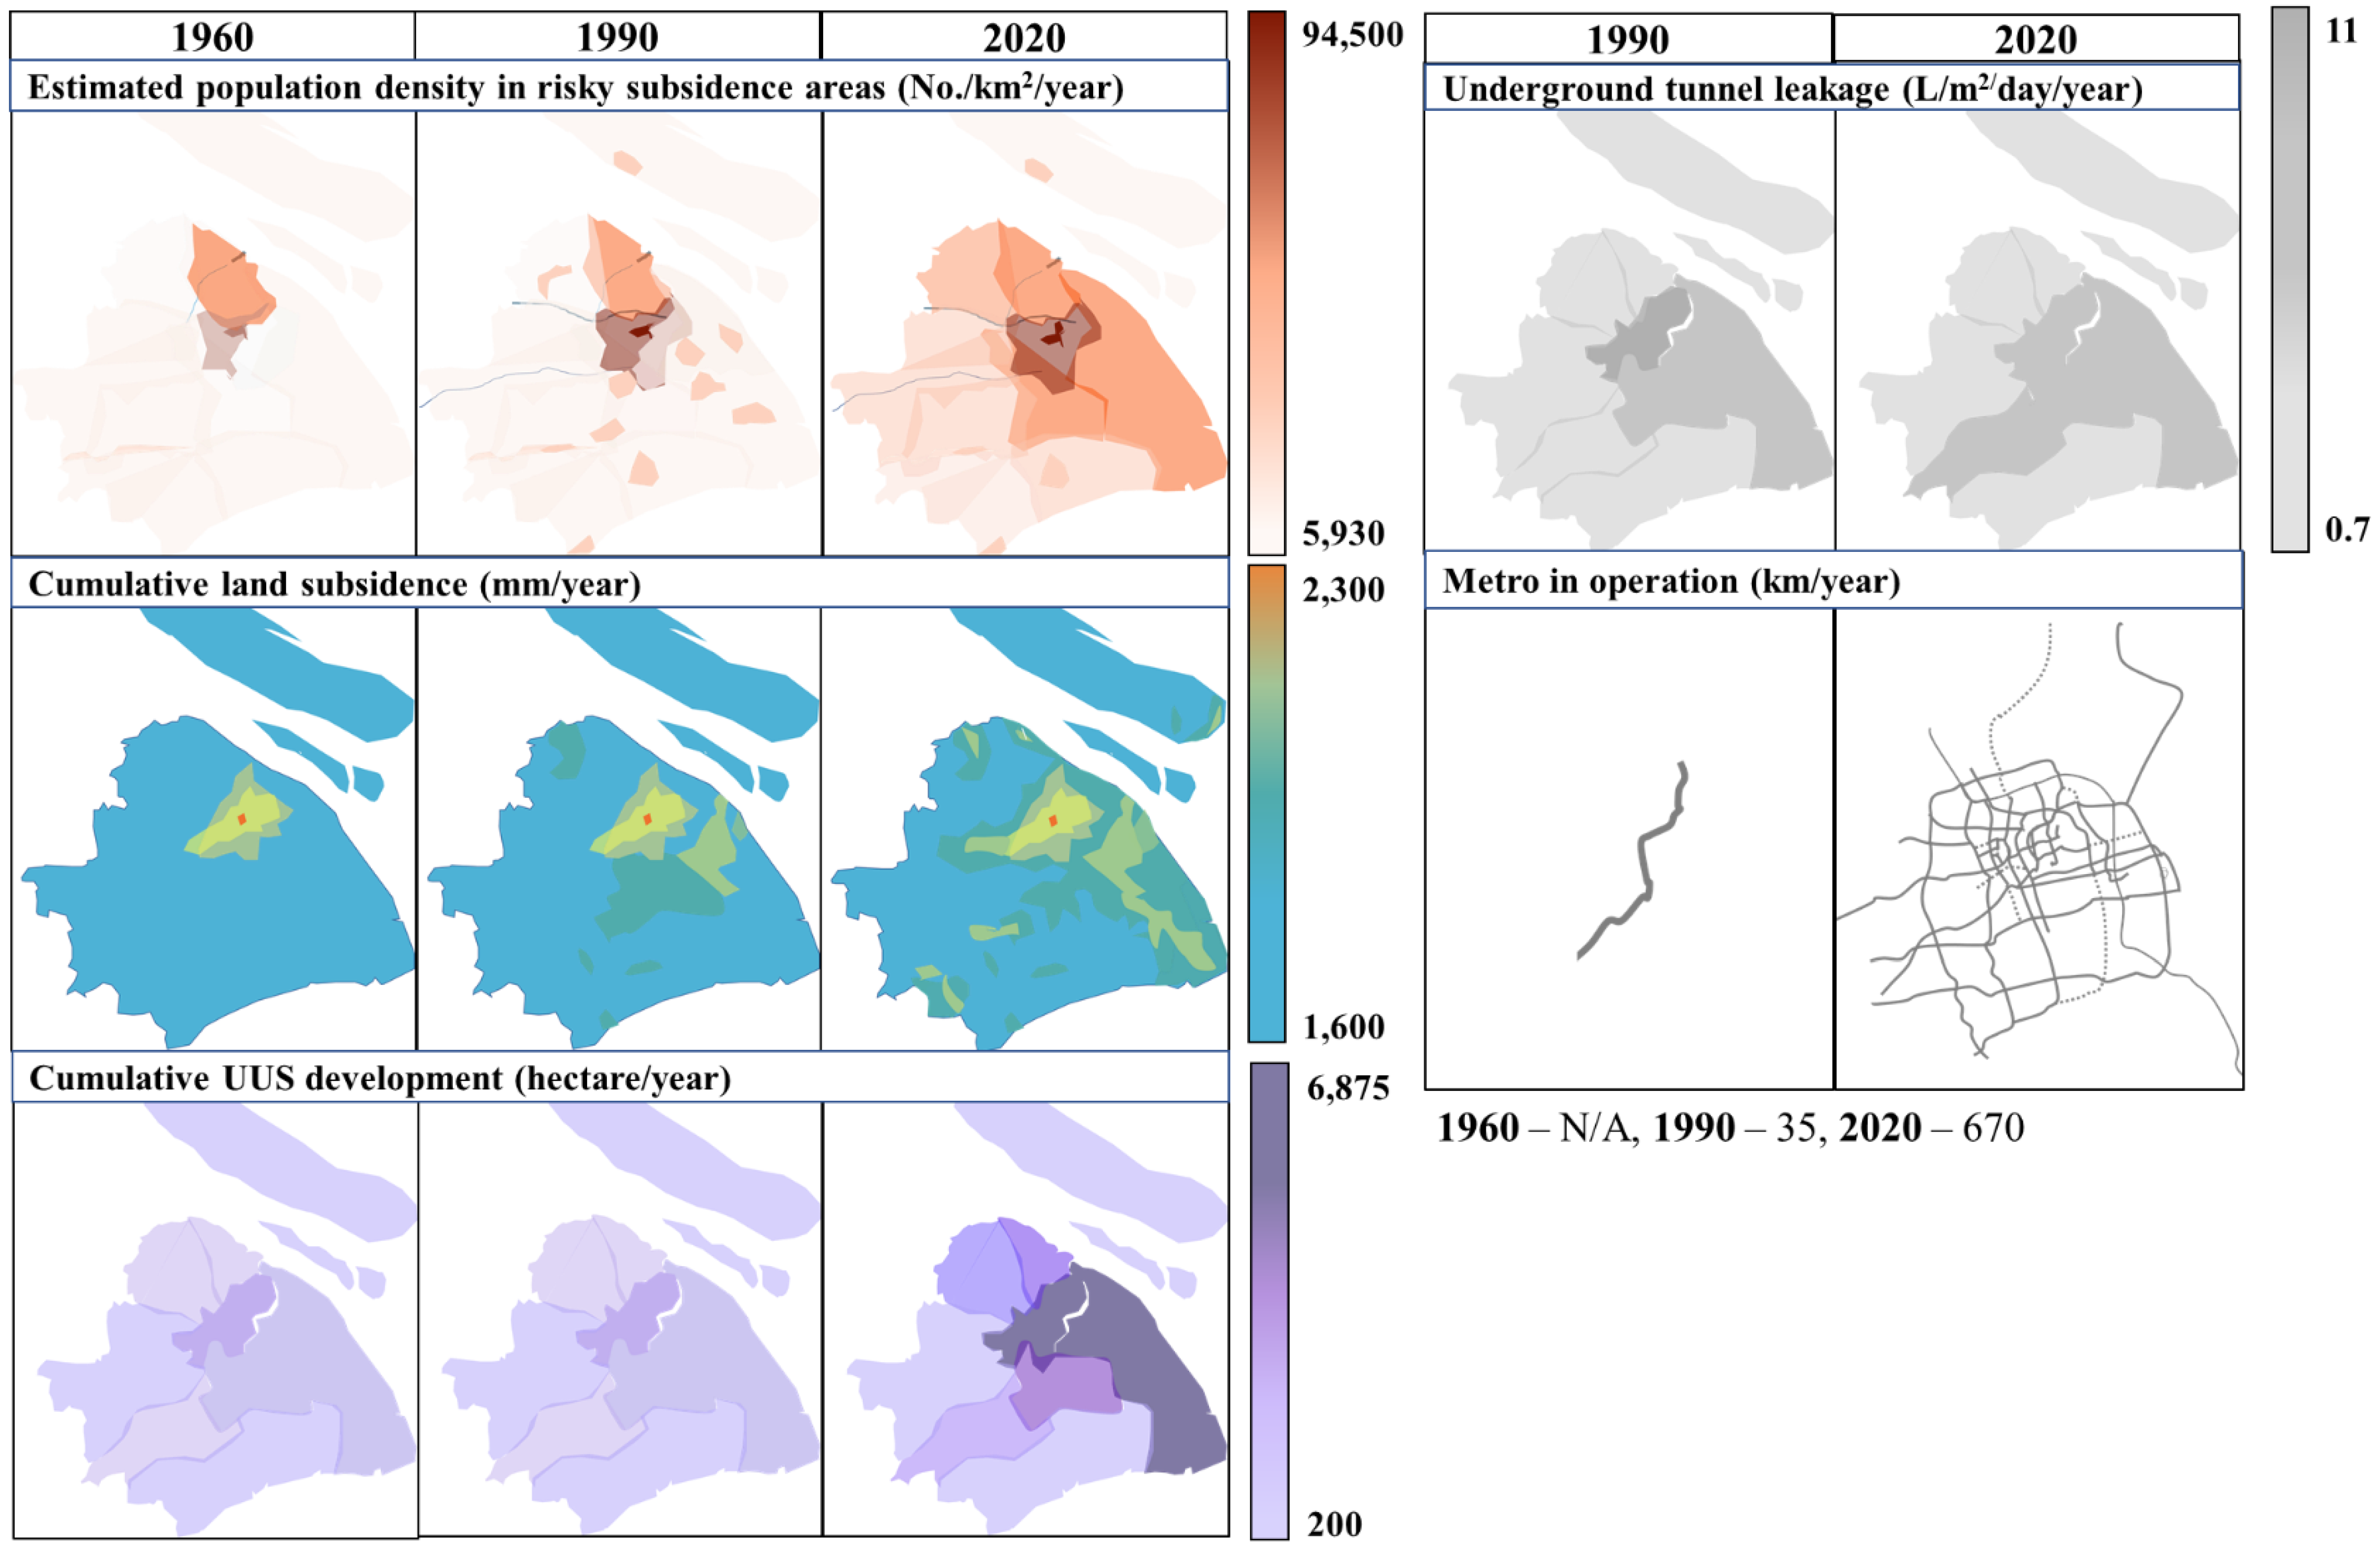
Based on the multi-regression results in 3.2. Only those cause-effect factors with high or significant R squared values are selected to be spatiotemporally visualised in ArcGIS Pro due to data limitation and simplicity. Based on the spatiotemporal analysis, the spatial patterns of the selected high regression causing factors over the period of 1960-2020: population density, construction of tunnel or metro, underground tunnel leakage, UUS development and land subsidence have shown parallel growing pattern with the economic impact factors: land price, arable land, tunnel/metro settlement, reconstruction area ratio, average building price and Gross Domestic Products (GDP) growth or revenue by districts in Shanghai megacity.
3.3.1. Causing Factors Spatiotemporal
Based on
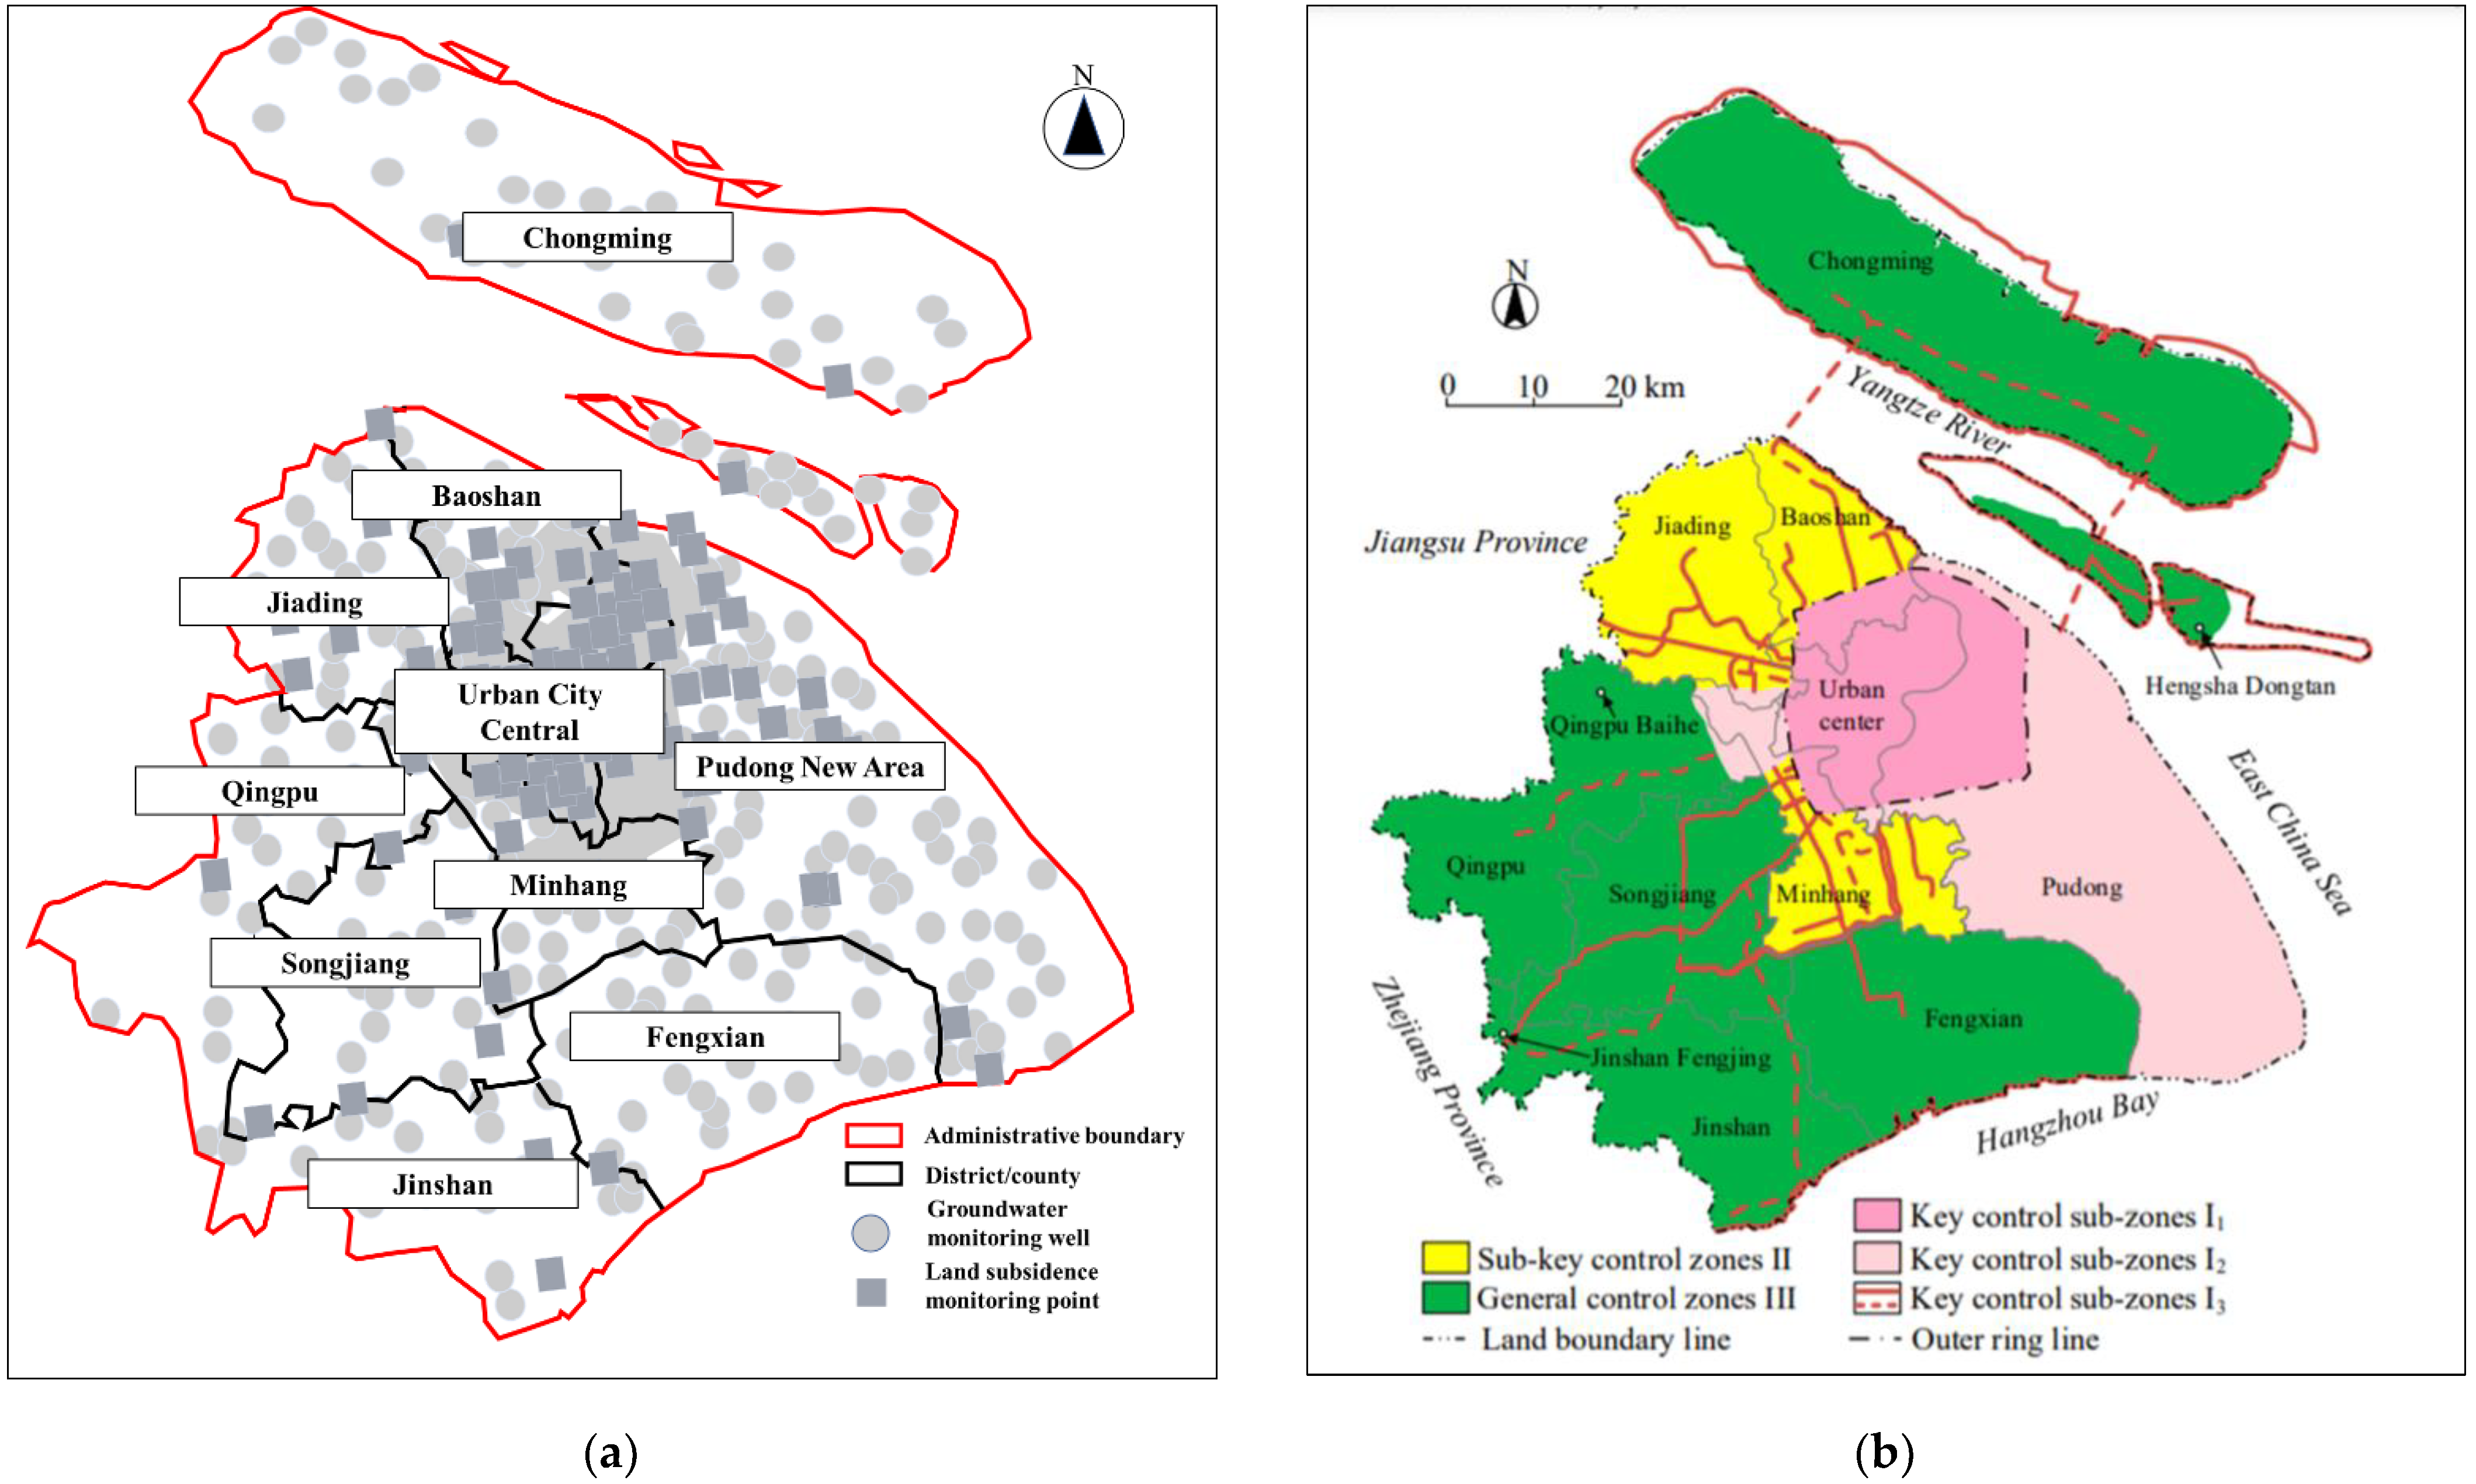
Figure 9, the population density, cumulative land subsidence, underground tunneling leakage, cumulative UUS development and total construction of tunnels and metro are growing in parallel distribution between each other in 1960, 1990 and 2020. In 1960, there was no underground tunnel leakage and construction of tunnel metro identified, however UUS development was already constructed for utilities and infrastructures purposed in the Urban City Centre and Pudong New Area. Unfortunately, when the first metro line was constructed and operated in 1990, that was when the underground tunnel leakage starts to be recorded with high concentration in the Urban City Centre and Pudong New Area. These causing factors growing in parallel and worsen by 2020 especially in the Urban City Centre, Pudong New Area, Minhang, Baoshan and Songjiang districts.
From 1960 to 2020, the population spatial pattern has evolved from merely surrounding Urban City Centre to mostly concentrated at the Baoshan, Minhang and Pudong New Area. The land subsidence is growing mostly parallel with population growth spatial pattern except for Jinshan and Songjiang districts. There seems to be growing subsidence pattern once the tunneling leakage starting in 1990 in parallel with construction of tunnel and metro system. Urban underground space development was not started until 1990 and it was mostly concentrated at Urban City Centre, Minhang and Pudong New Area with additional new area at Songjiang district.
3.3.2. Economic Impact Factors Spatiotemporal
For high-regression economic impact factors, the selected factors include: average land price, arable land, tunnel settlement, reconstruction area, average building price and government revenue (GDP) by districts. Based on
Figure 10, the economic impact factors have shown a mixed positive-negative spatiotemporal relation between 1960, 1990 and 2020 to the causing factors. Whereby, building price, reconstruction area, GDP by districts and tunnel/metro settlement have shown parallel (positive) pattern to the causing factors. The results are indeed, revelation, to the state of determining the adverse land subsidence and unconscious rapid development can do to a region. However, for arable land, shows a negative decreasing pattern due to the UUS development. In 1960, there was no tunnel settlement and it has developed in parallel to the causing factor: tunnel leakage in 1990. Most of the economic impact areas are in parallel growth pattern with the causing factor which started in the Urban City Centre, developed to Pudong New Area, Minhang, Baoshan and Songjiang districts. By 2020, the patterns are growing further with the decrease pattern of arable land.
In general, building price has positive spatial temporal relationship with the causing factors in parallel with reconstruction area and GDP growth. For the average land price, it may seem parallel however, they are mostly influenced based on its location and proximity to the Urban City Centre, of which is the usual determination method for land pricing. Unfortunately, the arable land is decreasing substantially with further tunnel settlement concentrated at Urban City Centre, Pudong New Area, Minhang, Baoshan and Songjiang districts.
4. Discussion
This paper has presented the extent development impact via cause-effect multi-regression and spatiotemporal analysis of the high-regression causing and economic impact factors relations in Shanghai megacity to provide inclusiveness and simplicity in depicting the previous and current situations. The determined causing factors include: population density, total construction of tunnel/rapid transit/metro in operation, underground tunnel leakage, cumulative UUS development and cumulative land subsidence. Meanwhile, for economic impact factors: average land price, loss of arable land, tunnel/metro settlement, reconstruction area ratio, average building price, and GDP by district. The results have determined that the cause-effect relations of the multi-factors in Shanghai has been and still are currently being influenced mainly by the population density, cumulative land subsidence, underground tunneling leakage, cumulative UUS development and construction of metro. Spatiotemporal patterns have majority shown a parallel pattern with mixed positive-negative impact with population, land subsidence is growing in parallel distribution (positive) with tunneling leakage, construction of tunneling, metro system, UUS development, building price, reconstruction area, GDP growth, land price, and tunnel settlement whilst arable lands are decreasing further in Urban City Centre, Pudong New Area, Minhang, Baoshan and Songjiang districts.
The results emphasis on the increasing population, UUS-induced subsidence, underground tunnel leakage and cumulative UUS development and subsidence which in revelation have positive impact mostly on the economic factors such as the average building price and GDP by districts. The increment of the stated economic factors are astonishingly remarkable whilst, on the downside, the parallel and positive increment or growth pattern of the tunneling leakage, reconstruction area, and the decrease of arable land can be seen as negative impact. Hence, the affected areas need to be controlled further in terms of land subsidence monitoring as well as careful UUS exploration and tunneling to avoid further leakage, reconstructions and decrease of arable land. Furthermore, the new discovery such as the expert’s awareness and knowledge on the USEM related framework is also substantial. As the factor is limited and could not be transferred spatially, it still upholds the most significant regression towards average building prices and adverse increase of reconstruction areas. Hence, focuses must be continually given to the highly regression factors in the USEM model which have significant impact to many economic factors including housing prices, reconstruction ratios, averaged land price, no. of green buildings built and tunneling settlement. For low regressions: tunnel construction and metro length, it is quite unexpected that the factors have least impact on the economic impact factors: disruptions to economic activities and unemployment rate. This may be perhaps due to UUS exploration which mostly are conducted underground or in sub-surface layer without interfering the surface area.
As current UUS related subsidence, development and exploration are still growing, it can be safe to state that indeed it is currently the leading causing factors to potentially adverse economic impact in Shanghai megacity. With tunneling leakage in underground tunneling projects have high occurrences due to the megacity’s coastal region nature and heavy development load [
2,
11]. Many ad-hoc efforts have been pursued however, the awareness and knowledge for multi-integrated macro-scale spatial planning such as the USEM framework with the emphasis on the multifactor of UUS-subsidence-economic impact resiliency is still lack and needed for implementation to avoid future costlier damages [
4,
6,
11].
5. Conclusions
In conclusion, this research provides clear multi-relation of the cause-effect factors in Shanghai megacity context from 1960,1990 and 2020. Further analysis such as spatiotemporal, scenario modelling and comparative of Shanghai as a developed megacity and developing megacities are still required. The causing-economic impact factors selection and results may depict different situation in other developing megacities in comparison to Shanghai. As initially noted, the results are based on BaU scenario from 1960, 1990 and 2020, nevertheless, scenario modelling for CM and WC scenarios for future years beyond 2020 e.g. 2035 or 2050 are still needed to be analysed in further research conduct. Shanghai has modelled a great and positive economic impact from to the causing factors perhaps due to excellent control mechanism of land subsidence, UUS development and exploration by 2020. However, focuses must be continually given to the weak spatial modelling, experts’ knowledge and awareness on USEM, population, cumulative UUS development subsidence, and tunneling leakage in future years to come.
The spatiotemporal analysis from 1960-2020 have shown that population, land subsidence is growing in parallel distribution (positive) with tunneling leakage, construction of tunneling and metro system, UUS development, building price, reconstruction area, GDP growth, land price, arable land decrease and further tunnel settlement especially in Urban City Centre, Pudong New Area, Minhang, Baoshan and Songjiang districts. Different situation/cause-impact factors may occur in developing megacities. These results are useful for further adaptive and resilient scenario spatial planning and modelling based on the USEM framework. It opens for further research step 3 and 4: scenario modelling and comparative analysis between a developed and developing megacities and improving planning via concrete scientific evidence and analysis both statistically and spatially. After investigating the cause-effect, spatiotemporal changes and relationships pattern, future spatial proposals can be re-evaluated especially on land subsidence risks and monitoring as well as providing adaptive and resilient spatial planning via scenario modelling. These results are useful for further adaptive and resilient scenario spatial planning, modelling.
Author Contributions
Conceptualization, Muhammad Akmal Hakim bin Hishammuddin, Jianxiu Wang, Muhammad Azizol bin Ismail, Hasanuddin Abidin and Chin Siong Ho; Data curation, Muhammad Akmal Hakim bin Hishammuddin; Formal analysis, Muhammad Akmal Hakim bin Hishammuddin; Funding acquisition, Jianxiu Wang, Tianliang Yang and Xinlei Huang; Investigation, Muhammad Akmal Hakim bin Hishammuddin; Methodology, Muhammad Akmal Hakim bin Hishammuddin and Muhammad Azizol bin Ismail; Project administration, Jianxiu Wang, Tianliang Yang and Xinlei Huang; Resources, Muhammad Akmal Hakim bin Hishammuddin, Tianliang Yang, Xinlei Huang and Chin Siong Ho; Software, Muhammad Akmal Hakim bin Hishammuddin; Supervision, Jianxiu Wang and Chin Siong Ho; Validation, Jianxiu Wang, Hasanuddin Abidin, Soheil Sabri, Chin Siong Ho and Keng Yinn Wong; Visualization, Muhammad Akmal Hakim bin Hishammuddin; Writing – original draft, Muhammad Akmal Hakim bin Hishammuddin; Writing – review & editing, Muhammad Akmal Hakim bin Hishammuddin, Jianxiu Wang, Hasanuddin Abidin, Soheil Sabri and Keng Yinn Wong.
Funding
This research is sponsored by the Shanghai Government Scholarship (SGS); Shanghai Municipal Science and Technology Project (18DZ1201301; 19DZ1200900); Key Laboratory of Land Subsidence Monitoring and Prevention, Ministry of Natural Resources of the People’s Republic of China (No. KLLSMP202101), and International Geoscience Programme (IGCP) Project (663-Land subsidence in coastal cities).
Conflicts of Interest
The authors declare no conflict of interest. The funders had no role in the design of the study; in the collection, analyses, or interpretation of data; in the writing of the manuscript, or in the decision to publish the results”.
References
- Mimura, N. Review: Sea-level rise caused by climate change and its implications for society, Proceedings of the Japan Academy, Series B, Japan, 2013. [CrossRef]
- Climate impacts on coastal cities. Available online: https://19january2017snapshot.epa.gov/climate-impacts/climate-impacts-coastal-areas_.html. (Accessed on 31st January 2022).
- Sea level rise and implications for low-lying islands, coasts and communities. Available online: https://www.ipcc.ch/srocc/chapter/chapter-4-sea-level-rise-and-implications-for-low-lying-islands-coasts-and-communities/. (Accessed on 31st January 2022).
- 4Urbanization and water quality. Available online: https://www.usgs.gov/special-topics/water-science-school/science/urbanization-and-water-quality. (Accessed on 28th January 2022).
- Qin, H.P.; Su, Q.; Khu, S.T.; and Tang, N.V. Water quality changes during rapid urbanisation in the Shenzhen river catchment: An integrated view of socio economic and infrastrcutre development. Sustainability 2014, 6, 7433–7451. [Google Scholar] [CrossRef]
- Avtar, R.; Tripathi, S.; Aggarwat, A.K.; and Kumar, P. Population-urbanisation-energy nexus: A review. Resources 2019, 8(3), 136. [Google Scholar] [CrossRef]
- Land subsidence is one of the world’s underrated problems. Available online: https://www.deltares.nl/en/topdossiers/subsidence/.
- Abidin, H.Z.; Andreas, H.; Gumilar, I.; and Brinkman, J.J. Study on the risk and impacts of land subsidence in Jakarta. Proceedings of the International Association of Hydrological Sciences 2015, 372, 115–120. [Google Scholar] [CrossRef]
- Shi, Y.; Shi, D.; and Cao, X. Impacting factors and temporal and spatial differentiation of land subsidence in Shanghai. Sustainability, 2018; 10(9), 3146. [Google Scholar] [CrossRef]
- Erkens, G.; Bucx, T.; Dam, R.; de Lange, G.; and Lambert, J. Sinking coastal cities, Proceedings of the International Association of Hydrological Sciences, Netherlands, 2015; 372:189-198. 10.5194/piahs-372-189-2015 Project: UNESCO Working Group on Land Subsidence.
- Lyu, H. M.; Shen, S. L.; Zhou, A. and Yang, J. Data in risk assessment of mega-city infrastructures related to land subsidence using improved trapezoidal FAHP. Data in Brief 2020, 28, 105007. [Google Scholar] [CrossRef] [PubMed]
- He, X. C.; Yang, T. L.; Shen, S. L.; Xu, Y. S. and Arulrajah, A. Land subsidence control zone and policy for the environmental protection of Shanghai. International Journal of Environmental Research and Public Health 2019, 16(15), 1–13. [Google Scholar] [CrossRef] [PubMed]
- Zhang, W.J; Zhang, L.M.; Wu, X.G.; Liu, Y. Risk Assessment of leakage water of tunnel construction in coastal soft soils. Advances in Economics, Business and Management Research (AEBMR) 2018, 54, 110–115. [Google Scholar] [CrossRef]
- Peng, F.L.; Qiao, Y.K.; Sabri, S.; Atazadeh, B.; and Rajabifard, A. A collaborative approach for urban underground space development toward sustainable development goals: Critical dimensions and future direction. Frontiers of Structural and Civil Engineering 2021, 15, 20–45. [Google Scholar] [CrossRef]
- 15. United Nations Educational, Scientific and Cultural Organisation (UNESCO), International Geosciences Programme (IGCP) UNESCO Annual Report 2020, United. Available online: https://en.unesco.org/sites/default/files/international_geosciences_programme_annual_report_final_3.pdf. (Accessed on 9th October 2020).
- Ortega-Guerrero, M.A. and Carrillo-Rivera J.J. Land subsidence in urban environment, in: Meyers R.A. (eds). Encyclopedia of Sustainability Science and Technology 2012, Springer, New York, NY. [CrossRef]
- Komeily, A. and Srinivasan, R. S. A need for balanced approach to neighborhood sustainability assessments: A critical review and analysis. Sustainable Cities and Society 2015, 18, 32–43. [Google Scholar] [CrossRef]
- Liu, J.; Wang, H.; and Yan, X. Risk evaluation of land subsidence and its application to metro safety operation in Shanghai. Proccedings of the International Association of Hydrological Sciences (PIAHS) 2015, 372, 543–553. [Google Scholar] [CrossRef]
- Li, M.G.; Chen, J.J.; Xu, Y.S.; Tong, D.G.; Cao, W.W.; and Shi, Y.J. Effect of groundwater exploitation and recharge on land subsidence and infrastructure settlement patterns in Shanghai. Engineering Geology 2021, 282, 105995. [Google Scholar] [CrossRef]
- Huang, Y.; Bao, Y. J.; and Wang, Y. Analysis of environmental hazards in urban underground space development in Shanghai. Natural Hazards 2015, 75, 2067-79
.
- 21. Yuan, Y.; Xu, Y.S.; and Arulrajah., A. Sustainable measures for mitigation of flooding hazards: A case study in Shanghai, China. Water 2017, 9, 310. [CrossRef]
- Wang, D.; Guo, X.; and Jia. Y. Analysis of land subsidence deformation caused by urban shallow-burred tunnel construction. The Open Civil Engineering Journal 2014, 8, 219-224. Available online: https://opencivilengineeringjournal.com/contents/volumes/V8/TOCIEJ-8-219/TOCIEJ-8-219.pdf. [CrossRef]
- Wu, Y.X.; Yang, T.L.; Li, P.C. and Lin, J.X. Investigation of groundwater withdrawal and recharge affecting underground structures in the Shanghai urban area. Sustainability 2019, 11(24), 7162. [Google Scholar] [CrossRef]
- Hishammuddin, M.A.H.; Wang, J.X.; Bin Ismail, M.A.; Abidin, H.Z.; Sabri, S.; Ho, C.S.; and Wong, K.Y. Adaptive, resilient urban underground space (UUS)-subsidence-economic impact spatial planning model (USEM): The extent development impact via cause-effect analysis circa 1980-2050 in Shanghai megacity. Preprints 2021, 2021120505. [Google Scholar] [CrossRef]
- Sinking cities II – example cases. 1–25. Available online: https://www.deltares.nl/app/uploads/2015/09/Sinking-cities.
- Xu, Y.S.; Shen, S.L.; Ren, D.J.; and Wu, H.N. Analysis of factors in land subsidence in Shanghai: a view based on strategic environmental assessment. Sustainability 2016, 8(6), 573. [Google Scholar] [CrossRef]
- Hishammuddin, M.A.H. and Wang J.X. Towards sustainable, resilient and adaptive urban underground space (UUS) exploration, land subsidence and economic impact spatial model (USEM) in shanghai, p.r. china: systematic reviews, model framework, initial results and pre-determined challenges. IOP Conference Series: Earth Environmental Science 2021, 861, 072-33, 1-8. Available online: 10.1088/1755-1315/861/7/072033.
- Abidin, Z.H.; Andreas, H.; Gumilar, I. Disaster risk reduction of land subsidence in Jakarta land subsidence in Indonesian cities land subsidence in Java, Conference: The 2nd International Workshop on Coastal Subsidence, Venice, Italy, 2016, 10.13140/RG.2.1.4448.9206.
- Kok, S. and Costa, A.L. Framework for economic cost assessment of land subsidence. Natural Hazards 2021, 106, 1931–1949. [Google Scholar] [CrossRef]
- Zhang, J.; Fu, M.; Chen, J.; Chu, P. ; and Zhang, Chengchun. Variations in mine subsidence-disturbed residential land price: Case study of critical determinants and spatial relationships in the Nanhu ecoregion of Tangshan, China. Journal of Urban Planning and Development 2018, 144(3), 05018012. [Google Scholar] [CrossRef]
- Wade, C. M.; Cobourn, K. M.; Amacher, G. S. and Hester, E. T. Policy targeting to reduce economic damages from land subsidence. water resources research, Water Resources Research 2018, 54 (7), 4401–4416. [CrossRef]
- Zhou, D.; Li, X.; Wang, Qi.; Wang, R.; Wang, T.; Gu, Q.; and Xin, Y. GIS-based urban underground space resources evaluation toward three-dimensional land planning: A case study in Nantong China. Tunnelling and Underground Space Technology (TUST), 2019, 84, 1–19. [Google Scholar] [CrossRef]
- Lyu, H. M.; Shen, S. L.; Zhou, A. and Yang, J. Data in risk assessment of mega-city infrastructures related to land subsidence using improved trapezoidal FAHP. Data in Brief 2020, 28, 105007. [Google Scholar] [CrossRef] [PubMed]
- Zhang, W.J; Zhang, L.M.; Wu, X.G.; Liu, Y. Risk Assessment of leakage water of tunnel construction in coastal soft soils. Advances in Economics, Business and Management Research (AEBMR) 2018, 54, 110–115. [Google Scholar] [CrossRef]
- Peng, F.L.; Qiao, Y.K.; Sabri, S.; Atazadeh, B.; and Rajabifard, A. A collaborative approach for urban underground space development toward sustainable development goals: Critical dimensions and future direction. Frontiers of Structural and Civil Engineering 2021, 15, 20–45. [Google Scholar] [CrossRef]
- The 17 Sustainable Development Goals. Available online: https://sdgs.un.org/goals (Accessed on 24th July 2021).
- Shanghai Masterplan 2017-2035. Available online: http://english.shanghai.gov.cn/newshanghai/xxgkfj/2035004.pdf (Accessed on 18th June 2021).
- Yoo, J. and Perrings, C. An externality of groundwater depletion: land subsidence and residential property prices in Phoenix, Arizona. Journal of Environmental Economics and Policy 2017, 6(2), 121–133. [CrossRef]
- Multiple regression. Available online: https://www.sciencedirect.com/topics/social-sciences/multiple-regression. (Accessed on 25th July 2021).
- Fishbone diagram. Available online: https://asq.org/quality-resources/fishbone. (Accessed on 27th March 2021).
- Wu, H.N.; Shen, S.L. and Wu, J.Y. Identification of tunnel settlement caused by land subsidence in soft deposit of Shanghai. Journal of Performance of Constructed Facilities 2017, 31(6). [CrossRef]
|
Disclaimer/Publisher’s Note: The statements, opinions and data contained in all publications are solely those of the individual author(s) and contributor(s) and not of MDPI and/or the editor(s). MDPI and/or the editor(s) disclaim responsibility for any injury to people or property resulting from any ideas, methods, instructions or products referred to in the content. |
© 2023 by the authors. Licensee MDPI, Basel, Switzerland. This article is an open access article distributed under the terms and conditions of the Creative Commons Attribution (CC BY) license (http://creativecommons.org/licenses/by/4.0/).
 represents the overlay analysis in GIS platform.
 represents the overlay analysis in GIS platform.
