1. Introduction
Age-related Macular Degeneration (AMD) is a neurodegenerative eye disease, which is one of the most common ophthalmic causes of vision loss in the elder groups[1, 2]. Around 9.7% of global loss of vision cases are related to AMD[
3]. Causes involve ages, genes, habits, and environments. Diagnosis based on OCT images and fundus photographs are is major solution for AMD detection[4, 5].Evidence for AMD detections are majorly extracted from regular color fundus photography(CFP)[1, 5-7], Fundus Autofluorescence(FAF)[
8], Fundus fluorescein angiography(FFA){Zhang, 2022 #742}, Infrared Imaging(IR)[
9], Spectral-domain Optical Coherence Tomography(OCT)[
10], Optical Coherence Tomography Angiography (OCT-A)[
11], Scanning Laser Ophthalmoscopy(SLO)[
12] and Ultra-Widefield Fundus (UWF) [
13]. The macular epiretinal membrane (MEM)[
14], retinal fluid accumulation[
15], subretinal accumulation[
16], subretinal hyperreflective material (SHRM)[
17], vitreous warts (drusen)[
18] and retinal detachment epithelium [
19] are the typical quantitative symptoms based on OCT images. When it comes to FAF, regular CFP and UWF, 13 potential symptoms may be able to be discovered, which are the vitreous membrane verruca/wart[
20]; 2) focal hyperpigmentation[
21], MEM[
14],choroidal neovascularization (CNV) in macular area [22, 23], complete circular scotoma (completely black ring circle)[
24], retinal pigment epithelial(RPE) detachment [
25], subthreshold exudative choroidal neovascularization[
26], intra-/sub-retinal hemorrhage [
27], large choroidal vessels and deep capillary plexus vessel in the macular region and glial scar tissue in the perimacular area[5, 28], hemorrhagic spots and vitreous debris in the macular area[
29], subretinal hemorrhage with residue in the perimacular region[1, 5], glial scar in the macular region[
30] and temporal margin hemorrhage residue in the macular region[1, 5, 31]. However, it is time-consuming for ophthalmologists to detect AMD manually. AMD patients of the early stage are difficult to be detected by AI methods because of the complexity of diagnosis based on fundus images, the lack of ophthalmologists, and the shortage of ophthalmic equipment, especially in developing areas.
Artificial Intelligence (AI) technologies have been widely applied to ophthalmology fields, Jin et al.(2022)[
32], Ma et al.(2022)[
33], and Kafdry et al. (2022)[
34] have proposed that network-based deep learning (DL) and machine learning (ML) algorithms have great performances for AMD early screening and prognosis[35, 36]. It presents advanced strengths and delivers opportunities for AMD detection with the limited resource. The algorithms of classification and segmentations based on multiple types of ophthalmic image are increasingly to be paid attention to during the recent years[32, 37]. However, issues of clinical data collections, ethical approvals, algorithm performance enhancements and optimizations of accuracy, robustness and explainability, labeled data enhancements, automatic key-feature extractions of ophthalmic images and feature normalizations are still challenges for AI applied to ophthalmology theoretically and practically. Thereby, solutions related to the challenges above are explored and deep collaborations of interdisciplinary scholars are performed in this study.
Thus, this study designed a multi-type data fusion-based method and a multi-model fusion-based approach for AMD diagnosis. Proposed methods are compared to state-of-the-art algorithms, including typical unsupervised ML models of Hierarchical Clustering (HC)[
38] and K-Means[
39], typical supervised learning models of Support Vector Machines (SVM)[
40], VGG16[
41], and ResNet50[
42]. The multi-type data fusion-based ML model is implemented based on automatic feature extraction models and the multi-layer perceptron (MLP) algorithm[
43]. The multi-model fusion-based approach is designed based on supervised AI models and the voting mechanism[
44].
2. Materials and Methods
This study utilized four types of ophthalmic digital images for AMD detections, which are OCT, FAF, Regular CFP, and UWF. Image cluster algorithms of HC and K-Means, classification algorithms of SVM, VGG16, ResNet50 and the proposed models are performed on the four types of datasets.
2.2. Methods
Data preprocessing is performed on datasets of OCT, FAF, regular CFP, and UWF respectively. Tools of Python. Pytorch, Cuda, and double GPU version of 3060Ti are utilized in this study. Four kinds of AMD diagnosis methods are explored in this research, which are (1) unsupervised learning methods of HC and K-Means, (2) supervised learning methods of SVM, VGG16, and ResNet50, (3) proposed multi-source data-based fusion method based on image feature extraction models and MLP algorithms, (4) proposed multi-model fusion-based approach based on supervised learning methods (2) and the voting mechanism.
2.2.1. Data Preprocessing
A. Data Preprocessing on OCT Dataset
There are 3000 (AMD) and 29347 (normal) figures included in the original dataset, the format is portable network graphics (PNG).
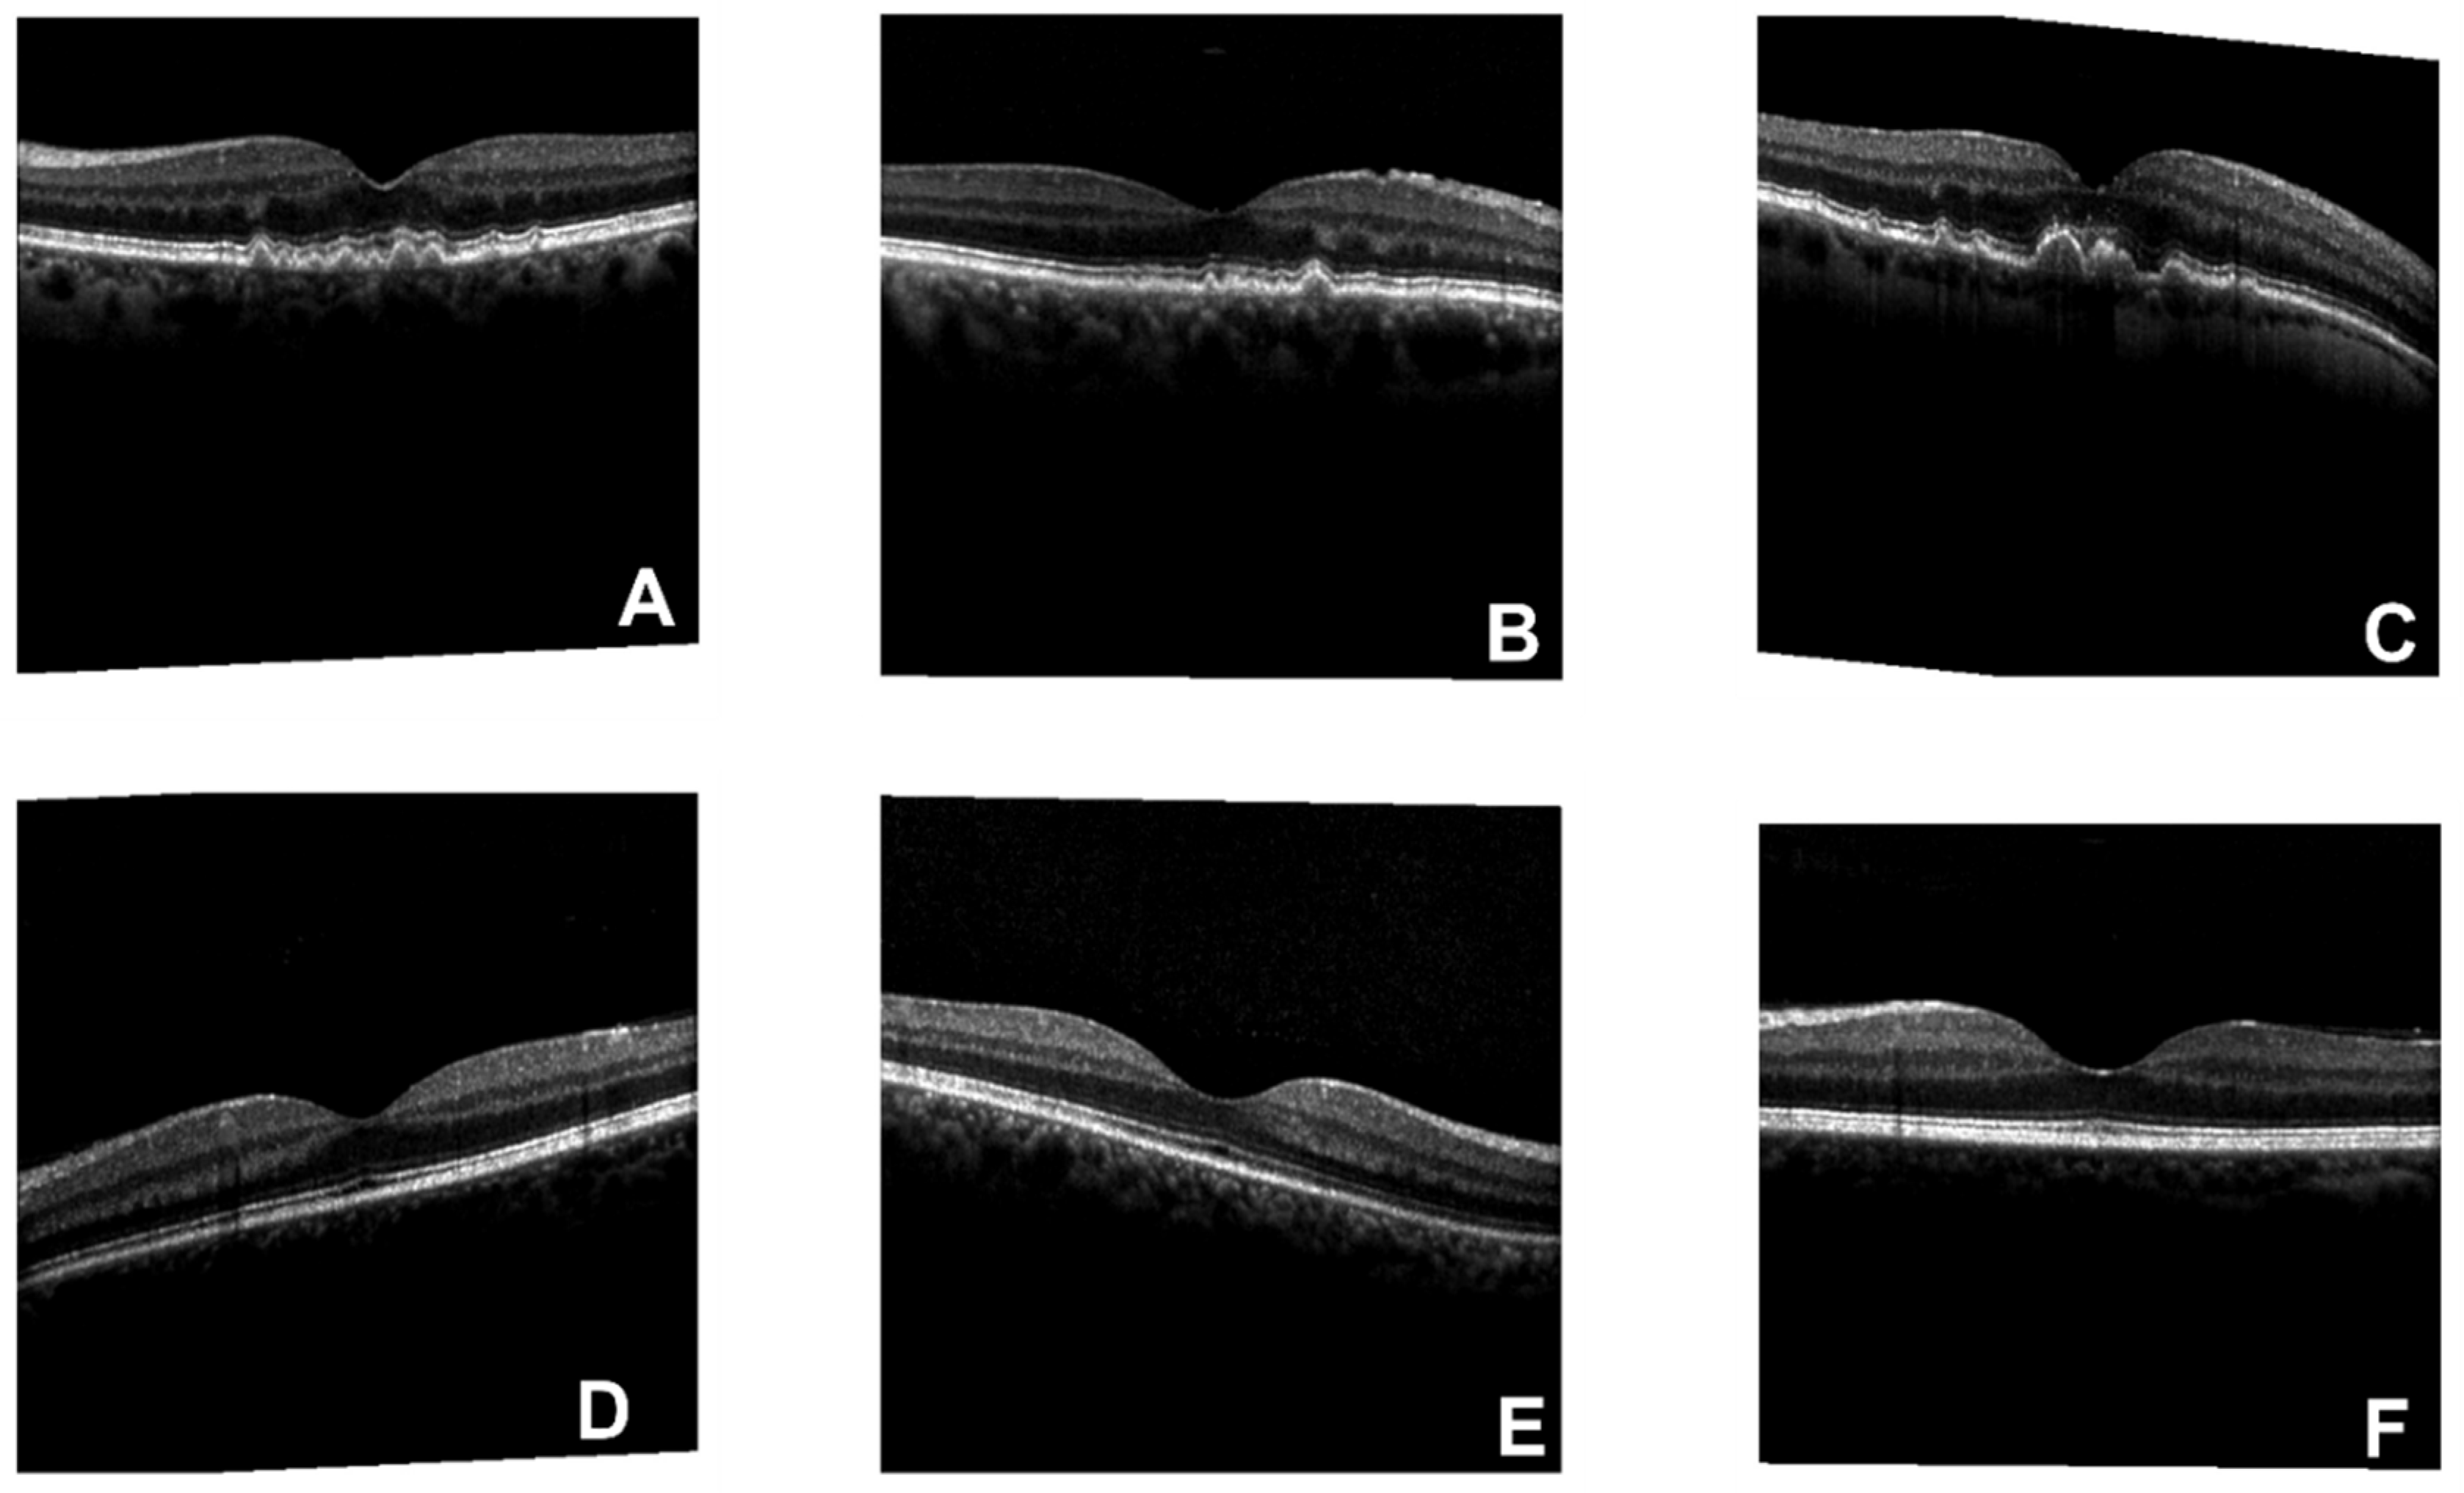
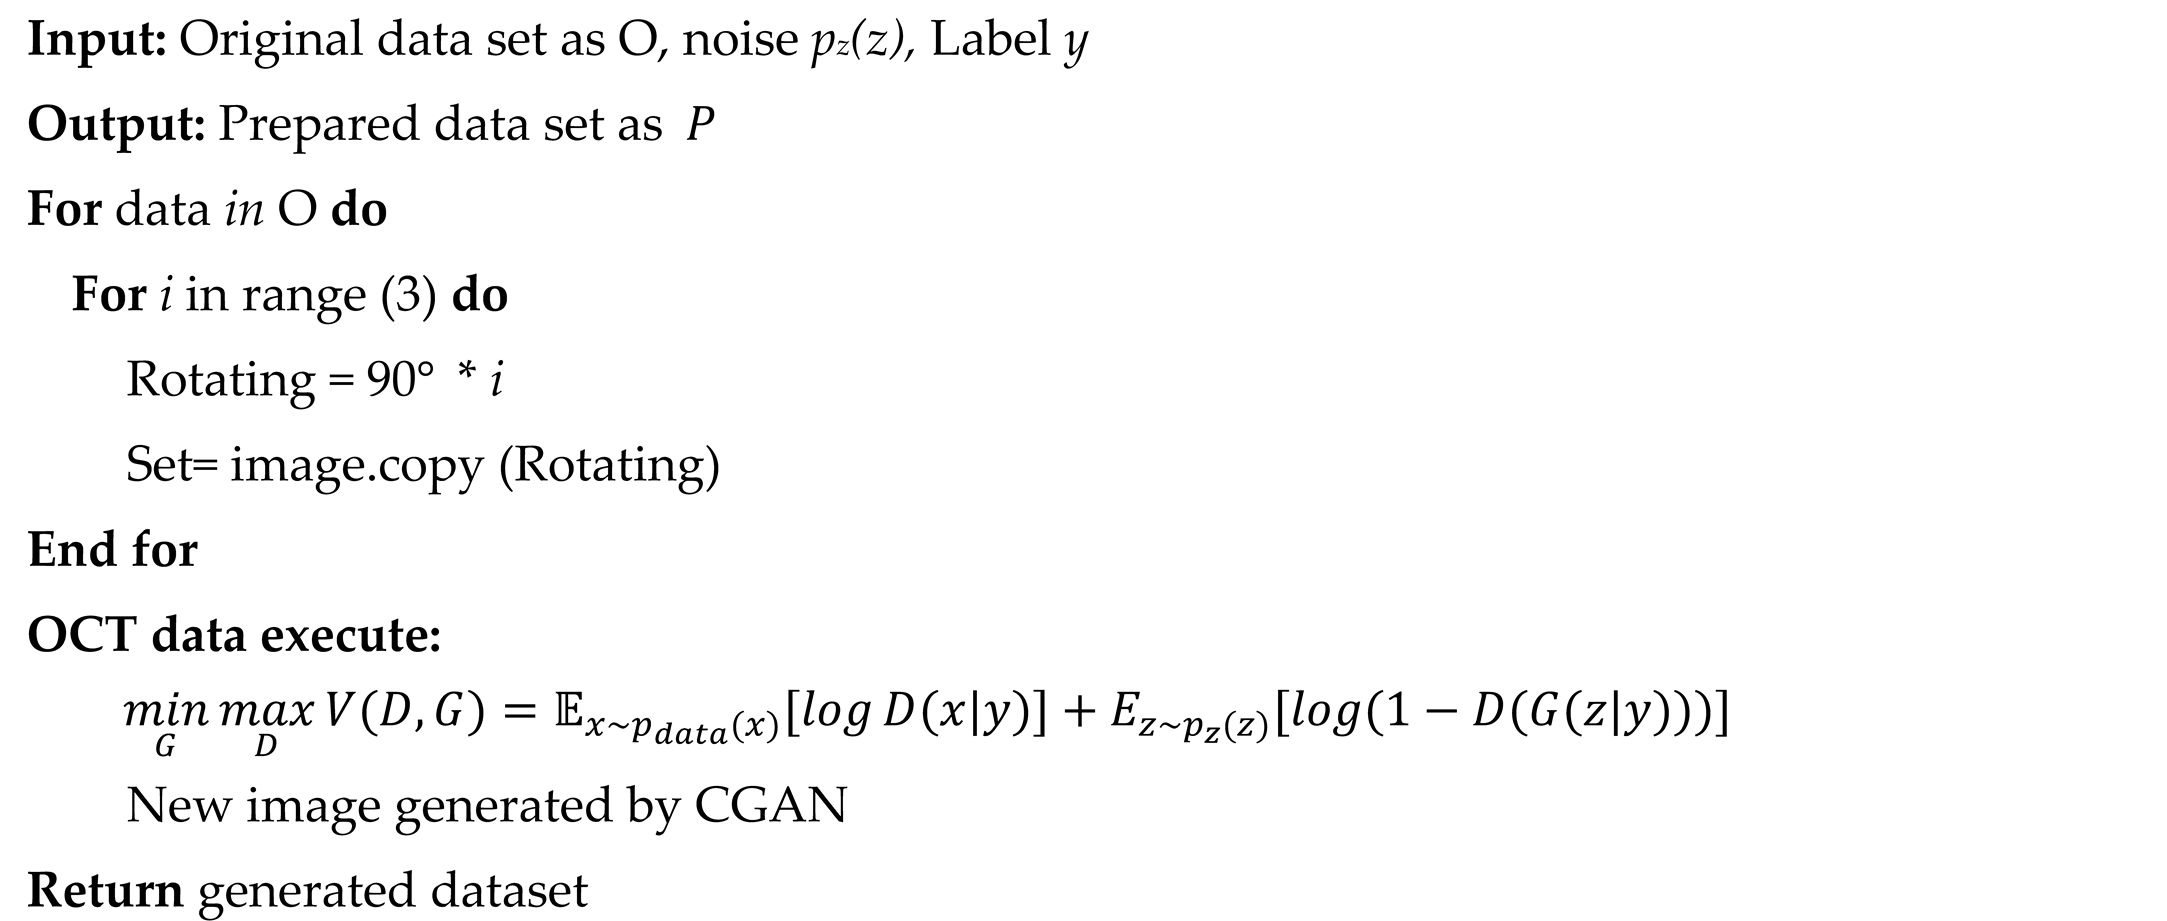
Figure 1 is an example of OCT original figures, where A, B, and C are related to AMD cases, and D, E, and F belong to normal clusters. The symptom of drusen is presented in AMD images. To solve the imbalance issue between the numbers of negative(29347) and positive(3000) subjects in the training dataset, a data enhancement process is performed on the AMD pictures, which includes image rotating[
44] and data generation based on Conditional Generative Adversarial Network (CGAN)[
50]. Rotation is a vital method for data volume enhancement and model robustness enhancement [
44], which is also an effective way to avoid overfitting. GGAN is an effective way for data enhancement, especially for medical image generation [
50]. CGAN was proposed by Mirza and Osindero in 2014 [
51]. Compared to the normal GAN networks, the generator exhibits higher efficiency with extra information of classification labels
. As the following formula shows, the objective function of the mini-max game between the generator and discriminator is the key to CGAN [
51]. Besides, to enhance the data quality, a noise-removing process of salt and pepper noise (SPN) filtering is performed on the generated figures[
52]. The size of OCT images is resized as 512×512. In the end, after the confirmation and filtering by three ophthalmologists, the effectively generated AMD images are saved into the training database.
The preprocessed OCT dataset is still with a lot of noisy information for AMD detection, which could cost a long time before models learn the significant features. Thus, a feature extraction algorithm based on correlation-based Feature Selection (CFS)is performed on the preprocessed OCT database, which is regarded as the “OCT” database in this paper, and the generated results are regarded as the “segmented OCT” database. A comparison study of the AMD detection performances between the OCT data and segmented OCT database is performed.
B. Data Preprocessing on FAF Dataset
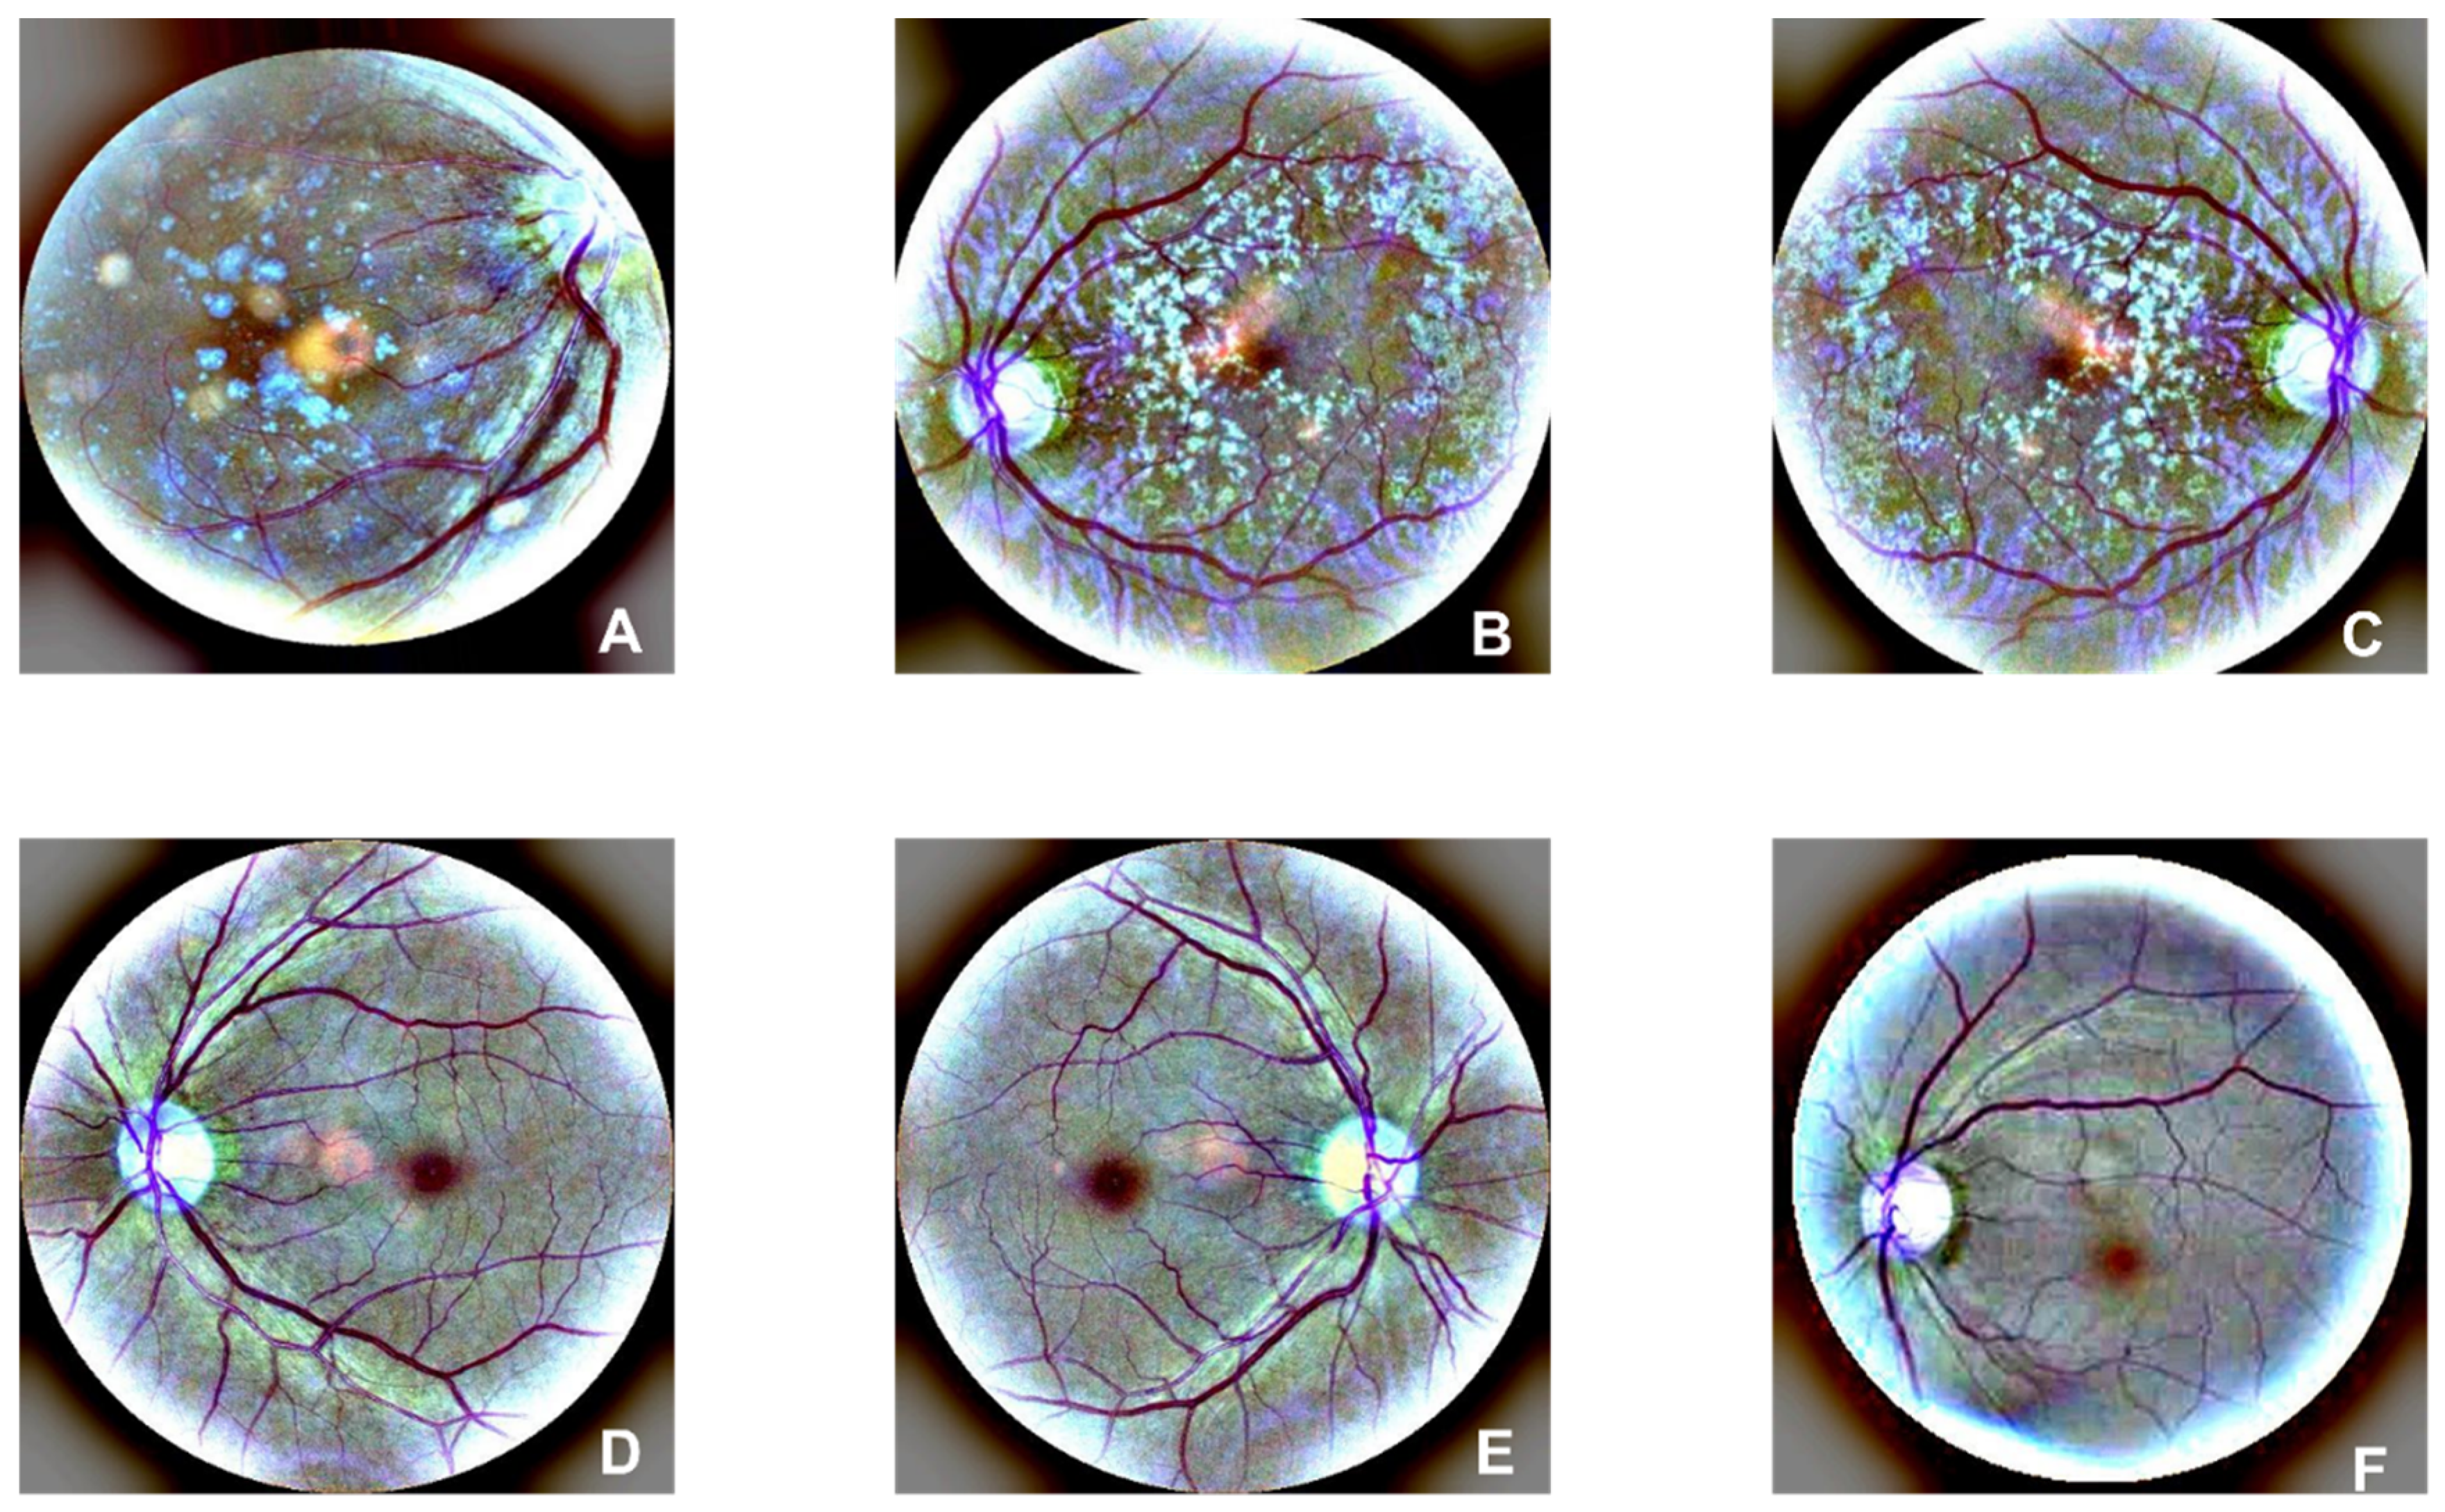
There are 1947 AMD and 2874 normal images in the FAF dataset. Examples of AMD (A, B, and C) and normal (D, E, and F) are illustrated in
Figure 2. Drusen and CNV emerged in AMD images. According to the former research, there is a 0.083-21.69% reported rate of adverse reactions, and the rate of deaths is 1:100,000 to 1:220,000[
54]. Furthermore, rotating is performed on the dataset to enhance the size of the dataset.
C. Data Preprocessing on Regular CFP Dataset
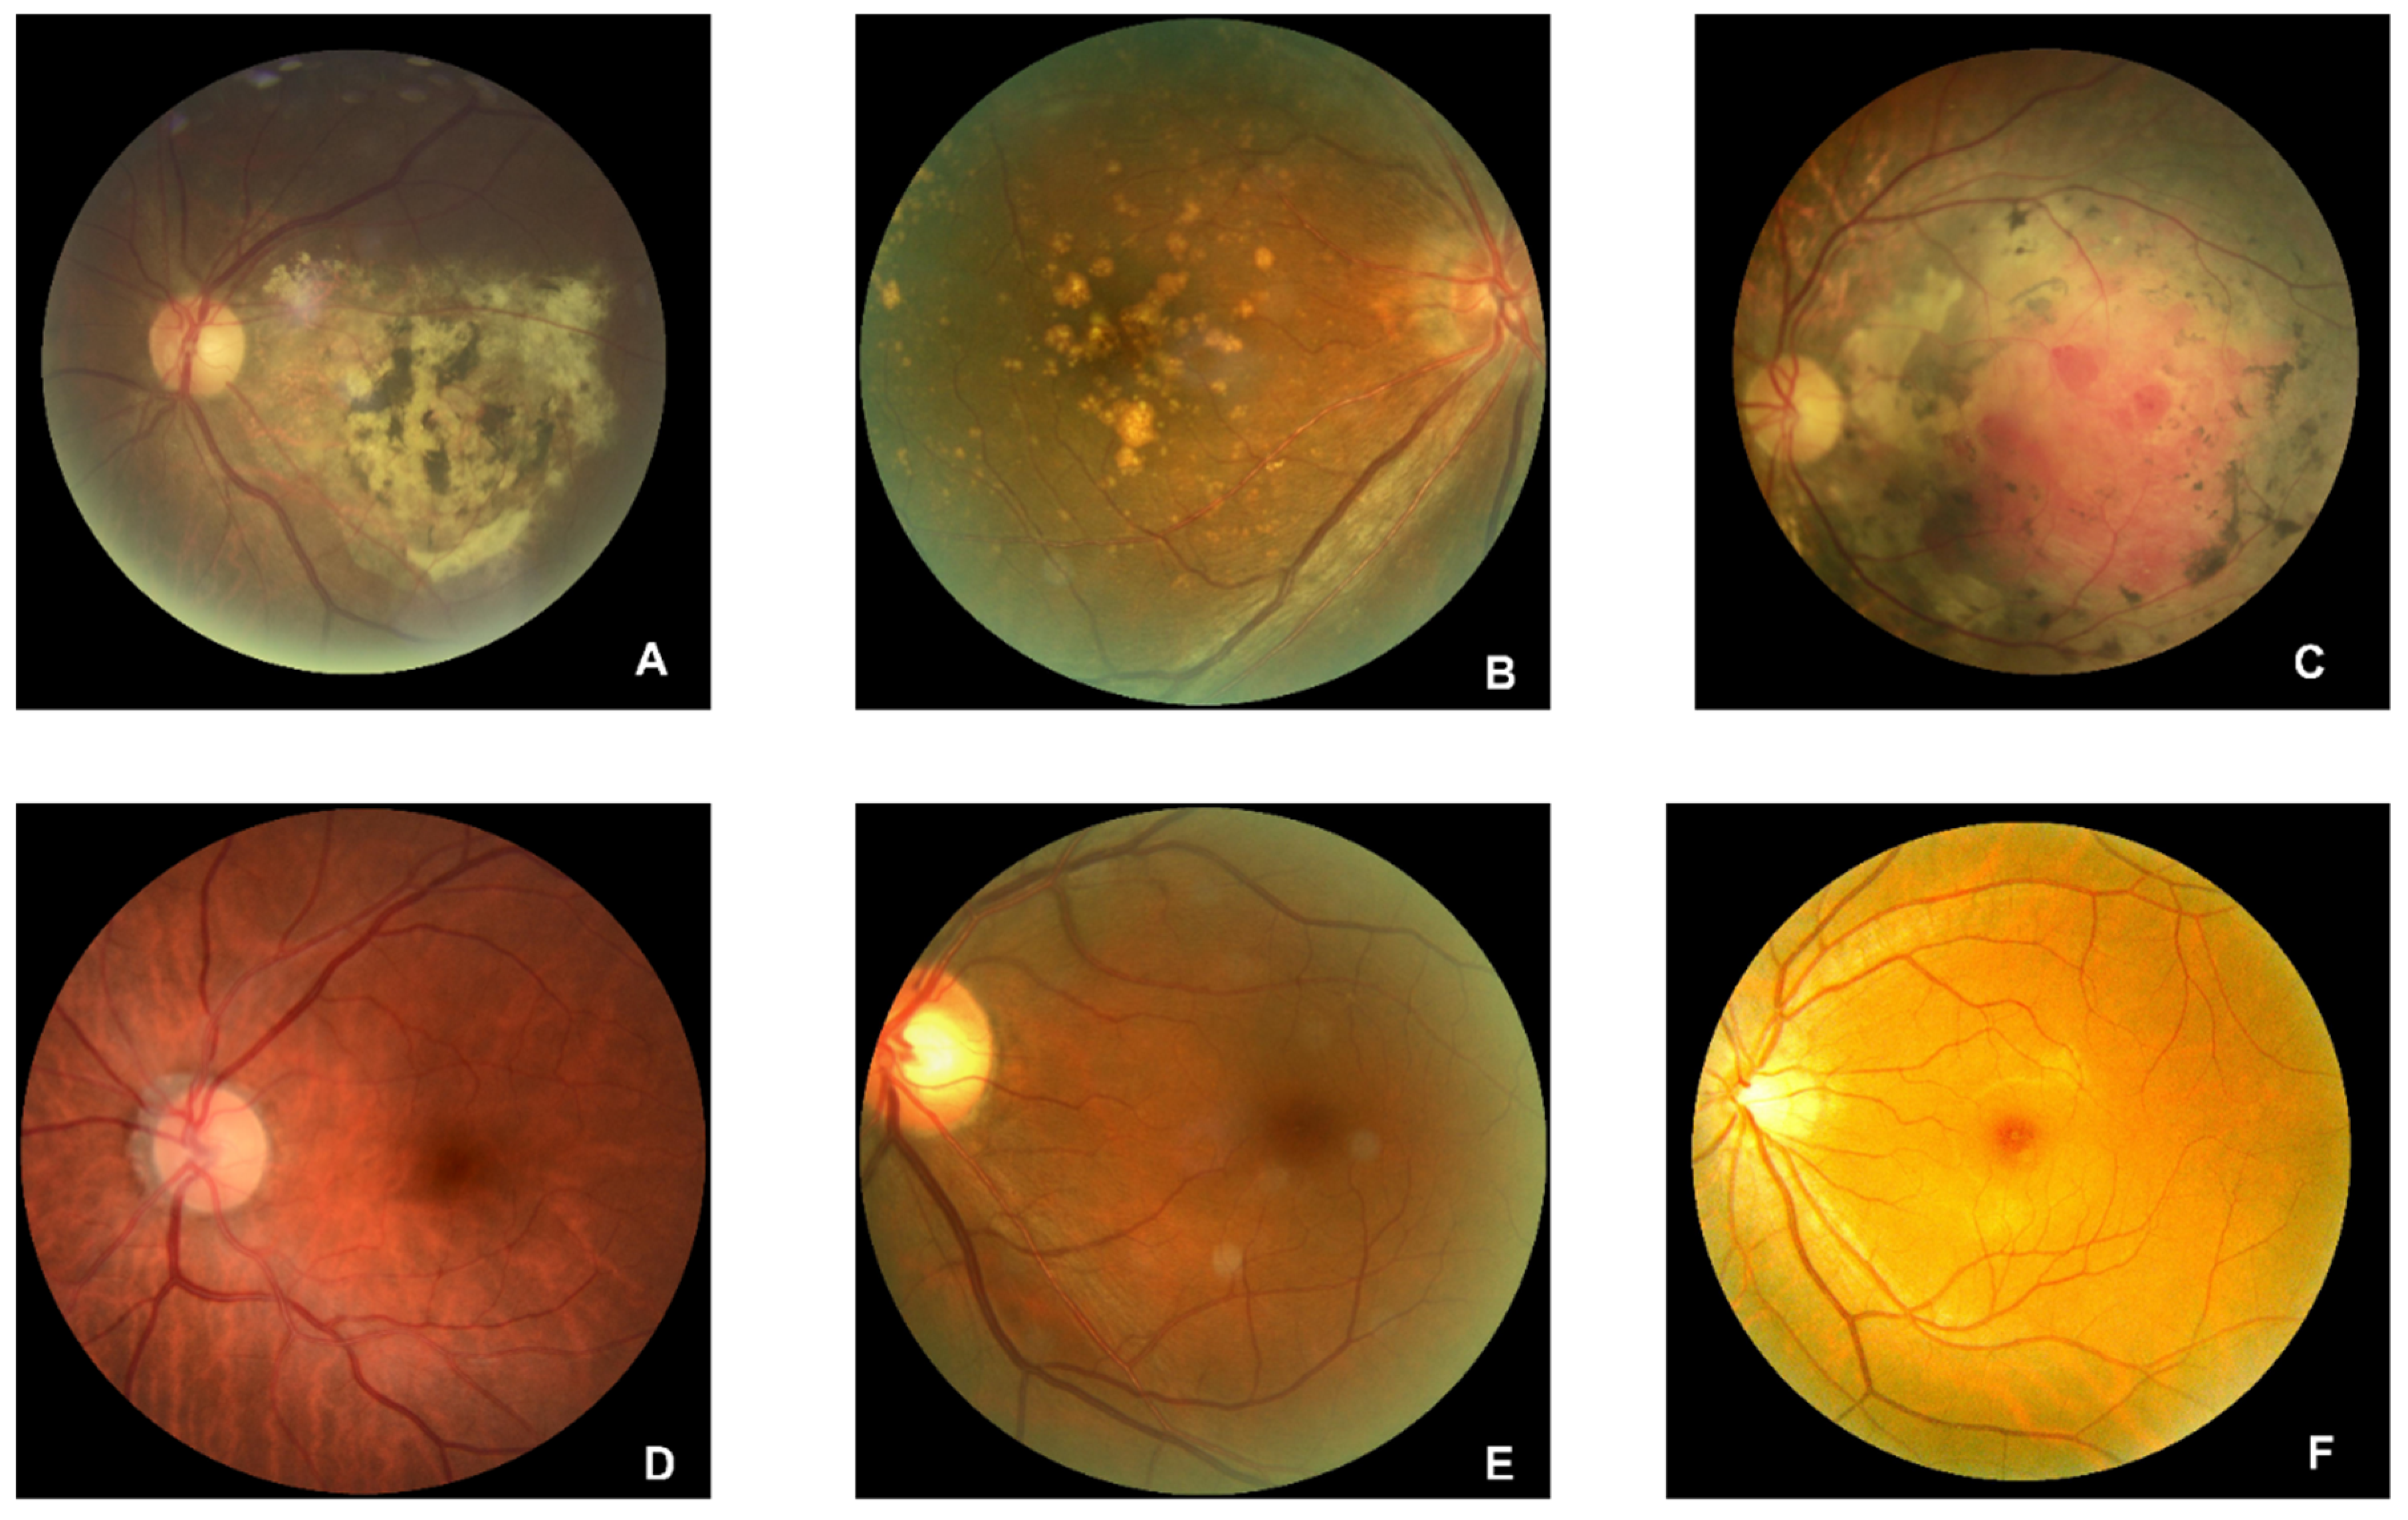
445 AMD and 2874 normal regular CFP original images are collected from open sources. Examples of AMD (A, B, and C) and normal (D, E, and F) are illustrated in
Figure 3. The drusen are clearly illustrated in A and B, and symptoms of hemorrhagic spots, vitreous debris, and subretinal hemorrhage with residue in the perimacular region are presented in subfigure A. Subfigure C shows symptoms of large choroidal vessels and deep capillary plexus vessel in the macular region and glial scar tissue in the perimacular area. Preprocessing of rotating and SPN noise-adding are performed on the AMD regular CFP images.
D. Data Preprocessing on UWF Dataset
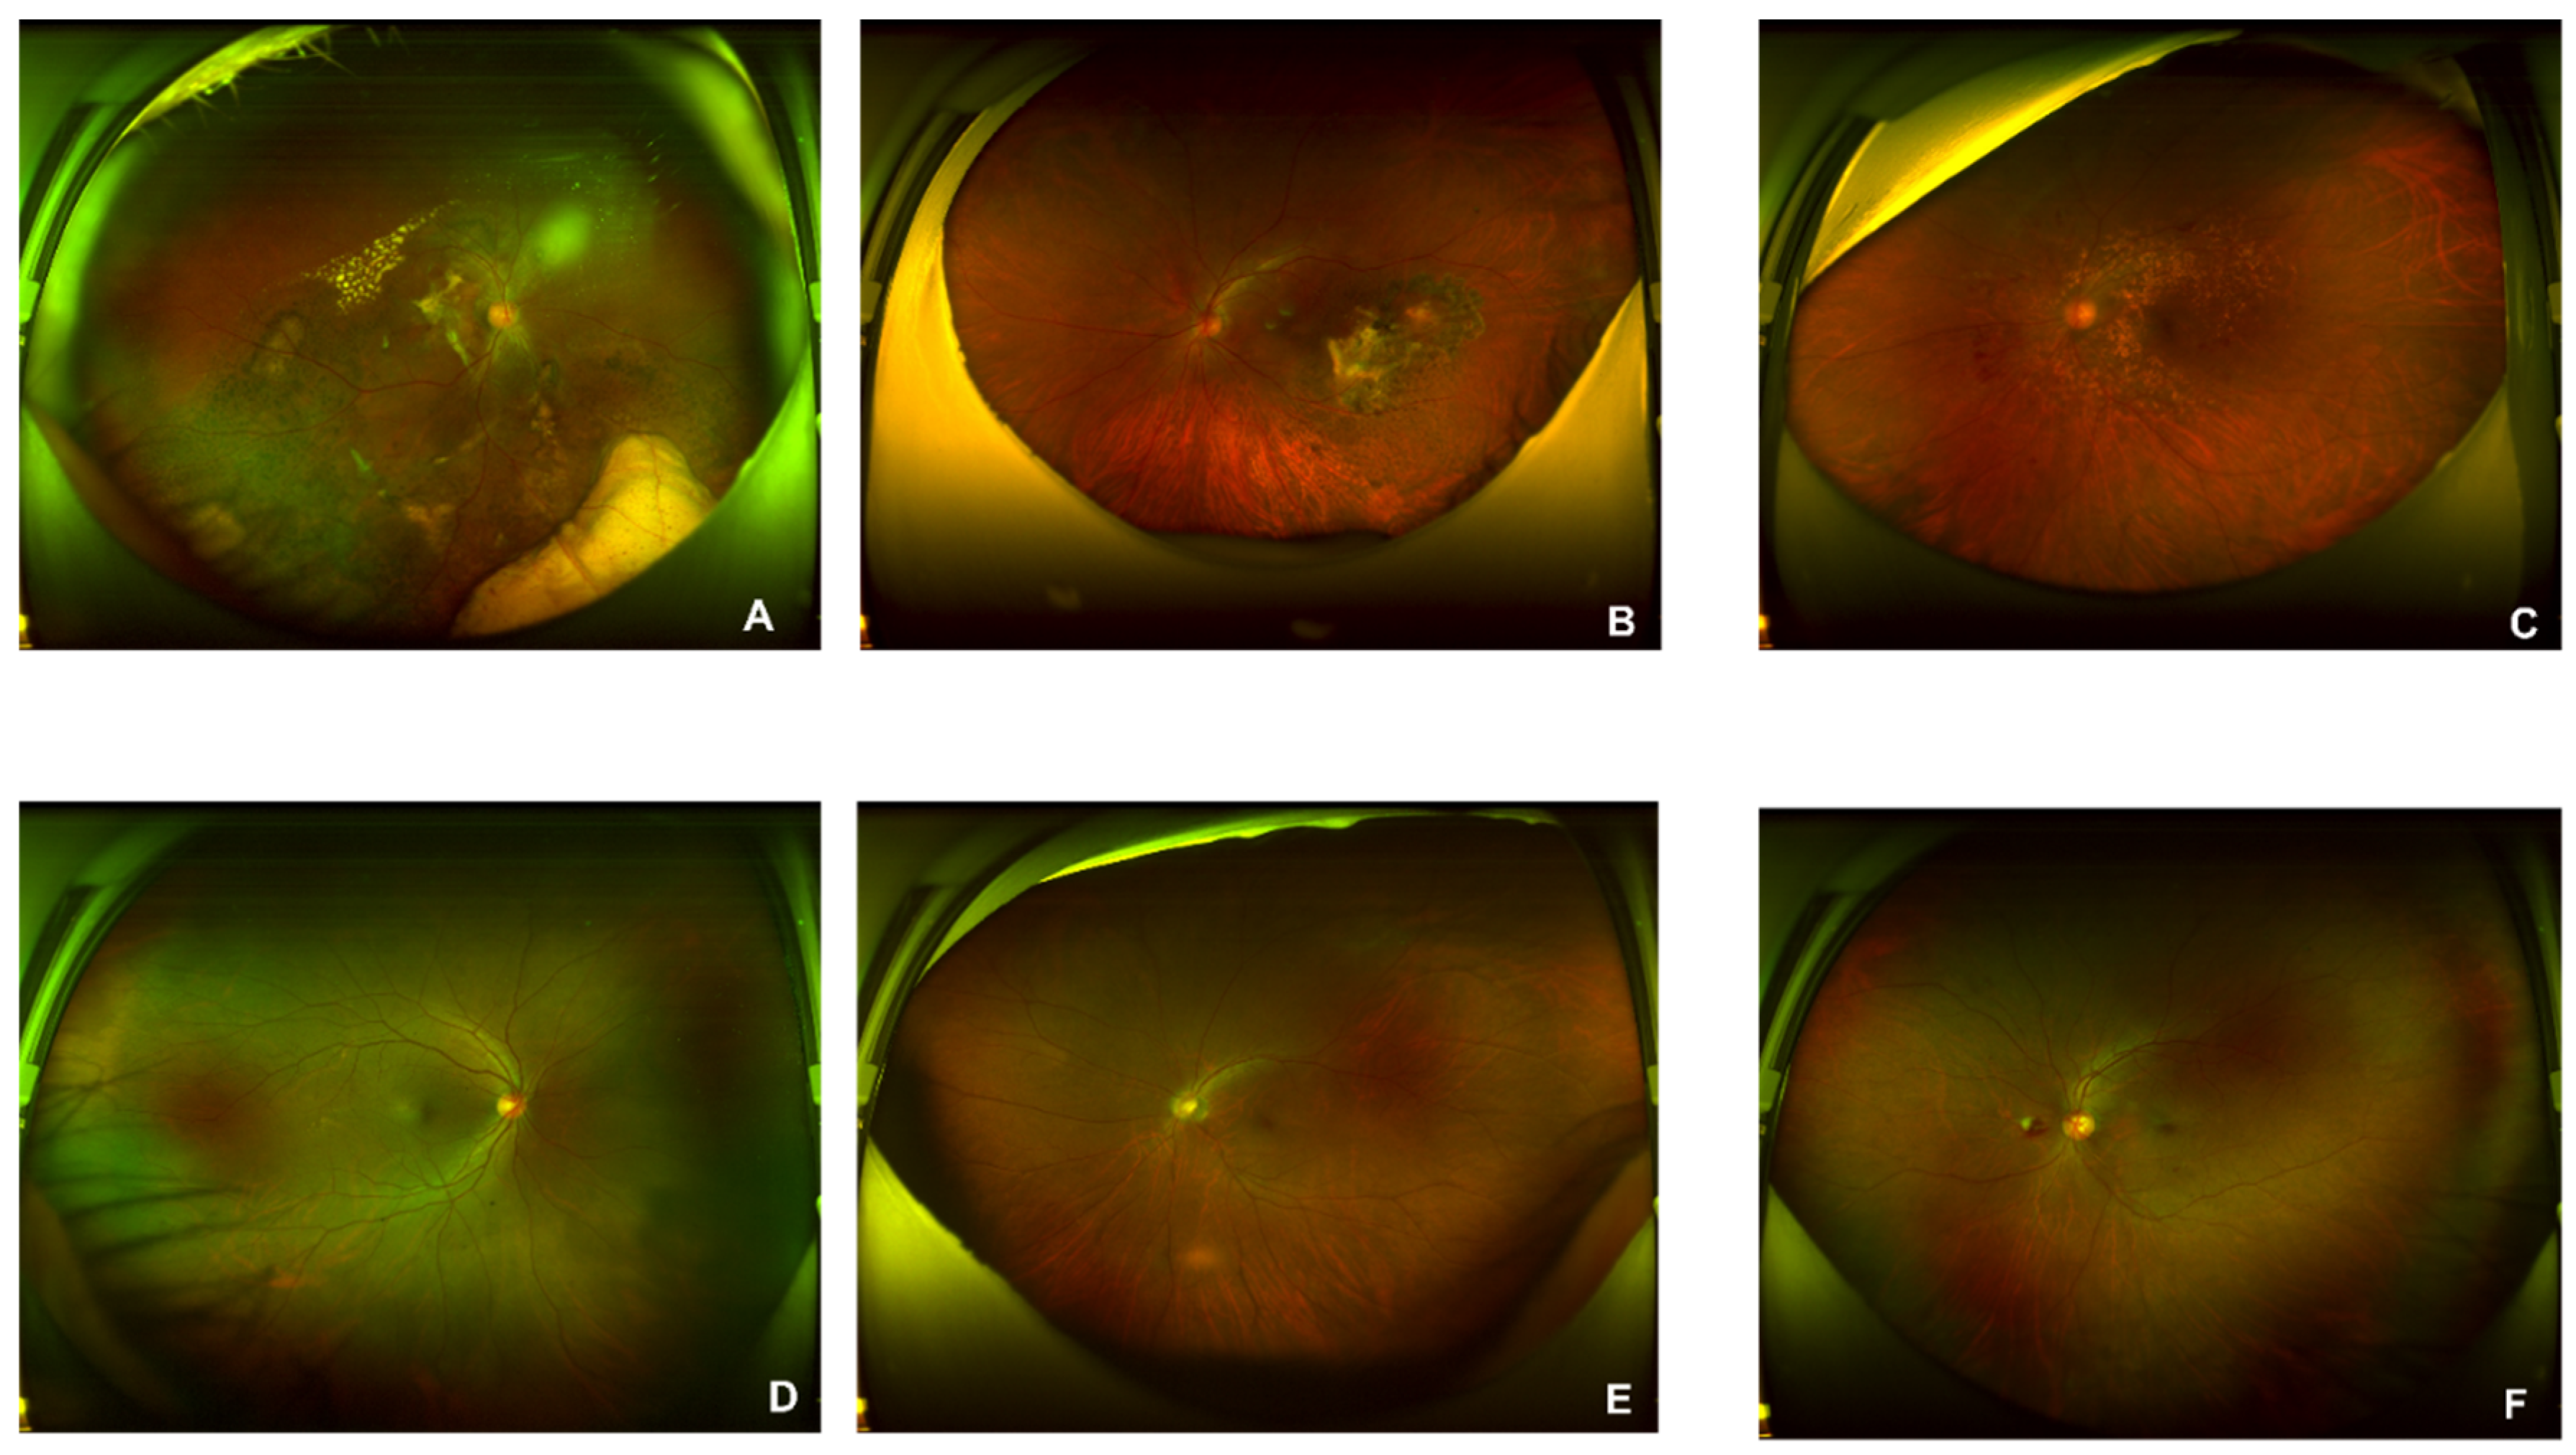
1100 AMD and 1200 normal original figures of UWF are collected. Examples of AMD (A, B, and C) and normal (D, E, and F) are illustrated in
Figure 4. The drusen are observed in subfigures of A and B. The symptom of CNV is illustrated in A and C. The subfigure of C also presents a lesion of intra-/sub-retinal hemorrhage. Since the size of the original UWF is large, a high level of computing and room-saving is requested. There are associated non-threatening pathologic signs in the peripheral retina of AMD eyes[
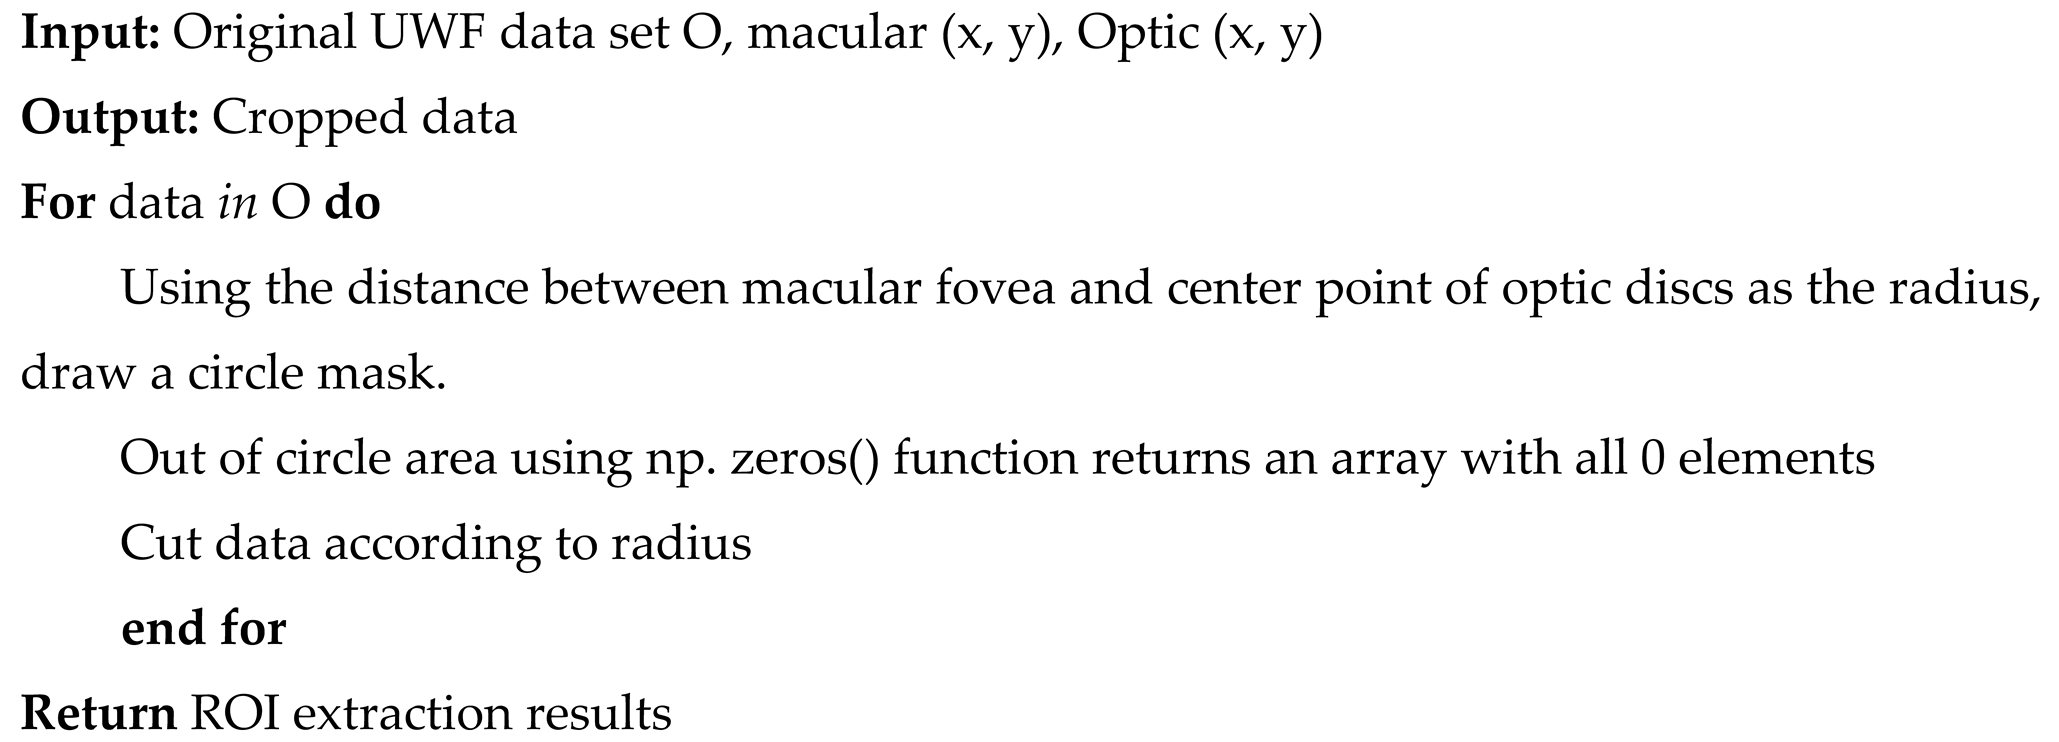
55]. During the training process of ML/DL models, key features are easy to be ignored, or wrong features could be captured, leading to prediction outcomes with low accuracy. Thus, to higher the precision and save time and resources, this study extracted the region of interest (ROI) of UWF for AMD classification tasks. This ROI is defined as the area with the fovea as the center and the distance from the center of the optic disk (OD) to the fovea as the radius[
37]. The fovea and OD centers have been located in the authors’ former research[
37]. The pseudocode of ROI extraction is illustrated as algorithm 1. Preprocessing of rotating and additive noise performance based on SNP rules are parsed on the AMD UWF images.
|
Algorithm 1: ROI extraction for UWF images |
 |
2.2.2. AMD Detection Methods
This study performs an AMD detection task on unsupervised learning models, supervised learning models, and proposed fusion models. The unsupervised learning models include Hierarchical clustering (HC) and K-Means. Supervised learning models include Support Vector Machines (SVM), VGG16, and ResNet. A multi-type data fusion-based method and a multi-model fusion-based approach are proposed in this study. The multi-type data fusion-based method is an ML model based on automated feature extraction algorithms and the MLP network prediction model, which aims to improve accuracy by detecting AMD based on four types of datasets. The multi-model fusion-based model is a method integrating the results of 3 supervised ML/DL models of SVM, VGG16, and ResNet by using the voting mechanism.
AMD (50%) and normal (50%) datasets are included for unsupervised methods. 400 images (AMD: 50%, Normal:50%) are randomly selected for testing respectively. The non-test data are segmented by 3:1 for training and verifying for supervised learning models.
A. Typical Unsupervised Learning Methods for AMD Detection
Hierarchical clustering(HC)[
56] and K-means[
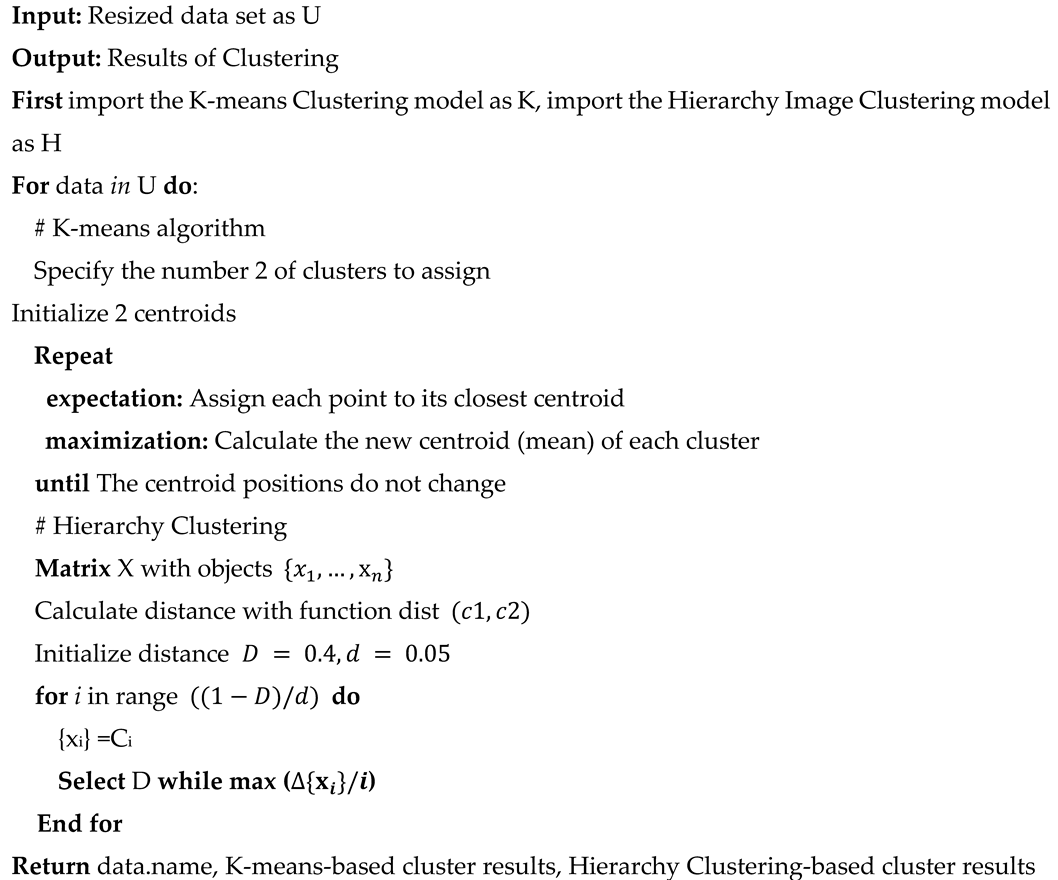
57] are the most typical models for ophthalmologic disease identifications. As the pseudocode of algorithm 2 shown, this study utilized HC and K-means algorithms for AMD diagnosis by setting the number of clustering of two. The advantages of unsupervised learning methods are timesaving and resource-saving, which is also a profound solution for feature extraction and insight exploration for practical applications. However, it is unexplainable and unable to control when it comes to medical diagnosis. There may be no output when it is clustered into specific required classes. Unsupervised approaches with low levels of trustworthiness and efficiency make this method difficult for medical applications. This study utilizes HC and K-Means to cluster images into two classes, compares with labels (AMD/Normal), and identifies the highest accuracy rate as the precision performance of the unsupervised learning models. The parameter of HC is identified as the following (0.645*tree. distance). Parameters of K-Means are identified as the following (Input images are resized as 224*224, and the number of clusters is set as 2).
|
Algorithm 2: The unsupervised learning AMD prediction system |
 |
B. Typical Supervised Learning Methods
Support Vector Machines(SVM)[
58], VGG16[
59], and ResNet[
60] based on a single database of OCT images[
59], Regular CFP[
61], FAF[
60], and UWF[
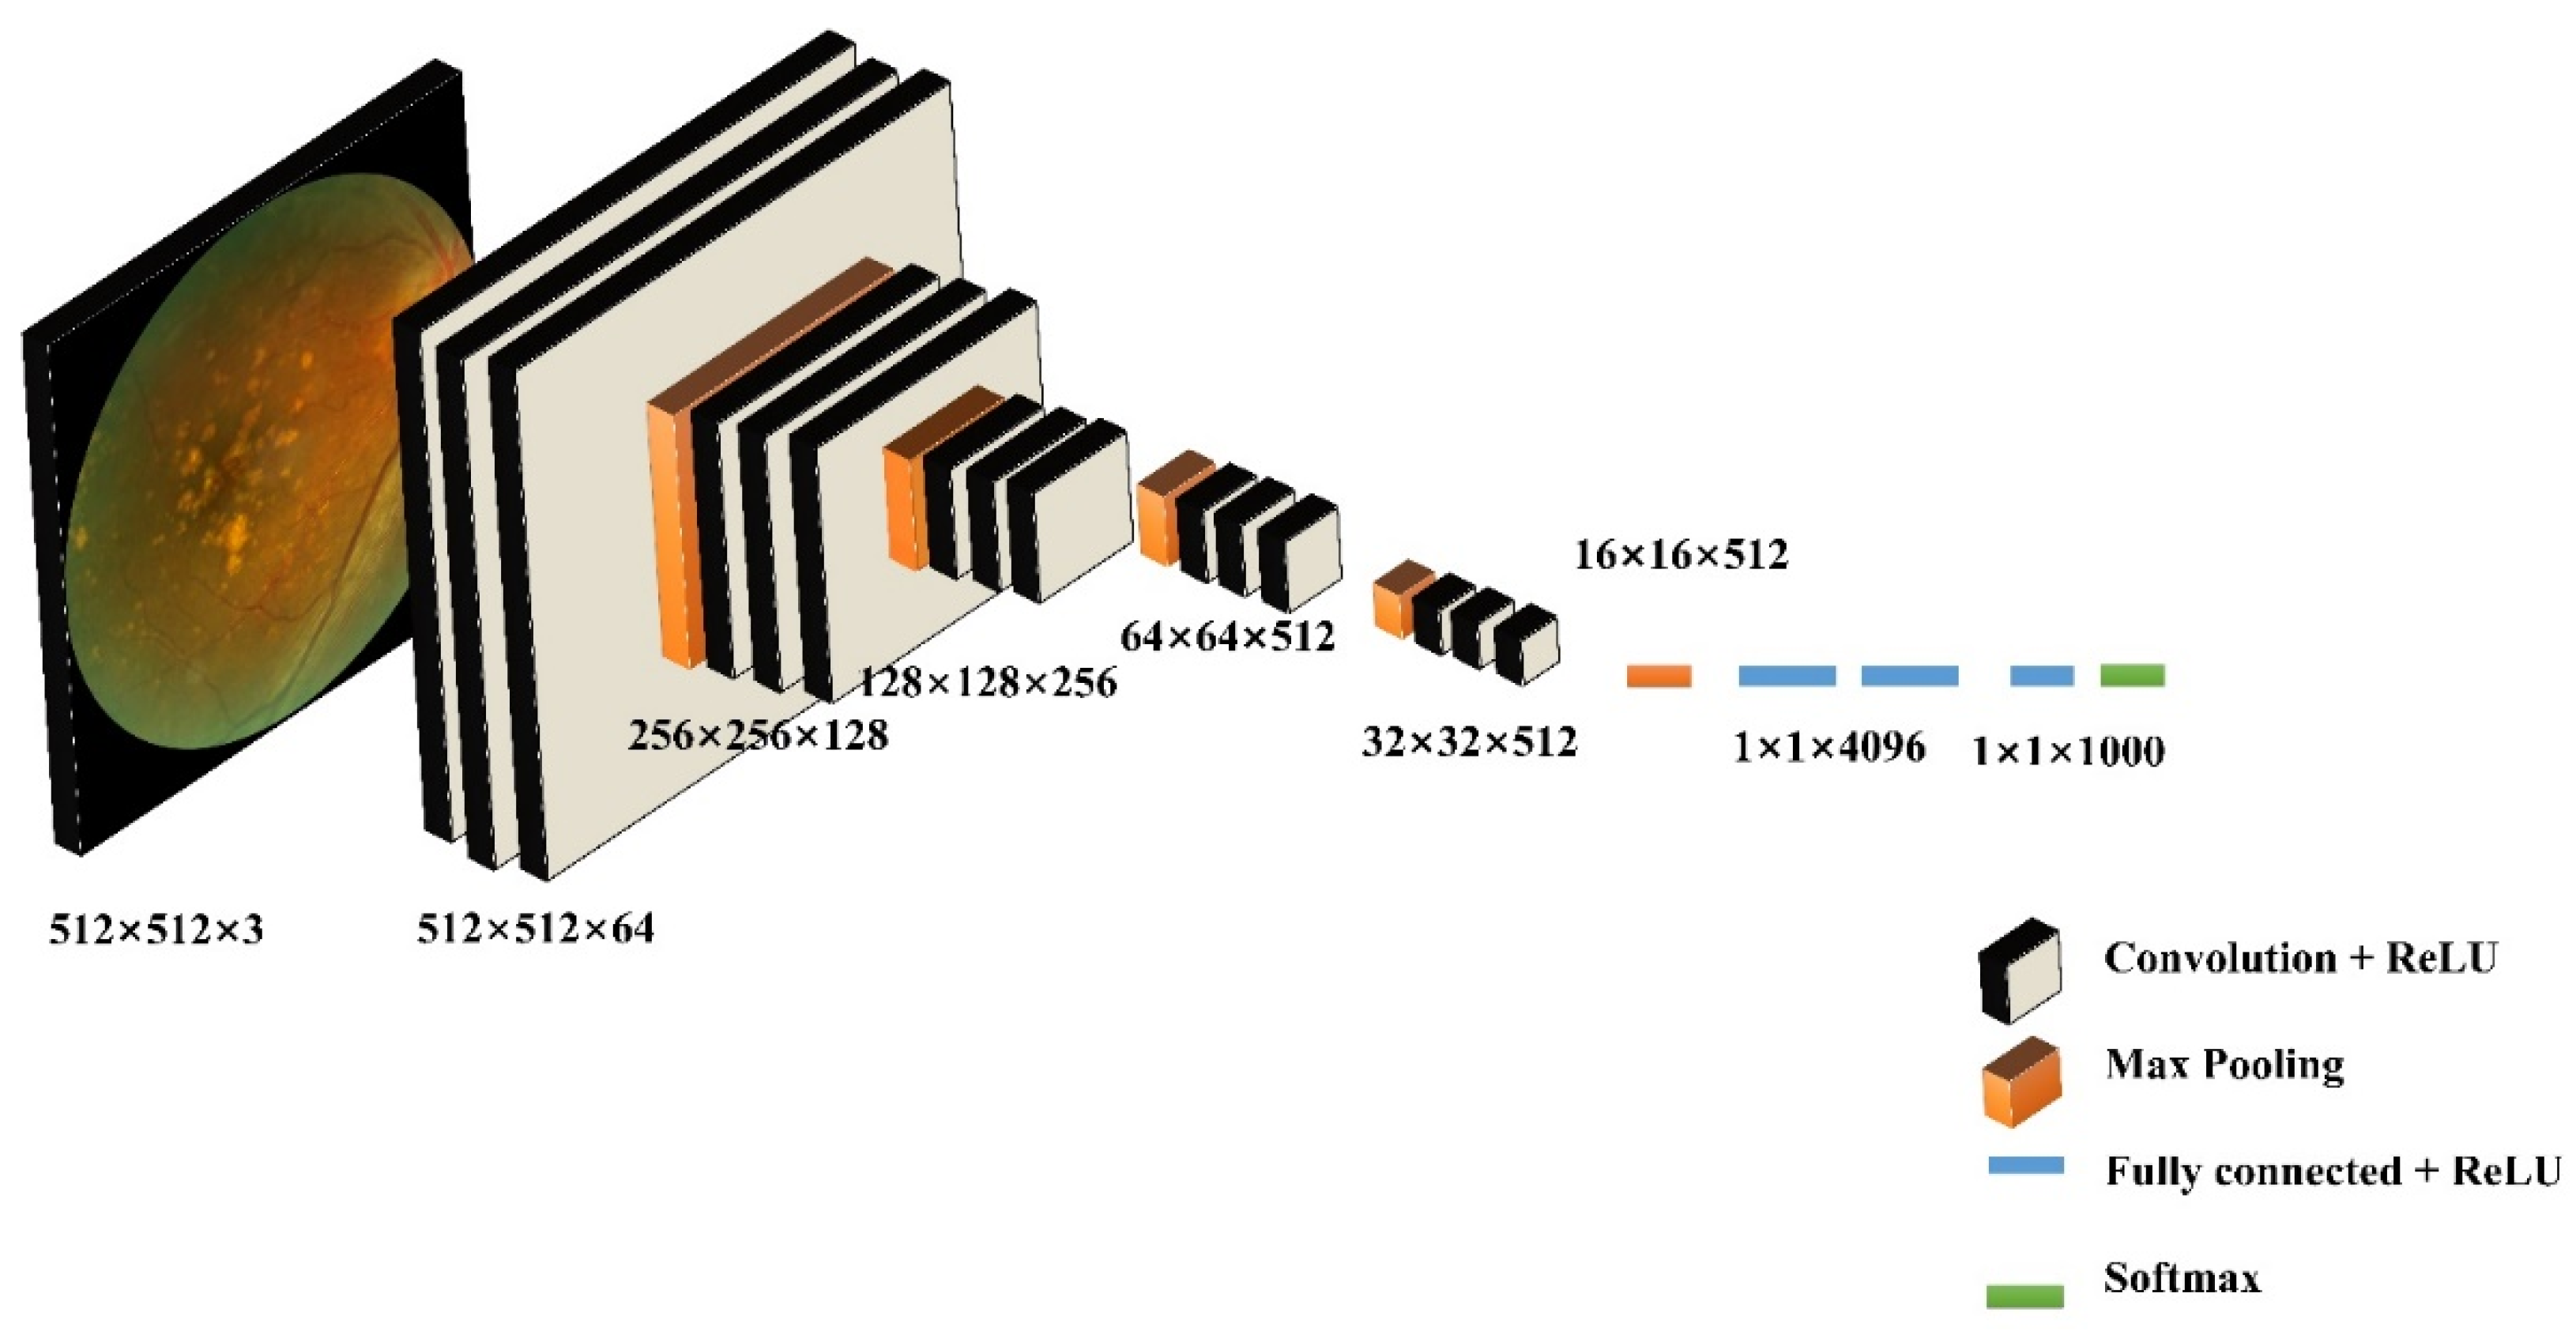
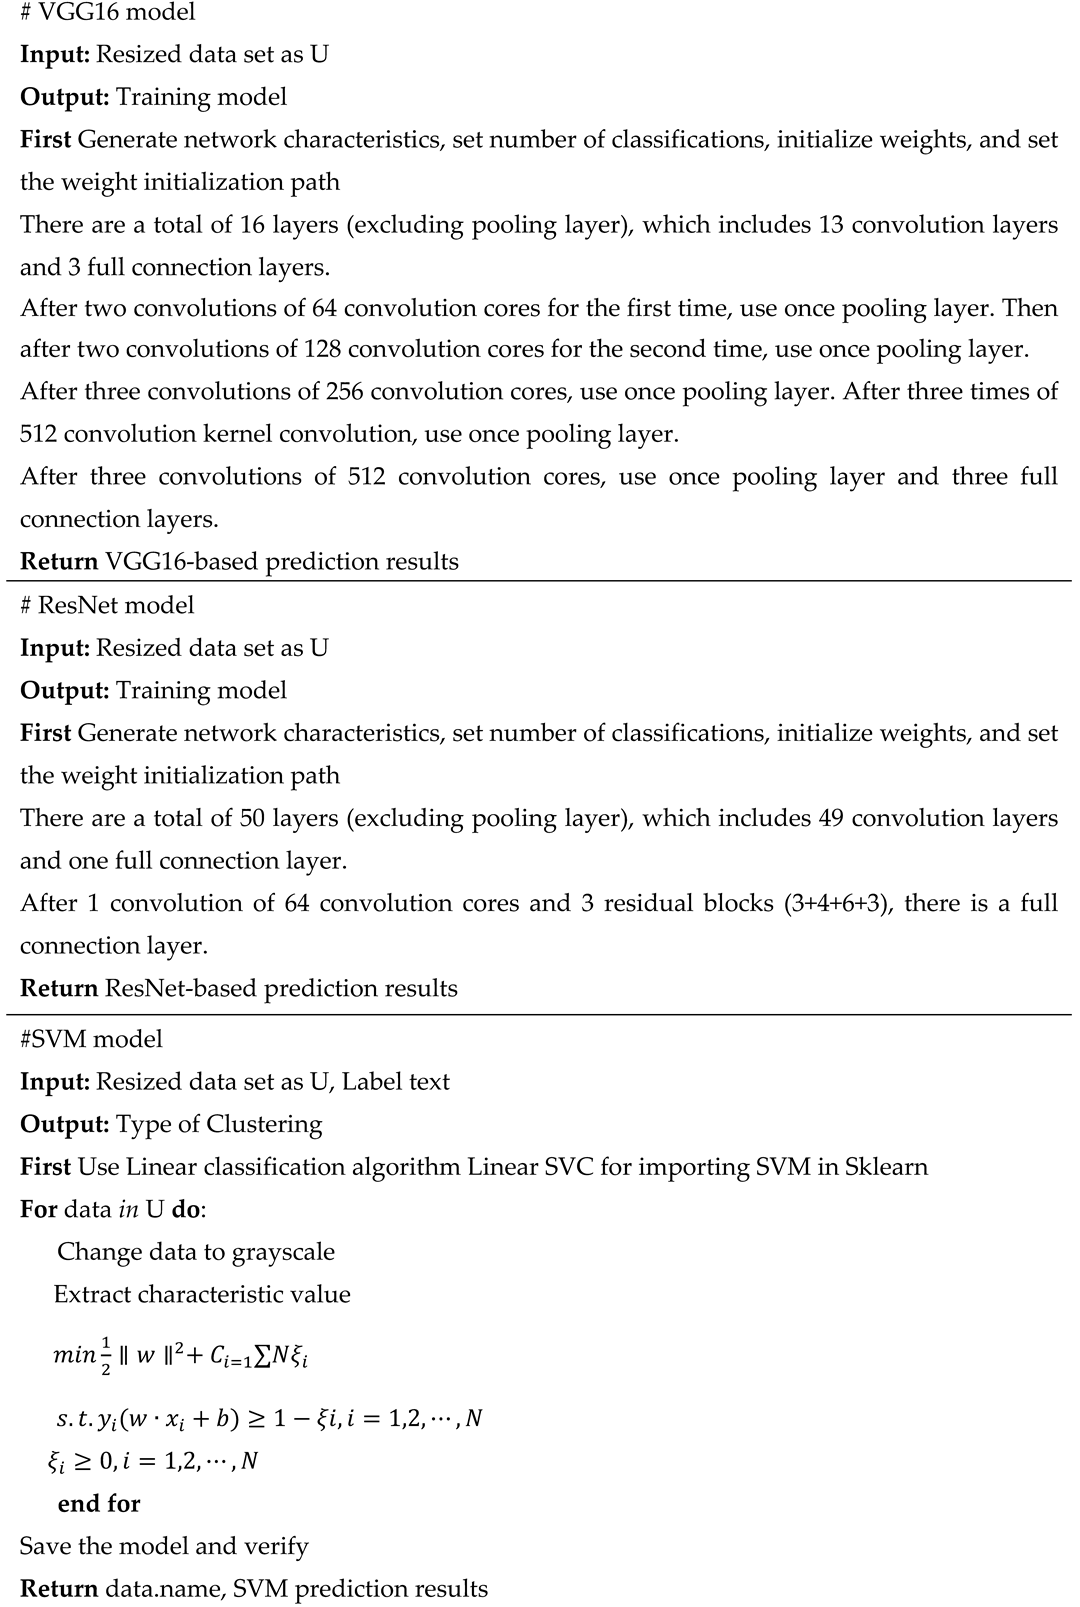
62] obtained great performances in former studies for retinal disease detection. Thus, this paper applies these three supervised learning methods (shown in algorithm 3) to AMD classification, and a comparative study based on different types of data is implemented. Compared to the unsupervised ML methods, this method is with relatively high accuracy. However, it is relatively time-consuming with a high resource requirement for the training process. Parameters of SVM are identified as the following (gray, orientations=12, block_norm='L1', pixels_per_cell=[8, 8], cells_per_block=[4, 4], visualize=False, transform_sqrt=True). By using the typical VGG16 architecture, images are classified into 2 categories. This model framework includes 13 convolutional layers, 3 fully connected layers, and 5 pool layers in the VGG16 model (
Figure 5). There are 50 layers in ResNet50, where residual blocks are throughout the basic network. Shortcut connections are set in the network to solve the vanishing gradient issue.
|
Algorithm 3: The supervised learning AMD prediction system |
 |
C. Multi-Source Data Fusion-Based Method for AMD Detection
Texture features of medical images are identified to be one of the most parameters for disease diagnosis. DL methods based on image texture features have been applied for multiple medical tasks, such as brain tumor detection[
63]. Besides, unsupervised ML models are significant methods for exploiting feature extraction and dimensionality reduction for DL[
64]. When it comes to DL applied to medical fields, the feature extraction based on ML and DL models presents a profound value for AI model explanations and provides insights for clinical decision-making [
65].
Thus, the following features are involved in the first step. (1) Identify image type features of OCT, segmented OCT, FAF, regular CFP, and UWF based on one-hot labeling rules. (2) Identify texture features of image contrast, dissimilarity, homogeneity, energy, correlation, and angular second moment (ASM) for ophthalmic digital images. (3) Identify features based on cluster labels by unsupervised cluster algorithms of HC and K-Means. Texture features are extracted by the scikits-image function in Python program language. Cluster results of the K-Means and HC model are decided by the measurement indicator of within-cluster sum of squared errors (SSE).
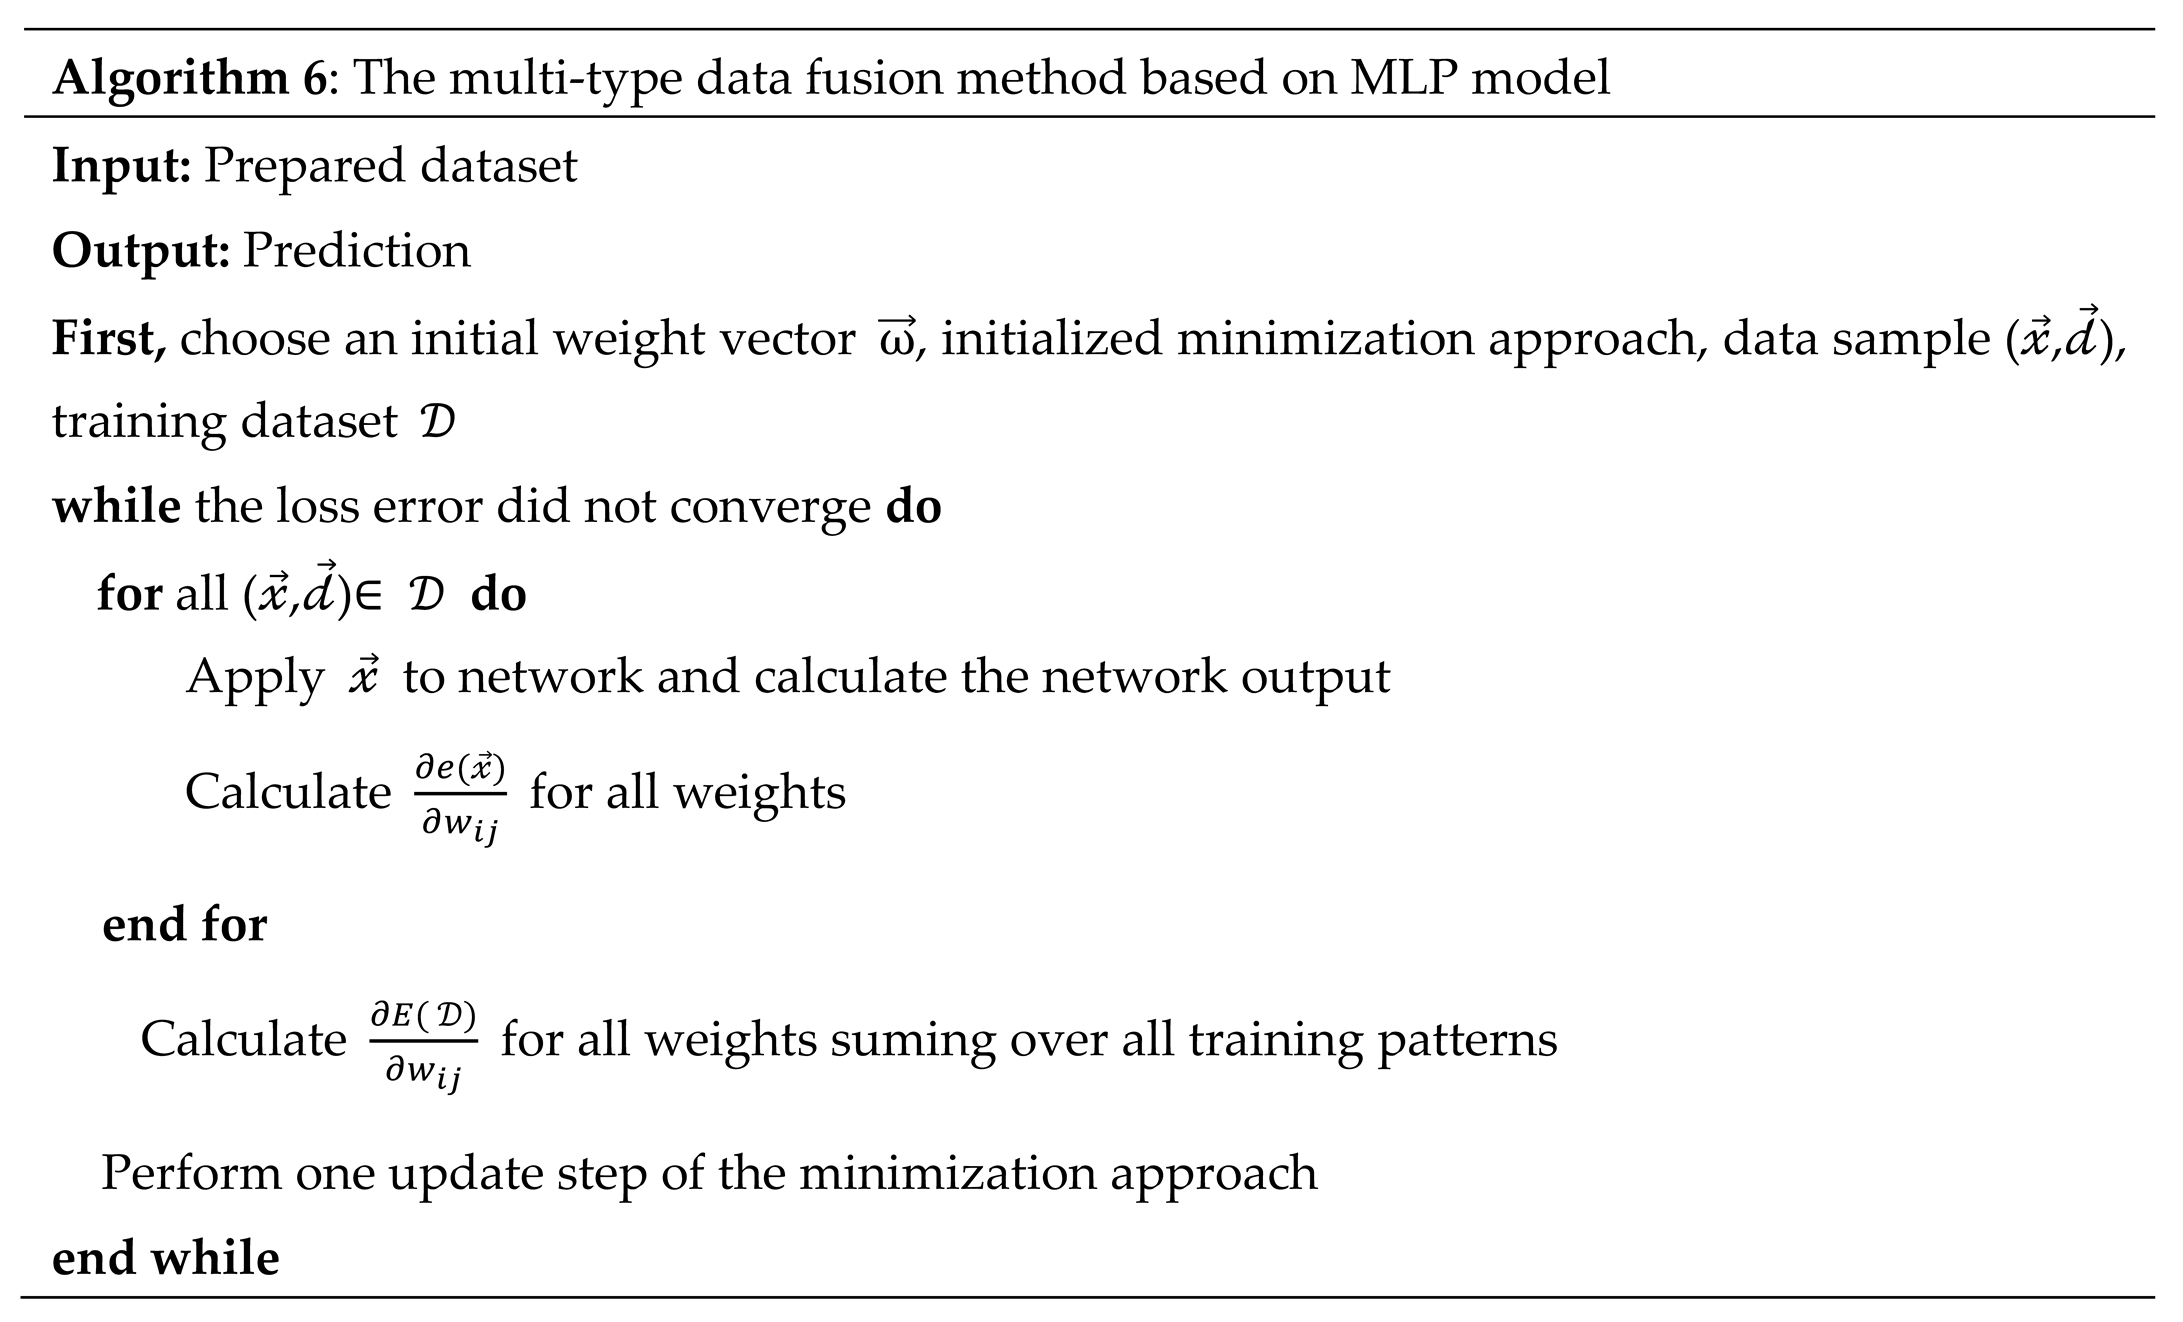
With the extracted features, a feature normalization (as the algorithm 4 shows) and data fusion process (as the algorithm 5 shows) is implemented. All features are standardized in the range of [-2,2], which are augmented as a matrix with 16 dimensions. A multi-type data fusion method based on MLP model is performed based on the integrated feature matrix (as the algorithm 6 shows). As shown in the
Figure 6, labels of image type (
), texture features (
) and cluster labels (
)are combined in the matrix, which is the input of MLP. The size of the feature matrix of each image is 1×1×13. Images are classified into two classes, which are AMD (labeled as 1) and normal (labeled as 0).
|
Algorithm 4: Data Normalization |
 |
|
Algorithm 5: Data Argumentation |
 |
|
Algorithm 6: The multi-type data fusion method based on MLP model |
 |
D. Multi-Model Fusion-Based Method for AMD Detection
Voting-mechanism-based ensemble decision-making framework is an approach to integrate different solutions and propose a promising decision in a robust way [
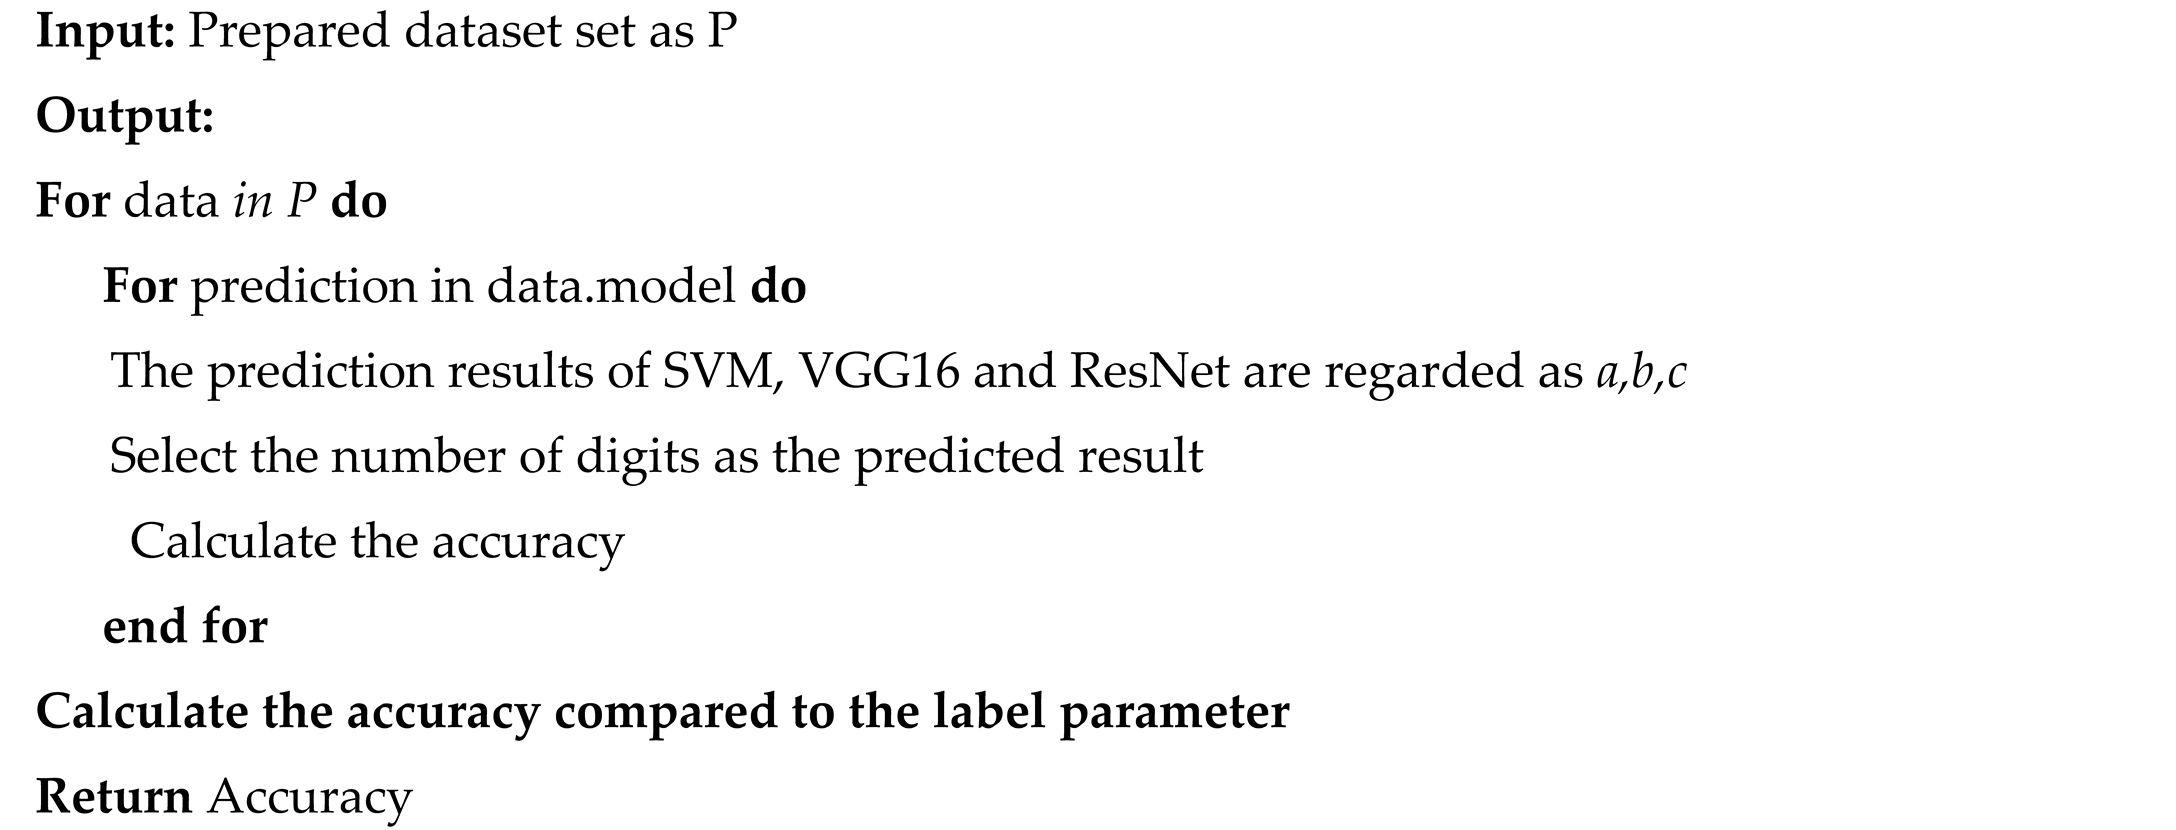
44]. It presents great practical value for model fusion research. This study proposes a model fusion method for AMD detection based on the voting mechanism. Since the supervised method is comprehensive with more reliable results with higher accuracy than the unsupervised learning models, this study performs an AMD prediction based on the results of models of SVM, VGG16, and ResNet. The pseudocode is illustrated in algorithm 7.
|
Algorithm 7: Multi-model fusion model based on the voting mechanism |
 |
3. Results
3.1. Data Preprocessing Results
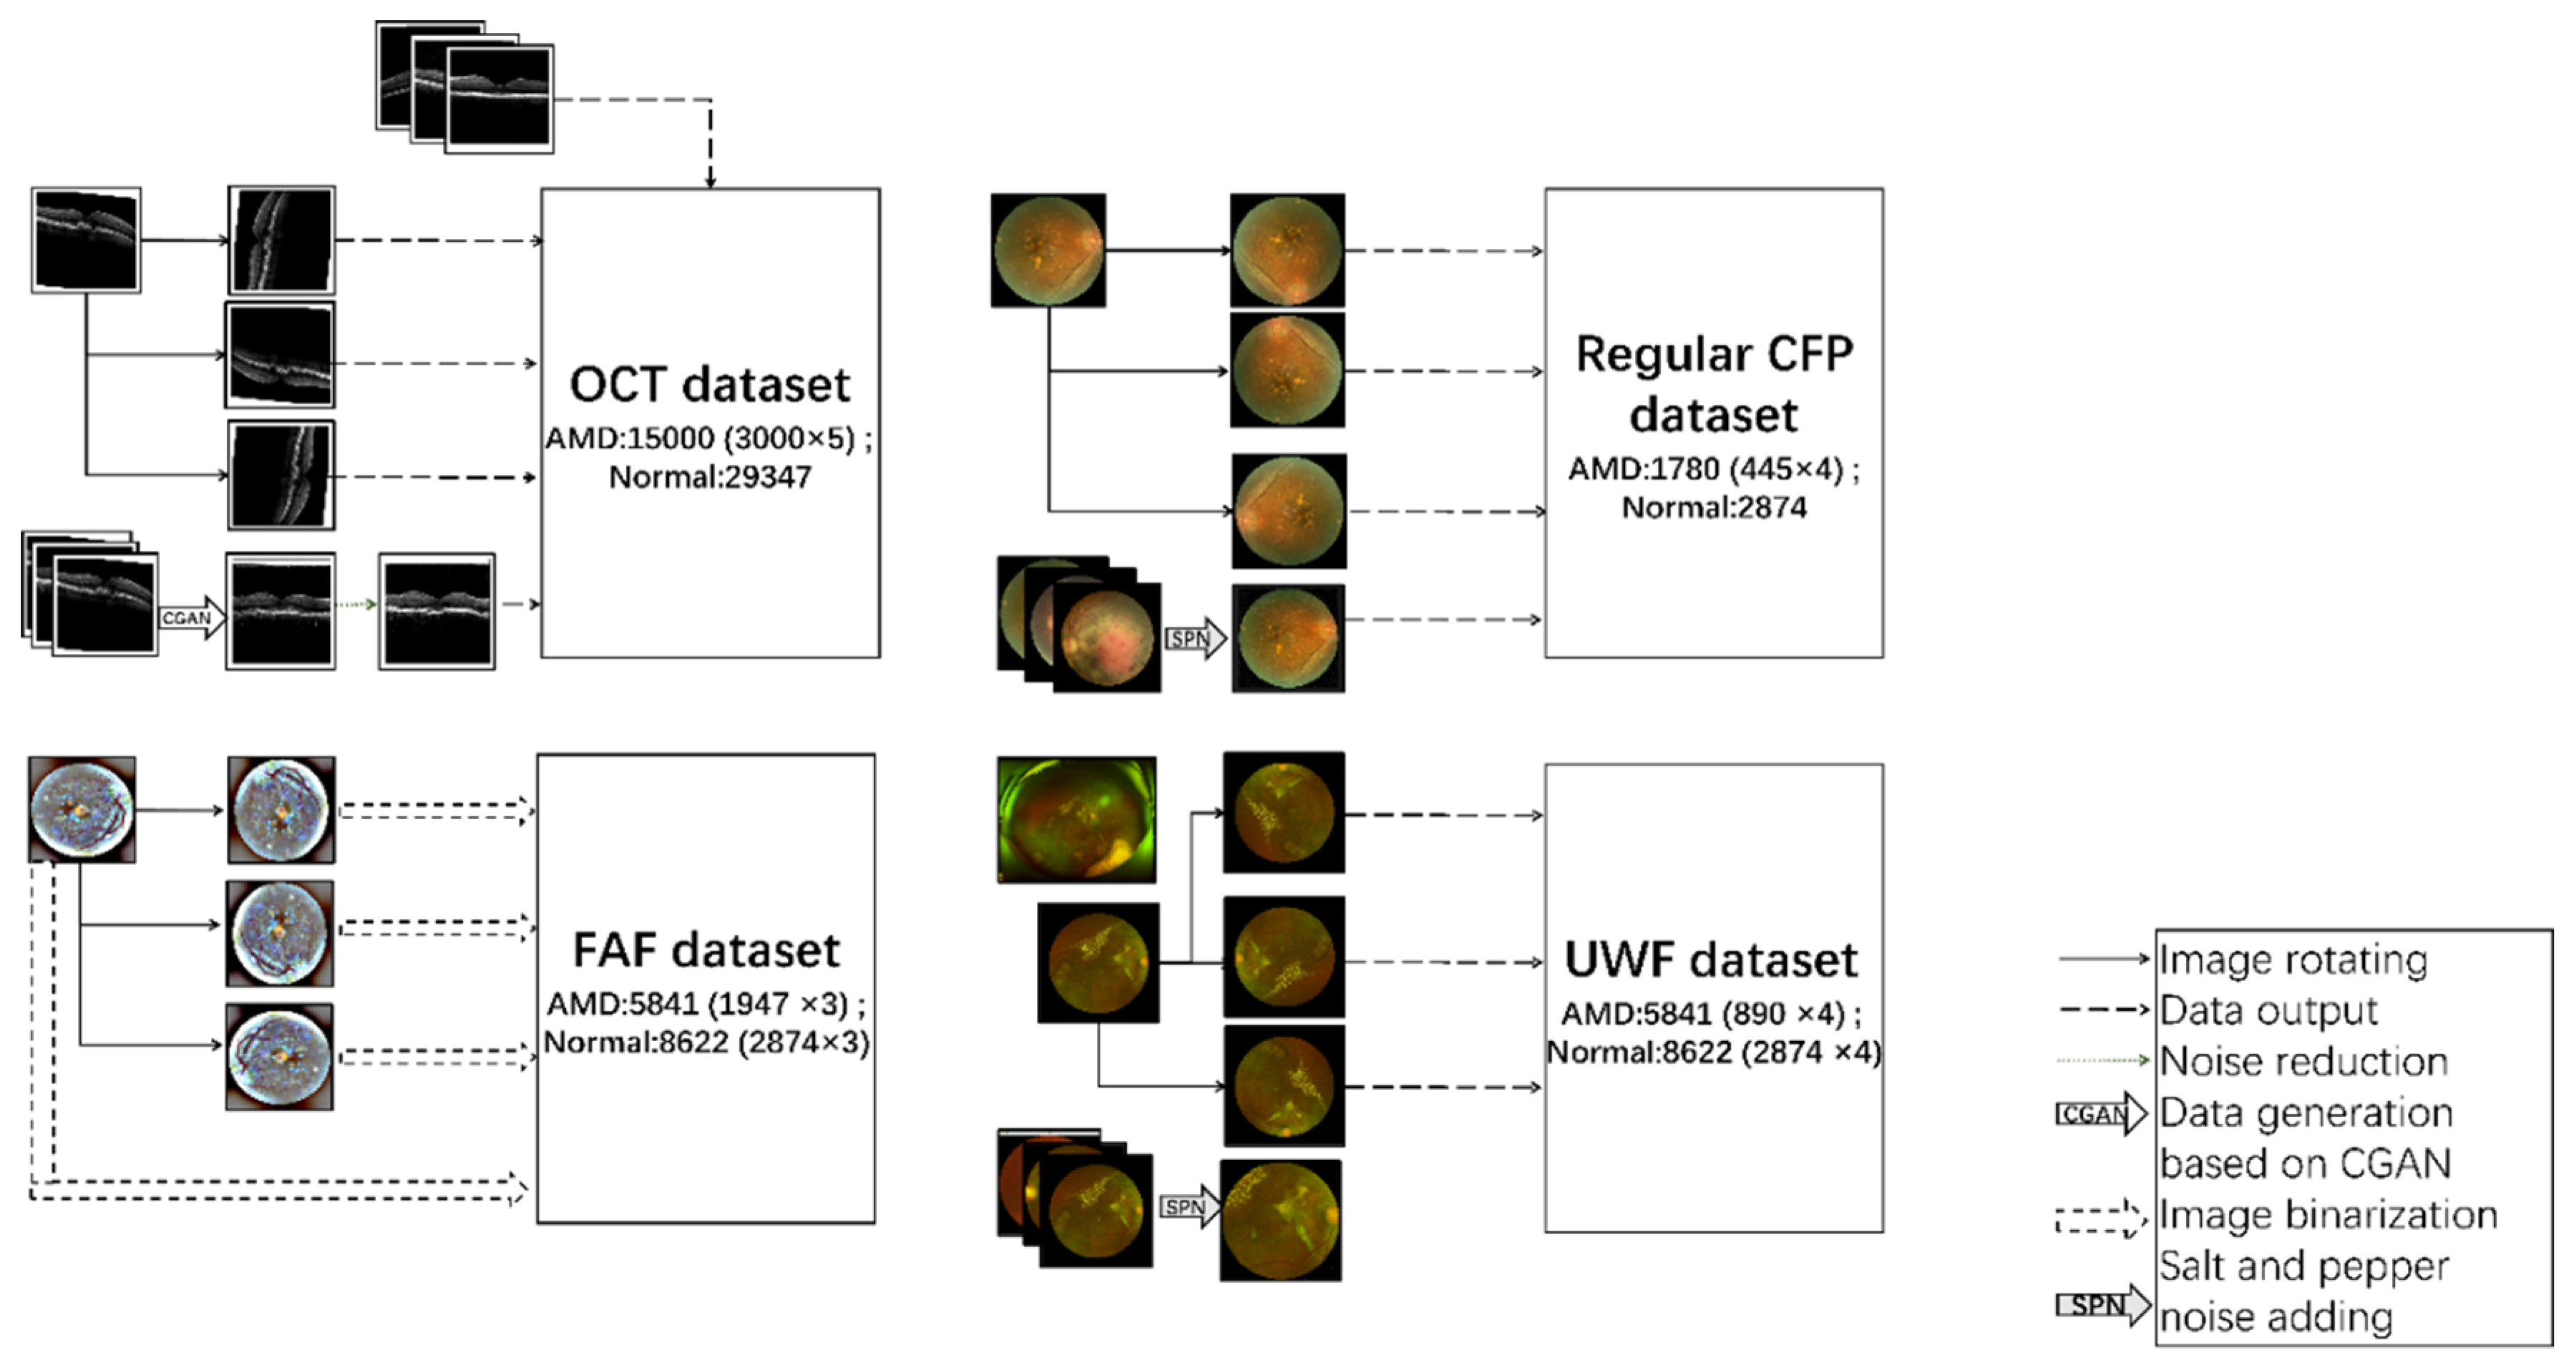
After a data preprocessing process, 44347(15000 AMD and 29347 normal) OCT figures, 64143 (5841 AMD and 8622 normal) FAF images, 4654 (1780 AMD and 2874 normal) regular CFP figures and 14463(5841 AMD and 8622 normal) UWF photos are outputted. The process and data enhancement examples are illustrated in
Figure 7.
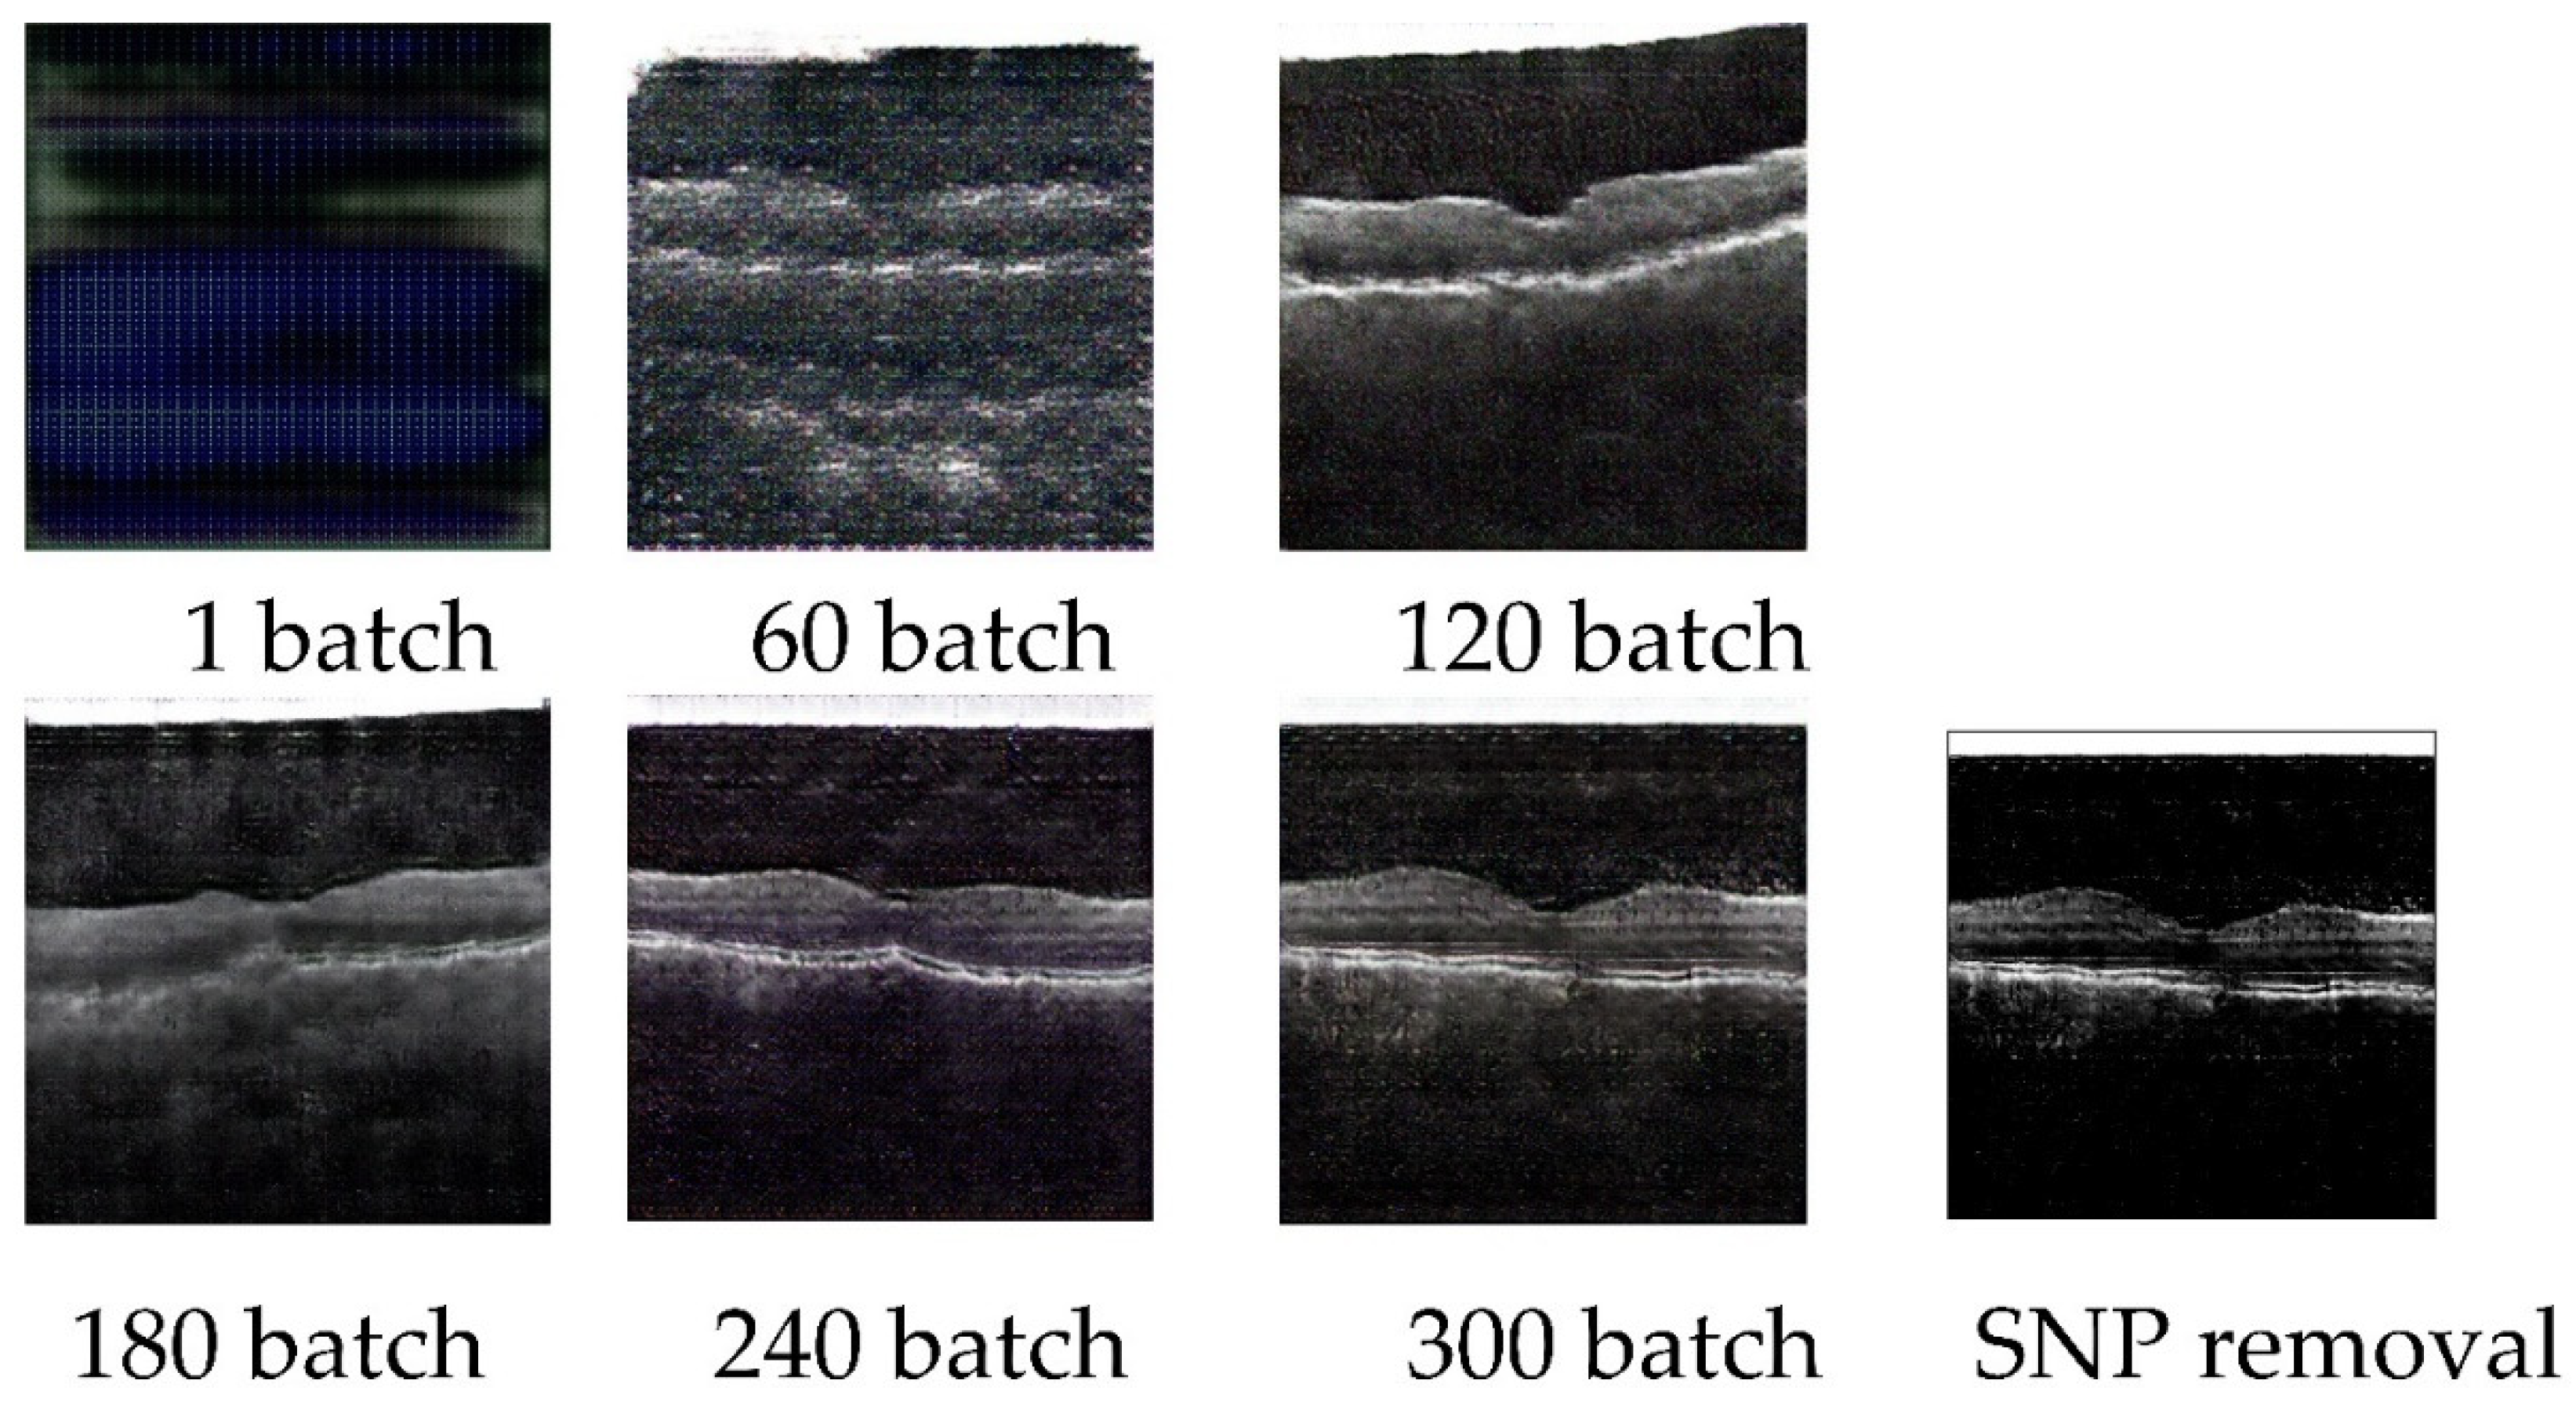
The parameters of CGAN models on OCT images are set as the following, the batch size is set as 32, the number of channels is set as 3, the size of the latent vector is set as 100, the number of epochs is set as 300, the generator loss rate is set as 0.05, the discriminator loss rate is set as 0.0025, the Adam Optimizers beta1 is set as 0.5. The sizes of the input and output images are the same, which is 256 × 256. 3000 AMD images are inputted in the training process. Cross-validation is performed on the training-validation process. The loss value of the generator and discriminator is 0.1122 and 0.0352 respectively. 11454.39294 seconds are utilized for this model training. 0.0186 seconds are caused for generating one new image. The example of generating pictures of 1 batch, 60 batches, 120 batches, 180 batches, 240 batches, 300 batches, and the SNP removal processed image is shown in
Figure 8.
Figures in the OCT database are processed by the CFS algorithm to extract key features, which are output as an OCT-segmented database (
Figure 9). The CFS algorithm has been widely applied to multiple medical images preprocesses[66, 67]. As
Figure 9 shows, subfigure A is the original figure, B is related to image feature identification, and C is the segmented OCT image. Shapes of the macular epiretinal membrane and choroid are extracted with smooth edges (white part shown in C).
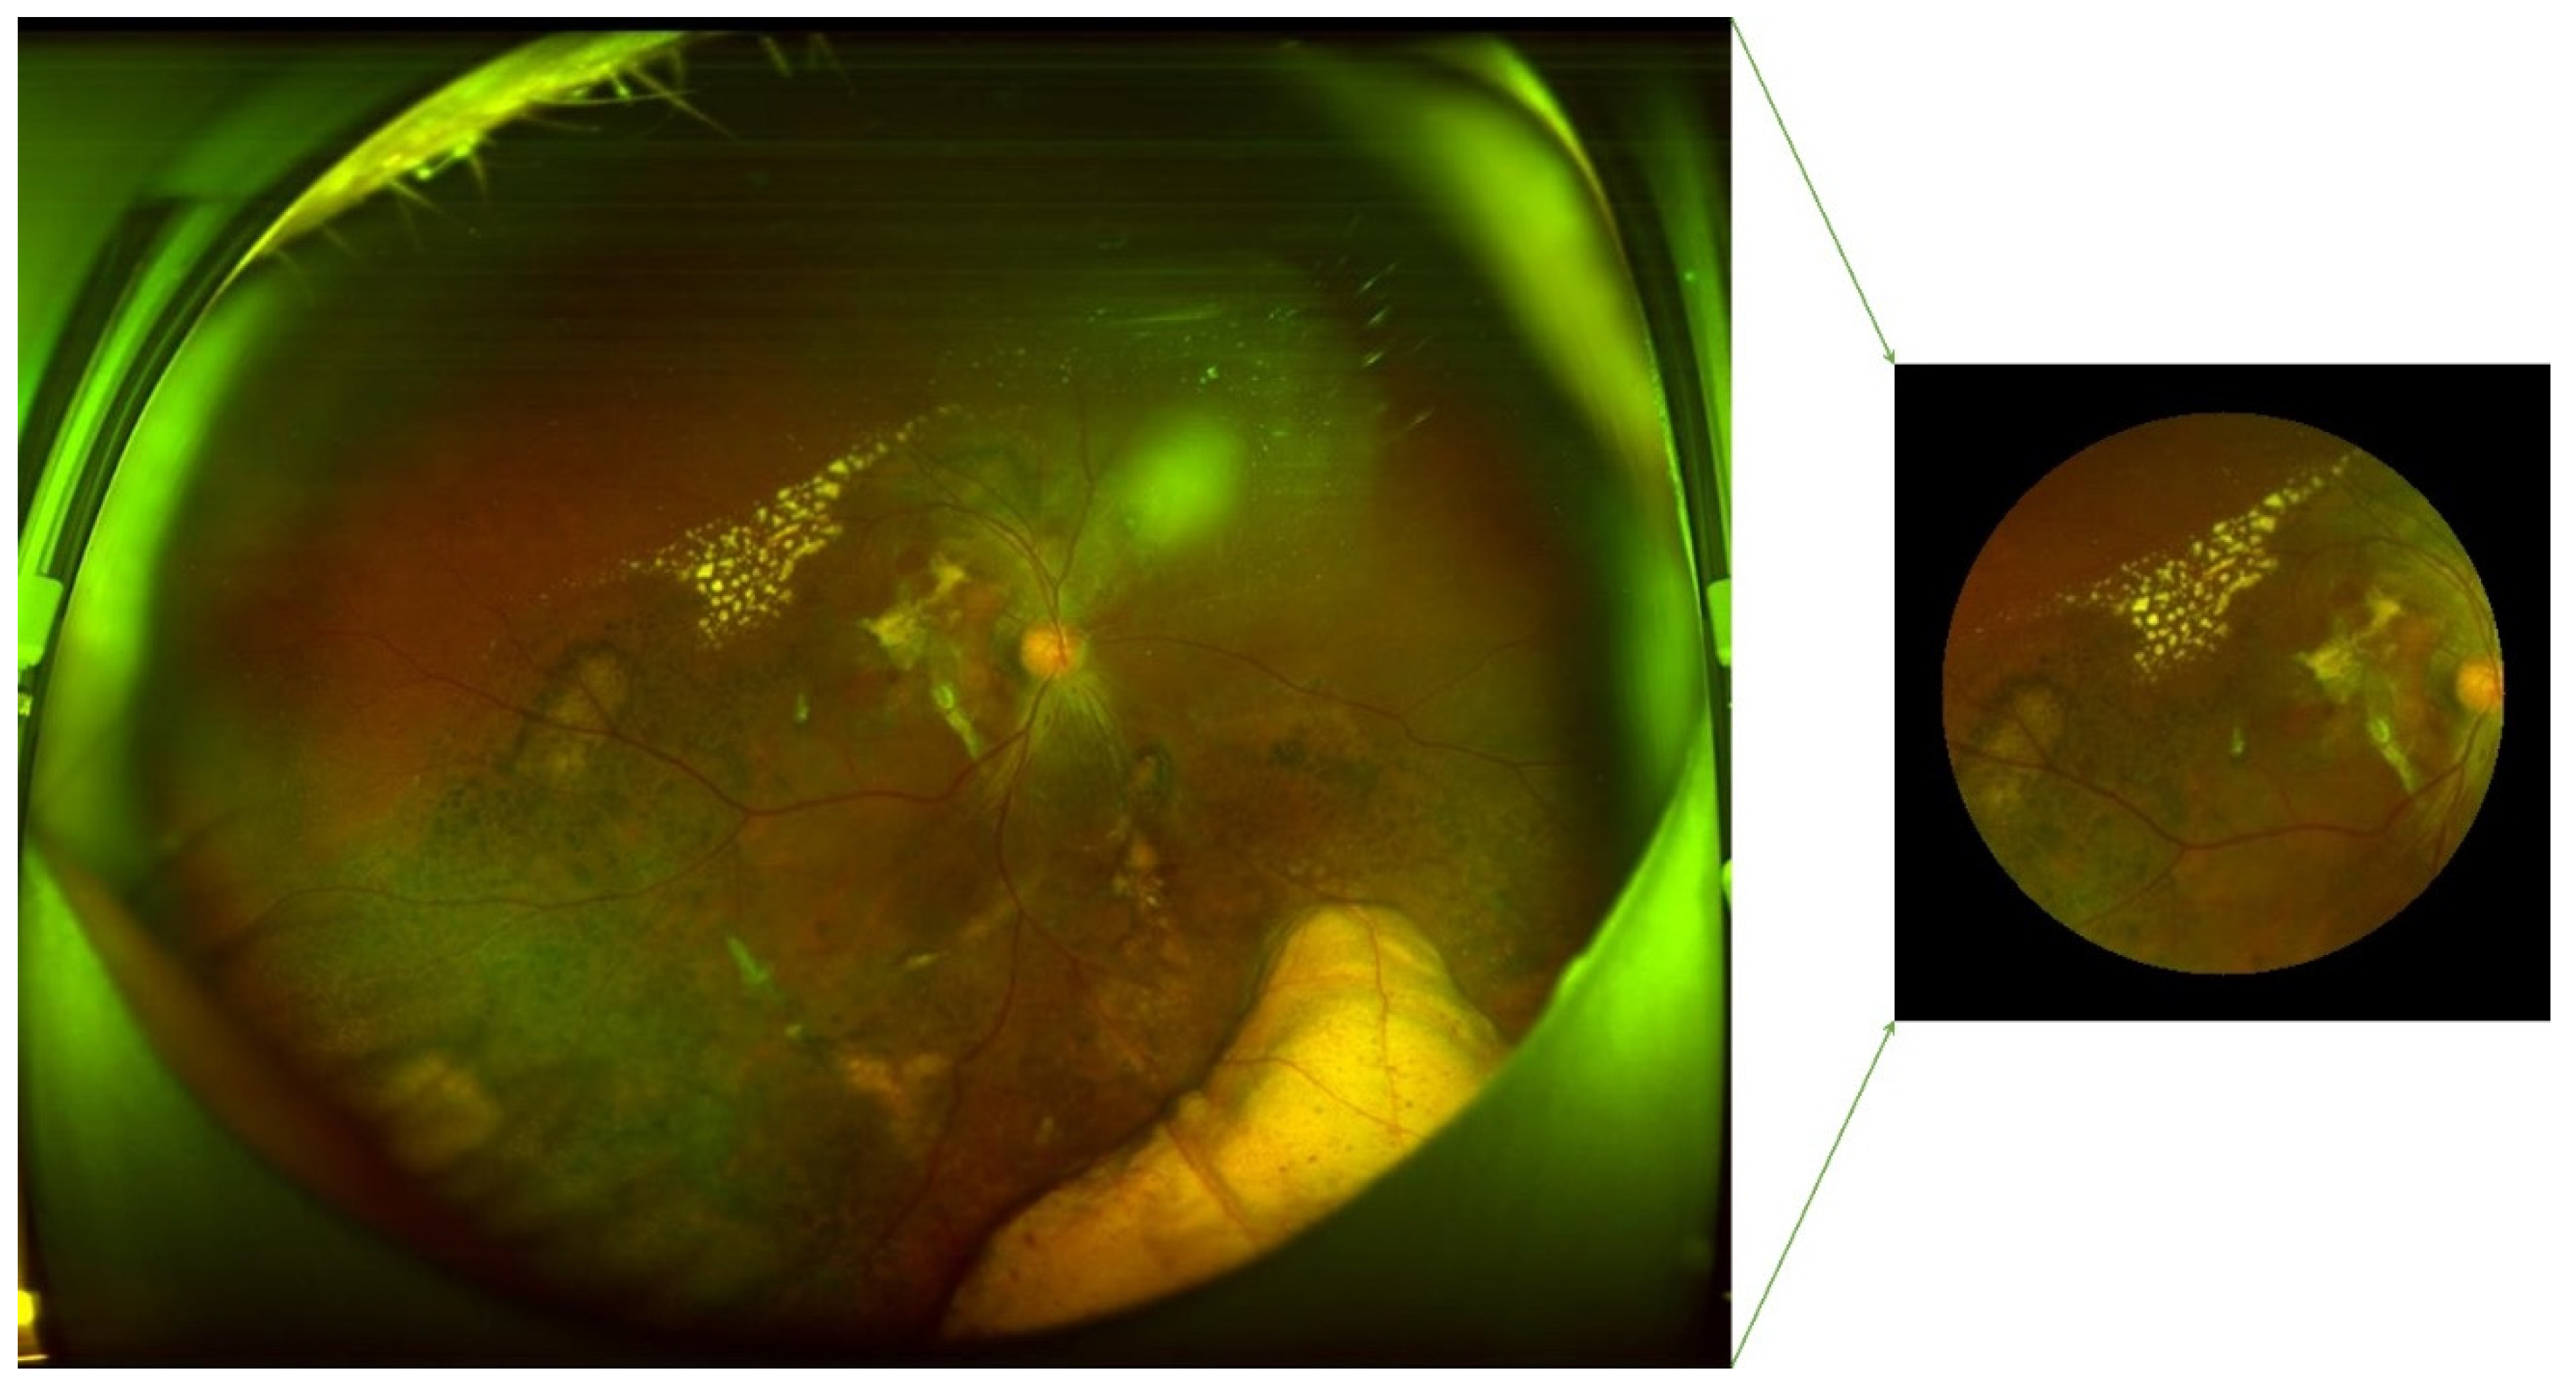
The example of ROI extraction of UWF is presented in
Figure 10. The left is the original UWF figure, and the right is related to the ROI-extracted image.
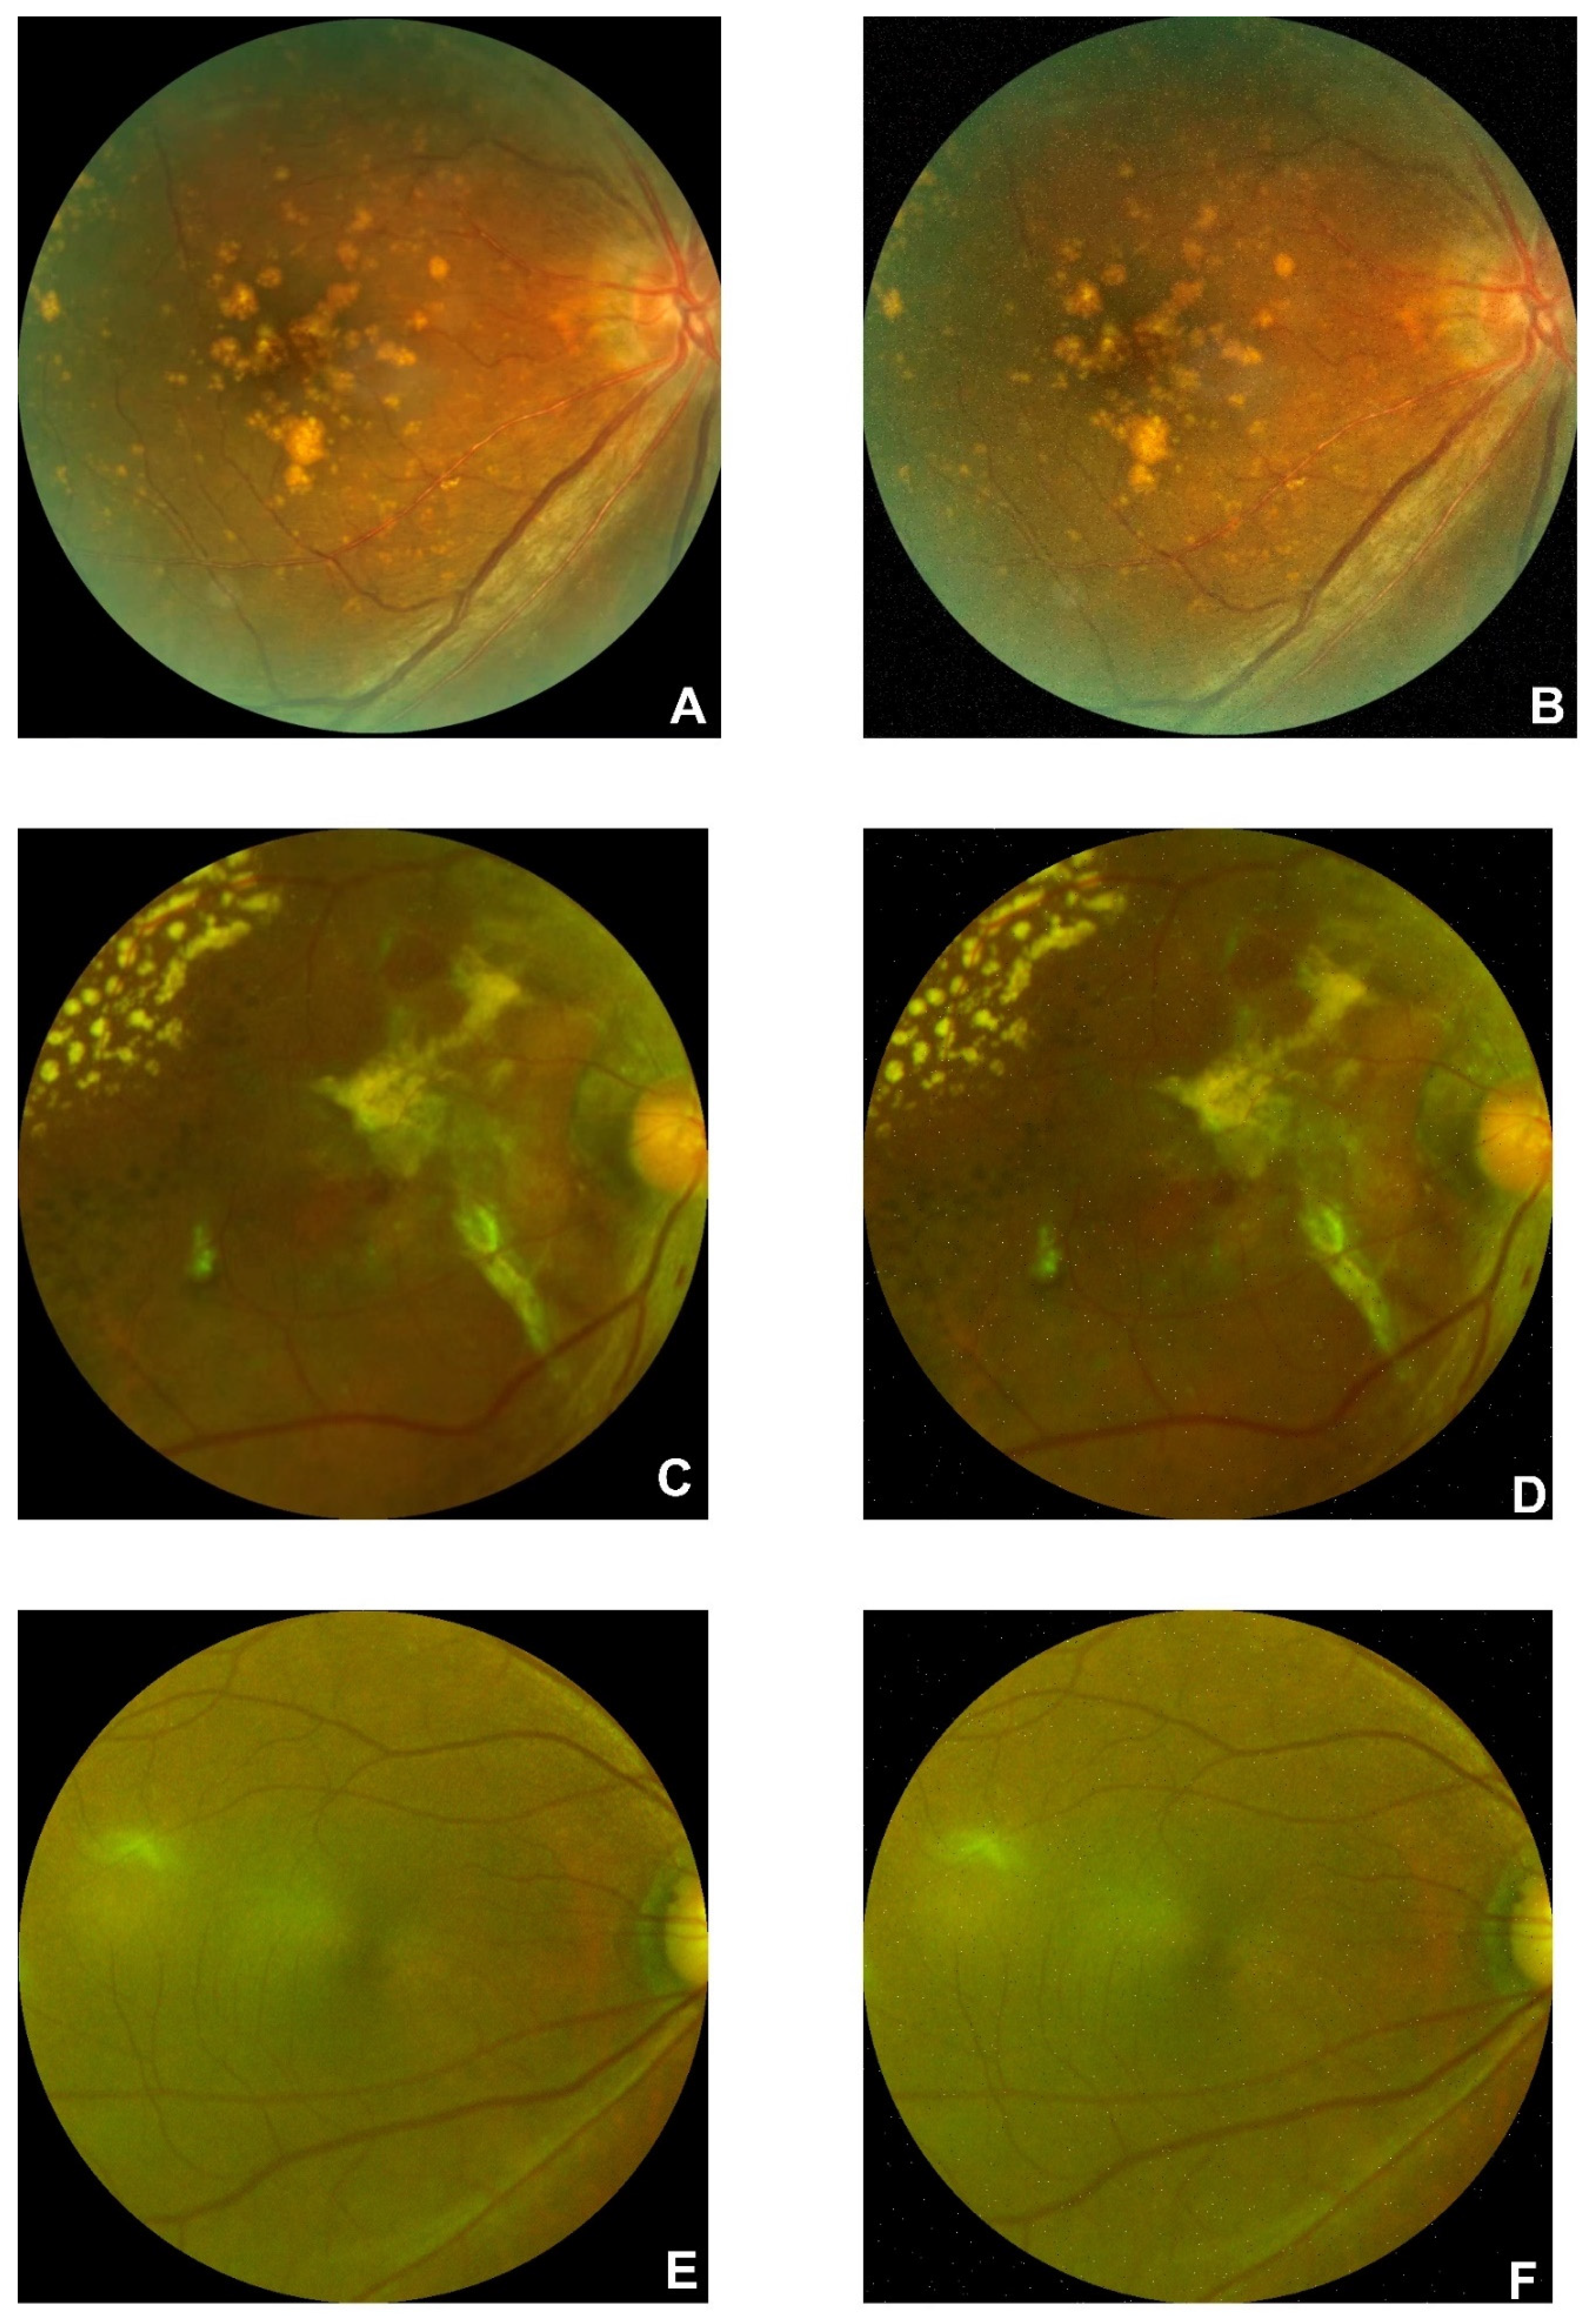
The original image of regular CFP (A), generated regular CFP based on SPN (B), original images of ROI-extracted UWF (AMD: C, Normal: E), generated ROI-extracted UWF based on SPN (AMD: D, Normal: F) are illustrated in
Figure 11.
3.2. Parameters for MLP Model
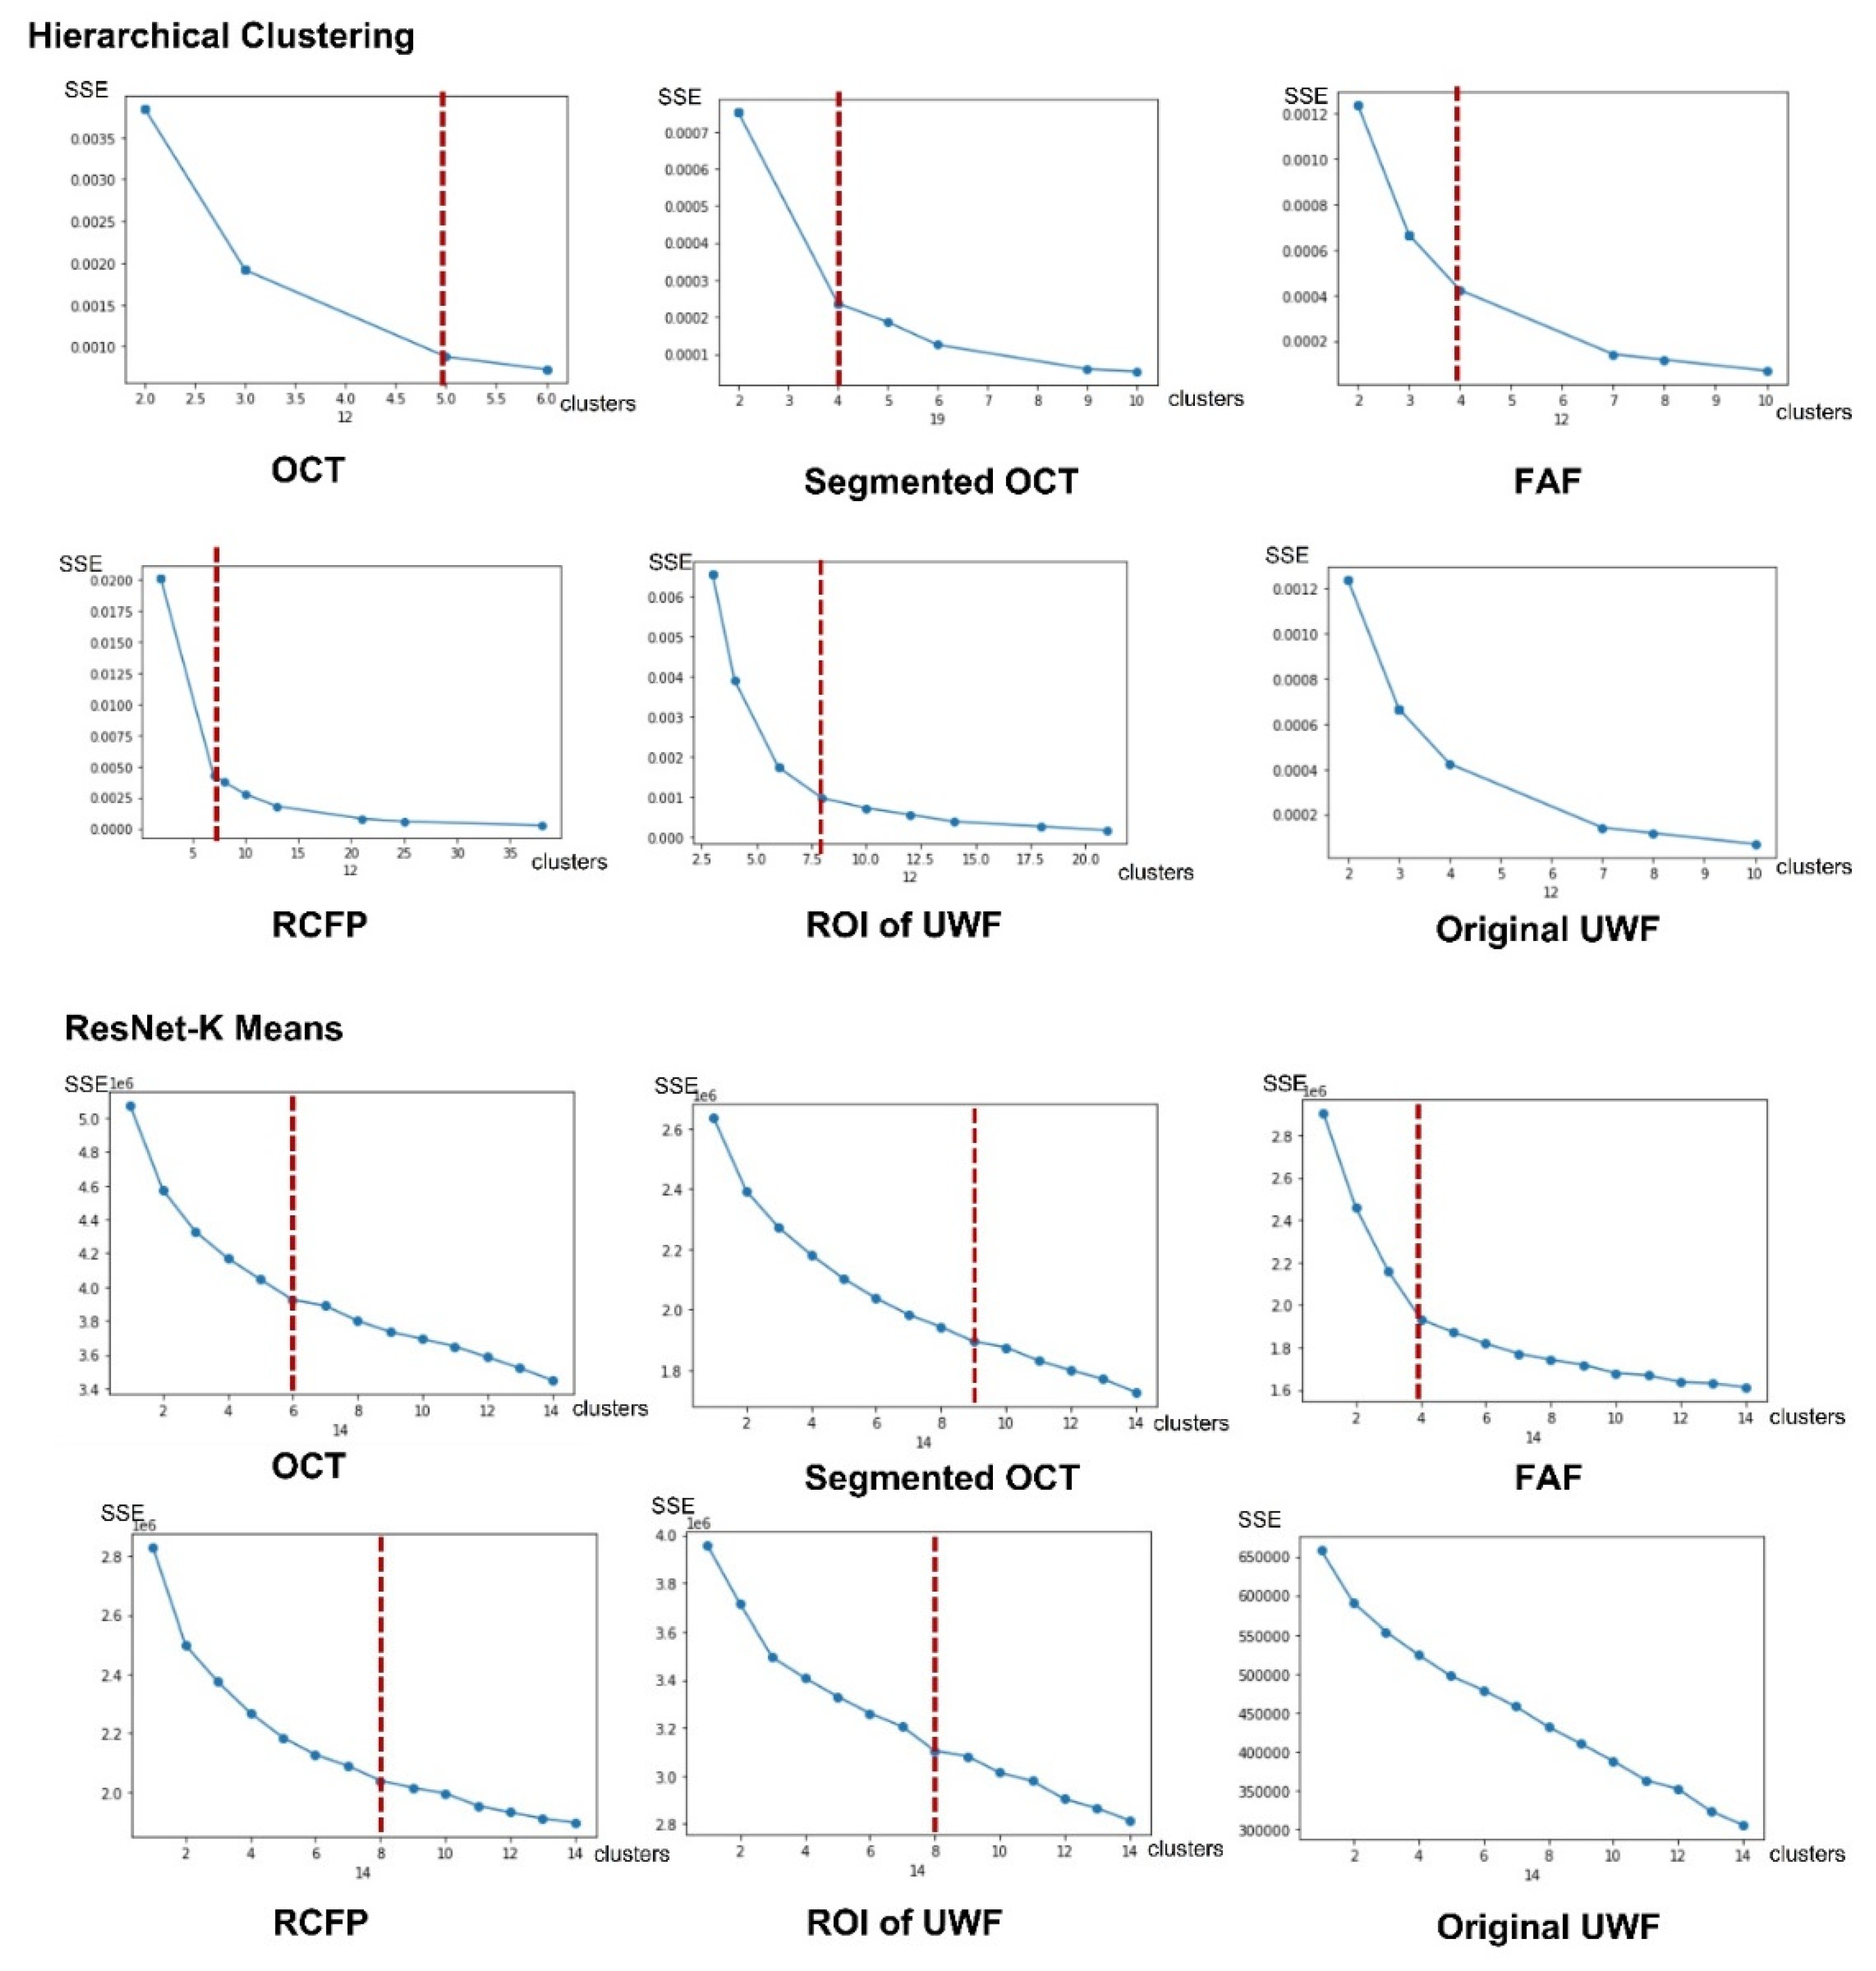
There are three steps for the proposed MLP-based fusion model building. As for the first step of feature extraction. The number of clusters is decided by unsupervised ML algorithms, where optimal parameters of cluster numbers for HC and K-mean are decided by inflection points for SSE-Cluster plotted figures. As
Figure 12 shown, the category results of HC for OCT, segmented OCT, FAF, regular CFP, and ROI of UWF are 5,4,4,7 and 8, which are 6,9,4,8 and 8 for the K-mean algorithm. There is no inflection point for original UWF figures, which is corresponding to the conclusion that the image feature sensitivity of the original UWF is low for AMD detection, the ROI extraction based on UWF is necessary.
Appendix A is an example of feature fusion, 13 dimensions of image features are involved for one picture, which are image types of OCT, segmented OCT, FAF, regular CFP and UWF, texture features of image contrast, dissimilarity, homogeneity, energy, correlation and ASM, and cluster labels of HC and K-Means unsupervised algorithms.
3.3 AMD Detection Results
The results of AMD detection are presented in
Table 1. Indicators of loss and accuracy for the last batch of iteration of training and test dataset, the consuming time (per image) for the test dataset is measured. Databases of OCT, segmented OCT, FAF, regular CFP, and ROI-extracted UWF images are tested on unsupervised learning, supervised learning, and proposed methods. Findings and insights are concluded as the followings.
The test time (per image) costs less than one second. Thus, this study concluded that the computer-aided diagnosis (CAD) methods are faster than the manual way.
When the cluster number is set as 2, there is no result output of the HC model for either type of data. The algorithm of K-Means shows a low accuracy on OCT (49%), FAF (44%), regular CFP (55%), and ROI-extracted UWF (50.5%), but it shows a high accuracy on the segmented OCT dataset (94.5%). As for the consuming time of the training process, unsupervised learning models cost the least time. Thereby, this study concluded that unsupervised learning models have the strength of timesaving for the training process, especially when it comes to massive data. However, results of low accuracy indicate that the HC model is not applicable for AMD detection. K-means is only applicable to the segmented OCT dataset for the same task.
Accuracy values of the training dataset for SVM, VGG16, ResNet, and proposed fusion models are all higher than 96.43%, loss values are all lower than 0.3, the average accuracy of images in test datasets (SVM: 71.4%, VGG16: 81.4%, ResNet: 71.216%) are all higher than unsupervised model (58.6%). Thus, this study concluded that supervised learning models show relatively more effective and reliable compared to unsupervised methods.
Moreover, the segmented OCT presents a huge advantage compared to the OCT image. FAF has a better strength compared to regular CFP and ROI-extracted UWF. Regular CFP is with the least advantage based on testing accuracy measurement results.
Comparing the test accuracy between K-means, SVM, and proposed methods, proposed approaches present a higher accuracy (multi-source data fusion-based method: 85%; multi-model fusion-based method based on voting mechanism: 81.9%).
The proposed method shows the highest accuracy and relatively low consuming time for AMD detection. The proposed multi-type data fusion-based method is with the great advantage of accuracy and robustness. The multi-model fusion-based approach is implemented by combing results of SVM, VGG16, and ResNet based on the voting mechanism, which shows high accuracy with effectiveness for the OCT, segmented OCT, FAF, and ROI-extracted UWF databases. Regular CFP database delivers the lowest precise rate among multiple types of datasets, but it is still higher than the single model of SVM, VGG16, or ResNet.
4. Discussion
AMD is one of the most serious eye diseases leading to blindness. Early detection could lower the rate of visual loss. Since the shortage of ophthalmologists, especially in developing countries, AI-based methods exhibit great strength. Data enhancements play a vital role in model robustness development and overfitting avoiding. It is also a solution to solving the data unbalance issue. Except for normal data enhancement methods of rotation, SPN adding, grey value processing and connected domain partition, GAN-based data-generation approaches present a potential value, especially for the labeled data enhancements. AMD could be diagnosed based on multiple types of medical images, such as OCT, FAF, regular CFP, and UWF. Since there is a significant difference in image characteristics for different ophthalmologic photographs, distinct preprocessing and enhancement methods based on each type of dataset are explored and experimented with in this study. Insights are concluded as the followings. (1) The algorithm of CGAN is effective for OCT image enhancements. Segmented OCT generated by CFS segmentation on the OCT database extracts the lesion-symptom of the choroid and pre-macular membranes, which could be a potential method for OCT image preprocessing and AMD symptom segmentation. However, important information could be missing from this implementation. (2) CNV symptom is clearly detected in FAF images, which presents strengths for AMD diagnosis. (3) The regular CFPs are easy to obtain from the real world. However, effective features are difficult to extract from regular CFP, which results in low accuracy from computer-aided methods. (4) Because of the wide angle of view, the UWF has been verified to have a great advantage for early screening of fundus disease. However, AI-based predicting models performing on the size of original figures exhibit a great challenge for engineering. An over-compression process could make important information to be missed. Thus, ROI extraction is a necessity when it comes to UWF fundus disease detection. The ROI extraction rule is verified effective by this study, which is defined as the area with the fovea as the center and the distance from the center of the optic disk (OD) to the fovea as the radius.
By training features extracted from five types of ophthalmic images (OCT, segmented OCT, FAF, regular CFP, and UWF), the proposed multi-source data fusion-based method shows an advantage of high accuracy, robustness, and explainability level. Any type or combination of more than one type of image could be considered as input for testing. Better performances are obtained compared to single-type-data-trained DL models (VGG16 and ResNet50). The proposed multi-model fusion-based method based on shows strength of robustness and accuracy by combining all the results of CAD models with the voting mechanism. However, the CAD model selection plays a key role in this approach. Thus, under comprehensive considerations, this study concluded that the proposed methods show efficiency for AMD detection, an advantage of low time-consuming, high accuracy, and improved robustness is contributed compared to the manual diagnosis and typical single ML/DL model.
The symptom of CNV is hard to be noticed in OCT, regular CFP, and UWF, especially when it comes to RPE abnormalities in the late stage of AMD. However, intravenous fluorescein angiography is necessary for the observed to have the FFA evidence, where the contrast medium of fluorescein may cause an eye allergic reaction [
53]. Comparing to the FFA, the sources of OCT, FAF, regular CFP and UWF is non-contact method for AMD detection, show a low-level of threat for testing of patients. FAF is a solution based on autofluorescence techniques. This study shows that FAF presents an obvious advantage when it comes to AMD detection, comparing to other non-contact methods.
However, it is recommended that more unsupervised and supervised learning models should be considered for the comparison. Labeled data enhancement methods based on Gan and comparable experiments should be discussed for further research. The explainable AI (EAI) mechanism of CAD models should be explored in the future.
5. Conclusions
AI-based models present great potential for AMD diagnosis. This study proposed a novel multi-source data fusion-based AI method and a multi-model fusion-based approach for precise AMD diagnosis. Four types of ophthalmic images (OCT, FAF, regular CFP, and UWF) are collected and applied to DL models. The proposed methods are compared with two typical unsupervised learning models and three supervised algorithms. Findings show that ROI-extraction preprocessing of UWF images, CFS-based OCT image segmentation preprocessing, and GAN-based data enhancements show great potential for AMD detection tasks. Supervised learning models exhibit higher accuracy and reliability than unsupervised learning methods for AMD detection. Two novel methods are proposed. The multi-source data fusion-based model delivers a solution for AMD detection based on features extracted from multi-type evidence, which presents a high accuracy, robustness, and explainability level. The multi-model fusion-based method combines prediction results by voting mechanism, which is verified to be more effective than a single model, showing the strength of relatively high accuracy and robustness. The real-world dataset of UWF from Shenzhen Aier Eye Hospital is involved in experiments. The real-world dataset of UWF from Shenzhen Aier Eye Hospital is involved in experiments. Clinical contributions and the reference value is delivered for other eye disease detection, especially for the ophthalmic diagnosis tasks based on multiple digital evidence with complex diagnosis symptoms. Precision is the most vital performance when it comes to CAD-based medical applications, with the enhancements of cooperation between disciplines and AI technologies, we believe that CAD tools will contribute with more value to preserving human beings’ live quality and healthcare.
6. Patents
The Chinese patent named “The explainable AI method and system for AMD detection” (No. 2022104330486), “The classification method for AMD detection” (No. 2022104328005), “The explainable AI algorithm for AMD early screening” (No. 2022104329332) and “The algorithm of Macular fovea diagnosis” (202111329782. X) are related to this project.
Author Contributions
Conceptualization, Han Wang, Kelvin KL Chong and Yi Pan; methodology, Han Wang and Junjie Zhou; software, Junjie Zhou, Zhoujie Tang and Chengde Huang; validation, Han Wang and Junjie Zhou; formal analysis, Han Wang and Junjie Zhou; investigation, Han Wang and Ruitao Xie; resources, Qinting Yuan and Lina Huang; writing and revision—Han Wang; visualization, Han Wang and Junjie Zhou; supervision, Yi Pan and Kelvin KL Chong; funding acquisition, Han Wang. All authors have read and agreed to the published version of the manuscript.
Funding
This research was funded by National Science Foundation of China under Grant U22A2041, Shenzhen Science and Technology Program under Grant KQTD20200820113106007, Zhuhai Technology and Research Foundation under Grant ZH22036201210034PWC, Zhuhai Technology and Research Foundation under Grant ZH22036201210034PWC and 2220004002412, MOE (Ministry of Education in China) Project of Humanities and Social Science under Grant 22YJCZH213, The Science and Technology Research Program of Chongqing Municipal Education Commission under Grant KJZD-K202203601 and KJQN0202203605, KJQN202203607, and Natural Science Foundation of Chongqing China under Grant cstc2021jcyj-msxmX1108.
Informed Consent Statement
Informed consent was obtained from all subjects involved in the study.
Data Availability Statement
The UWF real-word dataset is an in-house dataset, which this article collected from Shenzhen Aier Eye Hospital. The “data access authorization & medical data ethics supporting document” from Shenzhen Aier Eye Hospital (both Chinese and English versions) of this study is available online at
https://github.com/luckanny111/macular_fovea_detection.
Conflicts of Interest
The authors declare no conflict of interest.
Appendix A
The example of standardized fused feature matrix of image. Part of the matrix is illustrated as the
Table A1, the complete file is related to the supply material.
Table A1.
The example of standardized fused feature matrix of image.
Table A1.
The example of standardized fused feature matrix of image.
| Index of Image |
Image types |
Texture |
Cluster labels |
| OCT |
Segmented OCT |
FAF |
RCFP |
UWF |
Image contrast |
Dissimilarity |
Homogeneit |
Energy |
Correlation |
ASM |
HC |
K-means |
| 0 |
1.9497102 |
-0.506233544 |
-0.488380898 |
-0.492856776 |
-0.499554168 |
-1.303796156 |
1.355930996 |
-1.016968298 |
-1.524779352 |
1.407322066 |
-1.486247197 |
0.152813528 |
-1.298392758 |
| 1 |
1.9497102 |
-0.506233544 |
-0.488380898 |
-0.492856776 |
-0.499554168 |
-1.303796156 |
1.355930996 |
-1.016968298 |
-1.524779352 |
1.407322066 |
-1.486247197 |
0.152813528 |
-1.298392758 |
| 2 |
1.9497102 |
-0.506233544 |
-0.488380898 |
-0.492856776 |
-0.499554168 |
-1.303796156 |
1.355930996 |
-1.016968298 |
-1.524779352 |
1.407322066 |
-1.486247197 |
0.152813528 |
-1.298392758 |
| 3 |
1.9497102 |
-0.506233544 |
-0.488380898 |
-0.492856776 |
-0.499554168 |
-1.303796156 |
1.355930996 |
-1.016968298 |
-1.524779352 |
1.407322066 |
-1.486247197 |
0.152813528 |
-1.298392758 |
| 4 |
1.9497102 |
-0.506233544 |
-0.488380898 |
-0.492856776 |
-0.499554168 |
-1.303796156 |
1.355930996 |
-1.016968298 |
-1.524779352 |
1.407322066 |
-1.486247197 |
0.152813528 |
-1.298392758 |
| 5 |
1.9497102 |
-0.506233544 |
-0.488380898 |
-0.492856776 |
-0.499554168 |
-1.303796156 |
1.355930996 |
-1.016968298 |
-1.524779352 |
1.407322066 |
-1.486247197 |
0.152813528 |
-1.298392758 |
| 6 |
1.9497102 |
-0.506233544 |
-0.488380898 |
-0.492856776 |
-0.499554168 |
-1.303796156 |
1.355930996 |
-1.016968298 |
-1.524779352 |
1.407322066 |
-1.486247197 |
0.152813528 |
-1.298392758 |
| 7 |
1.9497102 |
-0.506233544 |
-0.488380898 |
-0.492856776 |
-0.499554168 |
-1.303796156 |
1.355930996 |
-1.016968298 |
-1.524779352 |
1.407322066 |
-1.486247197 |
0.152813528 |
-1.298392758 |
| 8 |
1.9497102 |
-0.506233544 |
-0.488380898 |
-0.492856776 |
-0.499554168 |
-1.303796156 |
1.355930996 |
-1.016968298 |
-1.524779352 |
1.407322066 |
-1.486247197 |
0.152813528 |
-1.298392758 |
| 9 |
1.9497102 |
-0.506233544 |
-0.488380898 |
-0.492856776 |
-0.499554168 |
-1.303796156 |
1.355930996 |
-1.016968298 |
-1.524779352 |
1.407322066 |
-1.486247197 |
0.152813528 |
-1.298392758 |
| 10 |
1.9497102 |
-0.506233544 |
-0.488380898 |
-0.492856776 |
-0.499554168 |
-1.303796156 |
1.355930996 |
-1.016968298 |
-1.524779352 |
1.407322066 |
-1.486247197 |
0.152813528 |
-1.298392758 |
| 11 |
1.9497102 |
-0.506233544 |
-0.488380898 |
-0.492856776 |
-0.499554168 |
-1.303796156 |
1.355930996 |
-1.016968298 |
-1.524779352 |
1.407322066 |
-1.486247197 |
0.152813528 |
-1.298392758 |
| 12 |
1.9497102 |
-0.506233544 |
-0.488380898 |
-0.492856776 |
-0.499554168 |
-1.303796156 |
1.355930996 |
-1.016968298 |
-1.524779352 |
1.407322066 |
-1.486247197 |
0.152813528 |
-1.298392758 |
| 13 |
1.9497102 |
-0.506233544 |
-0.488380898 |
-0.492856776 |
-0.499554168 |
-1.303796156 |
1.355930996 |
-1.016968298 |
-1.524779352 |
1.407322066 |
-1.486247197 |
0.152813528 |
-1.298392758 |
| 14 |
1.9497102 |
-0.506233544 |
-0.488380898 |
-0.492856776 |
-0.499554168 |
-1.303796156 |
1.355930996 |
-1.016968298 |
-1.524779352 |
1.407322066 |
-1.486247197 |
0.152813528 |
-1.298392758 |
| 15 |
1.9497102 |
-0.506233544 |
-0.488380898 |
-0.492856776 |
-0.499554168 |
-1.303796156 |
1.355930996 |
-1.016968298 |
-1.524779352 |
1.407322066 |
-1.486247197 |
0.152813528 |
-1.298392758 |
| 16 |
1.9497102 |
-0.506233544 |
-0.488380898 |
-0.492856776 |
-0.499554168 |
-1.508720965 |
1.291202023 |
0.276906725 |
-2.076745248 |
3.579870384 |
-2.15211324 |
1.00637754 |
-1.298392758 |
| 17 |
1.9497102 |
-0.506233544 |
-0.488380898 |
-0.492856776 |
-0.499554168 |
-1.508720965 |
1.291202023 |
0.276906725 |
-2.076745248 |
3.579870384 |
-2.15211324 |
1.00637754 |
-1.298392758 |
| 18 |
1.9497102 |
-0.506233544 |
-0.488380898 |
-0.492856776 |
-0.499554168 |
-1.508720965 |
1.291202023 |
0.276906725 |
-2.076745248 |
3.579870384 |
-2.15211324 |
1.00637754 |
-1.298392758 |
| 19 |
1.9497102 |
-0.506233544 |
-0.488380898 |
-0.492856776 |
-0.499554168 |
-1.508720965 |
1.291202023 |
0.276906725 |
-2.076745248 |
3.579870384 |
-2.15211324 |
1.00637754 |
-1.298392758 |
References
- H. Wang, "A Bibliographic Study and Quantitative Analysis of Age-related Macular Degeneration and Fundus Images," Annals of Ophthalmology and Visual Sciences, vol. 5, no. 1027, pp. 1-8, 2022.
- R. Klein, M. D. Knudtson, K. J. Cruickshanks, and B. E. Klein, "Further observations on the association between smoking and the long-term incidence and progression of age-related macular degeneration: The Beaver Dam Eye Study," Archives of Ophthalmology, vol. 126, no. 1, pp. 115-121, 2008. [CrossRef]
- R. A. KURT and M. MESTANOGLU, "Ultra-widefield Imaing in Age-Related Macular Degeneration," Retina-Vitreus/Journal of Retina-Vitreous, vol. 30, no. 1, 2021. [CrossRef]
- J. Yang et al., "Artificial intelligence in ophthalmopathy and ultra-wide field image: A survey," Expert Systems with Applications, vol. 182, p. 115068, 2021. [CrossRef]
- H. Wang, "A Survey of AI to AMD and Quantitative Analysis of AMD Pathology Based on Medical Images," Artificial Intelligence and Robotics Research, vol. 11, pp. 143-157, 2022.
- F. Grassmann et al., "A deep learning algorithm for prediction of age-related eye disease study severity scale for age-related macular degeneration from color fundus photography," Ophthalmology, vol. 125, no. 9, pp. 1410-1420, 2018. [CrossRef]
- A. Alone, K. Chandra, and J. Chhablani, "Wide-field imaging-An update," Indian Journal of Ophthalmology, vol. 69, no. 4, p. 788, 2021. [CrossRef]
- S. Schmitz-Valckenberg, F. G. Holz, A. C. Bird, and R. F. Spaide, "Fundus autofluorescence imaging: Review and perspectives," Retina, vol. 28, no. 3, pp. 385-409, 2008. [CrossRef]
- N. T. Huang et al., "Comparing fundus autofluorescence and infrared imaging findings of peripheral retinoschisis, schisis detachment, and retinal detachment," American journal of ophthalmology case reports, vol. 18, p. 100666, 2020. [CrossRef]
- M. Treder, J. L. Lauermann, and N. Eter, "Automated detection of exudative age-related macular degeneration in spectral domain optical coherence tomography using deep learning," Graefe's Archive for Clinical Experimental Ophthalmology, vol. 256, no. 2, pp. 259-265, 2018. [CrossRef]
- R. F. Spaide, J. G. Fujimoto, N. K. Waheed, S. R. Sadda, and G. Staurenghi, "Optical coherence tomography angiography," Progress in retinal eye research, vol. 64, pp. 1-55, 2018.
- T. B. DuBose, F. LaRocca, S. Farsiu, and J. A. Izatt, "Super-resolution retinal imaging using optically reassigned scanning laser ophthalmoscopy," Nature photonics, vol. 13, no. 4, pp. 257-262, 2019. [CrossRef]
- T. Hirano, A. Imai, H. Kasamatsu, S. Kakihara, Y. Toriyama, and T. Murata, "Assessment of diabetic retinopathy using two ultra-wide-field fundus imaging systems, the Clarus® and Optos™ systems," BMC ophthalmology, vol. 18, no. 1, pp. 1-7, 2018. [CrossRef]
- P. Y. Chua, M. T. Sandinha, and D. H. Steel, "Idiopathic epiretinal membrane: Progression and timing of surgery," Eye, vol. 36, no. 3, pp. 495-503, 2022. [CrossRef]
- C. Chen, S. Sharma, D. Mammo, K. Baynes, J. P. Ehlers, and S. K. Srivastava, "Identification of Retinal Fluid Accumulation in Uveitis Patients with Normal Foveal Contour on OCT and Retinal Vascular Leakage on Ultra-Widefield Fluorescein Angiography," Investigative Ophthalmology Visual Science, vol. 63, no. 7, pp. 4459–F0138-4459–F0138, 2022.
- S. Touhami et al., "Hypoxia Inhibits Subretinal Inflammation Resolution Thrombospondin-1 Dependently," International Journal of Molecular Sciences, vol. 23, no. 2, p. 681, 2022. [CrossRef]
- J. P. Ehlers et al., "The Association of Fluid Volatility With Subretinal Hyperreflective Material and Ellipsoid Zone Integrity in Neovascular AMD," Investigative ophthalmology visual science, vol. 63, no. 6, pp. 17-17, 2022. [CrossRef]
- Y. Deng et al., "Age-related macular degeneration: Epidemiology, genetics, pathophysiology, diagnosis, and targeted therapy," Genes diseases, vol. 9, no. 1, pp. 62-79, 2022. [CrossRef]
- J. F. Vander and M. J. Borne, "Retinal detachment," Ophthalmology Secrets E-Book, p. 366, 2022.
- L. Zhang and T. Jing'an, "The Experience of Professor Tong Jing'an in Treating Age Related Macular Disease," MEDS Public Health Preventive Medicine, vol. 2, no. 2, pp. 71-74, 2022.
- I. Damian and S. D. Nicoară, "SD-OCT Biomarkers and the Current Status of Artificial Intelligence in Predicting Progression from Intermediate to Advanced AMD," Life, vol. 12, no. 3, p. 454, 2022. [CrossRef]
- G. Bou Ghanem, P. Neri, R. Dolz-Marco, T. Albini, and A. Fawzi, "Review for Diagnostics of the Year: Inflammatory Choroidal Neovascularization–Imaging Update," Ocular Immunology Inflammation, pp. 1-7, 2022. [CrossRef]
- N. J. Y. Yeo, E. J. J. Chan, and C. Cheung, "Choroidal neovascularization: Mechanisms of endothelial dysfunction," Frontiers in Pharmacology, vol. 10, p. 1363, 2019. [CrossRef]
- N. Zaman, J. Ong, A. Tavakkoli, S. Zuckerbrod, and M. Webster, "Adaptation to Prominent Monocular Metamorphopsia using Binocular Suppression," Journal of Vision, vol. 22, no. 3, pp. 11-11, 2022. [CrossRef]
- L. Bourauel et al., "Spectral analysis of human retinal pigment epithelium cells in healthy and AMD affected eyes," Investigative Ophthalmology Visual Science, vol. 63, no. 7, pp. 4621–F0413-4621–F0413, 2022.
- V. P. Douglas, I. Garg, K. A. Douglas, and J. B. Miller, "Subthreshold Exudative Choroidal Neovascularization (CNV): Presentation of This Uncommon Subtype and Other CNVs in Age-Related Macular Degeneration (AMD)," Journal of Clinical Medicine, vol. 11, no. 8, p. 2083, 2022. [CrossRef]
- S. Notomi et al., "Characteristics of retinal pigment epithelium elevations preceding exudative age-related macular degeneration in Japanese," Ophthalmic Research, 2022. [CrossRef]
- E. Beltramo, A. Mazzeo, and M. Porta, "Extracellular Vesicles Derived from M1-Activated Microglia Induce Pro-Retinopathic Functional Changes in Microvascular Cells," in 32nd Meeting of the European Association for Diabetic Eye Complications (EAsDEC), 2022, vol. 32, no. suppl 1, pp. 5-6. [CrossRef]
- V. K. Jidigam et al., "Histopathological assessments reveal retinal vascular changes, inflammation, and gliosis in patients with lethal COVID-19," Graefe's Archive for Clinical Experimental Ophthalmology, vol. 260, no. 4, pp. 1275-1288, 2022. [CrossRef]
- F. M. Conedera and V. Enzmann, "Regenerative capacity of Müller cells and their modulation as a tool to treat retinal degenerations," Neural Regeneration Research, vol. 18, no. 1, p. 139, 2023. [CrossRef]
- B. E. Damato, "Anterior Intraocular Lesions," in Clinical Atlas of Ocular Oncology: Springer, 2022, pp. 79-136. [CrossRef]
- K. Jin et al., "Multimodal deep learning with feature level fusion for identification of choroidal neovascularization activity in age-related macular degeneration," Acta Ophthalmologica, vol. 100, no. 2, pp. e512-e520, 2022. [CrossRef]
- D. Ma et al., "Clinical explainable differential diagnosis of polypoidal choroidal vasculopathy and age-related macular degeneration using deep learning," Computers in biology medicine, vol. 143, p. 105319, 2022. [CrossRef]
- S. Kadry, V. Rajinikanth, R. González Crespo, and E. Verdú, "Automated detection of age-related macular degeneration using a pre-trained deep-learning scheme," The Journal of Supercomputing, pp. 1-20, 2022. [CrossRef]
- H. Wang and Z. Li, "The application of machine learning and deep learning to Ophthalmology: A bibliometric study (2000-2021)," in Human Interaction & Emerging Technologies (IHIET-AI 2022): Artificial Intelligence & Future Applications, vol. 23, A. Tareq and R. Taiar, Eds., 2022.
- W. Han, "A Review of Artificial Intelligence in Ophthalmology Field—Taking the Fundus Diagnosis Based on OCT Images as an Example," Artificial Intelligence and Robotics Research, vol. 10, pp. 306-312, 2021.
- H. Wang et al., "Deep learning for macular fovea detection based on ultra-widefield Fundus images," Computational and Mathematical Methods in Medicine, 2022.
- A. Singh and B. Pandey, "A new intelligent medical decision support system based on enhanced hierarchical clustering and random decision forest for the classification of alcoholic liver damage, primary hepatoma, liver cirrhosis, and cholelithiasis," Journal of healthcare engineering, vol. 2018, 2018. [CrossRef]
- S. Gogineni, A. Pimpalshende, and S. Goddumarri, "Eye Disease Detection Using YOLO and Ensembled GoogleNet," in Evolutionary Computing and Mobile Sustainable Networks: Springer, 2021, pp. 465-482. [CrossRef]
- A. M. Al-Zoubi, A. A. Heidari, M. Habib, H. Faris, I. Aljarah, and M. A. Hassonah, "Salp chain-based optimization of support vector machines and feature weighting for medical diagnostic information systems," in Evolutionary machine learning techniques: Springer, 2020, pp. 11-34. [CrossRef]
- M. Chhabra and R. Kumar, "An Advanced VGG16 Architecture-Based Deep Learning Model to Detect Pneumonia from Medical Images," in Emergent Converging Technologies and Biomedical Systems: Springer, 2022, pp. 457-471. [CrossRef]
- A. V. Ikechukwu, S. Murali, R. Deepu, and R. Shivamurthy, "ResNet-50 vs VGG-19 vs training from scratch: A comparative analysis of the segmentation and classification of Pneumonia from chest X-ray images," Global Transitions Proceedings, vol. 2, no. 2, pp. 375-381, 2021. [CrossRef]
- I. Lorencin, N. Anđelić, J. Španjol, and Z. Car, "Using multi-layer perceptron with Laplacian edge detector for bladder cancer diagnosis," Artificial Intelligence in Medicine, vol. 102, p. 101746, 2020. [CrossRef]
- W. Qiu, J. Zhu, G. Wu, H. Chen, W. Pedrycz, and P. N. Suganthan, "Ensemble many-objective optimization algorithm based on voting mechanism," IEEE Transactions on Systems, Man, and Cybernetics: Systems, vol. 52, no. 3, pp. 1716-1730, 2020. [CrossRef]
- P. Mooney. Retinal OCT Images (optical coherence tomography) [Online]. Available: https://www.kaggle.com/datasets/paultimothymooney/kermany2018.
- O. S. Naren. Retinal OCT - C8 [Online]. Available: https://www.kaggle.com/datasets/obulisainaren/retinal-oct-c8.
- k-s-sanjay-nithish. Retinal Fundus Images [Online]. Available: https://www.kaggle.com/datasets/kssanjaynithish03/retinal-fundus-images.
- Larxel. Retinal Disease Classification [Online]. Available: https://www.kaggle.com/datasets/andrewmvd/retinal-disease-classification.
- Larxel. Ocular Disease Recognition [Online]. Available: https://www.kaggle.com/andrewmvd/ocular-disease-recognition-odir5k.
- Z. Liang, J. X. Huang, J. Li, and S. Chan, "Enhancing automated COVID-19 chest X-ray diagnosis by image-to-image GAN translation," in 2020 IEEE International Conference on Bioinformatics and Biomedicine (BIBM), 2020, pp. 1068-1071: IEEE. [CrossRef]
- M. Mirza and S. Osindero, "Conditional generative adversarial nets," arXiv preprint arXiv:1411.1784, 2014. [CrossRef]
- S. M. Mousavi, A. Naghsh, A. A. Manaf, and S. Abu-Bakar, "A robust medical image watermarking against salt and pepper noise for brain MRI images," Multimedia Tools Applications, vol. 76, no. 7, pp. 10313-10342, 2017. [CrossRef]
- B. Dong et al., "Development of a fluorescence immunoassay for highly sensitive detection of amantadine using the nanoassembly of carbon dots and MnO2 nanosheets as the signal probe," Sensors Actuators B: Chemical, vol. 286, pp. 214-221, 2019. [CrossRef]
- I. S. Kornblau and J. F. El-Annan, "Adverse reactions to fluorescein angiography: A comprehensive review of the literature," Survey of ophthalmology, vol. 64, no. 5, pp. 679-693, 2019. [CrossRef]
- N. Quinn et al., "The clinical relevance of visualising the peripheral retina," Progress in retinal and eye research, vol. 68, pp. 83-109, 2019. [CrossRef]
- J. J. Emmatty, "Progression patterns of normal-tension glaucoma groups classified by hierarchical cluster analysis," Kerala Journal of Ophthalmology, vol. 34, no. 3, pp. 283-284, 2022. [CrossRef]
- F. Lopez-Tiro, H. Peregrina-Barreto, J. Rangel-Magdaleno, and J. C. Ramirez-San-Juan, "Localization of blood vessels in in-vitro LSCI images with K-means," in 2021 IEEE International Instrumentation and Measurement Technology Conference (I2MTC), 2021, pp. 1-5: IEEE. [CrossRef]
- N. Anton et al., "Assessing changes in diabetic retinopathy caused by diabetes mellitus and glaucoma using support vector machines in combination with differential evolution algorithm," Applied Sciences, vol. 11, no. 9, p. 3944, 2021. [CrossRef]
- J. Han et al., "Classifying neovascular age-related macular degeneration with a deep convolutional neural network based on optical coherence tomography images," Scientific Reports, vol. 12, no. 1, p. 2232, 2022. [CrossRef]
- J. Yoon et al., "Optical coherence tomography-based deep-learning model for detecting central serous chorioretinopathy," Scientific reports, vol. 10, no. 1, pp. 1-9, 2020. [CrossRef]
- M. Akil, Y. Elloumi, and R. Kachouri, "Detection of retinal abnormalities in fundus image using CNN deep learning networks," in State of the Art in Neural Networks and their Applications: Elsevier, 2021, pp. 19-61. [CrossRef]
- H. Xie et al., "Cross-attention multi-branch network for fundus diseases classification using SLO images," Medical Image Analysis, vol. 71, p. 102031, 2021. [CrossRef]
- A. K. Aggarwal, "Learning texture features from glcm for classification of brain tumor mri images using random forest classifier," Transactions on Signal Processing, vol. 18, pp. 60-63, 2022. [CrossRef]
- L. C. Brito, G. A. Susto, J. N. Brito, and M. A. V. Duarte, "Fault detection of bearing: An unsupervised machine learning approach exploiting feature extraction and dimensionality reduction," in Informatics, 2021, vol. 8, no. 4, p. 85: MDPI. [CrossRef]
- S. Nurmaini et al., "An automated ECG beat classification system using deep neural networks with an unsupervised feature extraction technique," Applied sciences, vol. 9, no. 14, p. 2921, 2019. [CrossRef]
- A. G. Karegowda and M. Jayaram, "Cascading GA & CFS for feature subset selection in medical data mining," in 2009 IEEE International Advance Computing Conference, 2009, pp. 1428-1431: IEEE. [CrossRef]
- A. Ozcift and A. Gulten, "Classifier ensemble construction with rotation forest to improve medical diagnosis performance of machine learning algorithms," Computer methods programs in biomedicine, vol. 104, no. 3, pp. 443-451, 2011. [CrossRef]
Figure 1.
Original figures of OCT images. Subfigures of D, E, and F are related to normal subjects. Subfigures of A, B, and C are related to the AMD subjects with drusen on choroid retina.
Figure 1.
Original figures of OCT images. Subfigures of D, E, and F are related to normal subjects. Subfigures of A, B, and C are related to the AMD subjects with drusen on choroid retina.
Figure 2.
Original figures of FAF images. Subfigures of D, E, and F are related to normal subjects. Subfigures of A, B, and C are related to the AMD subjects with choroidal neovascularization symptoms.
Figure 2.
Original figures of FAF images. Subfigures of D, E, and F are related to normal subjects. Subfigures of A, B, and C are related to the AMD subjects with choroidal neovascularization symptoms.
Figure 3.
Original figures of regular CFP images. Subfigures of D, E, and F are related to normal subjects. Subfigures of A and C are related to the wet-AMD subjects in the late stage, A is with symptoms of serous RPE detachments caused by the fluid exuded from the subretinal neovascular. C is with symptoms of sub-foveal hemorrhage with RPE detachment. B is with symptoms of late dry AMD of PRD detachments with large scale of fused drusen accompanied by hyperpigmentation.
Figure 4.
Original figures of UWF images. Subfigures of D, E, and F are related to normal subjects. Subfigures of A is the dry AMD subjects in the late stage with symptoms of large choroidal vessels, surrounded by glial scar tissue. B is the early dry AMD with calcified vitreous wart. C is late wet AMD of RPE detachment is caused by the fluid exuded from the subretinal neovascular membrane.
Figure 5.
The structure of VGG16 for AMD detection.
Figure 5.
The structure of VGG16 for AMD detection.
Figure 6.
The architecture of feature fusion and MLP classification.
Figure 6.
The architecture of feature fusion and MLP classification.
Figure 7.
data preprocessing process on OCT, FAF, regular CFP and UWF.
Figure 7.
data preprocessing process on OCT, FAF, regular CFP and UWF.
Figure 8.
CGAN OCT image generation workflow and preprocess based on SNP.
Figure 8.
CGAN OCT image generation workflow and preprocess based on SNP.
Figure 9.
CFS process on OCT database (A is the original figure, B is related to image feature identification by CFS, C is related to the segmented OCT image).
Figure 9.
CFS process on OCT database (A is the original figure, B is related to image feature identification by CFS, C is related to the segmented OCT image).
Figure 10.
ROI extraction.
Figure 10.
ROI extraction.
Figure 11.
Data enhancement based on SPN on regular CFP (A and B) and ROI-extracted from UWF (C, D, E, and F).
Figure 11.
Data enhancement based on SPN on regular CFP (A and B) and ROI-extracted from UWF (C, D, E, and F).
Figure 12.
Relationship between SSE and clusters for HC and K-Means.
Figure 12.
Relationship between SSE and clusters for HC and K-Means.
Table 1.
AMD detection model measurements.
Table 1.
AMD detection model measurements.
| Methods |
Data Type |
Loss |
Accuracy |
Test time/second (Per image) |
| Training Accuracy |
Test accuracy |
| Typical unsupervised learning methods |
HC |
OCT |
/ |
/ |
/ |
/ |
| Segmented OCT |
/ |
/ |
/ |
/ |
| FAF |
/ |
/ |
/ |
/ |
| Regular CFP |
/ |
/ |
/ |
/ |
| ROI-extracted UWF |
/ |
/ |
/ |
/ |
| Average values for all data types |
/ |
/ |
/ |
/ |
| K-Means |
OCT |
/ |
/ |
49% |
0.188 |
| Segmented OCT |
/ |
/ |
94.5% |
0.174 |
| FAF |
/ |
/ |
44% |
0.198 |
| Regular CFP |
/ |
/ |
55% |
0.197 |
| ROI-extracted UWF |
/ |
/ |
50.5% |
0.184 |
| Average values for all data types |
/ |
/ |
58.6% |
0.119 |
| Average values for Unsupervised learning methods |
/ |
/ |
58.6% |
0.11 |
| Typical supervised learning methods |
SVM |
OCT |
/ |
100% |
70% |
0.115 |
| Segmented OCT |
/ |
97.62% |
96% |
0.084 |
| FAF |
/ |
99.87% |
94.5% |
0.112 |
| Regular CFP |
/ |
96.94% |
55.5% |
0.117 |
| ROI-extracted UWF |
/ |
99.21% |
66% |
0.067 |
| Average values for all data types |
/ |
98.728% |
76.4% |
0.099 |
| VGG16 |
OCT |
0.024 |
100% |
82% |
0.084 |
| Segmented OC |
0.015 |
100% |
90% |
0.112 |
| FAF |
0.044 |
100% |
97% |
0.117 |
| Regular CFPF |
0.217 |
99.58% |
57% |
0.067 |
| ROI-extracted UWF |
0.009 |
100% |
81% |
0.099 |
| Average values for all data types |
0.0618 |
99.916% |
81.4% |
0.127 |
| ResNet |
OCT |
0.135 |
99.25% |
65% |
0.144 |
| Segmented OCT |
0.003 |
100% |
83.58% |
0.154 |
| FAF |
0.294 |
99.23% |
81.5% |
0.164 |
| Regular CFP |
0.185 |
99.72% |
47.5% |
0.132 |
| ROI-extracted UWF |
0.003 |
100% |
78.5% |
0.174 |
| Average values for all data types |
0.124 |
99.64% |
71.216% |
0.1536 |
| Average values for Unsupervised learning methods |
0.1858 |
99% |
76.3% |
0.14 |
| MLP-based fusion method for multiple data sources |
The integrated database |
0.094 |
96.43% |
85% |
0.074 |
| Multi-model fusion method based on voting mechanism |
OCT |
/ |
/ |
77% |
0.0111 |
| Segmented OCT |
/ |
/ |
98.5% |
0.0056 |
| FAF |
/ |
/ |
97% |
0.0097 |
| Regular CFP |
/ |
/ |
56% |
0.0122 |
| ROI-extracted UWF |
/ |
/ |
81% |
0.0085 |
| Average values for all data types |
/ |
/ |
81.9% |
0.00942 |
|
Disclaimer/Publisher’s Note: The statements, opinions and data contained in all publications are solely those of the individual author(s) and contributor(s) and not of MDPI and/or the editor(s). MDPI and/or the editor(s) disclaim responsibility for any injury to people or property resulting from any ideas, methods, instructions or products referred to in the content. |
© 2023 by the authors. Licensee MDPI, Basel, Switzerland. This article is an open access article distributed under the terms and conditions of the Creative Commons Attribution (CC BY) license (http://creativecommons.org/licenses/by/4.0/).


