Preprint
Article

Multimodal Neural Network System for Skin Cancer Recognition with a Modified Cross-Entropy Loss Function

Altmetrics

Downloads

455

Views

259

Comments

0

This version is not peer-reviewed

Submitted:

30 December 2022

Posted:

03 January 2023

You are already at the latest version

Alerts
Abstract
Currently, skin cancer is the most commonly diagnosed form of cancer in humans and is one of the leading causes of death in patients with cancer. Biopsy methods are an invasive research method and are not always available for primary diagnosis. Imaging methods have low accuracy and depend on the experience of the dermatologist. Artificial intelligence technologies can match and surpass visual analysis methods in accuracy, but they have the risk of a false negative response when a malignant pigmented lesion can be recognized as benign. One possible way to improve accuracy and reduce the risk of false negatives is to analyze heterogeneous data, combine different preprocessing methods, and use modified loss functions to eliminate the negative impact of unbalanced dermatological data. The paper proposes a multimodal neural network system with a modified cross-entropy loss function that is sensitive to unbalanced heterogeneous dermatological data. The accuracy of recognition in 10 diagnostically significant categories for the proposed system was 85.19%. The novelty of the proposed system lies in the use of cross-entropy loss when training the modified function with the help of weight coefficients. The introduction of weighting factors has reduced the number of false negative forecasts, as well as improved accuracy by 1.02-4.03 percentage points compared to the original multimodal systems. The introduction of the proposed multimodal system as an auxiliary diagnostic tool can reduce the consumption of financial and labor resources involved in the medical industry, as well as increase the chance of early detection of skin cancer.
Keywords: 
Subject: Computer Science and Mathematics  -   Artificial Intelligence and Machine Learning

1. Introduction

To date, skin cancer is the most frequently diagnosed form of oncopathology in humans and represents a wide range of malignancies [1]. More than 40% of the total number of diagnosed cancer cases in the world is skin cancer [2]. The sharp increase in the incidence of skin cancer is explained by chronic exposure to ultraviolet radiation (UV) [3] and the predominant skin phototypes I-II in the population [4,5], which are characterized by a high risk of malignant pigmented neoplasms.
Skin cancer can be divided into two types: non-melanoma and melanoma [6]. According to statistics from the World Health Organization (WHO), 325,000 new cases of melanoma were registered in 2020 [7], of which more than 17% of deaths were due to diagnosis at the last stage of oncopathology [8]. The median five-year survival rate for patients diagnosed with early-stage melanoma is about 99% [9]. In later stages, when the disease reaches the lymph nodes, the survival rate drops to 68% [10]. In the last stages, when the disease metastasizes to distant organs, the five-year survival rate is 27% [11].
Non-melanoma skin cancer (NMSC) includes basal cell carcinoma, squamous cell carcinoma, and other less common skin cancers [12]. NMSC accounts for about 1/3 of all malignant neoplasms diagnosed annually worldwide [13]. Although NMSC is 18-20 times more common than melanoma, there are epidemiological data for this type of cancer [14]. This type of skin cancer is often not registered in the databases of national cancer registries or registered incompletely since in most cases it is successfully treated with excision [15] or ablation [16]. A tumor diagnosed by pathohistology is coded by the International Classification of Diseases 11th revision (ICD-11) [17]. Melanoma has a C43 classifier, so the statistics for this diagnosis are reliable. The heterogeneous group of NMSCs has a single code (C44) to cover all types of non-melanoma cancers [18]. Therefore, separate data on basal cell carcinoma, squamous cell carcinoma, and other skin malignancies are not available [19], making it difficult to count and accurately assess individual diagnoses of NMSC [2]. Thus, there is a need to develop balanced auxiliary diagnostic tools aimed at identifying various non-melanoma and melanoma types of malignant skin lesions, including basal cell carcinoma, squamous cell carcinoma, and others.
A significant influence on the risk of skin malignant lesions is exerted by such statistical factors as age, gender, localization of the pigmented lesion on the body, genetic predisposition, melanin content in the skin layers, etc. [20]. The increase in the incidence of melanoma is directly proportional to age, as evidenced by the average age of diagnosis, which is approximately 60 years [21]. The relationship between the occurrence of malignant pigmented lesions and age becomes very clear in people over 75 years of age, when the incidence rate doubles [22]. Gender also has a significant impact on the risk of skin cancer. The incidence of melanoma in men is 1.5 times higher than in women [23]. The incidence of NMSC is also closely related to age and gender. At an early age, people of either sex show the same prevalence of any type of NMSC. However, in men older than 45 years, NMSC is diagnosed 2-3 times more often than in women [24]. Therefore, in the primary diagnosis, in addition to visual analysis, it is also necessary to take into account the complete clinical picture of each patient.
To date, the main form of skin cancer detection is a visual clinical examination using dermatoscopy [25]. Dermoscopy is a non-invasive method of analysis that allows you to study the diagnostically significant morphological features of pigmented skin lesions [26]. The average accuracy of visual diagnosis of malignant tumors by an experienced dermatologist is 65-75% [27,28]. This is because early diagnosis of skin cancer can be difficult due to similar morphological manifestations in benign and malignant skin lesions. The method of visual diagnostics requires extensive training and experience from a specialist in the field of dermatology [29]. If a malignancy is suspected, a histopathological examination is performed using a biopsy, which is an invasive diagnostic method. Histopathological analysis is considered the "gold standard" for diagnosing skin cancer. However, it is time-consuming and may be inconclusive in borderline cases. Discrepancies in diagnosis between individual pathologists can be up to 25% [30,31].
Artificial intelligence technologies make it possible to analyze skin pigment lesions in a faster, more convenient, and more affordable way [32]. The main task of such systems is the preliminary assessment of suspicious pigmented skin lesions using high-quality histopathologically confirmed clinical images and machine learning methods [33]. However, such systems cannot replace the decisive opinion of the pathologist and dermatologist-oncologist in the diagnosis of skin cancer due to the possibility of false negative predictions [34]. Therefore, at present, the development of high-precision intelligent systems that can be used as auxiliary diagnostic tools for detecting malignant neoplasms at an early stage is becoming relevant.
One of the main problems of existing medical datasets is the asymmetric distribution of data toward the category of healthy patients [35]. Deficiency or excessive excess of one or more categories is associated with the clinical characteristics of patients and disease characteristics, as well as research results. As a result, a large number of negative cases of the disease are diagnosed compared with a small number of positive cases of pathologies [36]. Due to the influence of the more common category on traditional machine learning methods, the prediction results are good in the majority categories, but not accurate enough in the minority categories. There is a risk of false negative predictions, which can have potentially fatal consequences for patients.
To solve the problem of data imbalance, there are several approaches based on the transformation of training data [37], the modification of training methods [38], the development of single-class classifiers [39], and classifier ensembles [40]. The augmentation method using affine transformations allows you to increase the amount of training data due to minor changes in the color, size, and shape of images [41]. However, simple operations are not enough to significantly increase the accuracy of recognition of the minority category or overcome the problem of overfitting [42]. The resampling method balances the training data and can be used as oversampling in minority categories [43], undersampling in majority categories [44], or as a combination of both methods [45]. A significant disadvantage of this method is the possibility of skipping significant diagnostic data during machine learning, as well as an increase in computational costs during data processing [46].
Another approach is to modify training methods with weighting factors, where higher losses are assigned to minority categories [47,48]. Since the cost of classification loss is taken into account during machine learning by neural network algorithms, cost-based learning methods are the most optimal for datasets with skewed distribution [49].
The rest of the work is structured as follows. Section 2 is divided into several subsections. In subsection 2.1. a description of methods for pre-processing heterogeneous dermatological data is proposed. In subsection 2.2. a description of the modification of the cross-entropy loss function using weighting factors for unbalanced dermatological data is given. In subsection 2.3. a description of a multimodal neural network system for processing heterogeneous dermatological data with a modified cross-entropy loss function, which is sensitive to unbalanced data, is presented. Section 3 presents the results of modeling the proposed balanced-trained multimodal neural network system for the classification of pigmented neoplasms with the stage of data preprocessing. Section 4 discusses the obtained results and compares them with known works on neural network classification of dermatological skin images. In conclusion, the results of the work are summarized.

2. Materials and Methods

This study proposes a multimodal neural network system with a modified cross-entropy loss function, which is shown in Figure 1. The system analyzes heterogeneous data to recognize malignant pigmented skin lesions. As heterogeneous data, information from two different modalities is used, such as dermatological images and statistical information about the patient (age, gender, localization of the pigmented lesion on the body). Dermatological data undergoes a pre-processing stage to improve diagnostically significant features, as well as further transformation into the format required as input for neural network systems. For the analysis of visual data, various convolutional neural network architectures are used, pre-trained on a set of natural ImageNet images. As a neural network architecture for the analysis of statistical data, a selected optimal architecture of a multilayer perceptron, consisting of three linear layers, is used. The proposed system is trained using a modified cross-entropy loss function using weighting factors. Weighting coefficients are calculated in a special way for a selected database of unbalanced dermatological data.

2.1. Pre-processing of heterogeneous dermatological data

The most common types of data in the field of dermatology are visual multidimensional data and patient statistics. Statistical data include gender, age, as well as the localization of the pigmented neoplasm on the patient's body. Visual clinical examination of the skin is the main form of diagnosing oncopathologies. The statistical parameters of the patient may also indicate the risk of developing malignant forms of pigmented skin lesions. Therefore, there is a need for a comprehensive analysis of heterogeneous data for more accurate diagnosis [50]. The combination of visual data, as well as multidimensional statistical data on patients, allows you to create heterogeneous databases of dermatological information that can be used to build intelligent diagnostic systems and decision support for specialists, physicians, and clinicians [51]. The use of heterogeneous information makes it possible to increase the accuracy of neural network analysis by searching for additional links between visual objects of research and statistical metadata [52].
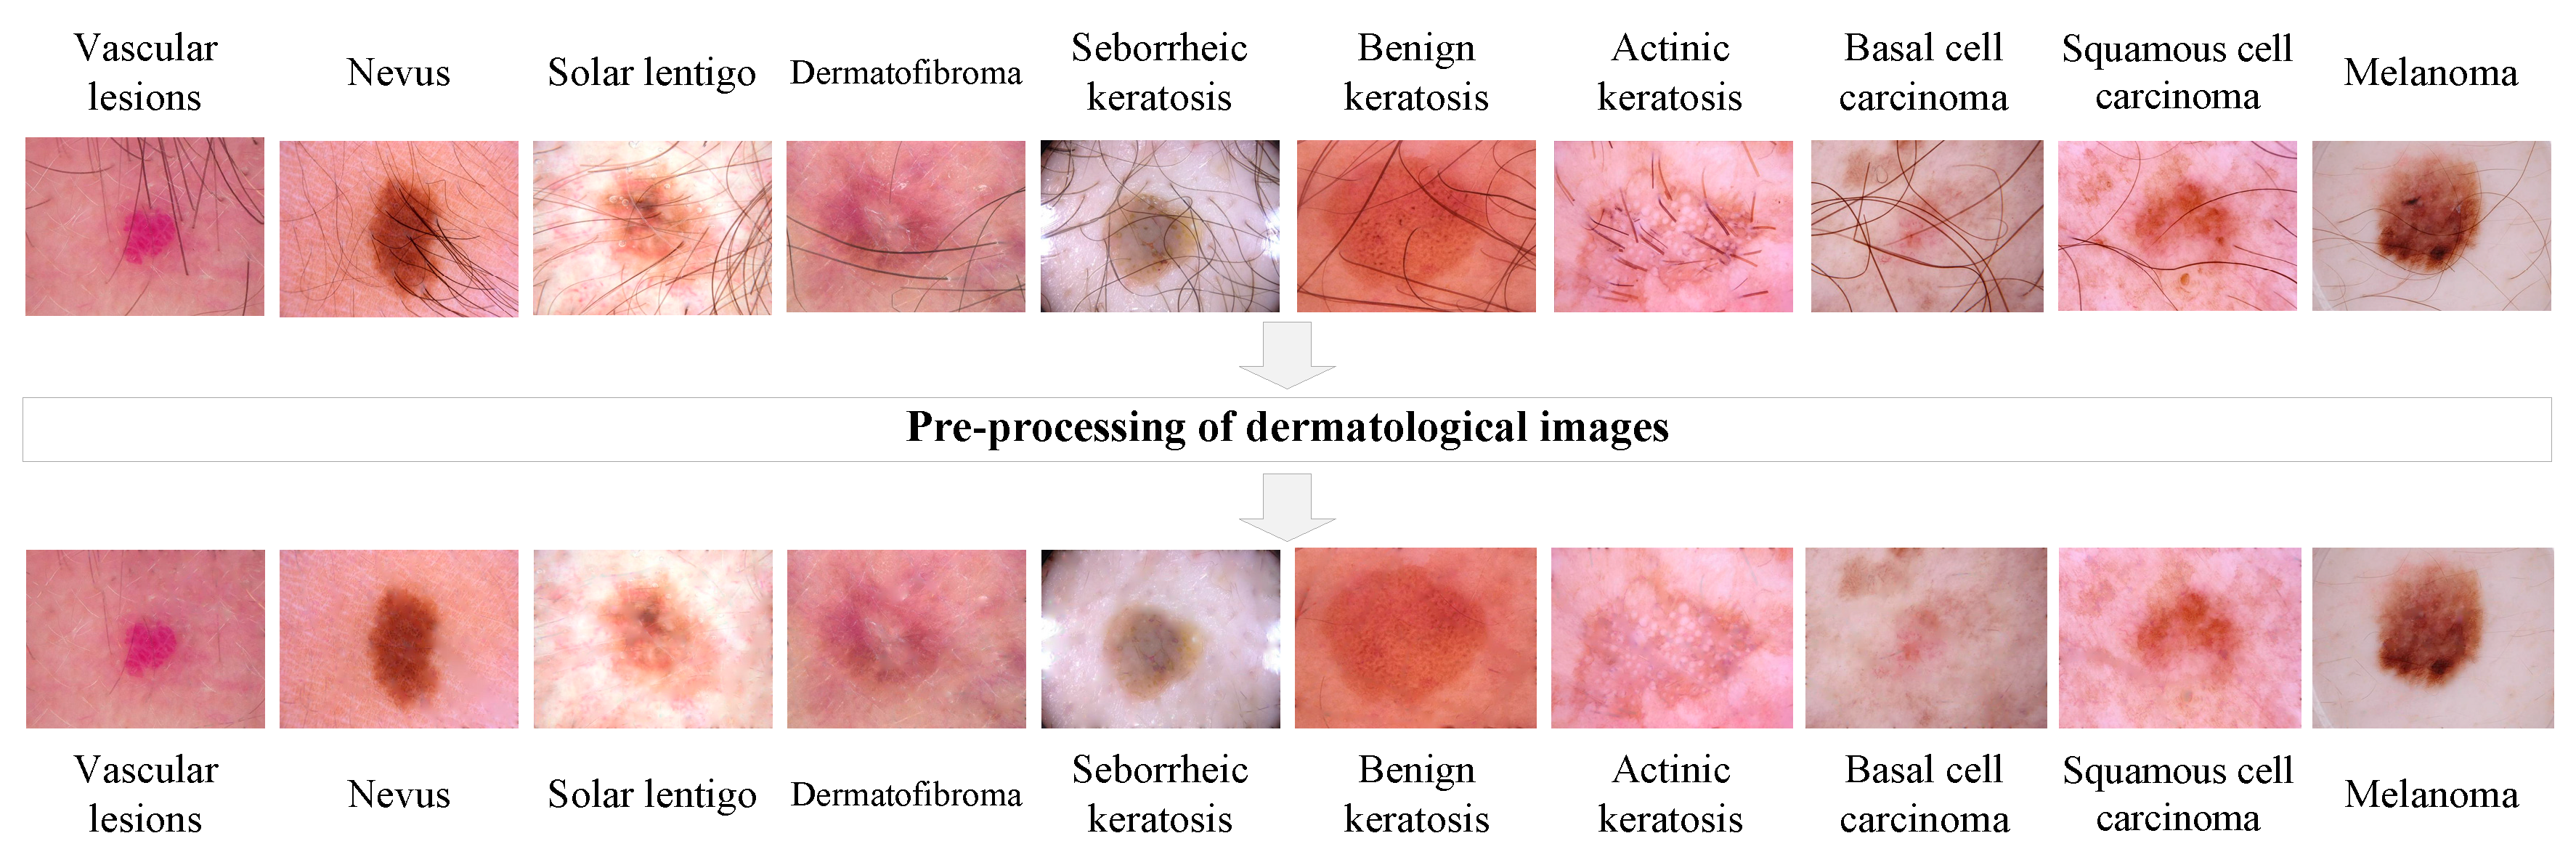
Diagnostically significant multidimensional visual information can be distorted by noises of various natures, as well as by various physiological factors. The presence of hair structures on dermatological images violates the geometric properties of the site of the pigmented neoplasm [53]. These noise distortions can drastically change the size, shape, color, and texture of a lesion. This significantly affects the result of the analysis of auxiliary automated diagnostic systems. Hair removal from images at the preprocessing stage is an important step in the development of systems based on artificial intelligence [54]. For preliminary digital processing of visual data, a method was proposed for cleaning hair structures using morphological operations. The proposed method is presented in the paper [55] and consists of four stages. In the first stage, the processed dermatological RGB image of the pigmented neoplasm is decomposed into color components. Further processing is performed separately for each color component. In the second stage, the location of hair structures is determined using a morphological closing operation with a given element. In the third stage, hair pixels are replaced with neighboring pixels using interpolation. In the fourth stage, the reverse construction of the dermatological RGB image from the color components is performed. The use of the proposed method for cleaning hair structures can significantly improve the recognition accuracy of the neural network system by improving the quality of visual diagnostically significant information. An example of the phased work of the used method for pre-cleaning hair structures is shown in Figure 2.
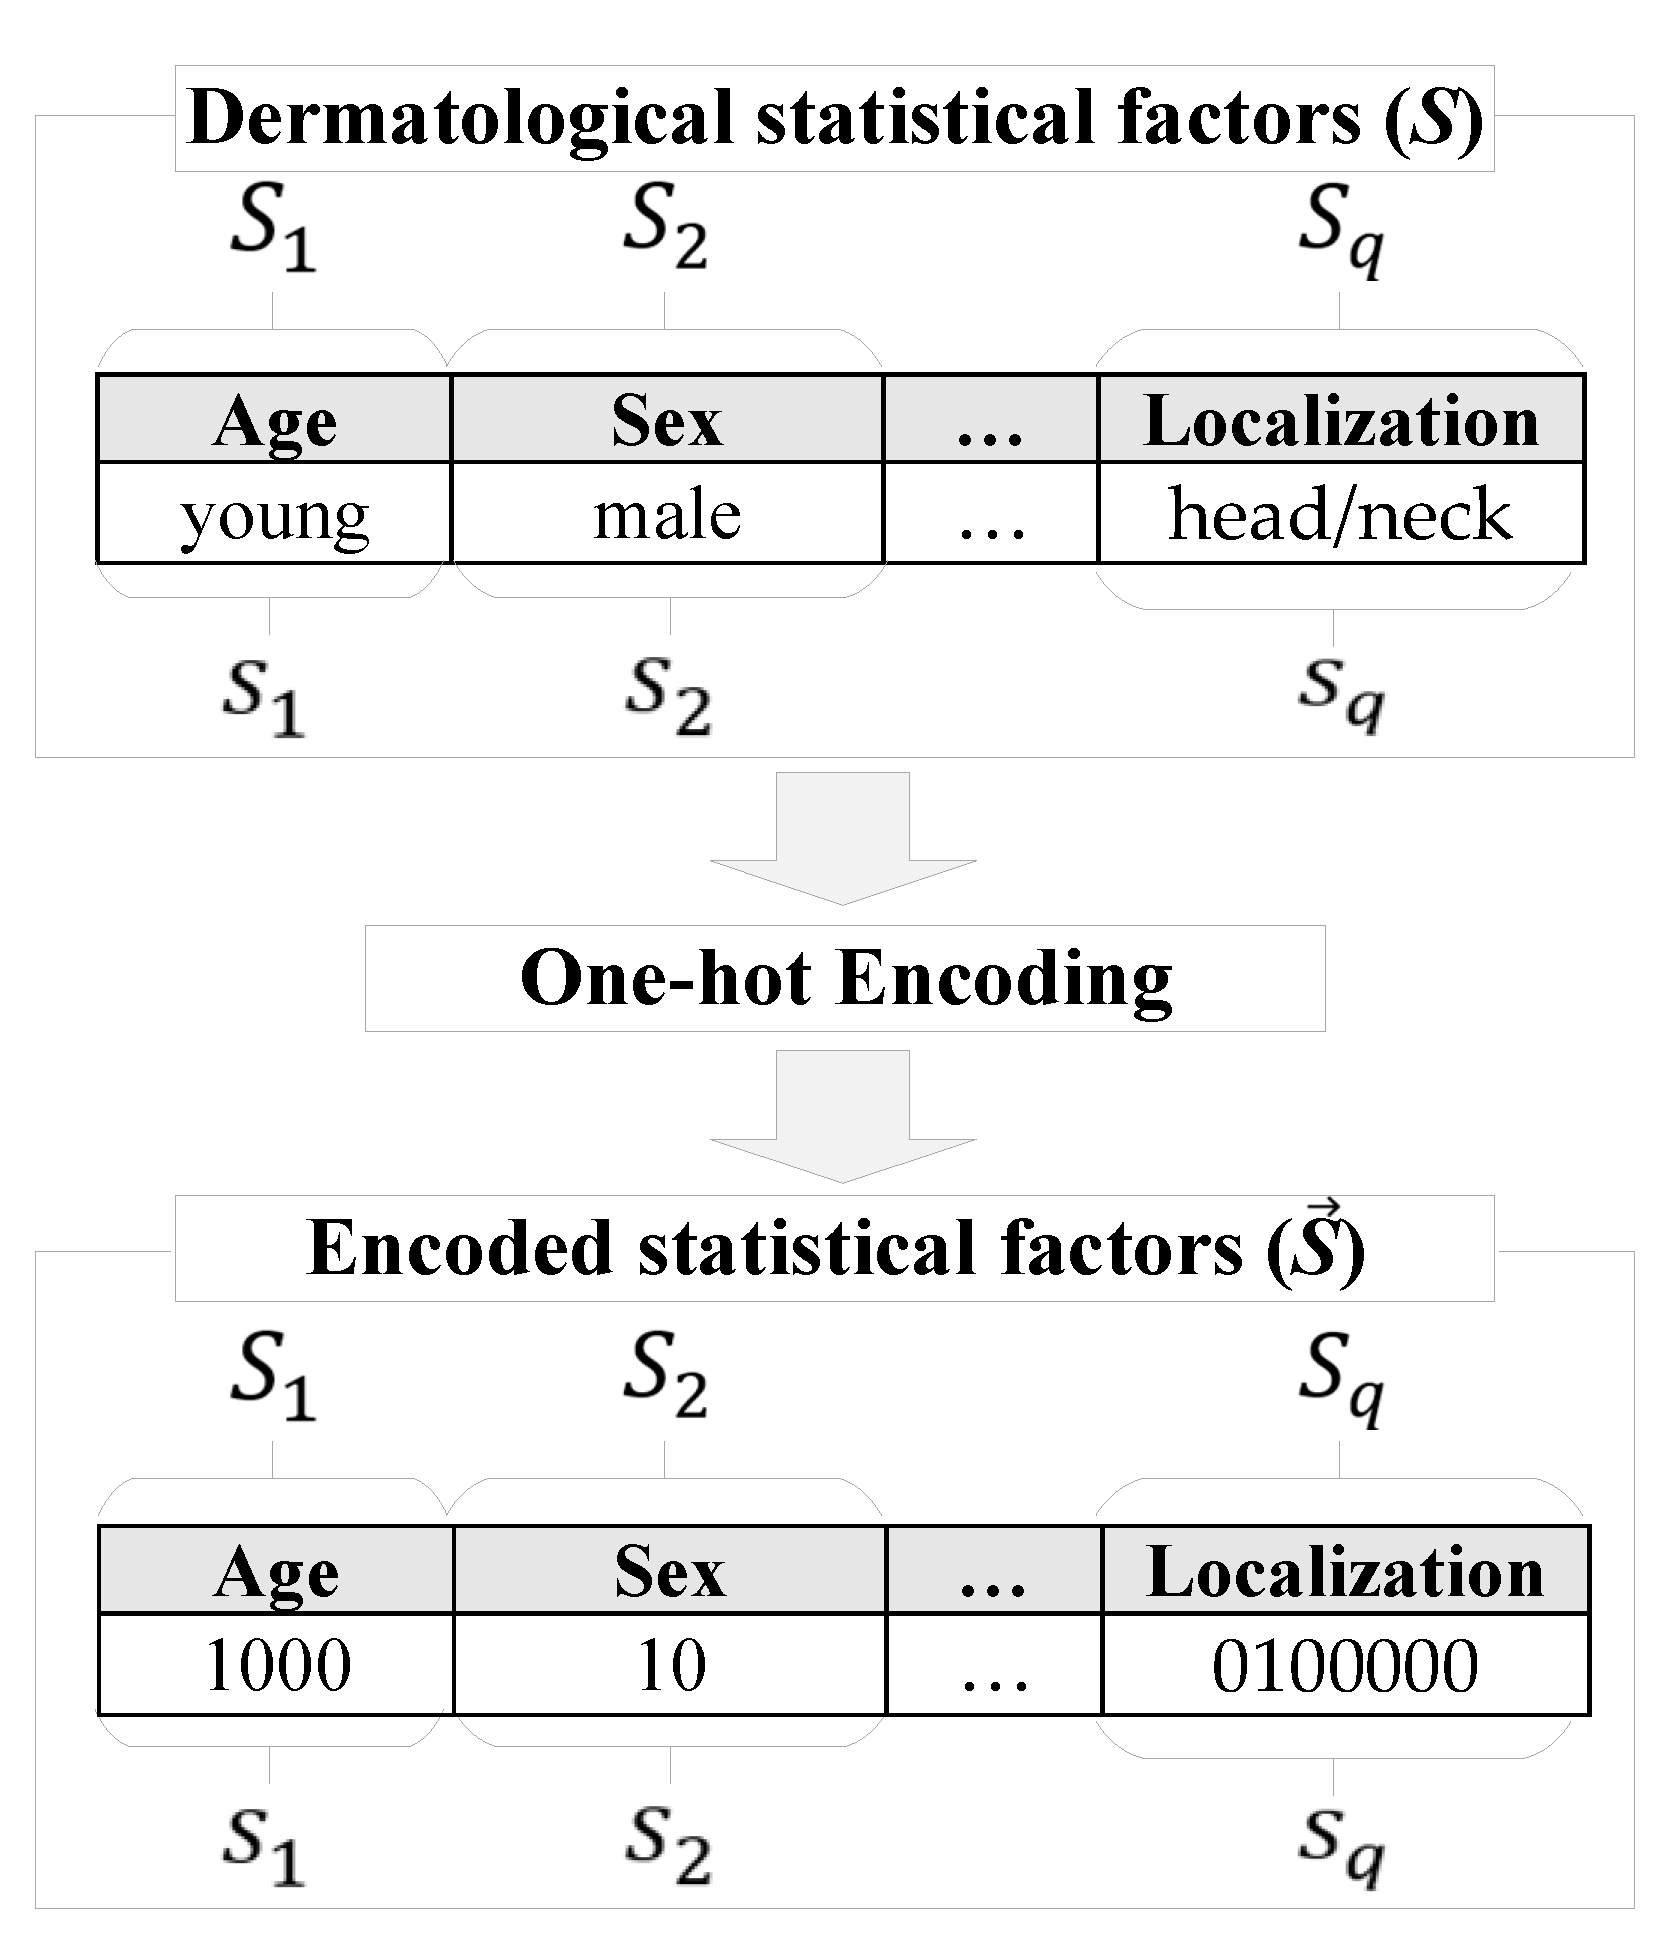
Most systems based on artificial intelligence require as input a feature vector in the form of integers [56]. Converting categorical variables to a numerical format is a necessary step for correctly calculating the correlation between them and further intelligent prediction [57]. The most common way to preprocess categorical variables is the one-hot encoding method [58]. As a result, categorical variables with multiple possible values are transformed into a new set of numeric position vectors, all elements of which are equal to zero, except for the position of the variable value in the list of all possible values [59]. The processed statistical data S includes a certain number of patient factors:
S = s 1 , s 2 , , s q ;   s q S q ,
where S q is the patient's statistical factor; s q is a pointer to a specific patient parameter. If S 1 indicates the localization factor of the pigmented neoplasm on the patient's body, then s 1 can take one of eight possible values, such as localization on the anterior torso, head/neck, lateral torso, lower extremity, oral/genital, palms/soles, posterior torso or upper extremity.
When processing statistical data using the one-time coding method, the dimension of the input feature vector S is formed as follows:
dim S = q φ q = q | S q | ,
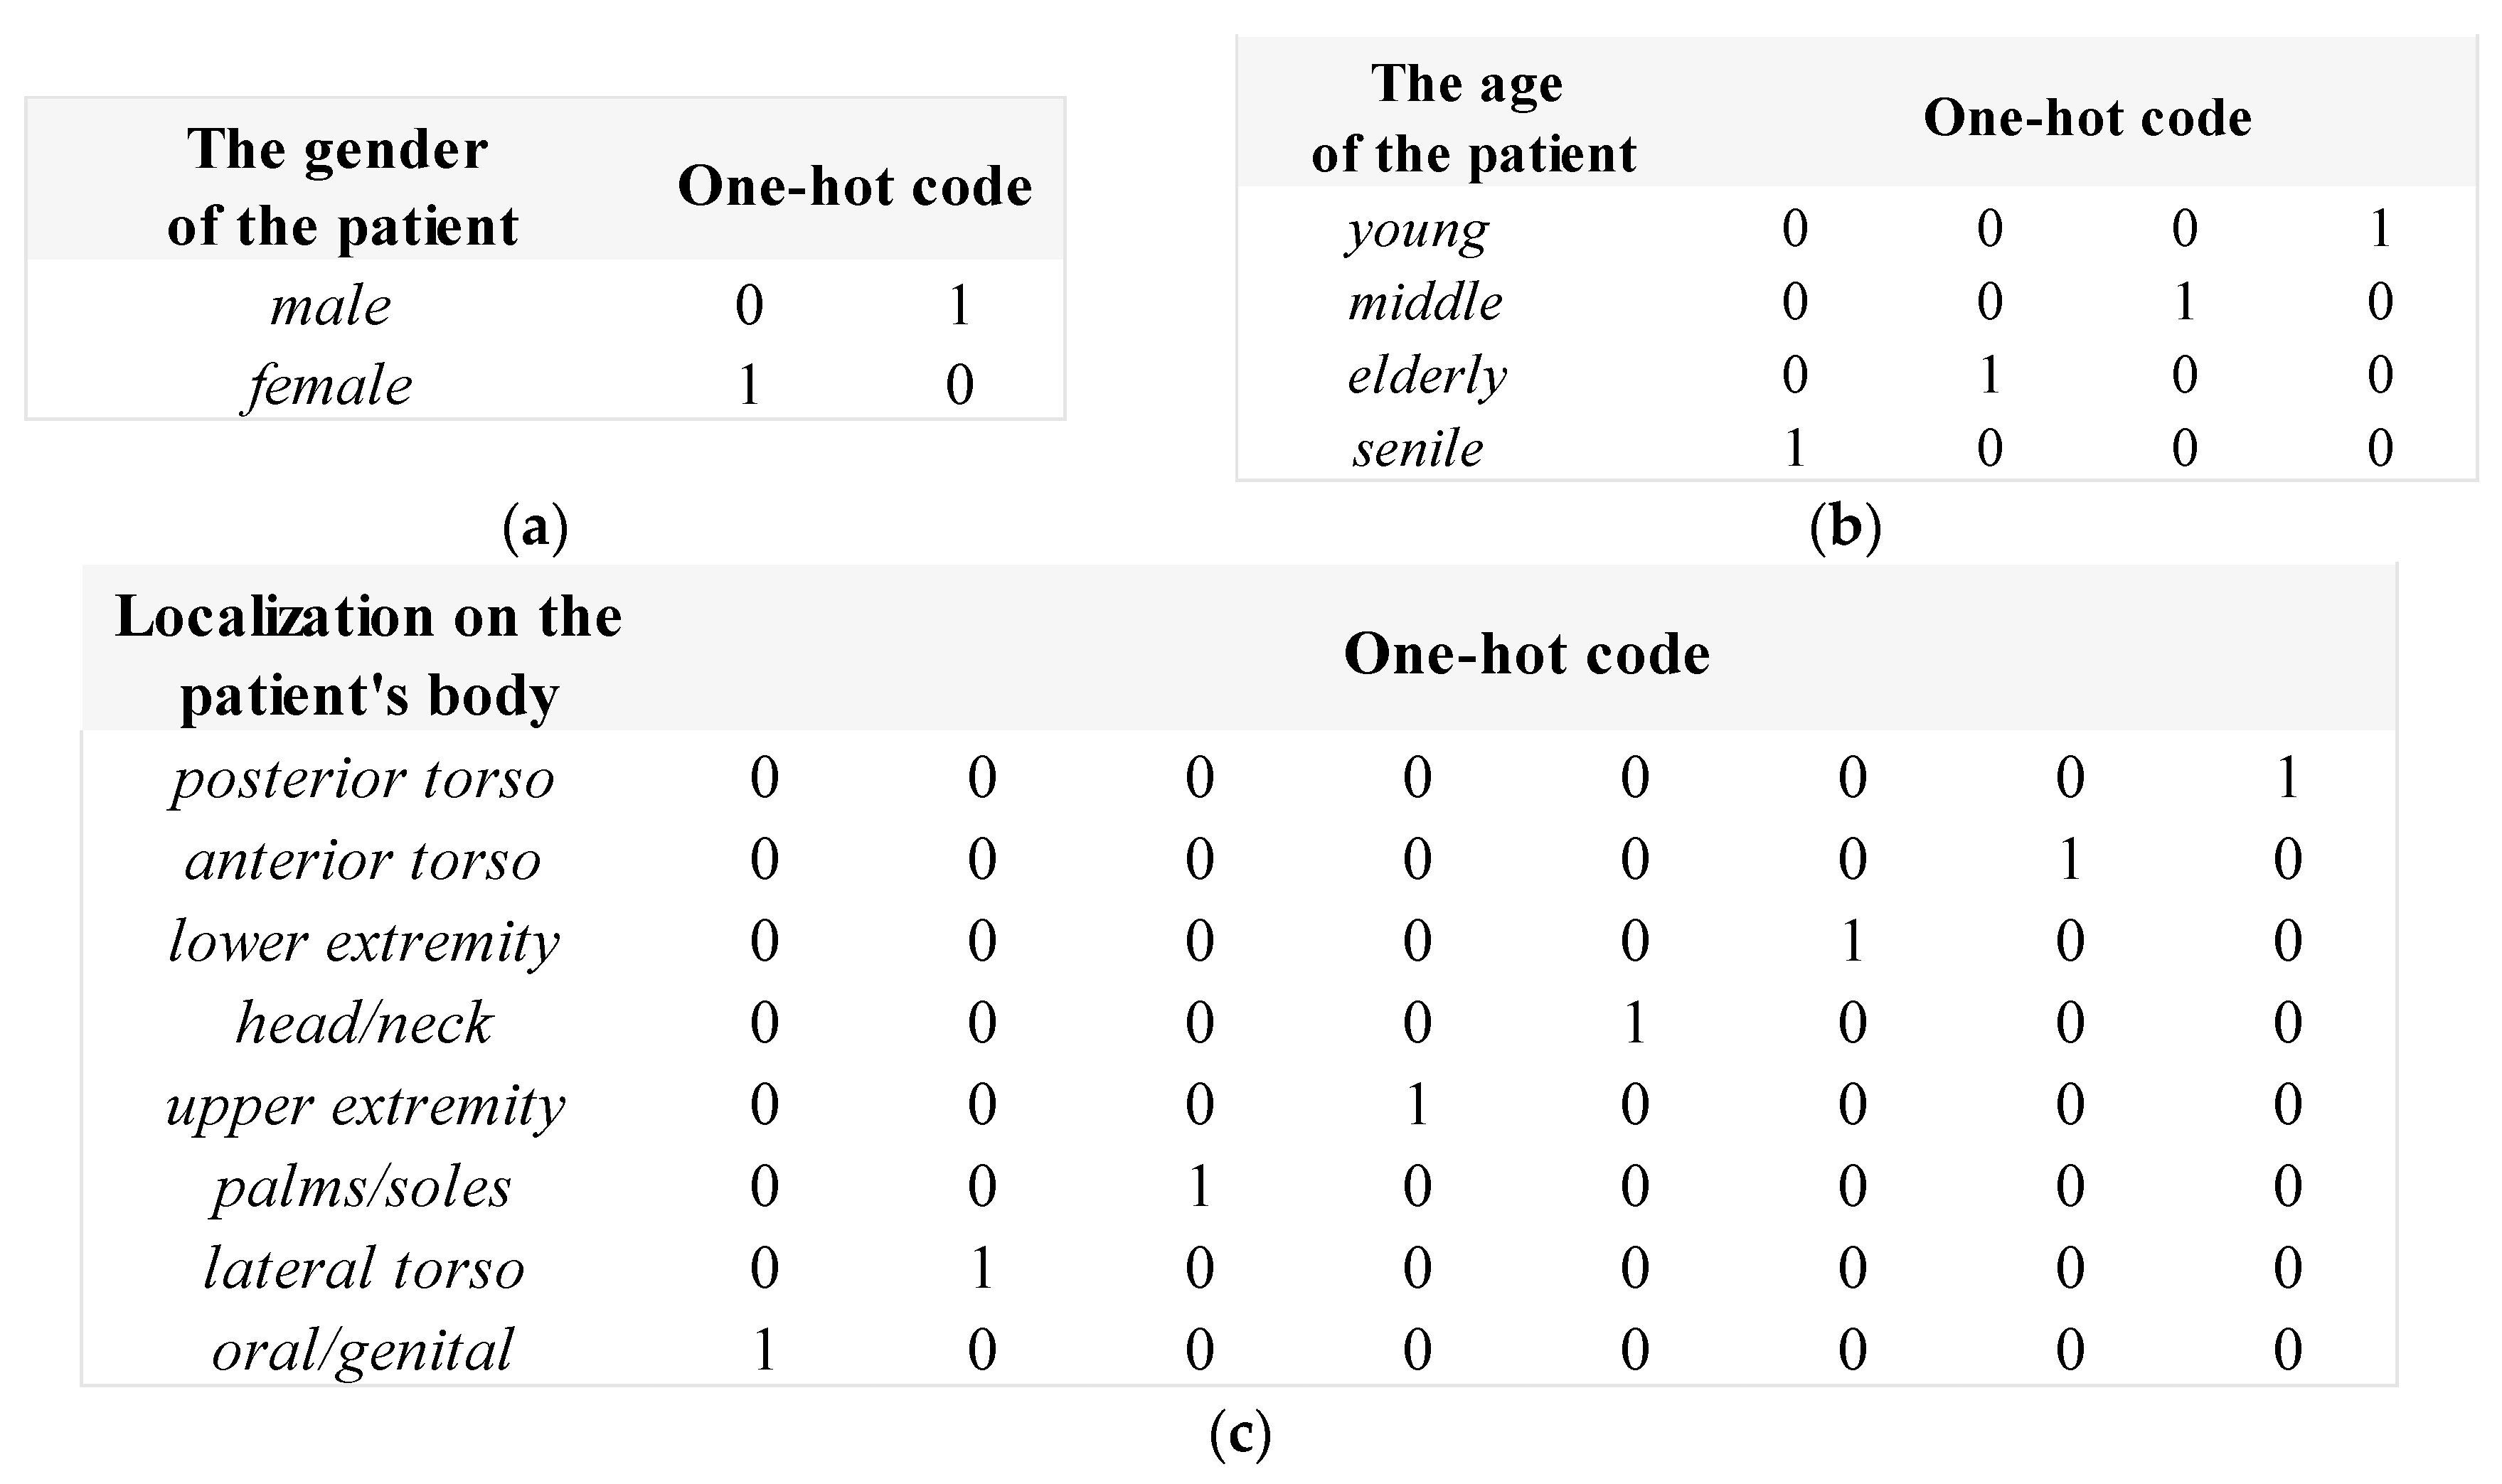
where φ q is the cardinality of the statistical factor S q , which depends on the number of all possible values of the factor. For each statistical factor S q , the order is carried out in an arbitrary fixed way. As a result of encoding, for each possible value of the statistical factor S q , a binary code is reserved, the length of which depends on the power. The code 100 0 φ q is reserved for the first possible value. For the second possible value of the statistical factor S q , the code 010 0 φ q , etc. is reserved. Thus, the total binary length depends on the total number of possible values for each statistical factor. The scheme for processing dermatological statistical data using the one-hot encoding method is shown in Figure 3.

2.2. Modification of the cross-entropy loss function using weight coefficients

With the development of artificial intelligence technologies and the advent of large amounts of digital information, machine learning algorithms began to strive to increase the speed and accuracy of extracting information from processed data. The main goal of machine learning algorithms is to solve the problem of optimization-minimization of structural risks, which can be represented as follows:
N = min f 1 K i = 1 K C θ f x i + Λ M ( f ) ,
where K is the number of examples in the training set; C is the error function with parameter vector θ ; M is the regularization element that represents the complexity of the model; Λ 0 is the balance between empirical risk and the complexity of the neural network model.
The loss function is the main part of training a neural network model and is used to adjust the weights of the neural network [60]. As a result of processing training examples by a neural network, output responses are generated that indicate the probability or reliability of possible categories to which the analyzed data belong [61]. The resulting probabilities are compared with the true labels. The loss function calculates a penalty for any deviation between the true label and the output of the neural network [62]. As a rule, in deep learning, the use of the logarithmic loss function is considered the most optimal [63]. To solve the problem of multiple classification, the softmax  C c e cross-entropy loss function is used, which has the form:
C c e = 1 K n = 1 N i = 1 K l i n × log h μ x i , n ,
where N is the number of categories in the training database; l i n is the true label for training case i from category n ; x i is the input of training case i ; h μ is the neural network model with weights μ .
When developing artificial intelligence-based skin cancer recognition systems, it is critical to solve the problem of class imbalance to minimize the occurrence of false negative predictions. Most of the existing publicly available dermatological datasets have an asymmetric distribution towards benign pigmented neoplasms [64]. The number of diagnosed benign cases of pigmented lesions in training databases can exceed the number of patients with a detected form of malignancy by a factor of two. When training on bases with a large number of categories, the difference between the most common and the least common category can be more than a hundred times. If the training examples contain a significant imbalance in the data, then the AI-based classifier will tend to focus on the categories with the largest number of samples [65]. The standard loss function will be successfully minimized when the neural network classifier predicts all input data as “benign” [66]. Thus, there may be a shift in classification efficiency towards the prevailing category [67]. To solve this problem, the most optimal is the use of unequal costs for misclassification between categories, which can be defined as a cost matrix or weighting coefficients [68].
The cost of expenses can be considered as a penalty coefficient, which is introduced when training a neural network model [69]. When developing systems for intelligent recognition of pigmented skin lesions, the penalty factor is aimed at increasing the significance of the least common classes of malignant pigmented neoplasms. As a result, there is a stronger penalty for misclassifying data from a minority sample. The neural network classifier focuses on and more carefully analyzes the data coming from this distribution. The calculation of the cost of training costs d n is inversely proportional to the frequency of categories in the database and has the following form:
d n = K N i = 1 K p i n ,
where N is the number of dermatological categories; p i n is an indication that image i belongs to category n .
The modification of the cross-entropy loss function using weight coefficients C c e can be represented as follows:
C c e = 1 K n = 1 N i = 1 K d c × l i n × log h μ x i , n ,
where d n is the weighting factor for category n .
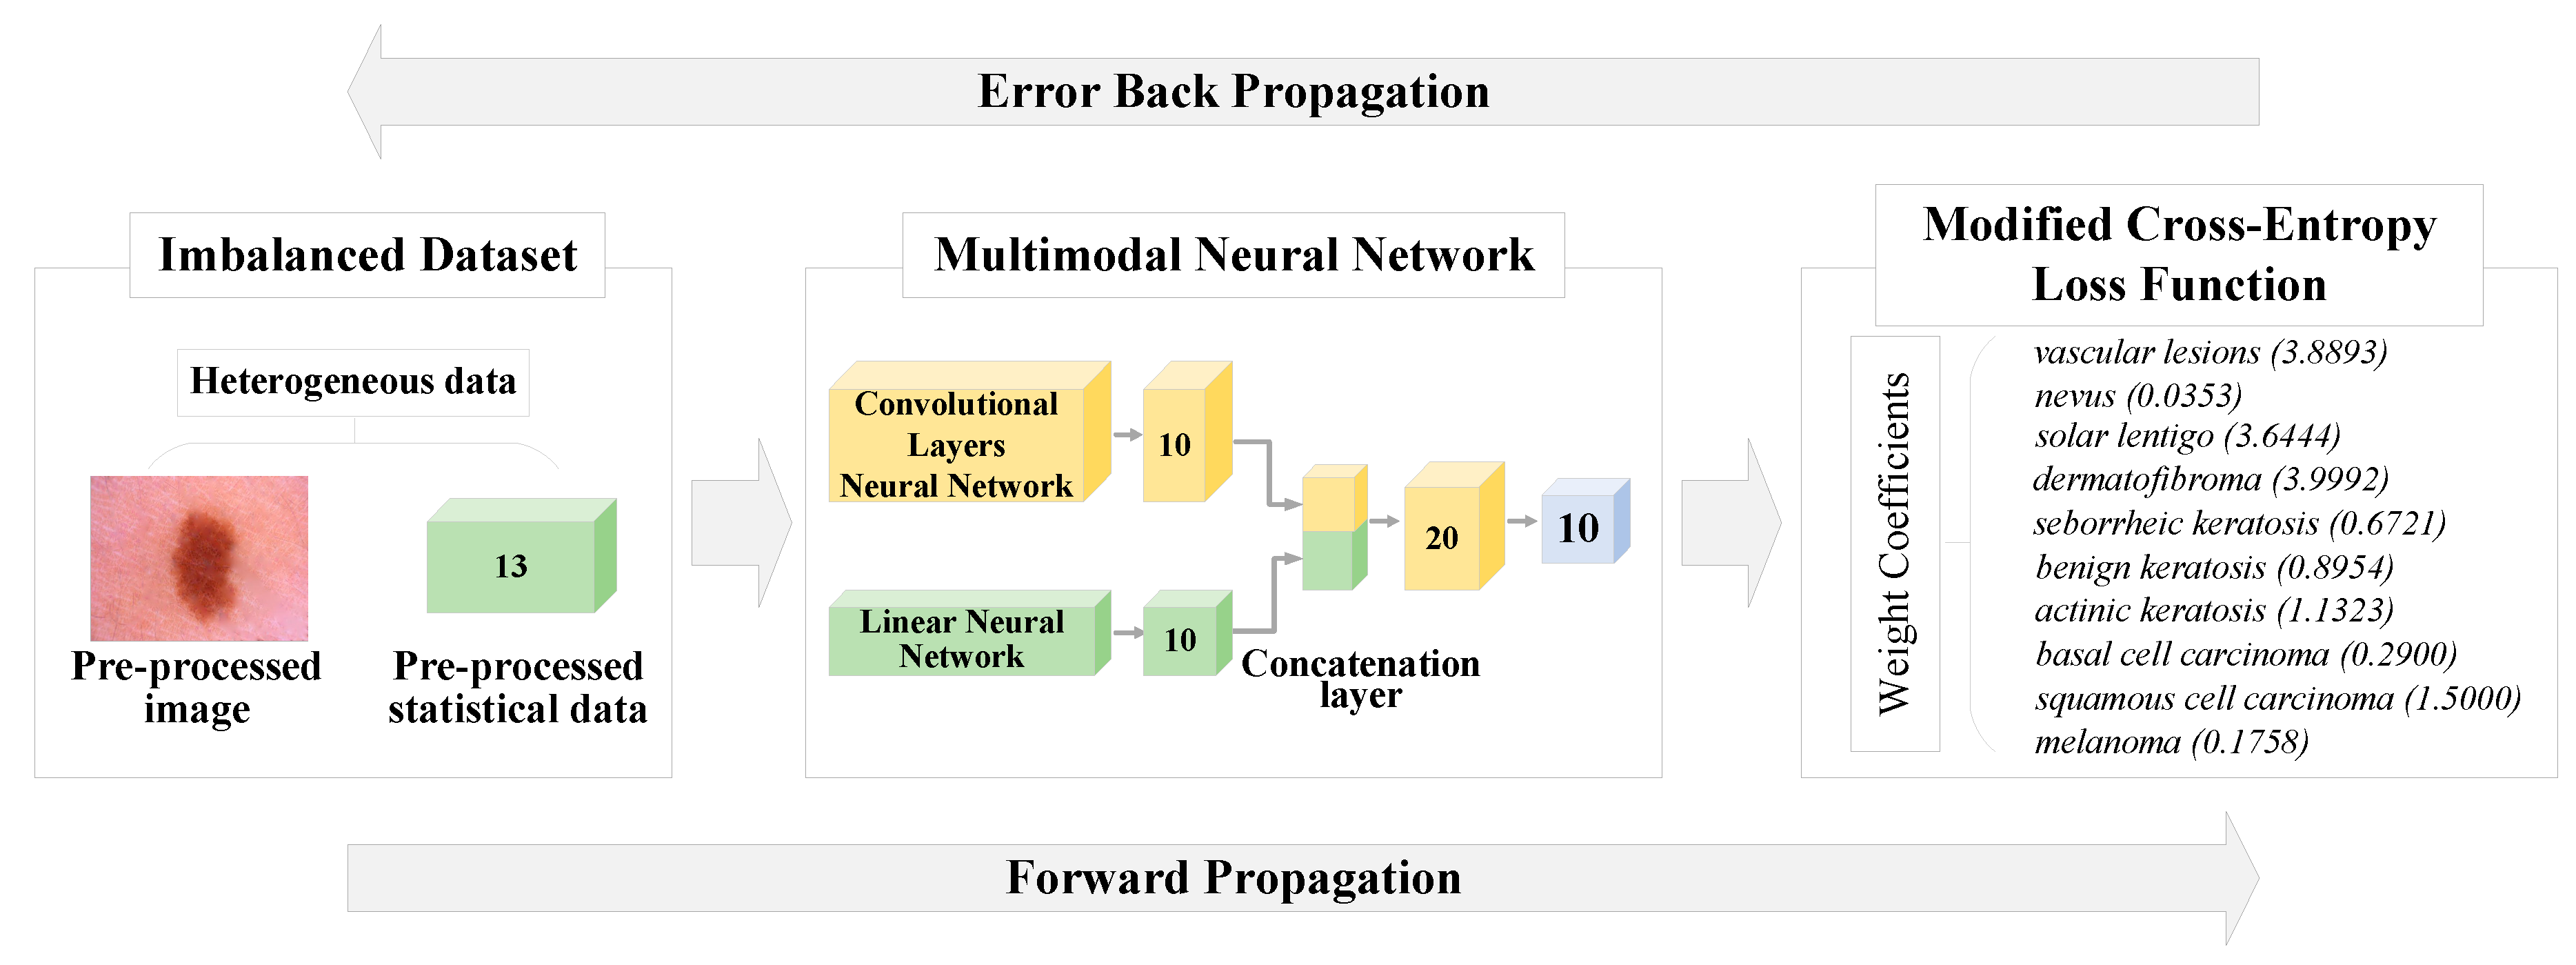
Thus, modification of the cross-entropy loss function will minimize the impact of unbalanced data and avoid bias in the classification results towards the more common category of benign skin lesions. Figure 4 shows a diagram of the application of the modified cross-entropy loss function for training a multimodal neural network system for recognizing pigmented skin lesions.

2.3. Multimodal neural network system for the analysis of unbalanced dermatological data

To date, multimodal machine learning is a promising area of research in which models are developed to analyze information from several modalities [70]. The fusion of heterogeneous data takes into account the representation of features of various modalities for a more complete analysis and allows the use of multidimensional heterogeneous information for making decisions in a neural network model [71]. The non-obvious relationship between the processed data and the results of diagnostics is extracted through an additional neural network study of information between modalities. Thus, neural networks can use additional data by integrating several modalities into a common structure [72].
Convolutional neural networks (CNNs) are the most optimal neural network architecture for recognizing multidimensional visual data [73]. For the analysis of statistical data, the most optimal is a multilayer feed-forward perceptron [74]. The proposed multimodal neural network system consists of two neural network architectures. For the analysis of visual dermatological data presented by images of pigmented skin lesions, the CNN architecture is used. A linear multilayer perceptron is used to process statistical factors.
The input of the proposed multimodal neural network system receives pre-processed dermatological images D r g b , the vector of statistical features S . In a multilayer perceptron, neurons perform the summation of the received input data vector S and the bias coefficient b, forming a synaptic input. As a result of training, the weights of neurons are iteratively formed as follows:
v a + 1 = w a + r × E w ,
where r is the learning rate; E w is the error gradient concerning the weights. After the signal passes through the ReLU activation function, the output signal of the neuron is calculated:
v s = f i n z i v i + b ,
Obtaining feature maps as a result of processing D r g b dermatological images is performed in parallel as follows:
D f x , y = b + i = w 1 2 w 1 2 j = w 1 2 w 1 2 n = 0 D 1 w i j n 1 D x + i ,   y + j , n ,
where D f is the feature map of the dermatological image; w i j n 1 is the c × c size filter factor, b is the offset factor.
On the concatenation layer, the resulting feature map D f and the output signal v s are combined as follows:
E = i j n D f w i j n ( 2 ) + i = 1 n v s w i n ( 3 ) ,
where w i j n ( 2 ) is the weight for processing feature maps of dermatological images D f ; w i n ( 3 ) is the weight for processing the output signal of the multilayer perceptron.
The last layer of the multimodal neural network system is activated through the function softmax  D y x ,   θ = s o f t m a x x ; θ . After that, the resulting output probability distribution between categories is compared with the original correct distribution. The modified cross-entropy loss function C c e is used only in neural network systems with the specified output function. As a result, the loss function C c e indicates the distance between the output distribution and the original probability distribution. There is a gradual memorization of true vectors and a minimization of losses during training. The architecture of the proposed multimodal neural network system with a modified cross-entropy loss function is shown in Figure 5.

3. Results

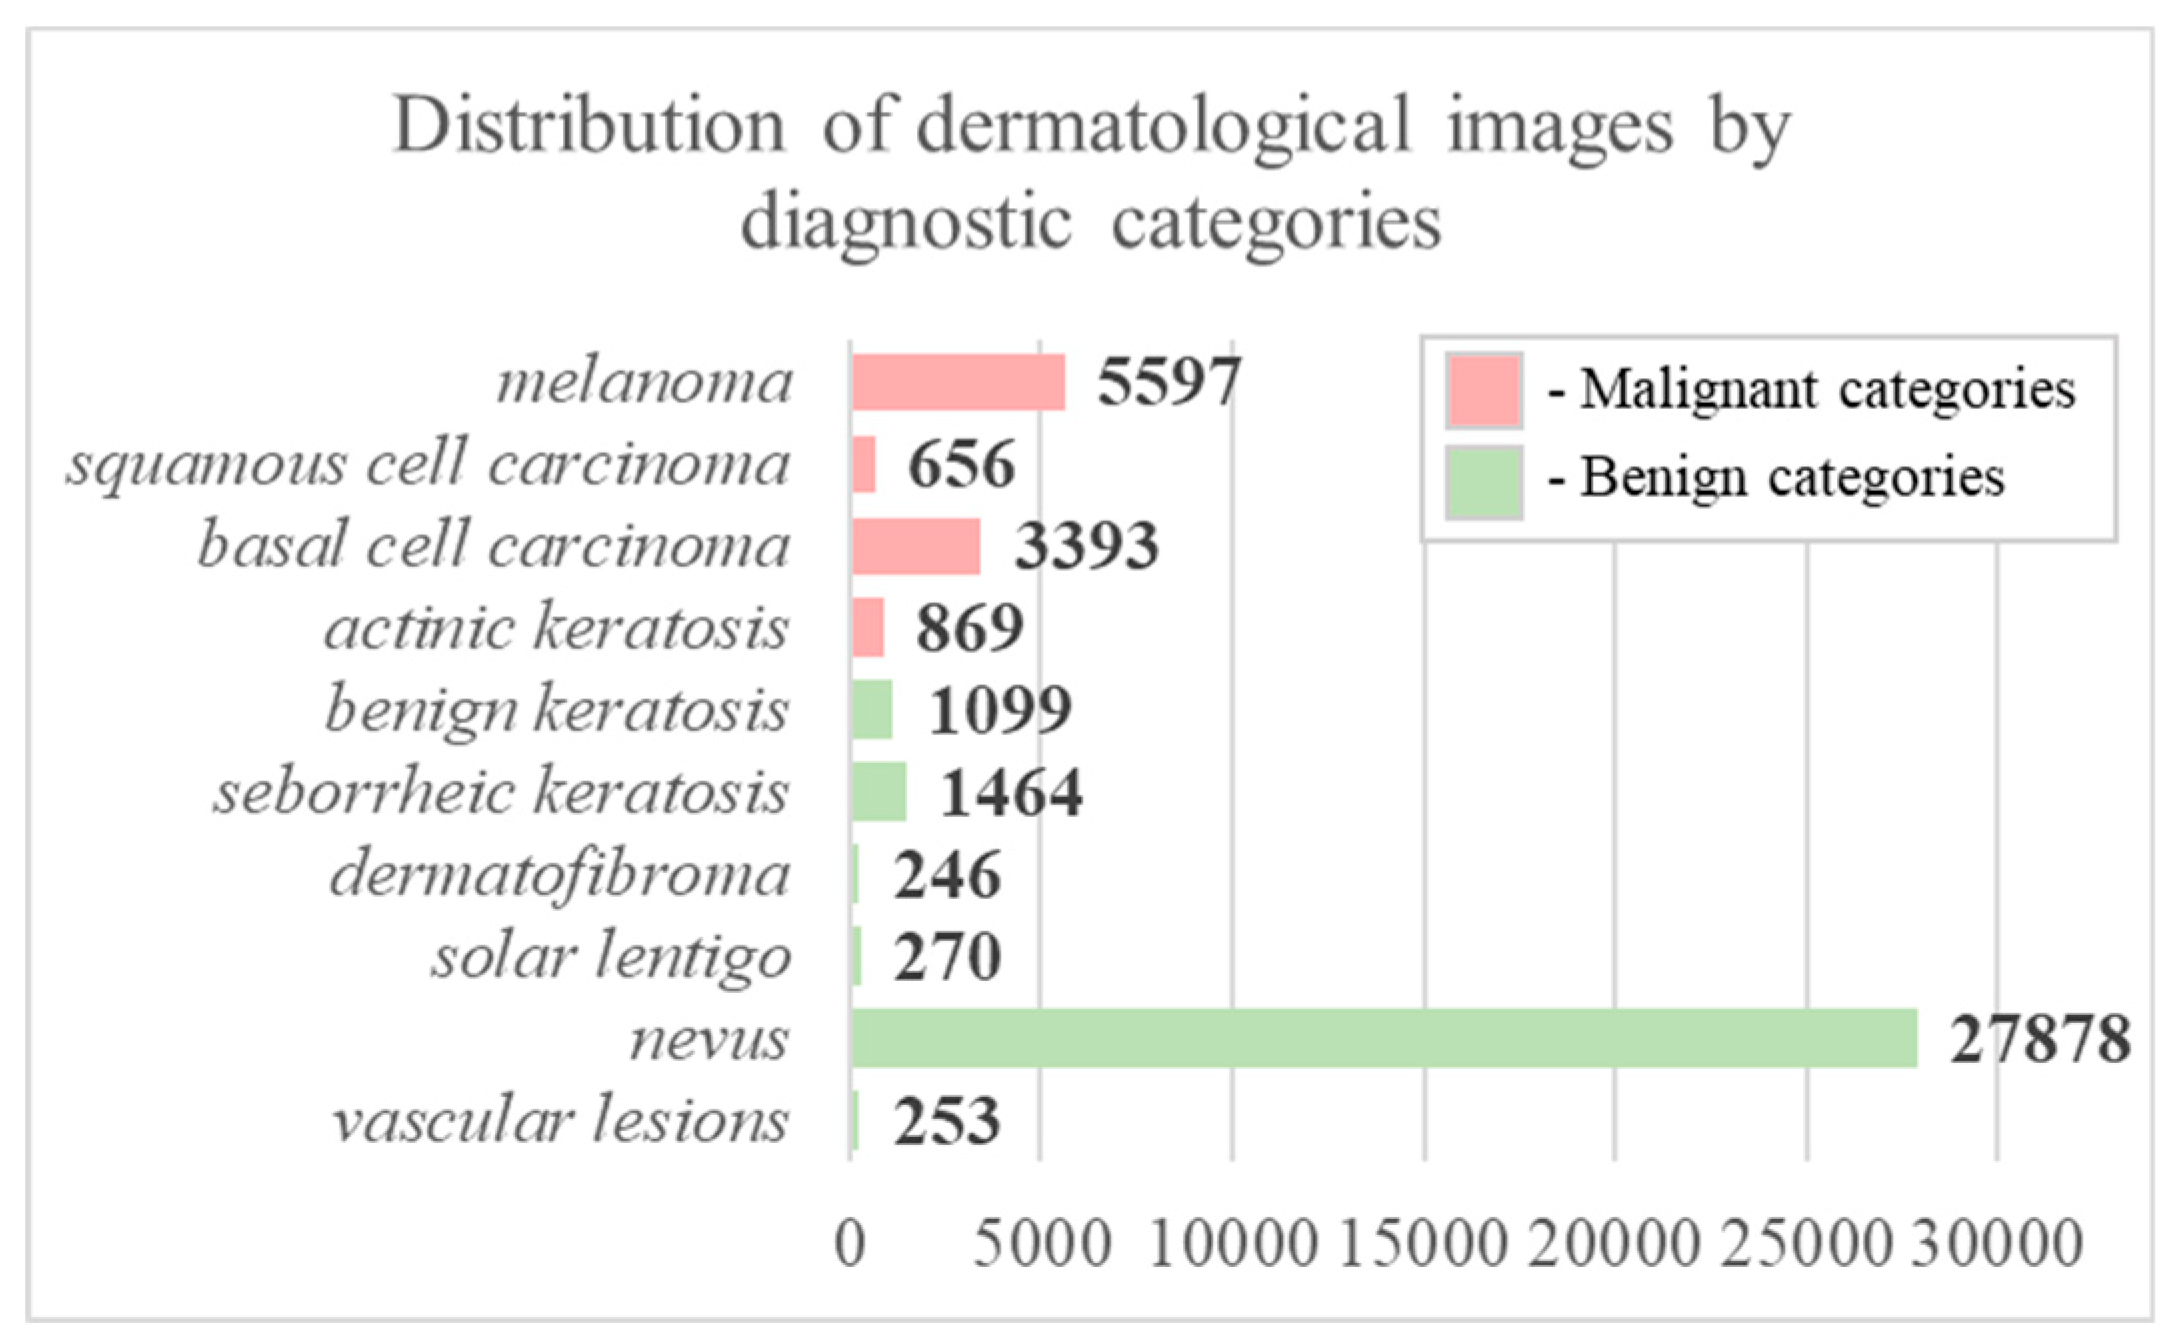
For practical modeling, data were selected from the open archive of the International Skin Imaging Collaboration (ISIC). The ISIC Archive is an open-source platform that contains publicly available dermatological data under a Creative Commons license. Images of pigmented skin lesions are associated with patient statistics and confirmed diagnoses. The purpose of the archive is to provide open access to diagnostic dermatological data for training specialists in melanoma recognition methods, as well as for the development of clinical decision support systems and automated diagnostics. The selected data for modeling included 41,725 dermatological images of varying sizes and quality. Each image was associated with a set of statistical factors and an established diagnosis. All data were divided into 10 diagnostically significant categories such as vascular lesions, nevus, solar lentigo, dermatofibroma, seborrheic keratosis, benign keratosis, actinic keratosis, basal cell carcinoma, squamous cell carcinoma, melanoma. The selected categories are divided into "malignant" and "benign" groups and arranged in descending order of risk and severity of the course of the disease. Actinic keratosis is an intraepithelial dysplasia of keratinocytes and is characterized as a "precancerous" skin lesion (in situ squamous cell carcinoma). Therefore, this category was assigned to the group of “malignant” pigmented skin lesions [75]. A graph of the distribution of selected dermatological images by category is shown in Figure 6.
The set of statistical factors for each image included information about the patient's gender (male/female), the age group in increments of five years, and localization of the pigmented lesion on the body (anterior torso, head/neck, lateral torso, lower extremity, oral/genital, palms/soles, posterior torso, upper extremity). The statistical factors used for neural network modeling and their cardinality are presented in Table 1.
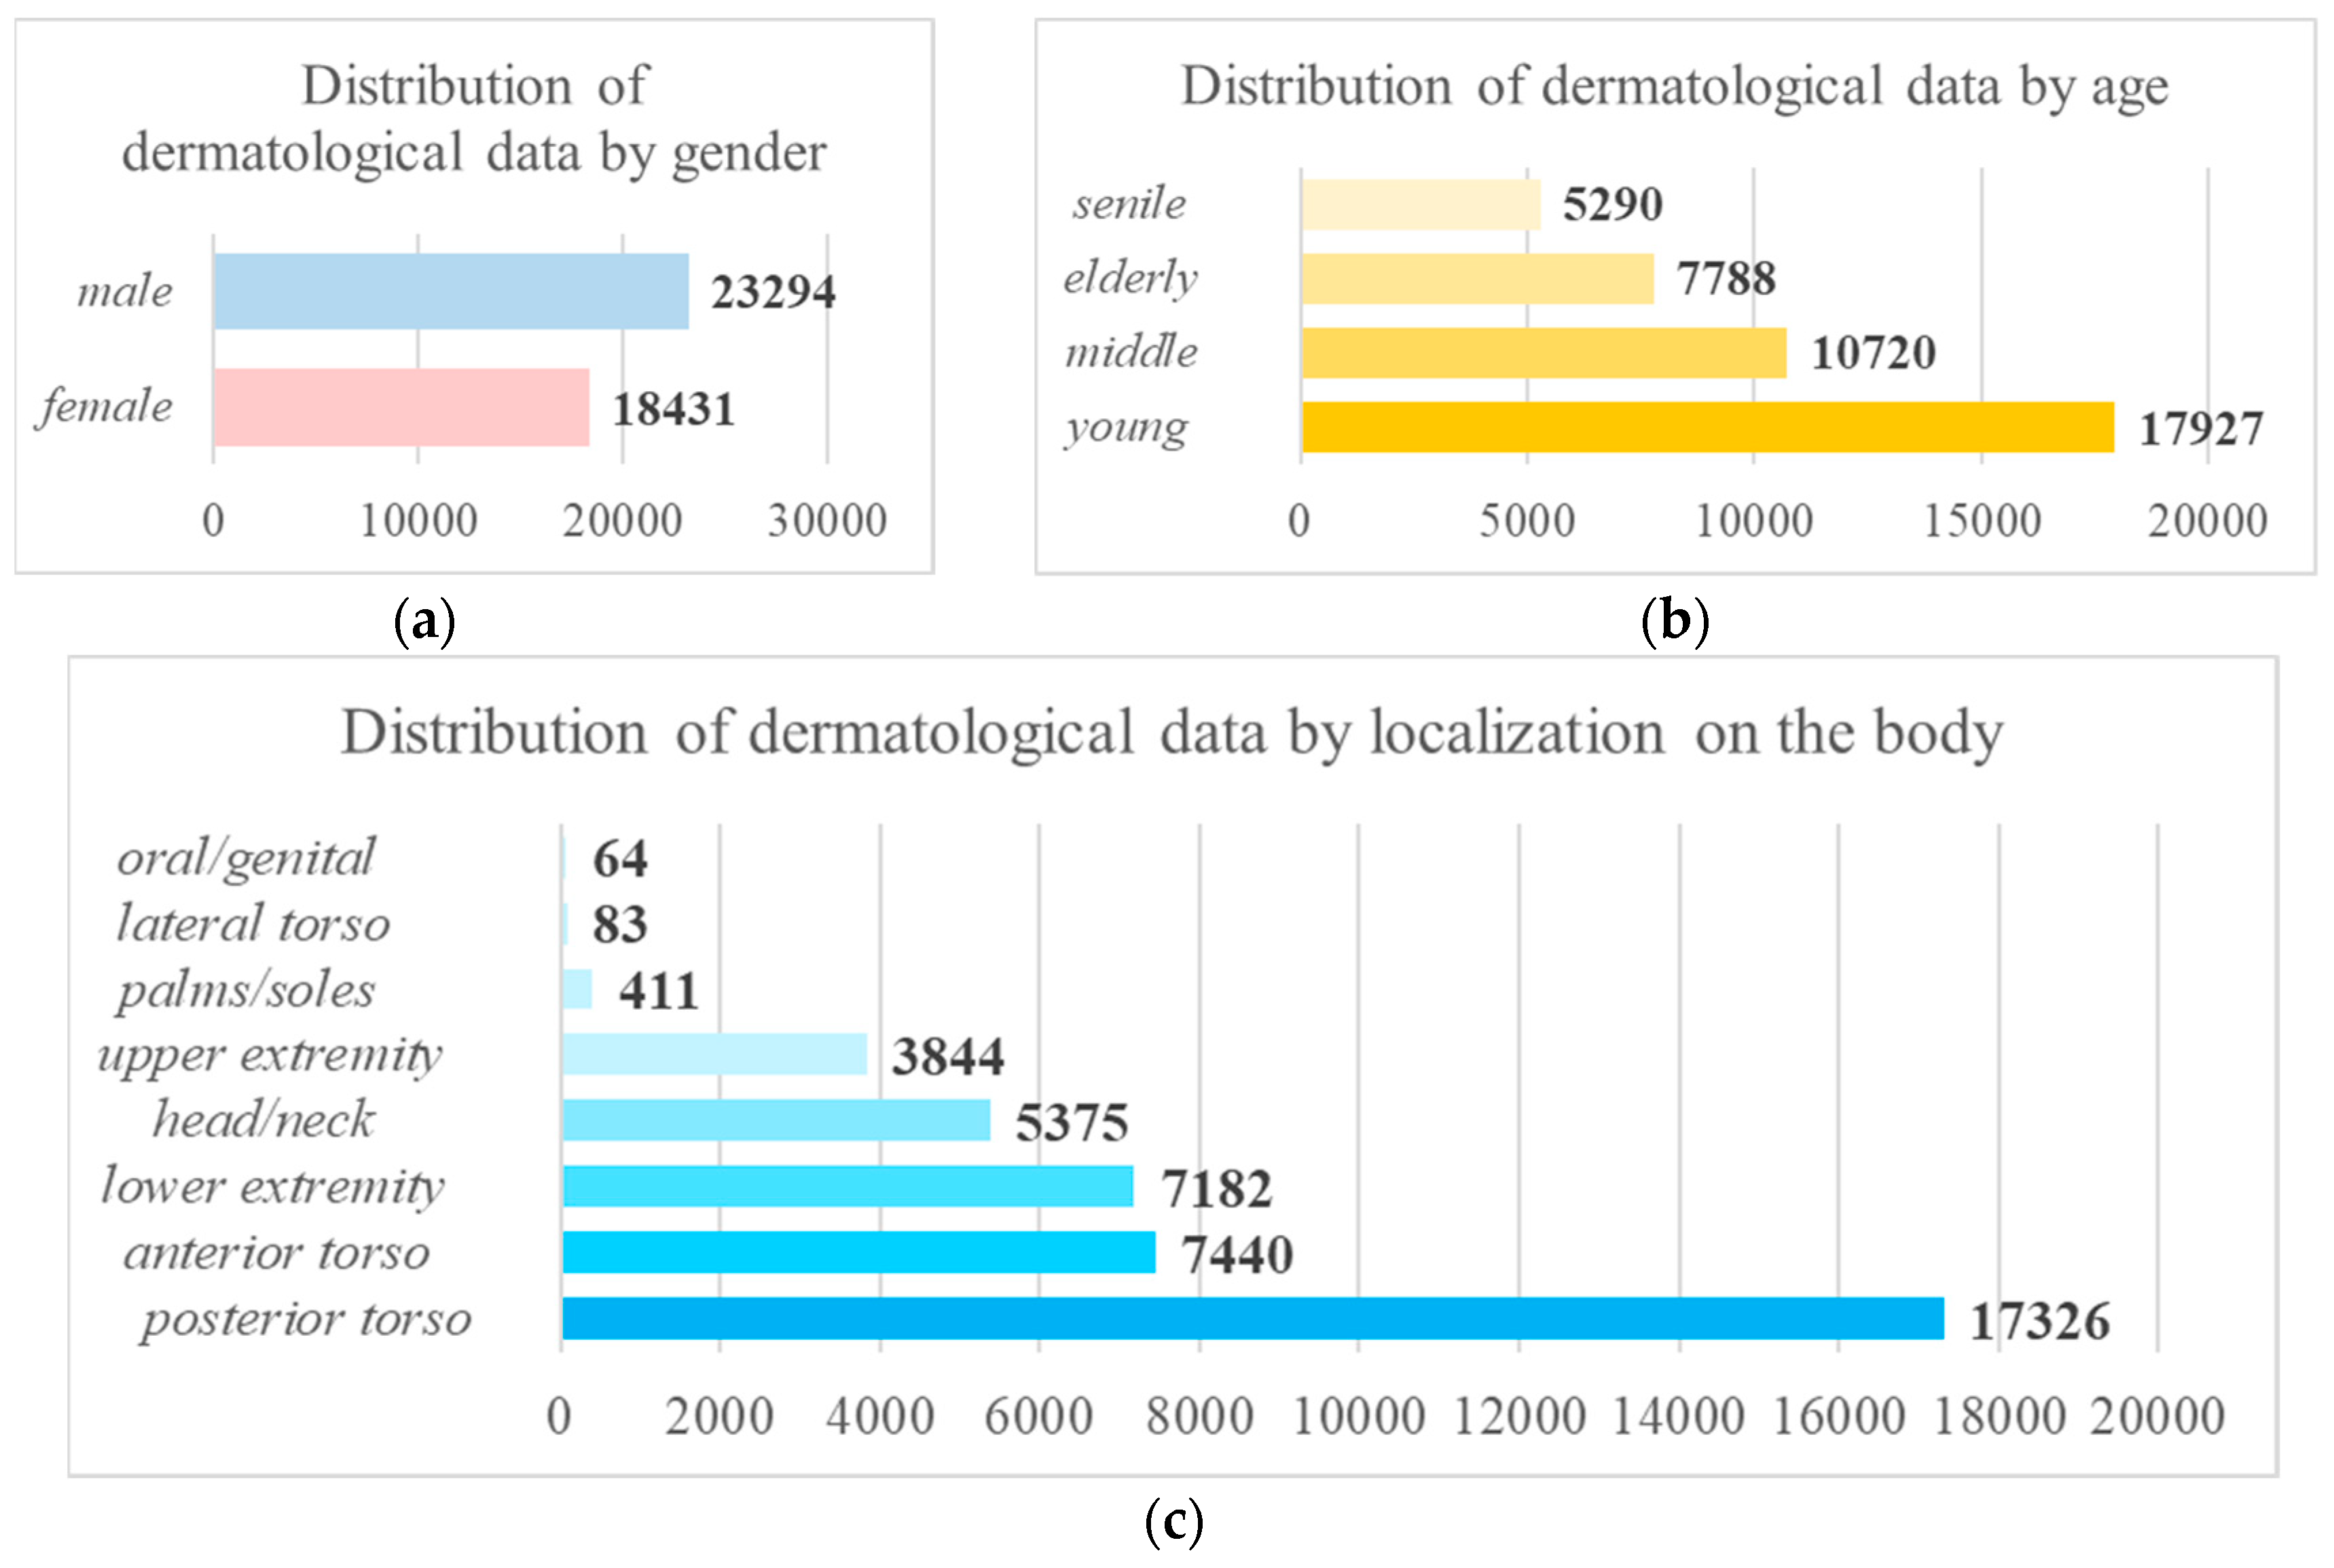
At the stage of preliminary processing of statistical data, the “Age” parameter was divided into four groups by the age classification adopted by the World Health Organization (WHO). The first group of "young age" included patients under the age of 44 years. The second group of "middle age" included patients aged 45 to 59 years. The third group "elderly" included patients aged 60 to 74 years. The fourth group "long-livers" included patients aged 75 years and older. Thus, the variability of the "Age" parameter was reduced from 18 to 4 possible values. Graphs of the distribution of dermatological data by various statistical factors are shown in Figure 7. As a result of the analysis of statistical data, it was found that the predominant number of patients belong to men and the age group of 75 years and older. Also, pigmented lesions are most often localized on the posterior torso. The data obtained are highly correlated with studies on the influence of statistical factors on the risk of skin cancer [20,21,22,23].
The simulation was carried out using the high-level programming language Python 3.11.0. All calculations were carried out on a PC with an Intel(R) Core(TM) i5-8500 processor at 3.00 GHz with 16 GB of RAM and a 64-bit Windows 10 operating system. Training of multimodal neural network systems was carried out using a graphics processing unit (GPU) based on NVIDIA GeForce GTX 1050TI video chipset. The Pytorch machine learning framework was used to model neural network systems. The NumPy, Pandas, and ScikitLearn libraries were used to process statistical data. The Matplotlib library was used to visualize the data.
To model a multimodal neural network system for recognizing pigmented skin lesions, sensitive to unbalanced data, neural network architectures DenseNet_161 [76], Inception_v4 [77], ResNeXt_50 [78]. The selected convolutional architectures were pre-trained on the ImageNet natural image set. To date, the selected neural network architectures are recognized as the most productive and highly accurate compared to human capabilities [79].
At the first stage of modeling, the selected dermatological data were pre-processed. The preprocessing of the statistical data was to create an input vector using the one-hot encoding method. The coding tables for each possible value of each statistic are shown in Figure 8. Table 2 shows the cardinality of each pre-processed statistic by the one-hot encoding method. Thus, it was possible to reduce the number of possible values that the statistical factors of patients can take from 28 to 14.
Pre-processing of visual data consisted in applying the proposed method for removing hair structures from [55]. Examples of pre-processed dermatological images are shown in Figure 9. The second step in pre-processing the visual data was to transform the size of the input data. The main part of the selected images of pigmented skin lesions from the ISIC archive is presented in the size of 450×600 pixels. For the selected neural network architectures, the requirements for input visual data are 256 × 256 pixels for the DenseNet_161 [76] and ResNeXt_50 [78] architectures, 229 × 229 pixels for the Inception_v4 architecture [77]. Therefore, at the stage of pre-processing, the operation of transforming the size of the input images was applied. For further modeling, the dermatological database was divided at a percentage of 80 to 20 into training data and validation data. Affine transformations such as reflection, rotation, translation, scaling, etc. were applied to the training set of visual data. Data augmentation made it possible to avoid retrainin neural network models.
For the training process, preprocessed dermatological images of pigmented skin lesions were fed into the input of selected SNS from the training set. The vector of preprocessed statistical data from the training sample was fed to the input of the developed multilayer neural network architecture, consisting of three linear layers and ReLu activation layers. After the multimodal signals passed through the CNN and the linear perceptron, the output feature vectors were combined on the concatenation layer. The output signal was applied to the softmax layer to determine the probabilistic ratio of predicted labels for 10 diagnostically significant categories. The obtained probabilities were compared with the true labels to the training data, and the error value was calculated using the modified cross-entropy loss function. Errors in less common categories were punished more severely for neural network architectures than errors in more common ones. As a result, there was a gradual memorization of true vectors and a minimization of losses during training. The calculated weight coefficients of each of the classes for modifying the cross-entropy loss function are presented in Table 3.
Each neural network system was trained for 7 epochs. When using a larger number of epochs, a pronounced retraining of each of the proposed neural network systems was observed. The size of the input data packet was 8. SGD was used as an optimizer with a standard learning rate of 0.001 and a moment of 0.9. Table 4 presents the results of assessing the accuracy of testing the proposed multimodal neural network system that is sensitive to unbalanced dermatological data. Table 5 presents the results of estimating the loss function when testing the proposed multimodal neural network system. The presented results are compared with the original multimodal systems that are not sensitive to imbalanced data.
As a result of the simulation, it was found that the use of a modified cross-entropy loss function with the help of weight coefficients can improve the accuracy of neural network recognition and reduce the value of the loss function. The highest recognition accuracy of dermatological data was 85.19% and was obtained when testing the proposed multimodal neural network system that is sensitive to unbalanced data based on the DenseNet_161 architecture. When testing each of the proposed multimodal neural network architectures that are sensitive to unbalanced dermatological data, the recognition accuracy was higher than when testing the original multimodal neural network architectures. The increase in the accuracy of intelligent prediction in neural network architectures with a modified cross-entropy loss function was 1.02-4.03 percentage points, depending on the selected pre-trained CNN. The smallest loss function index was 0.1344 and was obtained when testing a multimodal neural network system that is sensitive to unbalanced data based on the DenseNet_161 architecture. The value of the loss function of the proposed multimodal neural network systems with a modified cross-entropy loss function was in all cases lower than that of the original multimodal neural network architectures. The decrease in the loss function exponent was 0.1219-0.0123 depending on the selected pre-trained CNN. Table 6 presents the results of calculations of various methods for the quantitative evaluation of neural network systems.
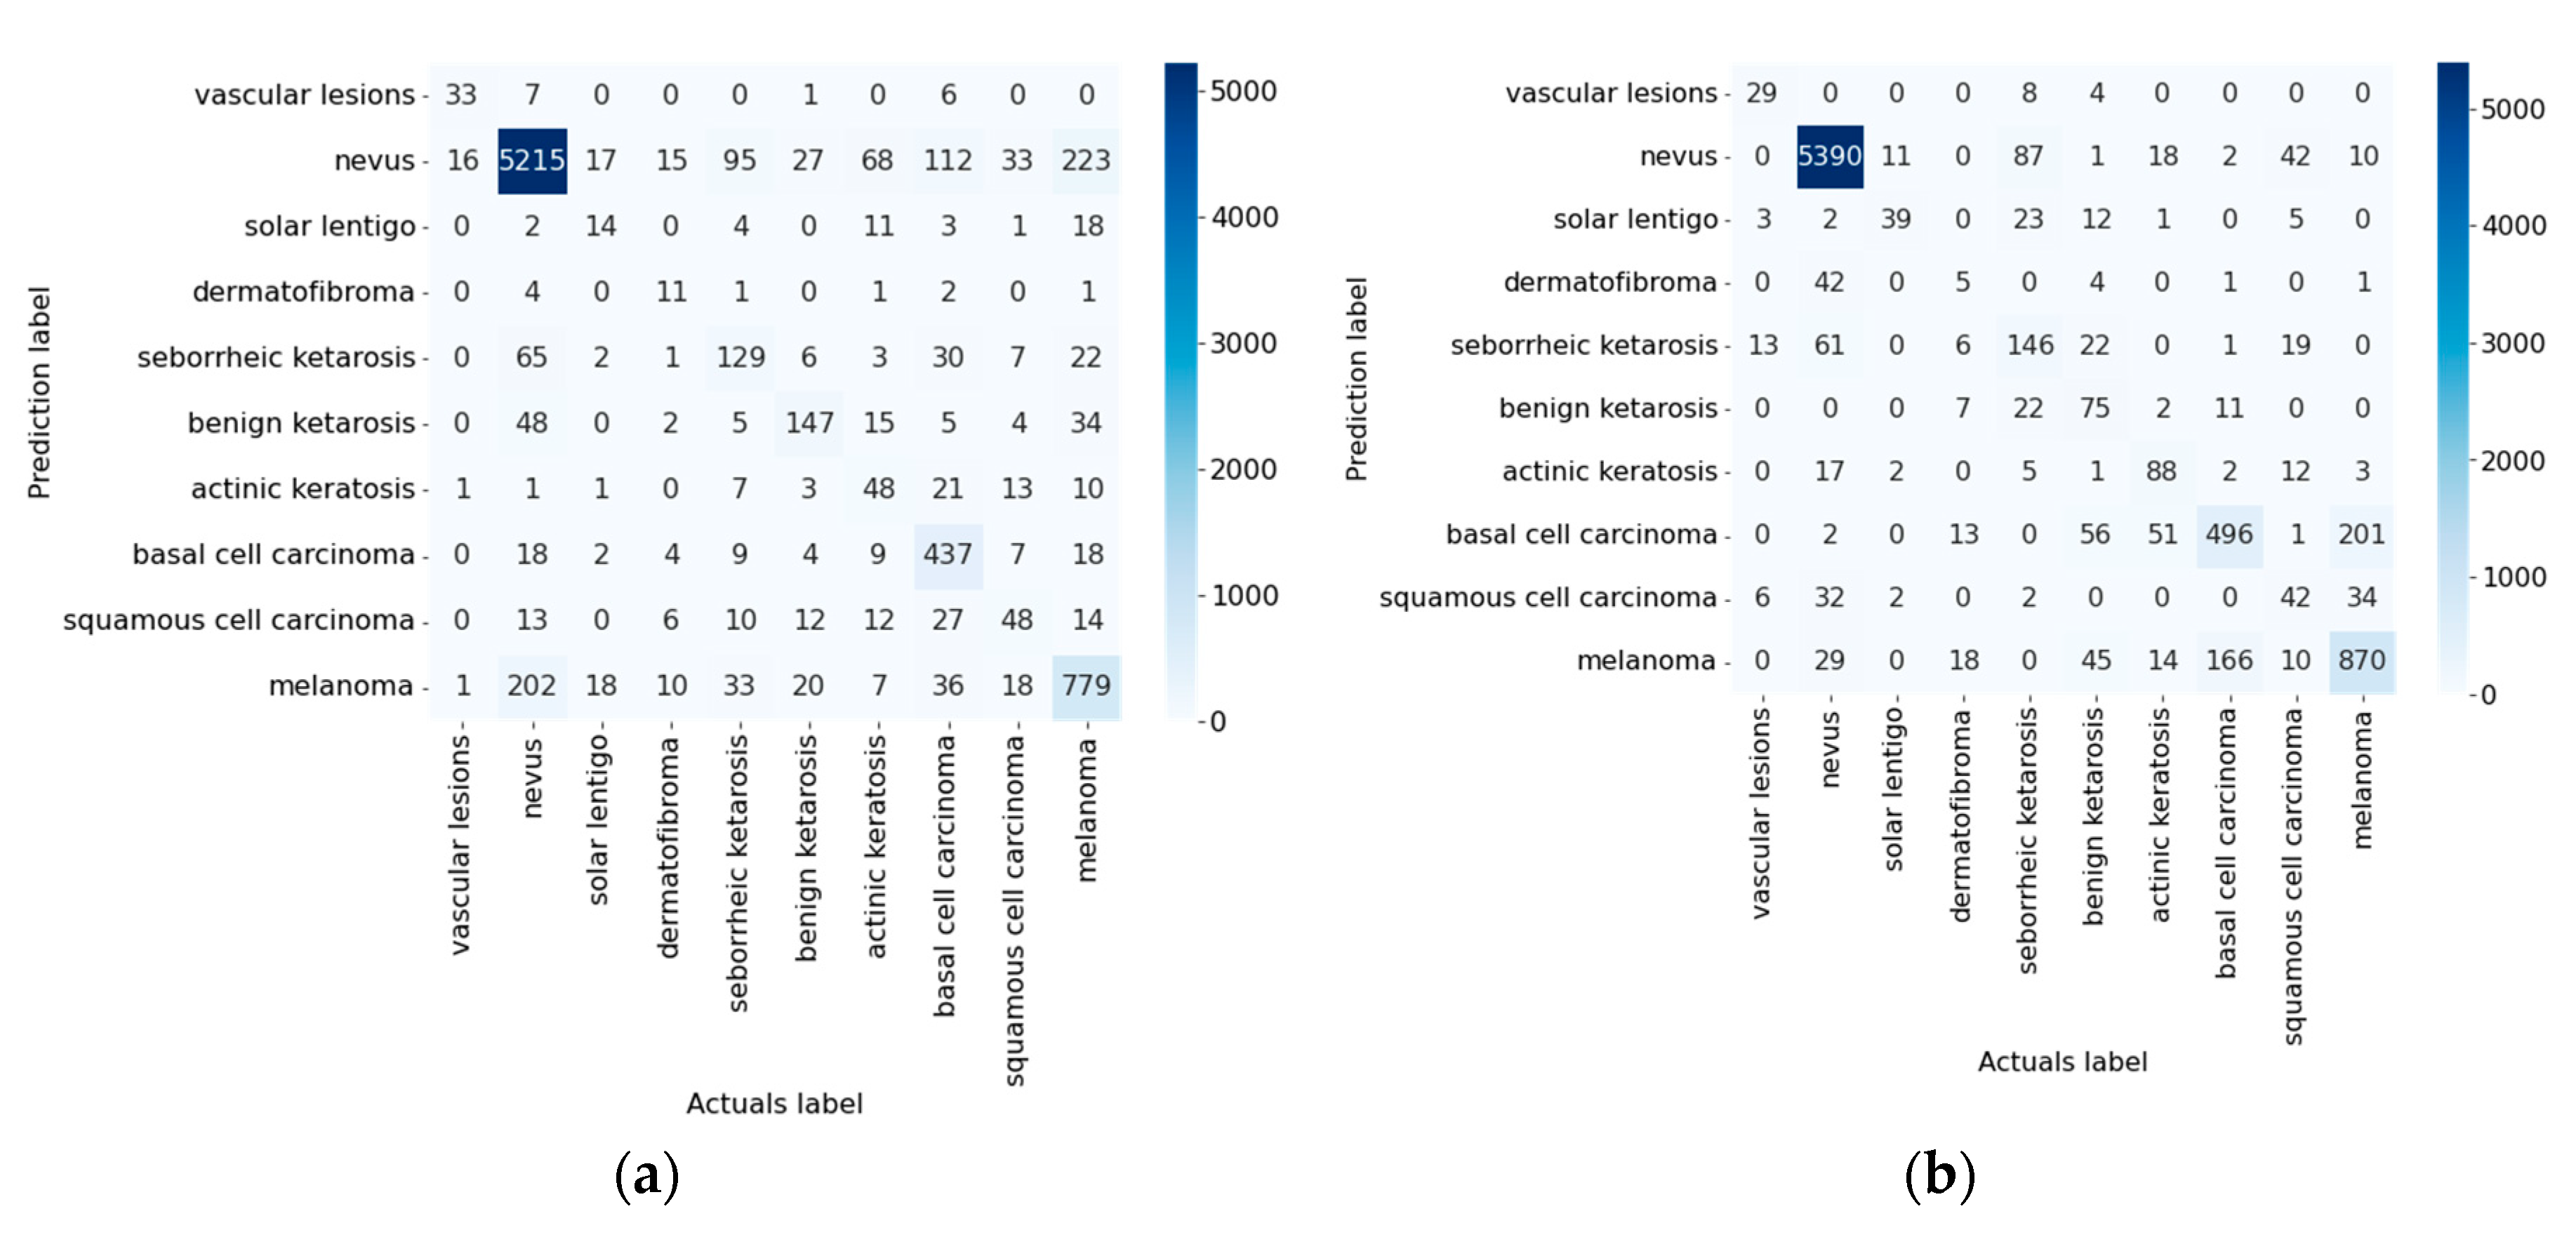
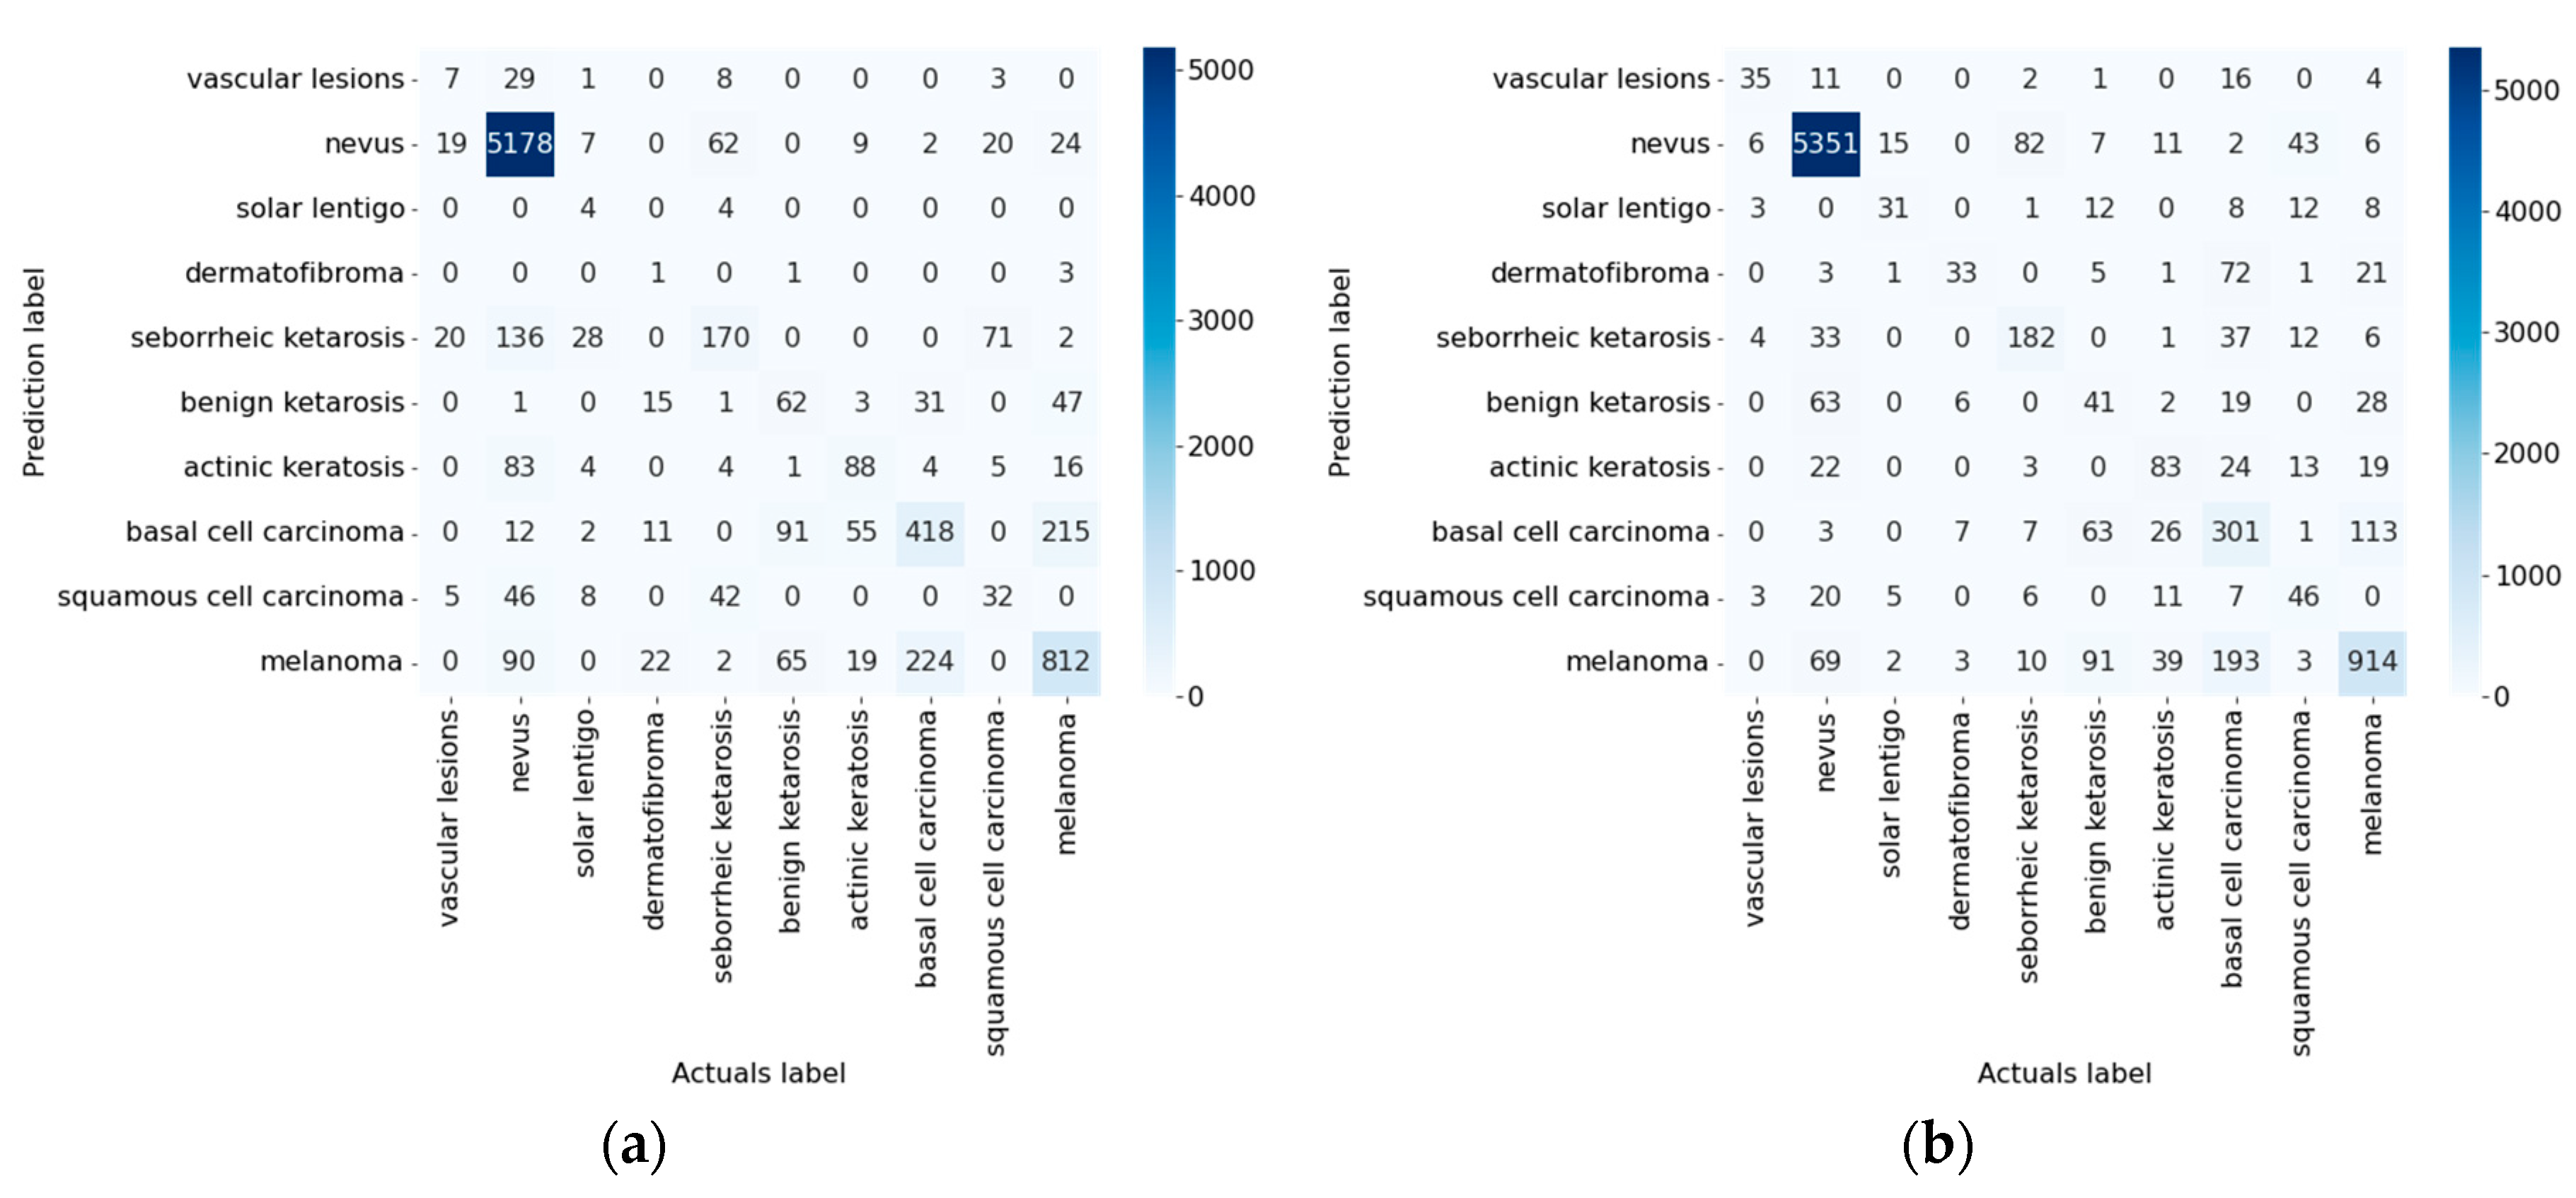
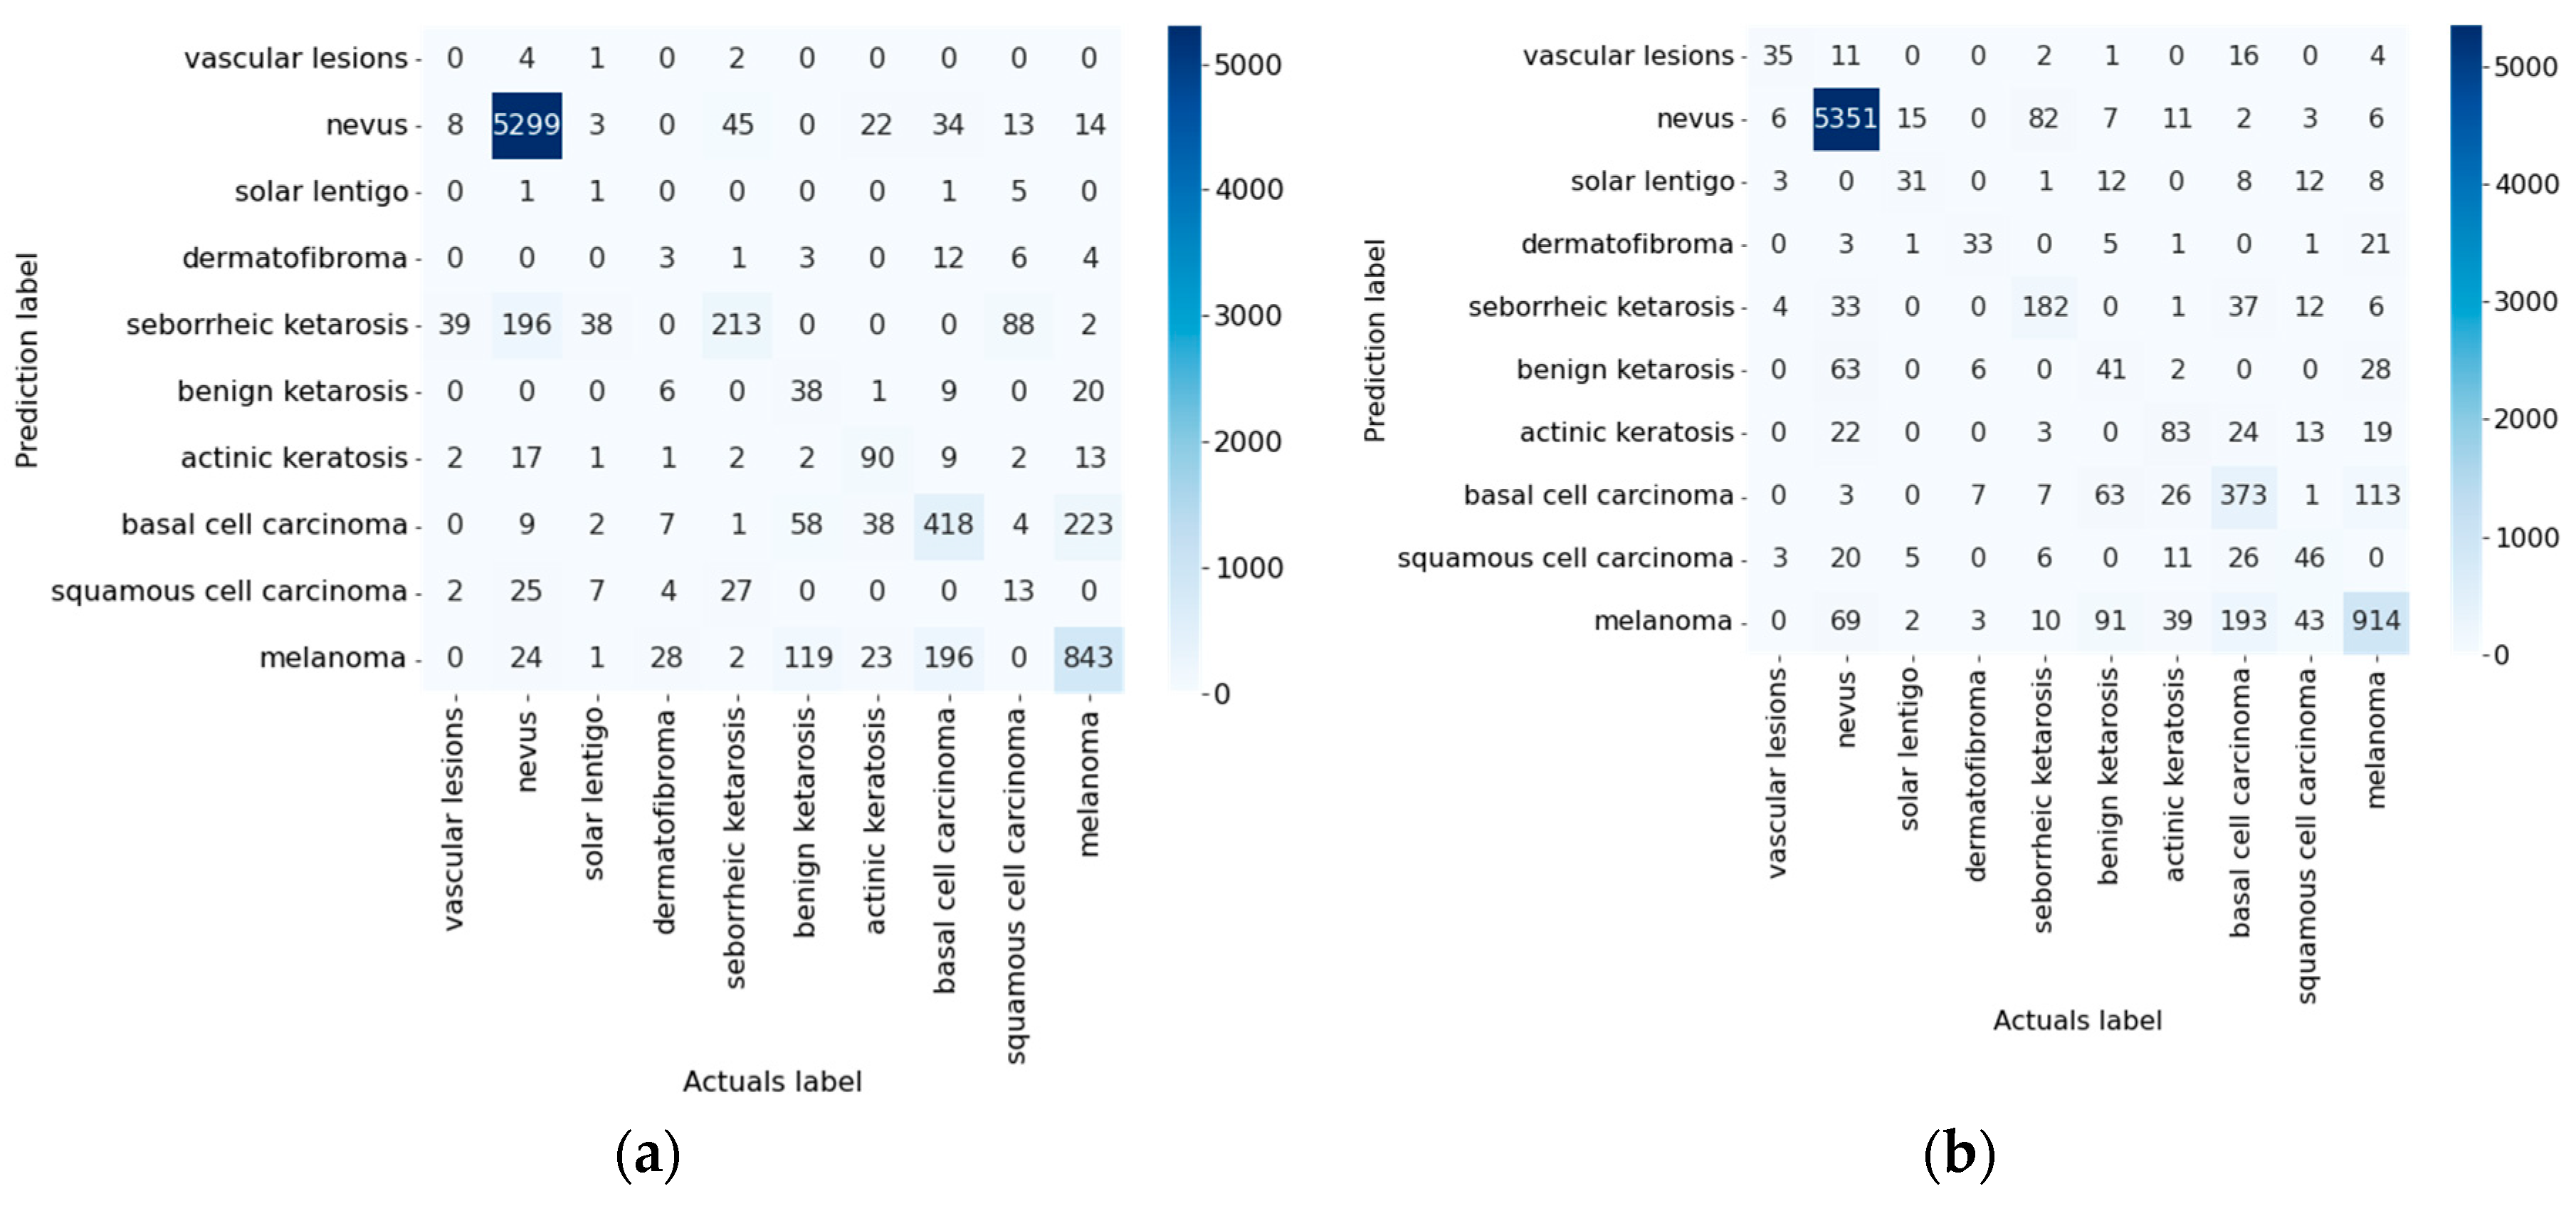
For the statistical evaluation of the trained models, such quantitative methods as Specificity, Sensitivity, F-1 score, Matthew’s correlation coefficient (MCC), false negative rate (FNR), False positive rate (FPR), Negative predictive value (NPV) and Positive predictive were chosen. value (PPV). When evaluating intelligent systems for assisted dermatological diagnostics, sensitivity indicates how well the system can identify malignant skin lesions in patients who do have pigmentary oncopathology. The higher the sensitivity, the more reliable the intelligent medical system. When testing the proposed multimodal neural network systems for dermatological data recognition, it was found that the highest sensitivity index belongs to the proposed system based on the DenseNet_161 architecture with a modified cross-entropy loss function and is 0.8519. Specificity indicates how well the neural network system identifies patients with benign pigmented neoplasms. The best sensitivity index was obtained for a multimodal neural network system sensitive to unbalanced data based on the DenseNet_161 architecture and amounted to 0.9835. F-1 score is a measure of the evaluation of neural network systems and represents the harmonic mean of positive predictive value and sensitivity. The best F-1 score was obtained when testing the proposed neural network system with a modified loss function based on the DenseNet_161 architecture and amounted to 0.8519. At the same time, the statistical metric F-1 score is dependent on the ratio of positive and negative cases and cannot always correctly evaluate systems in which there is a clear imbalance of data. MCC is a more reliable measure of the statistical evaluation of systems with unbalanced data. A high MCC score indicates that the neural network system performs well in all four categories of the confusion matrix in proportion to the number of benign and malignant cases in the data set [80]. The best MCC score was 0.7169 and was obtained when evaluating a multimodal neural network system based on the DenseNet_161 architecture, which is sensitive to unbalanced data. False positive rate (FNR) and true positive rate (FPR) are the probability of false and true rejection of the null hypothesis as a result of testing a neural network system. The positive and negative predictive values (PPV and NPV) indicate the proportion of benign and malignant system test results that are truly benign and truly malignant. As a result of testing all trained neural network systems, the best result for all four indicators FNR, FPR, NPV and PPV was obtained from a neural network system based on the DenseNet_161 architecture, which is sensitive to unbalanced data and amounted to 0.1481, 0.0164, 0.9835 and 0.8519, respectively. For all the considered testing metrics, the systems trained using the modified cross-entropy loss function had a higher result than the original multimodal systems for recognizing pigmented skin lesions. The use of a modified cross-entropy loss function when training multimodal neural network systems made it possible to obtain classifiers that are sensitive to unbalanced dermatological data. Figure 10, Figure 11 and Figure 12 show confusion matrices for testing multimodal neural network systems. Diagnostic categories are arranged in order of increasing risk and severity of the course of the disease. Figure 13 and Figure 14 show the confusion matrices for testing multimodal neural network systems in two categories.
As a result of the analysis of confusion matrices, it can be concluded that the use of the modified cross-entropy loss function when training various multimodal neural network systems can reduce the number of false positive and false negative predictions. For intelligent systems of medical auxiliary diagnostics, reducing the percentage of false negative predictions is a critical task. The greatest result in the reduction of cases of false negative prediction was obtained when comparing multimodal neural network systems based on the DenseNet_161 architecture and amounted to 468 cases. The use of the modified cross-entropy loss function reduced the number of cases of false-negative recognition of pigmented skin lesions by 468 cases for the architecture based on DenseNet_161, by 36 cases for the architecture based on Inception_v4 and by 51 cases for the architecture based on ResNeXt_50.
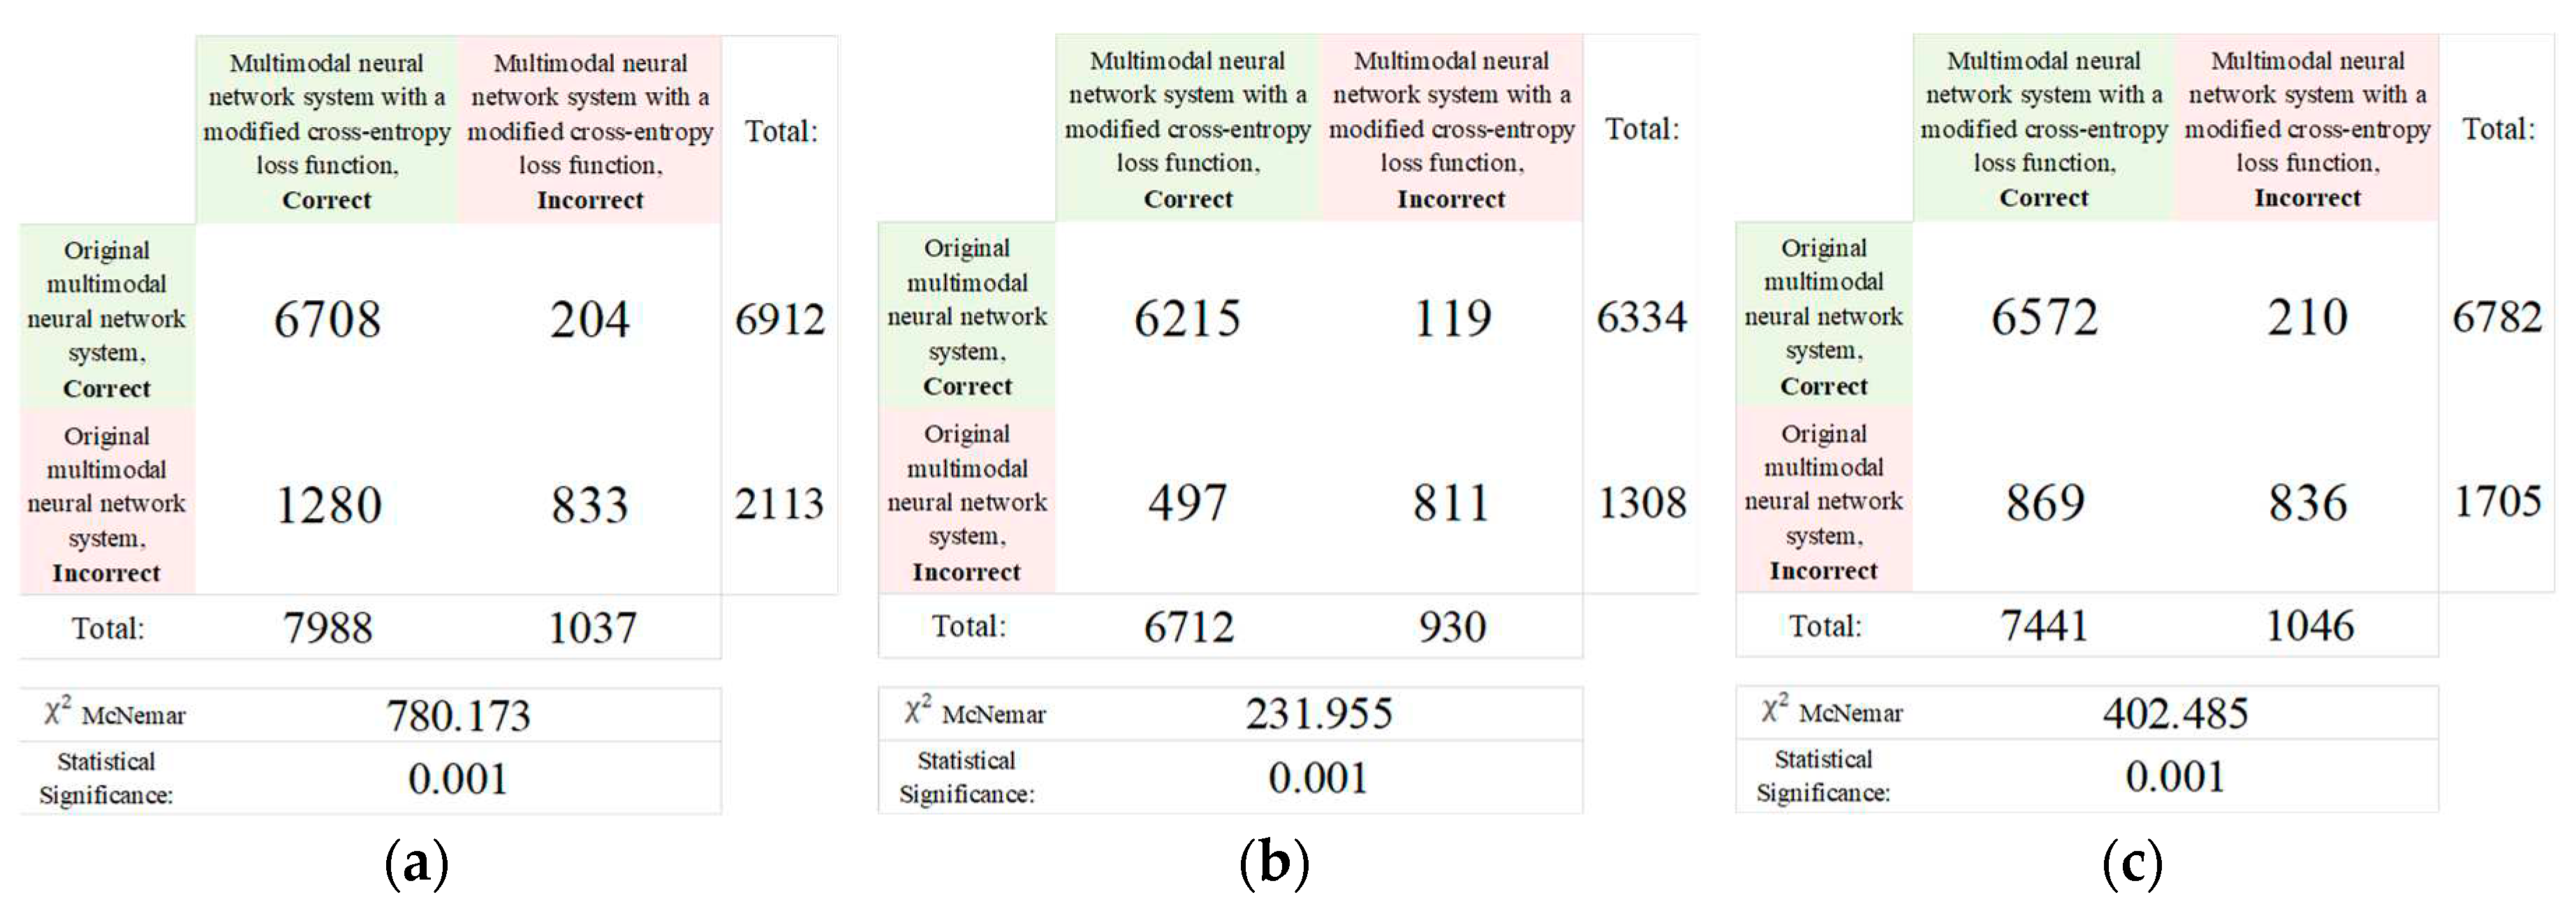
As a result of calculations for the McNemar test in Figure 15, it was found that the use of the modified cross-entropy loss function at the training stage of the neural network system made it possible to increase the number of correct recognitions in 497-1280 cases when the original multimodal neural network system made errors. At the same time, in 119-204 cases, the recognition results of a multimodal system sensitive to unbalanced data were incorrect compared to the original neural network system.
Due to the more severe punishment when training a multimodal neural network, it was possible to obtain a neural network system that is sensitive to unbalanced data. However, the proposed system cannot be used as an independent diagnostic tool due to the risk of false negative errors.

4. Discussion

The paper presents a multimodal neural network system with a modified cross-entropy loss function, sensitive to unbalanced heterogeneous dermatological data. The accuracy of the proposed neural network system based on the DenseNet_161 convolutional architecture was 85.19%. The system analyzes heterogeneous dermatological data represented by images of pigmented skin lesions and such statistical information as gender, age and location of pigmented lesions on the body. At the same time, the educational dermatological data available in the public domain are highly unbalanced towards “benign” categories. The modification of the cross-entropy loss function made it possible to overcome the data imbalance and achieve higher accuracy compared to the results of testing the original multimodal systems, as well as compared to the results of similar systems for detecting malignant skin lesions. Table 7 compares the results of the recognition accuracy of pigmented skin neoplasms of the proposed system, sensitive to unbalanced data, with the results of similar multimodal systems.
The work [81] presents a method for intelligent recognition of heterogeneous data, such as clinical images and statistical metadata. The modeling was carried out on a data set of 2917 clinical cases, divided into five diagnostically significant categories. As a result, the average test accuracy for multi-class classification of the ResNet-50 multimodal neural network architecture was 71.9%, which is 13.03 percentage points lower than the accuracy results of the proposed multimodal system with a similar ResNeXt_50 architecture trained with a modified cross-entropy loss function. This result is 13.20 percentage points lower than the test accuracy of the proposed multimodal system with the best DenseNet_161 architecture in terms of accuracy. The use of more training data, as well as the use of preprocessing methods and modification of the cross-entropy loss function, made it possible to significantly increase the accuracy of recognition of dermatological data compared to similar systems.
The work [82] presents a multimodal neural network system CAFNet, which analyzes such heterogeneous dermatological data as dermoscopic and clinical images. The CAFNet system uses two architectures for feature extraction from dermoscopic and clinical images and a neural network architecture for feature analysis. The results show that CAFNet achieves an average accuracy of 76.80% on a test dataset of 7 diagnostically relevant categories of pigmented skin lesions. The accuracy of the CAFNet neural network system is 6.94% compared to the accuracy of recognizing pigmented skin lesions using the ResNet-50 SNS. Despite a significant increase in the recognition accuracy of pigmented skin lesions when using heterogeneous visual data, the CAFNet test results are 8.39 percentage points lower than those of the proposed multimodal neural network system with a modified cross-entropy loss function based on the DenseNet_161 architecture. The joint use of visual data and statistical data of patients made it possible to identify additional relationships between the diagnosis and pigmented neoplasm, thereby increasing the accuracy of intelligent diagnostics. At the same time, the use of the input data pre-processing stage also significantly improved the quality of the information processed by the artificial intelligence system.
The work [83] presents a multi-mode data fusion diagnostic network MDFNet, which combines heterogeneous features of clinical skin images and clinical data of patients. The experimental results showed that the MDFNet system has an accuracy of 80.42% on the test data, which is about 9% higher than the accuracy of the neural network model using only dermatological images. Modeling of the system was carried out on 2298 clinical cases, divided into six categories of pigmented skin lesions. The authors of the work used ResNet_50 and DenseNet_121 as neural network architectures. Test evaluation of MDFNet based on the ResNet_50 architecture made it possible to obtain a classification accuracy of 77.11%, which is 7.82 percentage points lower than the accuracy of the proposed multimodal system based on a similar SNA ResNeXt_50. Test evaluation of MDFNet based on the DenseNet_121 architecture showed an accuracy of 80.42%, which is 4.77 percentage points lower than the accuracy of the proposed multimodal system based on the similar SNS DenseNet_161. Training using a modified cross-entropy loss function using weighting coefficients made it possible to obtain a classifier that is sensitive to unbalanced dermatological data and to reduce the frequency of false negative errors, in which malignant pigmented neoplasms are recognized as benign.
The proposed multimodal system trained with a modified cross-entropy loss function significantly exceeds the accuracy of visual analysis methods used by oncol dermatologists. A comparison of the accuracy of classification of pigmented skin lesions in dermatologists with different levels of experience and an artificial intelligence system was presented in [84,85,86] by a computer program using an artificial algorithm. skin neoplasms. However, the developed multimodal neural network system, which is sensitive to unbalanced data, cannot replace the decisive opinion of a specialist. The proposed system can only be used as an additional diagnostic tool due to the risk of a false negative response, when a malignant neoplasm can be recognized as benign. Therefore, a promising direction for further research is the construction of more complex ensemble systems for neural network analysis of dermatological data. Another promising area for further research is the introduction of segmentation at the stage of pre-processing of visual data. Semantic segmentation will make it possible to highlight the contour of a pigmented neoplasm, the distortion of which is a diagnostic morphological manifestation of oncopathology. The development of web applications and computer programs for implementation in the healthcare sector as auxiliary tools for diagnosing oncopathologies is also relevant.

5. Conclusions

As a result of the study, a multimodal neural network system was developed with a modified cross-entropy loss function, sensitive to unbalanced heterogeneous dermatological data. The accuracy of the proposed system was 85.19% for the architecture based on the DenseNet_161 CNN. In all cases, the recognition accuracy of dermatological data in systems sensitive to unbalanced data was higher compared to the original multimodal neural network systems. The increase in accuracy was 1.02-4.03 percentage points, depending on the selected pre-trained SNA. The value of the error function for the developed system based on the DenseNet_161 architecture was 0.1344. In all cases, there was a decrease in the value of the error function in systems sensitive to unbalanced data compared to the original neural network architectures. The decrease in the error function exponent was 0.1219-0.0123, depending on the selected pre-trained CNN. The use of the modified cross-entropy loss function allowed us to increase the accuracy of the multimodal neural network system and increase the sensitivity to unbalanced data. At the same time, a significant reduction in the number of false positive and false negative predictions was found, which is a critical task for recognition systems of malignant skin lesions.
The main limitation of using the proposed multimodal neural network system with a modified cross-entropy loss function sensitive to unbalanced heterogeneous dermatological data is that specialists can only use the system as an additional diagnostic tool. The developed system cannot be used as an independent diagnostic tool due to the possible risk of false negative errors. However, the proposed system can be used as a highly accurate auxiliary tool to assist in making a medical decision. The introduction of such high-precision systems for automated analysis of pigmented skin lesions will reduce the consumption of financial and labor resources involved in the medical industry, as well as increase the chance of early detection of pigmented oncopathologies.

Author Contributions

Conceptualization, P.L.; methodology, P.L.; software, U.L..; validation, U.L. and D.K.; formal analysis, D.K.; investigation, P.L.; resources, U.L.; data curation, D.K.; writing—original draft preparation, U.L.; writing—review and editing, P.L.; visualization, D.K.; supervision, P.L.; project administration, U.L.; funding acquisition, P.L. All authors have read and agreed to the published version of the manuscript.

Funding

Research in section 2 was supported by Russian Science Foundation, project 21-71-00017. The rest of the paper was supported by the North-Caucasus Center for Mathematical Research under agreement No. 075-02-2022-892 with the Ministry of Science and Higher Education of the Russian Federation.

Institutional Review Board Statement

Not applicable.

Informed Consent Statement

Not applicable.

Data Availability Statement

A publicly available dataset was analyzed in this study. This data can be found in https://www.isic-archive.com/#!/topWithHeader/wideContentTop/main, accessed on 29 December 2022. Both the data analyzed during the current study and code are available from the corresponding author upon request.

Acknowledgments

The authors would like to thank the North-Caucasus Federal University for supporting the contest of projects competition of scientific groups and individual scientists of the North-Caucasus Federal University.

Conflicts of Interest

The authors declare no conflict of interest.

References

  1. Apalla, Z.; Lallas, A.; Sotiriou, E.; Lazaridou, E.; Ioannides, D. Epidemiological Trends in Skin Cancer. Dermatol Pract Concept 2017, 7, 1. [Google Scholar] [CrossRef]
  2. Hu, W.; Fang, L.; Ni, R.; Zhang, H.; Pan, G. Changing Trends in the Disease Burden of Non-Melanoma Skin Cancer Globally from 1990 to 2019 and Its Predicted Level in 25 Years. BMC Cancer 2022, 22, 1–11. [Google Scholar] [CrossRef]
  3. Garbe, C.; Leiter, U. Epidemiology of Melanoma and Nonmelanoma Skin Cancer-the Role of Sunlight. Adv Exp Med Biol 2008, 624, 89–103. [Google Scholar] [CrossRef]
  4. Fitzpatrick, T.B. Pathophysiology of Hypermelanoses. Clinical Drug Investigation 1995 10:2 2012, 10, 17–26. [Google Scholar] [CrossRef]
  5. Pathak, M.A.; Jimbow, K.; Szabo, G.; Fitzpatrick, T.B. Sunlight and Melanin Pigmentation. Photochemical and Photobiological Reviews 1976, 211–239. [Google Scholar] [CrossRef]
  6. Ciążyńska, M.; Kamińska-Winciorek, G.; Lange, D.; Lewandowski, B.; Reich, A.; Sławińska, M.; Pabianek, M.; Szczepaniak, K.; Hankiewicz, A.; Ułańska, M.; et al. The Incidence and Clinical Analysis of Non-Melanoma Skin Cancer. Scientific Reports 2021 11:1 2021, 11, 1–10. [Google Scholar] [CrossRef] [PubMed]
  7. Melanoma Awareness Month 2022 – IARC. Available online: https://www.iarc.who.int/news-events/melanoma-awareness-month-2022/ (accessed on 14 December 2022).
  8. Arnold, M.; Singh, D.; Laversanne, M.; Vignat, J.; Vaccarella, S.; Meheus, F.; Cust, A.E.; de Vries, E.; Whiteman, D.C.; Bray, F. Global Burden of Cutaneous Melanoma in 2020 and Projections to 2040. JAMA Dermatol 2022, 158, 495–503. [Google Scholar] [CrossRef] [PubMed]
  9. Allais, B.S.; Beatson, M.; Wang, H.; Shahbazi, S.; Bijelic, L.; Jang, S.; Venna, S. Five-Year Survival in Patients with Nodular and Superficial Spreading Melanomas in the US Population. J Am Acad Dermatol 2021, 84, 1015–1022. [Google Scholar] [CrossRef]
  10. Balch, C.M.; Soong, S.J.; Murad, T.M.; Ingalls, A.L.; Maddox, W.A. A Multifactorial Analysis of Melanoma: III. Prognostic Factors in Melanoma Patients with Lymph Node Metastases (Stage II). Ann Surg 1981, 193, 377. [Google Scholar] [CrossRef]
  11. Lideikaitė, A.; Mozūraitienė, J.; Letautienė, S. Analysis of Prognostic Factors for Melanoma Patients. Acta Med Litu 2017, 24, 25–34. [Google Scholar] [CrossRef]
  12. Amaral, T.; Garbe, C. Non-Melanoma Skin Cancer: New and Future Synthetic Drug Treatments. Expert Opin Pharmacother 2017, 18, 689–699. [Google Scholar] [CrossRef] [PubMed]
  13. Leigh, I.M. Progress in Skin Cancer: The U.K. Experience. British Journal of Dermatology 2014, 171, 443–445. [Google Scholar] [CrossRef] [PubMed]
  14. Eide, M.J.; Krajenta, R.; Johnson, D.; Long, J.J.; Jacobsen, G.; Asgari, M.M.; Lim, H.W.; Johnson, C.C. Identification of Patients With Nonmelanoma Skin Cancer Using Health Maintenance Organization Claims Data. Am J Epidemiol 2010, 171, 123–128. [Google Scholar] [CrossRef] [PubMed]
  15. Lucena, S.R.; Salazar, N.; Gracia-Cazaña, T.; Zamarrón, A.; González, S.; Juarranz, Á.; Gilaberte, Y. Combined Treatments with Photodynamic Therapy for Non-Melanoma Skin Cancer. International Journal of Molecular Sciences 2015, Vol. 16, Pages 25912-25933 2015, 16, 25912–25933. [Google Scholar] [CrossRef] [PubMed]
  16. Chua, B.; Jackson, J.E.; Lin, C.; Veness, M.J. Radiotherapy for Early Non-Melanoma Skin Cancer. Oral Oncol 2019, 98, 96–101. [Google Scholar] [CrossRef] [PubMed]
  17. Organization, W.H. ICD-11 for Mortality and Morbidity Statistics (2018). 2018.
  18. Fung, K.W.; Xu, J.; Bodenreider, O. The New International Classification of Diseases 11th Edition: A Comparative Analysis with ICD-10 and ICD-10-CM. Journal of the American Medical Informatics Association 2020, 27, 738–746. [Google Scholar] [CrossRef] [PubMed]
  19. Ciążyńska, M.; Kamińska-Winciorek, G.; Lange, D.; Lewandowski, B.; Reich, A.; Sławińska, M.; Pabianek, M.; Szczepaniak, K.; Hankiewicz, A.; Ułańska, M.; et al. The Incidence and Clinical Analysis of Non-Melanoma Skin Cancer. Scientific Reports 2021 11:1 2021, 11, 1–10. [Google Scholar] [CrossRef] [PubMed]
  20. Linares, M.A.; Zakaria, A.; Nizran, P. Skin Cancer. Primary Care - Clinics in Office Practice 2015, 42, 645–659. [Google Scholar] [CrossRef] [PubMed]
  21. Apalla, Z.; Lallas, A.; Sotiriou, E.; Lazaridou, E.; Ioannides, D. Epidemiological Trends in Skin Cancer. Dermatol Pract Concept 2017, 7, 1. [Google Scholar] [CrossRef]
  22. Juszczak, A.M.; Wöelfle, U.; Končić, M.Z.; Tomczyk, M. Skin Cancer, Including Related Pathways and Therapy and the Role of Luteolin Derivatives as Potential Therapeutics. Med Res Rev 2022, 42, 1423–1462. [Google Scholar] [CrossRef]
  23. Collier, V.; Musicante, M; Patel, T; Liu-Smith, F. Sex Disparity in Skin Carcinogenesis and Potential Influence of Sex Hormones. Skin Health and Disease 2021, 1, e27. [Google Scholar] [CrossRef] [PubMed]
  24. Apalla, Z.; Calzavara-Pinton, P.; Lallas, A.; Argenziano, G.; Kyrgidis, A.; Crotti, S.; Facchetti, F.; Monari, P.; Gualdi, G. Histopathological Study of Perilesional Skin in Patients Diagnosed with Nonmelanoma Skin Cancer. Clin Exp Dermatol 2016, 41, 21–25. [Google Scholar] [CrossRef]
  25. Ring, C.; Cox, N.; Lee, J.B. Dermatoscopy. Clin Dermatol 2021, 39, 635–642. [Google Scholar] [CrossRef] [PubMed]
  26. Nami, N.; Giannini, E.; Burroni, M.; Fimiani, M.; Rubegni, P. Teledermatology: State-of-the-Art and Future Perspectives. Expert Review of Dermatology 2014, 7, 1–3. [Google Scholar] [CrossRef]
  27. Sinz, C.; Tschandl, P.; Rosendahl, C.; Akay, B.N.; Argenziano, G.; Blum, A.; Braun, R.P.; Cabo, H.; Gourhant, J.Y.; Kreusch, J.; et al. Accuracy of Dermatoscopy for the Diagnosis of Nonpigmented Cancers of the Skin. J Am Acad Dermatol 2017, 77, 1100–1109. [Google Scholar] [CrossRef] [PubMed]
  28. Vestergaard, M.E.; Macaskill, P.; Holt, P.E.; Menzies, S.W. Dermoscopy Compared with Naked Eye Examination for the Diagnosis of Primary Melanoma: A Meta-Analysis of Studies Performed in a Clinical Setting. British Journal of Dermatology 2008, 159, 669–676. [Google Scholar] [CrossRef] [PubMed]
  29. Haenssle, H.A.; Fink, C.; Schneiderbauer, R.; Toberer, F.; Buhl, T.; Blum, A.; Kalloo, A.; ben Hadj Hassen, A.; Thomas, L.; Enk, A.; et al. Man against Machine: Diagnostic Performance of a Deep Learning Convolutional Neural Network for Dermoscopic Melanoma Recognition in Comparison to 58 Dermatologists. Annals of Oncology 2018, 29, 1836–1842. [Google Scholar] [CrossRef] [PubMed]
  30. Brochez, L.; Verhaeghe, E.; Grosshans, E.; Haneke, E.; Piérard, G.; Ruiter, D.; Naeyaert, J.M. Inter-Observer Variation in the Histopathological Diagnosis of Clinically Suspicious Pigmented Skin Lesions. J Pathol 2002, 196, 459–466. [Google Scholar] [CrossRef] [PubMed]
  31. Lodha, S.; Saggar, S.; Celebi, J.T.; Silvers, D.N. Discordance in the Histopathologic Diagnosis of Difficult Melanocytic Neoplasms in the Clinical Setting. J Cutan Pathol 2008, 35, 349–352. [Google Scholar] [CrossRef] [PubMed]
  32. Haggenmüller, S.; Maron, R.C.; Hekler, A.; Utikal, J.S.; Barata, C.; Barnhill, R.L.; Beltraminelli, H.; Berking, C.; Betz-Stablein, B.; Blum, A.; et al. Skin Cancer Classification via Convolutional Neural Networks: Systematic Review of Studies Involving Human Experts. Eur J Cancer 2021, 156, 202–216. [Google Scholar] [CrossRef]
  33. Yan, Y.; Hong, S.; Zhang, W.; Li, H. Artificial Intelligence in Skin Diseases: Fulfilling Its Potentials to Meet the Real Needs in Dermatology Practice. Health Data Science 2022, 2022, 1–2. [Google Scholar] [CrossRef]
  34. Wiens, J.; Saria, S.; Sendak, M.; Ghassemi, M.; Liu, V.X.; Doshi-Velez, F.; Jung, K.; Heller, K.; Kale, D.; Saeed, M.; et al. Author Correction: Do No Harm: A Roadmap for Responsible Machine Learning for Health Care (Nature Medicine, (2019), 25, 9, (1337-1340), 10.1038/S41591-019-0548-6). Nat Med 2019, 25, 1627. [Google Scholar] [CrossRef] [PubMed]
  35. Gao, W.; Chen, L.; Shang, T. Stream of Unbalanced Medical Big Data Using Convolutional Neural Network. IEEE Access 2020, 8, 81310–81319. [Google Scholar] [CrossRef]
  36. Yang, H.; Li, X.; Cao, H.; Cui, Y.; Luo, Y.; Liu, J.; Zhang, Y. Using Machine Learning Methods to Predict Hepatic Encephalopathy in Cirrhotic Patients with Unbalanced Data. Comput Methods Programs Biomed 2021, 211, 106420. [Google Scholar] [CrossRef] [PubMed]
  37. Moreno-Barea, F.J.; Jerez, J.M.; Franco, L. Improving Classification Accuracy Using Data Augmentation on Small Data Sets. Expert Syst Appl 2020, 161, 113696. [Google Scholar] [CrossRef]
  38. Buda, M.; Maki, A.; Mazurowski, M.A. A Systematic Study of the Class Imbalance Problem in Convolutional Neural Networks. Neural Networks 2018, 106, 249–259. [Google Scholar] [CrossRef] [PubMed]
  39. Czarnowski, I. Weighted Ensemble with One-Class Classification and Over-Sampling and Instance Selection (WECOI): An Approach for Learning from Imbalanced Data Streams. J Comput Sci 2022, 61, 101614. [Google Scholar] [CrossRef]
  40. Bhowan, U.; Johnston, M.; Zhang, M.; Yao, X. Evolving Diverse Ensembles Using Genetic Programming for Classification with Unbalanced Data. IEEE Transactions on Evolutionary Computation 2013, 17, 368–386. [Google Scholar] [CrossRef]
  41. Mikołajczyk, A.; Grochowski, M. Data Augmentation for Improving Deep Learning in Image Classification Problem. 2018 International Interdisciplinary PhD Workshop, IIPhDW 2018 2018, 117–122. [CrossRef]
  42. Chen, N.; Xu, Z.; Liu, Z.; Chen, Y.; Miao, Y.; Li, Q.; Hou, Y.; Wang, L. Data Augmentation and Intelligent Recognition in Pavement Texture Using a Deep Learning. IEEE Transactions on Intelligent Transportation Systems 2022. [Google Scholar] [CrossRef]
  43. Sadhukhan, P.; Palit, S. Reverse-Nearest Neighborhood Based Oversampling for Imbalanced, Multi-Label Datasets. Pattern Recognit Lett 2019, 125, 813–820. [Google Scholar] [CrossRef]
  44. Koziarski, M. Radial-Based Undersampling for Imbalanced Data Classification. Pattern Recognit 2020, 102, 107262. [Google Scholar] [CrossRef]
  45. Zhu, Y.; Jia, C.; Li, F.; Song, J. Inspector: A Lysine Succinylation Predictor Based on Edited Nearest-Neighbor Undersampling and Adaptive Synthetic Oversampling. Anal Biochem 2020, 593, 113592. [Google Scholar] [CrossRef] [PubMed]
  46. Kubus, M. Evaluation of Resampling Methods in the Class Unbalance Problem. Econometrics. Ekonometria. Advances in Applied Data Analytics 2020, 24, 39–50. [Google Scholar] [CrossRef]
  47. Wang, C.; Deng, C.; Wang, S. Imbalance-XGBoost: Leveraging Weighted and Focal Losses for Binary Label-Imbalanced Classification with XGBoost. Pattern Recognit Lett 2020, 136, 190–197. [Google Scholar] [CrossRef]
  48. Ryou, S.; Jeong, S.-G.; Perona, P. Anchor Loss: Modulating Loss Scale Based on Prediction Difficulty 2019, 5992–6001.
  49. Yu, H.; Sun, C.; Yang, X.; Zheng, S.; Wang, Q.; Xi, X. LW-ELM: A Fast and Flexible Cost-Sensitive Learning Framework for Classifying Imbalanced Data. IEEE Access 2018, 6, 28488–28500. [Google Scholar] [CrossRef]
  50. Turkay, C.; Lundervold, A.; Lundervold, A.J.; Hauser, H. Hypothesis Generation by Interactive Visual Exploration of Heterogeneous Medical Data. Lecture Notes in Computer Science (including subseries Lecture Notes in Artificial Intelligence and Lecture Notes in Bioinformatics) 2013, 7947 LNCS, 1–12. [Google Scholar] [CrossRef]
  51. Yue, L.; Tian, D.; Chen, W.; Han, X.; Yin, M. Deep Learning for Heterogeneous Medical Data Analysis. World Wide Web 2020, 23, 2715–2737. [Google Scholar] [CrossRef]
  52. Cios, K.J.; William Moore, G. Uniqueness of Medical Data Mining. Artif Intell Med 2002, 26, 1–24. [Google Scholar] [CrossRef] [PubMed]
  53. Lama, N.; Kasmi, R.; Hagerty, J.R.; Stanley, R.J.; Young, R.; Miinch, J.; Nepal, J.; Nambisan, A.; Stoecker, W. v. ChimeraNet: U-Net for Hair Detection in Dermoscopic Skin Lesion Images. Journal of Digital Imaging 2022, 2022, 1–10. [Google Scholar] [CrossRef] [PubMed]
  54. Abbas, Q.; Celebi, M.E.; García, I.F. Hair Removal Methods: A Comparative Study for Dermoscopy Images. Biomed Signal Process Control 2011, 6, 395–404. [Google Scholar] [CrossRef]
  55. Lyakhov, P.A.; Lyakhova, U.A.; Nagornov, N.N. System for the Recognizing of Pigmented Skin Lesions with Fusion and Analysis of Heterogeneous Data Based on a Multimodal Neural Network. Cancers 2022, Vol. 14, Page 1819 2022, 14, 1819. [Google Scholar] [CrossRef]
  56. Cerda, P.; Varoquaux, G.; Kégl, B. Similarity Encoding for Learning with Dirty Categorical Variables. Mach Learn 2018, 107, 1477–1494. [Google Scholar] [CrossRef]
  57. Al-Shehari, T.; Alsowail, R.A. An Insider Data Leakage Detection Using One-Hot Encoding, Synthetic Minority Oversampling and Machine Learning Techniques. Entropy 2021, 23, 1258. [Google Scholar] [CrossRef] [PubMed]
  58. Rodríguez, P.; Bautista, M.A.; Gonzàlez, J.; Escalera, S. Beyond One-Hot Encoding: Lower Dimensional Target Embedding. Image Vis Comput 2018, 75, 21–31. [Google Scholar] [CrossRef]
  59. Potdar, K.; Pardawala, T.S.; Pai, C.D. A Comparative Study of Categorical Variable Encoding Techniques for Neural Network Classifiers. Int J Comput Appl 2017, 175, 7–9. [Google Scholar] [CrossRef]
  60. Wang, Q.; Ma, Y.; Zhao, K.; Tian, Y. A Comprehensive Survey of Loss Functions in Machine Learning. Annals of Data Science 2022, 9, 187–212. [Google Scholar] [CrossRef]
  61. Kim, Y.; Lee, Y.; Jeon, M. Imbalanced Image Classification with Complement Cross Entropy. Pattern Recognit Lett 2021, 151, 33–40. [Google Scholar] [CrossRef]
  62. Ho, Y.; Wookey, S. The Real-World-Weight Cross-Entropy Loss Function: Modeling the Costs of Mislabeling. IEEE Access 2020, 8, 4806–4813. [Google Scholar] [CrossRef]
  63. Jodelet, Q.; Liu, X.; Murata, T. Balanced Softmax Cross-Entropy for Incremental Learning. Lecture Notes in Computer Science (including subseries Lecture Notes in Artificial Intelligence and Lecture Notes in Bioinformatics) 2021, 12892 LNCS, 385–396. [Google Scholar] [CrossRef]
  64. Tasci, E.; Zhuge, Y.; Camphausen, K.; Krauze, A. v. Bias and Class Imbalance in Oncologic Data—Towards Inclusive and Transferrable AI in Large Scale Oncology Data Sets. Cancers 2022, Vol. 14, Page 2897 2022, 14, 2897. [Google Scholar] [CrossRef]
  65. Huynh, T.; Nibali, A.; He, Z. Semi-Supervised Learning for Medical Image Classification Using Imbalanced Training Data. Comput Methods Programs Biomed 2022, 216, 106628. [Google Scholar] [CrossRef] [PubMed]
  66. Foahom Gouabou, A.C.; Iguernaissi, R.; Damoiseaux, J.L.; Moudafi, A.; Merad, D. End-to-End Decoupled Training: A Robust Deep Learning Method for Long-Tailed Classification of Dermoscopic Images for Skin Lesion Classification. Electronics 2022, Vol. 11, Page 3275 2022, 11, 3275. [Google Scholar] [CrossRef]
  67. Vo, N.H.; Won, Y. Classification of Unbalanced Medical Data with Weighted Regularized Least Squares. Proceedings of the Frontiers in the Convergence of Bioscience and Information Technologies, FBIT 2007 2007, 347–352. [CrossRef]
  68. Aurelio, Y.S.; de Almeida, G.M.; de Castro, C.L.; Braga, A.P. Learning from Imbalanced Data Sets with Weighted Cross-Entropy Function. Neural Process Lett 2019, 50, 1937–1949. [Google Scholar] [CrossRef]
  69. Dong, Y.; Shen, X.; Jiang, Z.; Wang, H. Recognition of Imbalanced Underwater Acoustic Datasets with Exponentially Weighted Cross-Entropy Loss. Applied Acoustics 2021, 174, 107740. [Google Scholar] [CrossRef]
  70. Wang, S.; Yin, Y.; Wang, D.; Wang, Y.; Jin, Y. Interpretability-Based Multimodal Convolutional Neural Networks for Skin Lesion Diagnosis. IEEE Trans Cybern 2021. [Google Scholar] [CrossRef] [PubMed]
  71. Goh, G.; †, N.C.; †, C.V.; Carter, S.; Petrov, M.; Schubert, L.; Radford, A.; Olah, C. Multimodal Neurons in Artificial Neural Networks. Distill 2021, 6, e30. [Google Scholar] [CrossRef]
  72. Liu, K.; Li, Y.; Xu, N.; Natarajan, P. Learn to Combine Modalities in Multimodal Deep Learning. 2018.
  73. O’Shea, K.; Nash, R. An Introduction to Convolutional Neural Networks. 2015. [CrossRef]
  74. Lyu, J.; Shi, H.; Zhang, J.; Norvilitis, J. Prediction Model for Suicide Based on Back Propagation Neural Network and Multilayer Perceptron. Front Neuroinform 2022, 16, 79. [Google Scholar] [CrossRef]
  75. Siegel, J.A.; Korgavkar, K.; Weinstock, M.A. Current Perspective on Actinic Keratosis: A Review. British Journal of Dermatology 2017, 177, 350–358. [Google Scholar] [CrossRef]
  76. Huang, G.; Liu, Z.; van der Maaten, L.; Weinberger, K.Q. Densely Connected Convolutional Networks 2017, 4700–4708.
  77. Szegedy, C.; Ioffe, S.; Vanhoucke, V.; Alemi, A.A. Inception-v4, Inception-ResNet and the Impact of Residual Connections on Learning. 31st AAAI Conference on Artificial Intelligence, AAAI 2017 2016, 4278–4284. [CrossRef]
  78. Xie, S.; Girshick, R.; Dollár, P.; Tu, Z.; He, K. Aggregated Residual Transformations for Deep Neural Networks. Proceedings - 30th IEEE Conference on Computer Vision and Pattern Recognition, CVPR 2017 2016, 2017-January, 5987–5995. [CrossRef]
  79. Alzubaidi, L.; Zhang, J.; Humaidi, A.J.; Al-Dujaili, A.; Duan, Y.; Al-Shamma, O.; Santamaría, J.; Fadhel, M.A.; Al-Amidie, M.; Farhan, L. Review of Deep Learning: Concepts, CNN Architectures, Challenges, Applications, Future Directions. Journal of Big Data 2021 8:1 2021, 8, 1–74. [Google Scholar] [CrossRef] [PubMed]
  80. Chicco, D.; Jurman, G. The Advantages of the Matthews Correlation Coefficient (MCC) over F1 Score and Accuracy in Binary Classification Evaluation. BMC Genomics 2020, 21, 1–13. [Google Scholar] [CrossRef]
  81. Yap, J.; Yolland, W.; Tschandl, P. Multimodal Skin Lesion Classification Using Deep Learning. Exp Dermatol 2018, 27, 1261–1267. [Google Scholar] [CrossRef]
  82. He, X.; Wang, Y.; Zhao, S.; Chen, X. Co-Attention Fusion Network for Multimodal Skin Cancer Diagnosis. Pattern Recognit 2023, 133, 108990. [Google Scholar] [CrossRef]
  83. Chen, Q.; Li, M.; Chen, C.; Zhou, P.; Lv, X.; Chen, C. MDFNet: Application of Multimodal Fusion Method Based on Skin Image and Clinical Data to Skin Cancer Classification. J Cancer Res Clin Oncol 2022, 1–13. [Google Scholar] [CrossRef]
  84. Brinker, T.J.; Hekler, A.; Enk, A.H.; Klode, J.; Hauschild, A.; Berking, C.; Schilling, B.; Haferkamp, S.; Schadendorf, D.; Holland-Letz, T.; et al. Deep Learning Outperformed 136 of 157 Dermatologists in a Head-to-Head Dermoscopic Melanoma Image Classification Task. Eur J Cancer 2019, 113, 47–54. [Google Scholar] [CrossRef] [PubMed]
  85. Esteva, A.; Kuprel, B.; Novoa, R.A.; Ko, J.; Swetter, S.M.; Blau, H.M.; Thrun, S. Dermatologist-Level Classification of Skin Cancer with Deep Neural Networks. Nature 2017, 542, 115–118. [Google Scholar] [CrossRef] [PubMed]
  86. Brinker, T.J.; Hekler, A.; Enk, A.H.; Berking, C.; Haferkamp, S.; Hauschild, A.; Weichenthal, M.; Klode, J.; Schadendorf, D.; Holland-Letz, T.; et al. Deep Neural Networks Are Superior to Dermatologists in Melanoma Image Classification. Eur J Cancer 2019, 119, 11–17. [Google Scholar] [CrossRef] [PubMed]
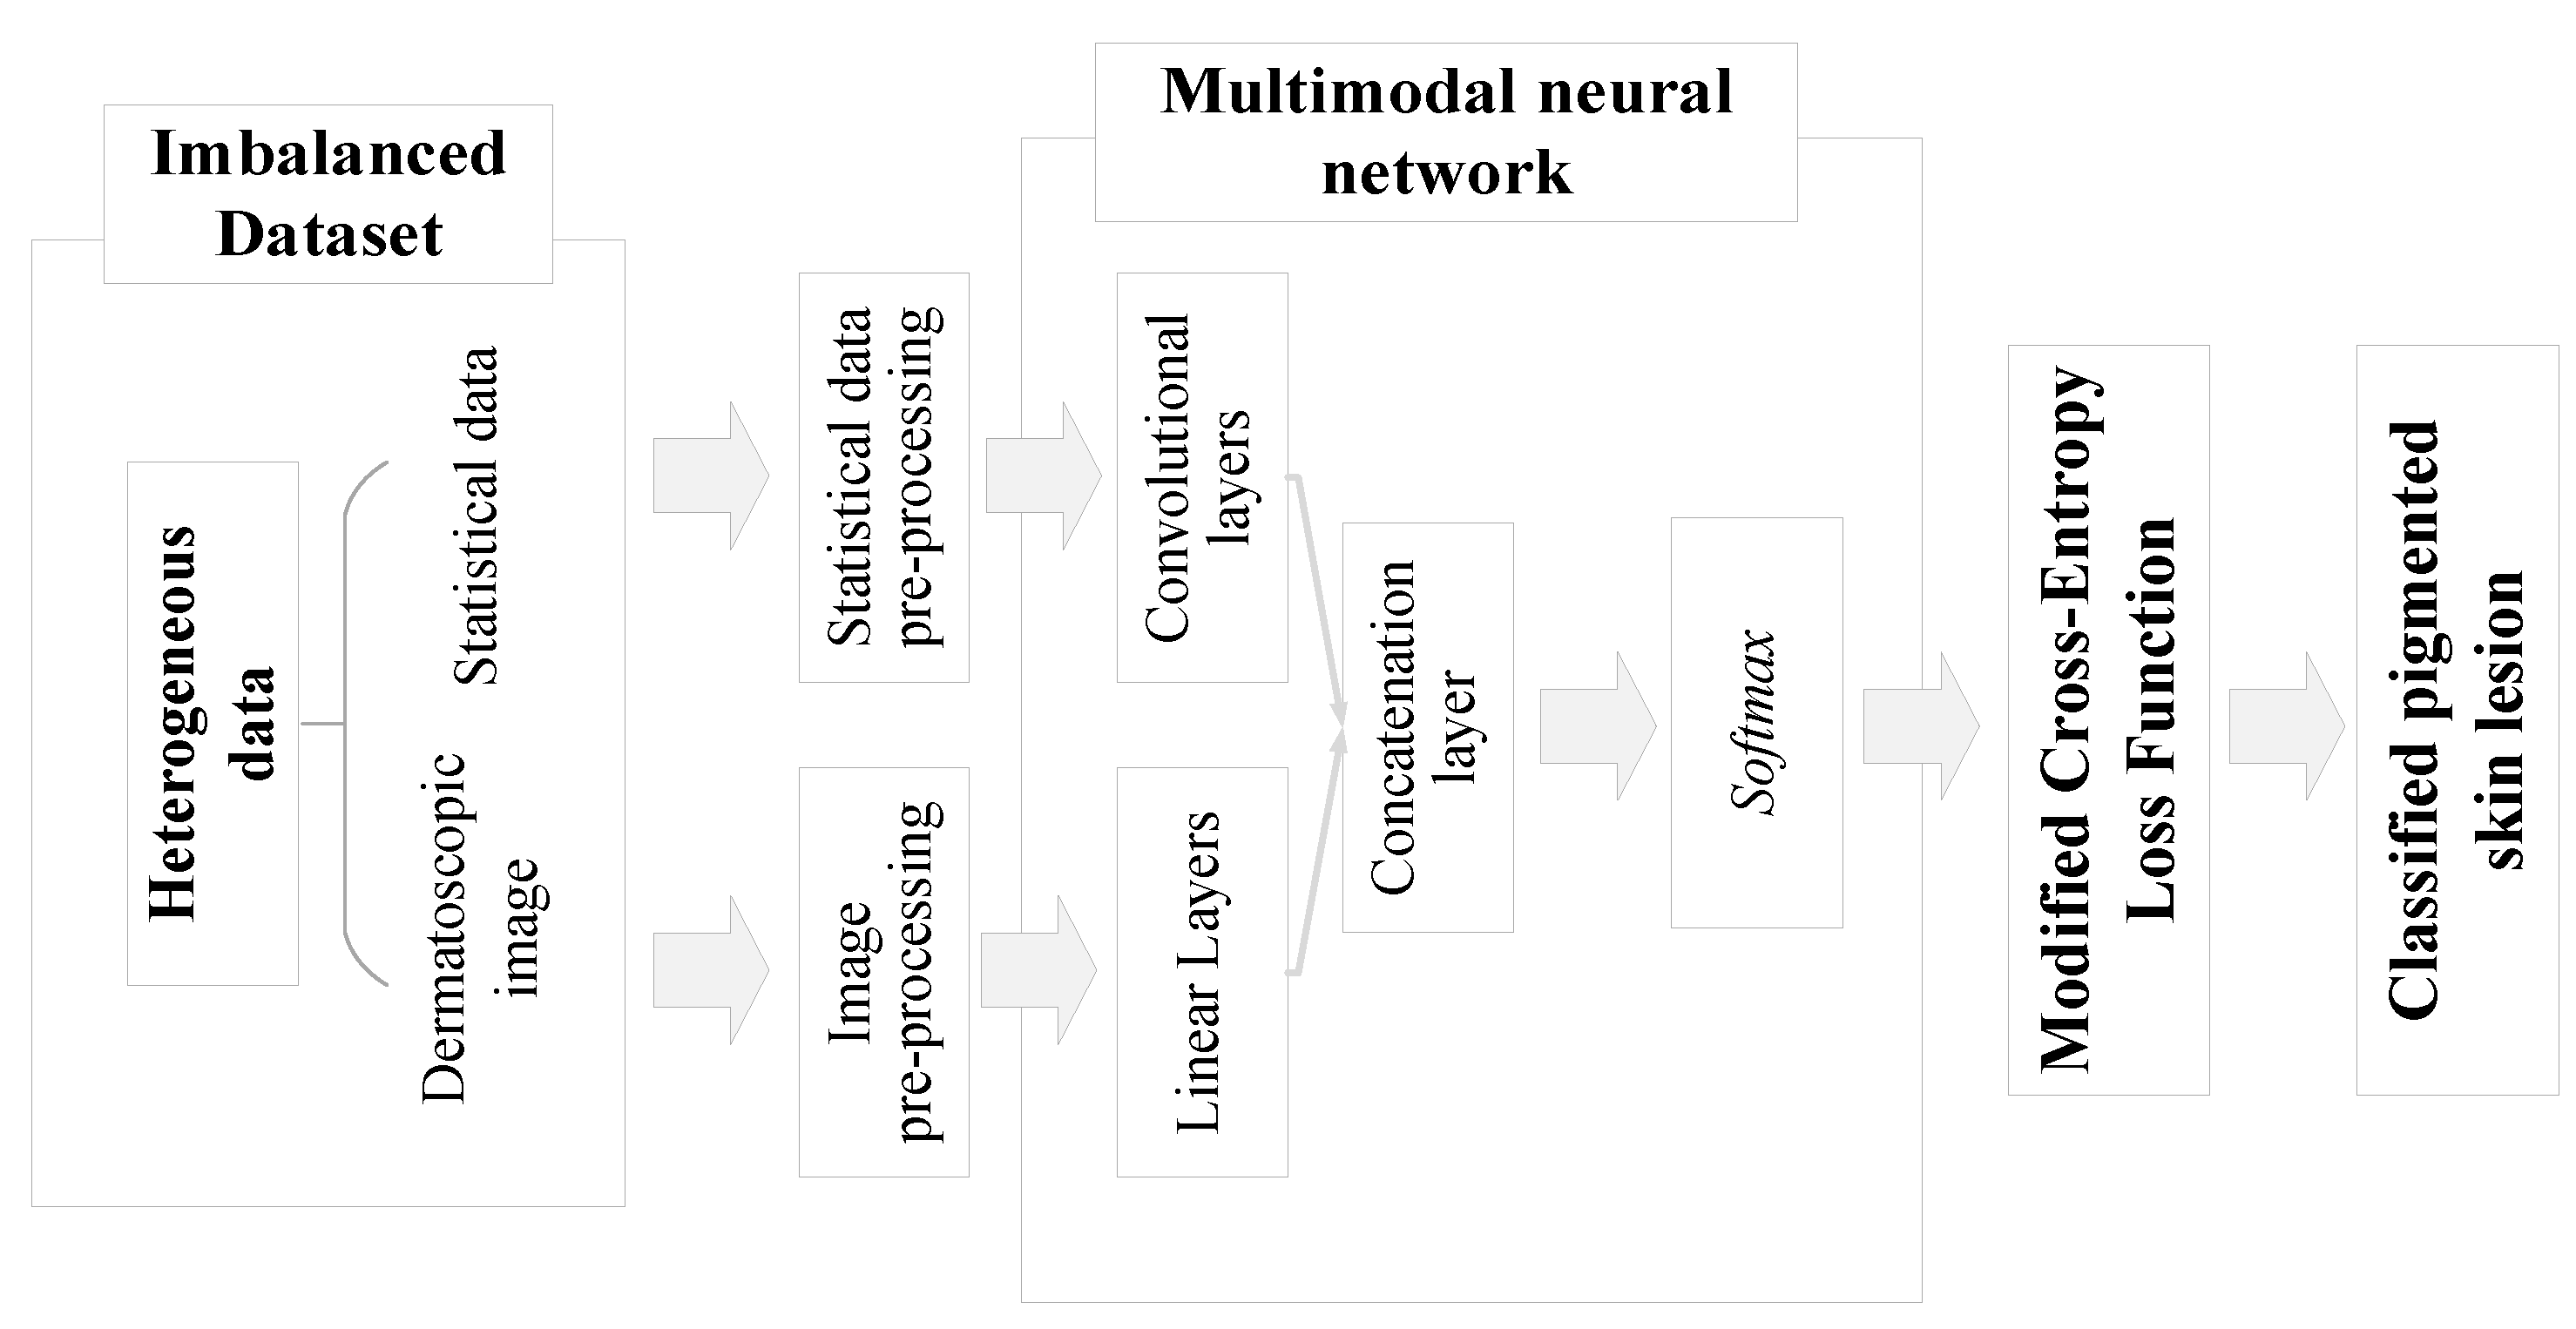
Figure 1. Multimodal neural network system with a modified cross-entropy loss function, sensitive to unbalanced heterogeneous dermatological data.
Preprints 66816 g001
Figure 2. An example of the step-by-step operation of the method of pre-cleaning of hair structures on dermatological images.
Preprints 66816 g002
Figure 3. Scheme for processing dermatological statistical data using the one-hot encoding method.
Preprints 66816 g003
Figure 4. Scheme of using a modified cross-entropy loss function for training a multimodal neural network system for recognizing pigmented skin lesions.
Preprints 66816 g004
Figure 5. The architecture of the proposed multimodal neural network system for recognizing pigmented skin lesions with a modified cross-entropy loss function.
Preprints 66816 g005
Figure 6. Graph of the distribution of selected dermatological images into diagnostically relevant categories.
Preprints 66816 g006
Figure 7. Graph of the distribution of selected dermatological data by statistical factors of patients: a) by gender, b) by age, c) by localization of the pigmented lesion on the patient's body.
Preprints 66816 g007
Figure 8. Coding tables of statistical parameters of patients using the one-hot encoding method: a) gender, b) age, c) localization of the pigmented lesion on the patient's body.
Preprints 66816 g008
Figure 9. An example of pre-processed dermatological images using the hairline cleaning method.
Preprints 66816 g009
Figure 10. Confusion matrices as a result of testing a multimodal neural network system based on the DenseNet_161 architecture: a) original multimodal neural network system; b) multimodal neural network system with a modified cross-entropy loss function.
Preprints 66816 g010
Figure 11. Confusion matrices as a result of testing a multimodal neural network system based on the Inception_v4 architecture: a) original multimodal neural network system; b) multimodal neural network system with a modified cross-entropy loss function.
Preprints 66816 g011
Figure 12. Confusion matrices as a result of testing a multimodal neural network system based on the ResNeXt_50 architecture: a) original multimodal neural network system; b) multimodal neural network system with a modified cross-entropy loss function.
Preprints 66816 g012
Figure 13. Confusion matrices in two categories as a result of testing the original multimodal neural network system based on architectures: a) DenseNet_161; b) Inception_v4; c) ResNeXt_50.
Preprints 66816 g013
Figure 14. Confusion matrices in two categories as a result of testing a multimodal neural network system modified with a cross-entropy loss function based on architectures: a) DenseNet_161; b) Inception_v4; c) ResNeXt_50.
Preprints 66816 g014
Figure 15. Classification tables for testing multimodal neural network systems for recognizing pigmented skin lesions for McNemar analysis based on architectures: a) DenseNet_161; b) Inception_v4; c) ResNeXt_50.
Preprints 66816 g015
Table 1. Table of the cardinality of each statistical factor selected for modeling from the dermatological database.
Statistical factor Cardinality
1 Gender 2
2 Age 18
3 Localization on the body 8
TOTAL 28
Table 2. Table of the cardinality of each pre-processed statistical factor selected for modeling from the dermatological database.
Statistical factor Cardinality
1 Gender 2
2 Age 4
3 Localization on the body 8
TOTAL 14
Table 3. Weight coefficients are used to modify the cross-entropy loss function in a multimodal neural network system.
Diagnostic category Weight coefficient
1 Vascular lesions 3.8893
2 Nevus 0.0353
3 Solar lentigo 3.6444
4 Dermatofibroma 3.9992
5 Seborrheic keratosis 0.6721
6 Benign keratosis 0.8954
7 Actinic keratosis 1.1323
8 Basal cell carcinoma 0.2900
9 Squamous cell carcinoma 1.5000
10 Melanoma 0.1758
Table 4. The results of assessing the accuracy when testing the proposed multimodal neural network system, sensitive to unbalanced dermatological data.
CNN
architecture
Results of test
Original multimodal neural network system, % Multimodal neural network system with a modified cross-entropy loss function, % Difference in recognition accuracy between original and proposed multimodal neural network systems, %
DenseNet_161 [76] 81.15 85.19 4.04
Inception_v4 [77] 82.42 83.86 1.44
ResNeXt_50 [78] 83.91 84.93 1.02
Table 5. The results of the loss function evaluation when testing the proposed multimodal neural network system, sensitive to unbalanced dermatological data.
CNN
architecture
Results of test
Original multimodal neural network system Multimodal neural network system with a modified cross-entropy loss function Different in value of the loss function between original and proposed multimodal neural network systems
DenseNet_161 [76] 0.2563 0.1344 0.1219
Inception_v4 [77] 0.2087 0.1964 0.0123
ResNeXt_50 [78] 0.1843 0.1475 0.0368
Table 6. Results of testing multimodal neural network systems by quantitative assessment methods.
CNN
architecture
Loss function weights Specificity Sensitivity F-1 score MCC FNR FPR NPV PPV Simulation time, hh:mm:ss
DenseNet_161 [76] Not used 0.9791 0.8115 0.8115 0.6543 0.1884 0.0209 0.9791 0.8115 14:02:18
Used 0.9835 0.8519 0.8519 0.7169 0.1481 0.0164 0.9835 0.8519 13:54:55
Inception_v4 [77] Not used 0.9821 0.8397 0.8397 0.6929 0.1602 0.0178 0.9821 0.8397 09:28:24
Used 0.9833 0.8494 0.8494 0.7165 0.1506 0.0167 0.9833 0.8494 10:52:07
ResNeXt_50 [78] Not used 0.9795 0.8156 0.8156 0.6457 0.1844 0.0205 0.9795 0.8156 11:47:05
Used 0.9821 0.8391 0.8391 0.6846 0.1616 0.0179 0.9820 0.8391 10:12:15
Table 7. Accuracy results in testing various multimodal neural network systems for recognizing pigmented skin lesions.
Multimodal neural network system for recognizing pigmented skin lesions Accuracy of recognition of pigmented neoplasms of the skin, %
Known neural network systems [81] 71.90
[82] 76.80
[83] 80.42
The proposed multimodal neural network system based on the DenseNet_161 architecture 85.19
Disclaimer/Publisher’s Note: The statements, opinions and data contained in all publications are solely those of the individual author(s) and contributor(s) and not of MDPI and/or the editor(s). MDPI and/or the editor(s) disclaim responsibility for any injury to people or property resulting from any ideas, methods, instructions or products referred to in the content.
Copyright: This open access article is published under a Creative Commons CC BY 4.0 license, which permit the free download, distribution, and reuse, provided that the author and preprint are cited in any reuse.
Prerpints.org logo

Preprints.org is a free preprint server supported by MDPI in Basel, Switzerland.

Subscribe

© 2024 MDPI (Basel, Switzerland) unless otherwise stated