Preprint
Article

Performance of Energy Consumption Using Natural Ventilation in Dwelling Design, CFD Simulation In Hot Dry Climate

Altmetrics

Downloads

230

Views

108

Comments

0

This version is not peer-reviewed

Submitted:

04 January 2023

Posted:

05 January 2023

You are already at the latest version

Alerts
Abstract
This paper evaluates an architectural design using an Energy Consumption consideration of Natural Ventilation in a hot dry climate (Khartoum State), at dwellings design applied. Method was used analysis of Autodesk IEVS software natural ventilation and energy consumption simulation. It resulted that to cooling, by natural ventilation in dwelling design used to get indoor temperature at the comfortable level during the summer. The Best-Case Situation of natural ventilation with consider of energy saving Based on the CFD simulation analysis, the performance of internal air velocity is approximately 0.7m/s. The wind velocity starts to slow down towards the rear of the apartment spaces. Approximately 95% of the internal areas have average air velocity between 0.43 m/s to 0.9 m/s. Internal Air flow pattern single floor house plan at Khartoum (Alazhari City); showing the internal air velocity of 0.7m/s near the window opening positions with the wind directions in the details and pressure of the air as worst-case situation, with velocity and temperature of the air with average 22o as a best-case situation. during a year. Architectural design process in the urban area of Alazhari City for dwelling towards to saving energy was applied and determined into an urban planning neighbourhood at Khartoum.
Keywords: 
Subject: Engineering  -   Architecture, Building and Construction

1. Introduction

Design building utilizing an Energy Consumption perspective of Natural Ventilation is the process of designing, choosing, and calculating the ratings of the system’s equipment [1]. This procedure is contingent on a number of variables, including geographic location, sun irradiation, and load requirements. As a developing nation, Sudan is experiencing a rapid urbanization process; the proportion of urban regions is anticipated to increase dramatically in the near future. Consequently, it is essential to identify the obstacles to urban housing in Sudan [2]. Energy consumption important part of optimum design in a dwelling, include the natural ventilation was suitable for cooling the house to go in green architecture and reduce the electrical load. For cooling, the natural ventilation in this design was used to get the indoor temperature at a comfortable level during the summer, while also saving energy in Sudan as a hot region. The average is through the analysis of Autodesk IES (VE) v5.9.0.3 software for CFD design [3,4]. Study was search in Khartoum for designing a clean and low energy house towards to sustainable architecture, based on all the requirements of planning spatially on the location and general in Khartoum state. For design purposes, the researchers have considered a type of the residential area of Block 10 of Alazhari City(Urban of Khartoum); the type is of insulated load bearing type as shown in [5]. The ground floor plans of the types, which are slightly different from each other. The design of the two types of houses was considered as an ideal example of optimum design that is perfectly viable for implementation in the homes of second and third classes [5,6].
The principle of natural ventilation was widely adopted by individuals and architects across the globe. Due to energy concerns, indoor air quality concerns, and environmental challenges associated with mechanically ventilated structures, the application of natural ventilation in buildings is gaining popularity [7]. Observed and detailed in depth was a vast array of national and international natural ventilation initiatives. [8] stated; the natural ventilation showed that the general strategy to the analysis evolved from traditional to computational methodologies. This also implies that computer modeling appears to be the prevalent method for establishing problem concepts and solutions for structures in the twenty-first century. [9,10] noted that as wind modeling improved as well as with computer speed and capacity, the approach was growing in popularity not only for its adaptability and informative results but also for its affordable labor and equipment expenses. A domain including both stationary objects (such as buildings) and non-stationary barriers (such as moving autos, trees, etc.) could be modeled using CFD.) [11]. According to [10] Energy simulation and computational fluid dynamics (CFD) were integrated into a central role in building design because they supply complementary data on the performance of the building. However, due to the underlying assumptions of each application, running them independently will not result in a reliable prediction of the thermal and flow behavior of a building [8]. Most simulation programs, for instance, assume that the air in an indoor space is well mixed, that the air temperature and contaminants are uniformly distributed in a zone, and that momentum effects are ignored [12].
According to [12,13] Predicting thermal comfort in naturally ventilated buildings using CFD modeling alone was challenging. It’s composed of the effects of climate on both large- and small-scale environments, from entire neighborhoods to individual rooms. indoor thermal environment boundary conditions and heat transfer/fluid dynamics calculations [14]. CFD studies for external flows still have a somewhat restricted degree of accuracy, which is something that needs to be carefully examined. A CFD study of the airflow around the building, on the other hand, will provide solid results along with extra information on the special conditions for that building. For this reason, the development and implementation of CFD-based urban climate assessment tools is essential [14,15]. Both the CFD method and the building simulation method had their own unique drawbacks in terms of the amount of computational performance they required. However, recent advancements in computer performance IES (VE) v5.9.0.3 software integrate with building simulation has made it possible to improve the accuracy of evaluating the effectiveness of natural ventilation also give more data analysis procedure that generates of airflow in buildings. This has made it possible to improve the accuracy of IES (VE) v5.9.0.3 software integrate with building simulation [16,17]. In recent years, the study of natural ventilation in buildings has been an active research subject, and the combination of building modeling with CFD has emerged as the new trend (for delivering an accurate solution) [16].
The Physical Features of Alazhari City(urban of Khartoum) According to [18,19] greater Khartoum is the name given to the capital of the Sudan in the urban Khartoum, Khartoum North, and Omdurman are at the junction of the Blue and White Niles at 15°36’N 32°32’E and 96.520 m above sea level [20,21]. Sudanese capital covers an area above 22,122 km2 [22,23]. The topography of Land is generally in Alazhari City as a part of Khartoum state was, flat with gradual slope towards the north and the Nile [22]. In the west, the land was bear with Nubian stone and water bearing sedimentation formation. In the south, it is covered with 30 meters of thick darkness and heavy slit called Gezira clay [22]. The central and the main ports of the three towns fall within the area of recent deposits of alluviums wadi fills, terraces, delta and swamp deposit and the location of greater Khartoum.

2. Research Area and Data:

2.1. Climatic Conditions

[23] The weather of Greater Khartoum, that is located at the southernmost tip of the Sahara Desert, has been characterized as a hot desert. From November and May, the climate is hot and dry, with a three-month period of cold weather between December and February. From June through October, a three-month wet season dominates. At least sixty percent of the average rainfall thus is relatively low, and sloped land is susceptible to significant erosion. With yearly evaporation rates of 3000 mm, the annual precipitation is just 150 mm. The wind direction follows a predictable pattern [22]. During the dry season, the winds blow from the north, whereas during the brief wet season, the winds blow from the south. Soil corrugations discovered west of Omdurman are likely caused by the ferocity of the prevailing north winds. May and June are known for their volatility, and with that comes the "Haboob" wind. Between May and September, the sun shines for an average of 95% of each day [18]. addition to the area is connected with centre of Khartoum through (Medany high way) and connected with [Al-Ingaz], [ Mayo] and [Idd- Hussain] cities [18,24].

2.2. An Urban Planning of Alazhari City(Urban of Khartoum State)

It is careful as the most central modern cities characterized as a result of the
bordered by the main street which is breaking into other main branches as well as all blocks in central cities is consisting of 50- 100 thousands person [25,26]. Although the shape of the city includes different classes and blocks it is planned with both vertical and horizontal roads. It has a main centre introduce the different blocks. This type of planning has some difficulty, and need to be improved and efficient [27]. Intended for motive that the researcher attitude this crisis when designed and planning the unplanned area at block no. 10, furthermore not far-off diverse from the blocks planning of the intact city of Alazhari, because it must be harmony with attractive beautiful. The city planned comprehensively with integrating all activities and different services as well as social and human services [28]. So, there are (18) mosques and little number of nooks, there is only five basic school it is located in block (11, 10, 15, 23, 5). In attendance is another basic school under establishing, although it is not completed but it is started to receive pupil. The completed rooms are without doors or windows. The average student’s walk to school is roughly one kilometer. There is only one hospital in the region, and it’s in building No (15) [2]. It receives medium cases but it has no ambulance [2,28]. There is no market in the city that is because the city is located near Khartoum central market and the local market. All the organization in the city is funded publicly and through aid and donations by charity societies and citizens self-efforts [2,6]. The current situation of the city is not satisfying the central modern cities requirements and is not meeting citizens’ needs, which necessitate immediate treatment by public and governmental authorities. Blocks are similar in design and in general shape Grid planning as whole Khartoum state planning [29]. The services are extended from the first unit through to the centre of the city.
The city is divided into three classes: consisting of (29) blocks. Figure (13) & (14). It is as pursue a First class represents 28.7% of the area which consists of (6) blocks that is (5247) Sections and the inhabited sections are (2098). Second class: It represents 13 % of the city [21]. It consists of (7) blocks (8, 9, 25, 26, 27, 28, 29), and the number of sections is (2469), number of populations is (988) persons. Third class: it represents 58.7% of the city as shown in Figure 1(a-b). It consists of (16) blocks, (2469) sections, (4398) are the inhabited sections [6,26]. Number of sections in the city is (18710) persons and the inhabited sections is 38% - 41% in all blocks [2,6]. The average of family members is about 6 persons [30]. The whole the city’s population is about (52388). Population statistics for the various classes and blocks [6,31].

3. Materials and Methods

3.1. Design Approach of Energy Consumption in a Housing Considering of the Climate of Khartoum

This paper considered climate and geographical location as having a major control of the housing design [32]. In the hot dry climate, used a process to keep the house cool in summer and warm in winter to save electricity [33].

3.1.1 Planning Strategies and Method

Existing conditions in Khartoum result from socio-economic, political and other forces [22,34]. As strategy deals with planning and implementation, the strategies of
Development concern in this article.
Figure 2 lays out how the design is influenced by the infrastructure layout in the residential sector. Utilities, land, water, transportation, local resources for employment, and suitable living and working climates are all taken into consideration throughout the site selection process [32,35]. The main criteria of urban forms were vertical rather than horizontal by grouping clusters for shading, capturing cool breezes and minimizing glare and solar heat reflection. Other design strategies include using water for cooling, using the courts for shading and ventilation by pedestrian networks to confined buildings or trees and avoidance of large un shaded areas [35,36]. Building Materials detailed as The optimal design of materials selected for the house include concrete floors with red brick walls [2], as they was provided even temperatures in the room with a window for south-north thermal collection to absorb heat in the winter [37,38]

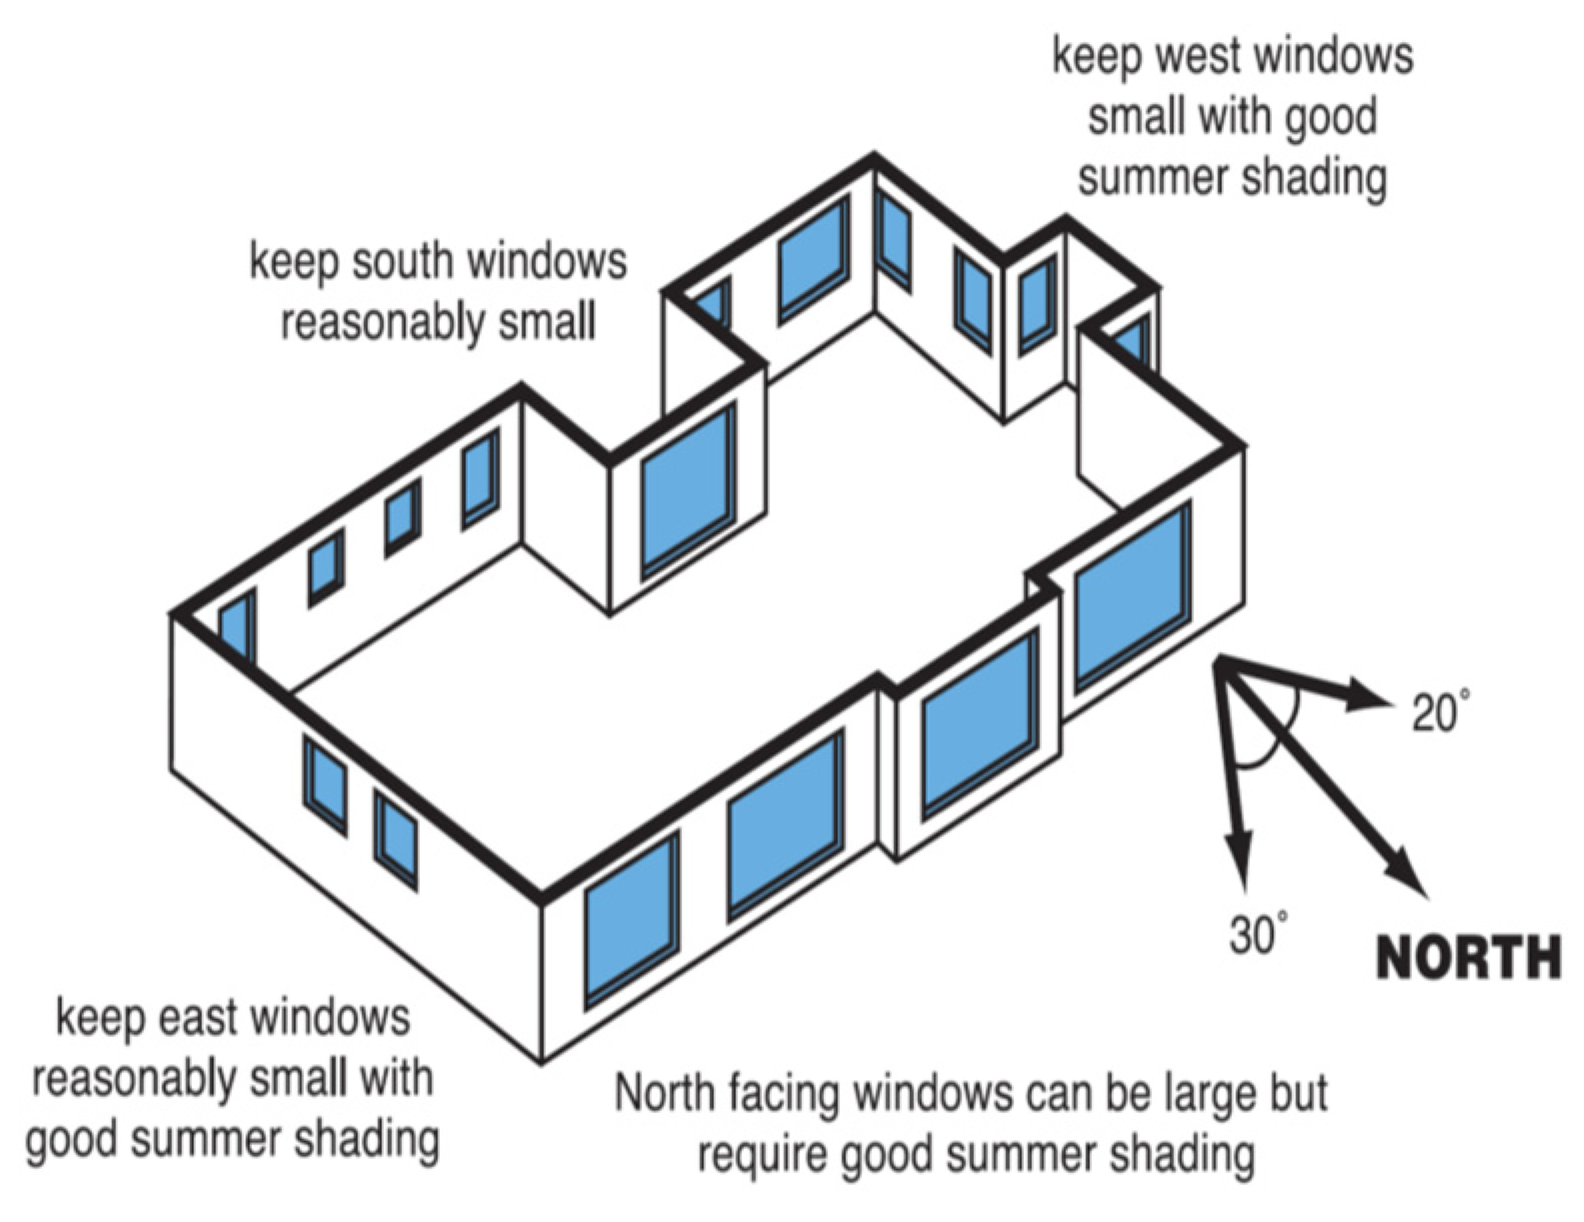
3.1.3. Position and Size of Windows

Windows were strategically placed and sized depending on their orientation and the construction materials utilized in the house. Openable windows at strategic locations allowed for cross ventilation from the summer’s cooling breezes. Windows were either double-hung, casement, or sliding [38]. As shown in the Figure 2 below:
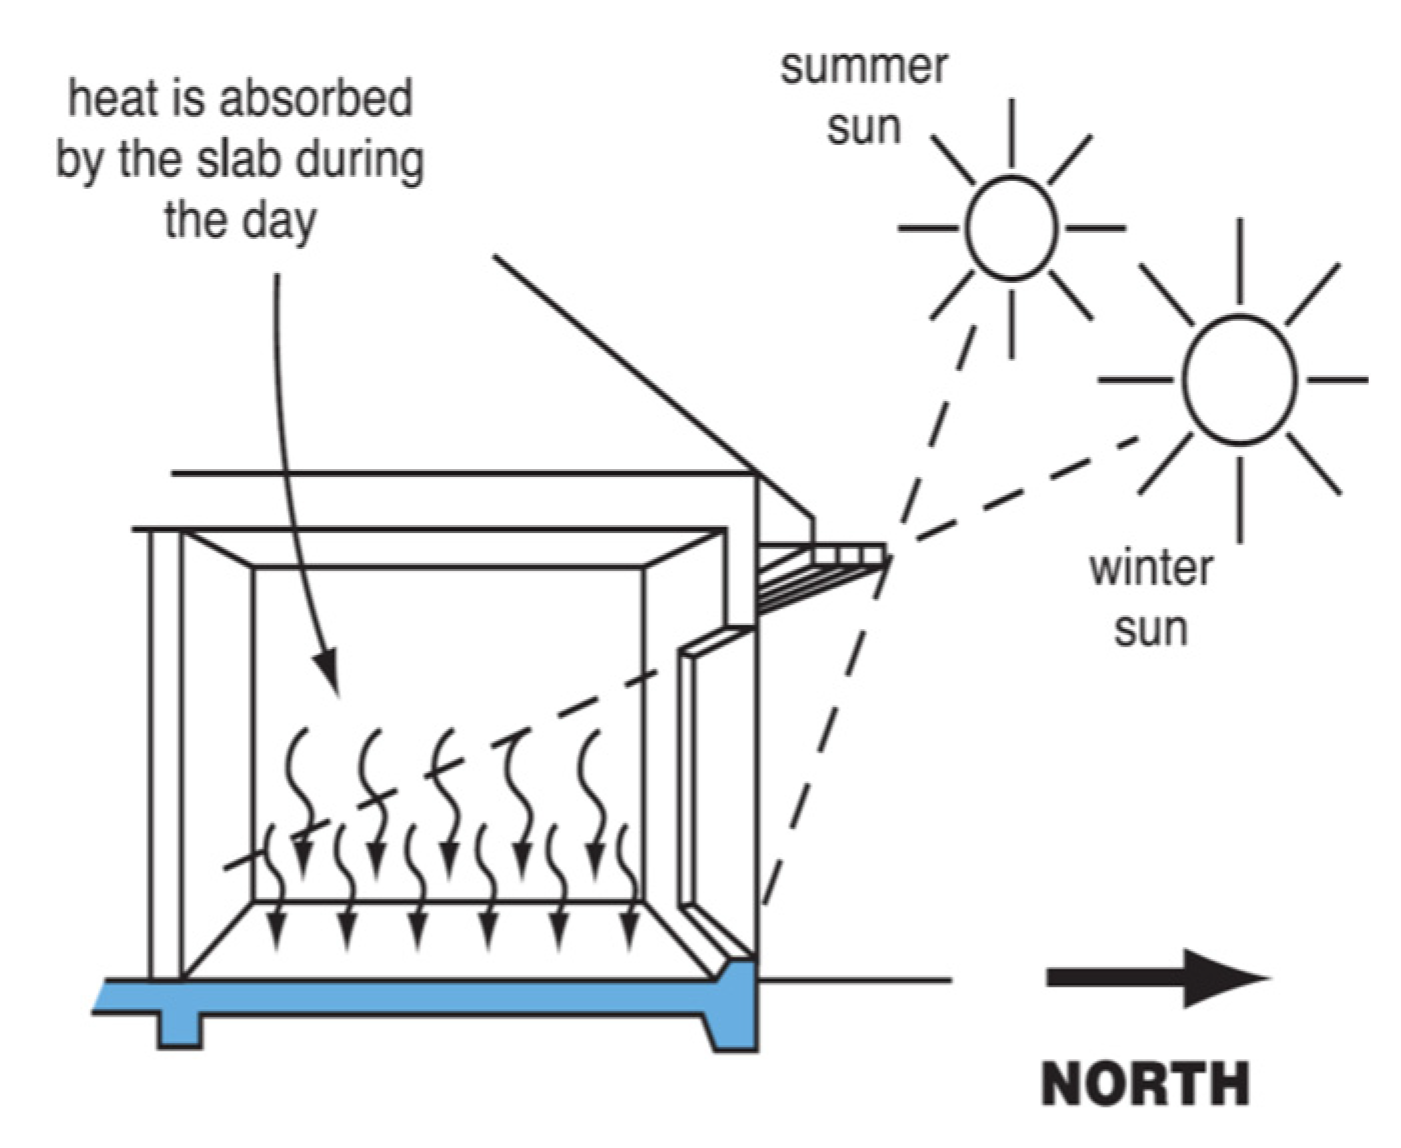
The roof is well-developed enough to provide for access to the sun in the winter, while also sheltering the window from the sun in the summer when the angle is altered. This house’s architecture makes excellent use of the shadows cast by external devices to reduce the interior temperature during the warm summer months [38]. North and West windows are in the shadow of the vertical sun protection devices all year [2,39], as shown in Figure 3. In the winter, windows should be of high yield and good quality so that no heat losses are incurred [2,6] detailed below:

3.1.4. Air Movement and Draught Control

High quality ventilation prevents these common sources of heating air leaks. Ventilation was reduced during the day to exclude hot [22], dust-laden outdoor air from the interior accomplished by the location of the windows [40].

3.1.5. Computational Simulation used IES (VE) v5.9.0.3 Software

To conduct this case study, we choose to use Virtual Environment IES (VE) v5.9.0.3 since it provides the most flexibility in terms of model reuse across all study components.
For the overheating analysis, the software had to estimate bulk air flow throughout the building so that the efficacy of the proposed ventilation method may be determined [39]. This part of the research utilized the Macroflo module of the IES (VE) v5.9.0.3 in tandem with Sun cast and the Apache simulation engine [41].

3.1.6. The Modeling and Simulation Process

The concept design layout for the Enterprise building was the first step in the process for this case study. A central courtyard is used in the original design idea to create natural ventilation [2]. As the warm air in the courtyard flows to the roof, it generates the cross ventilation, which makes the building naturally ventilated. This case study’s aims are first to verify that the concept design is producing the desired results, and second to optimize the design for maximum efficiency [42]. In the first phase, we examined the effectiveness of the building’s basic design by developing a model.
  • Ventilation
According to The National Calculation Method’s formulas were used in the simulations, which meant that some degree of control was allowed for. Lighting energy decreased as glazing area rose, while heating energy increased as a result of higher conduction losses and lower usable internal gains [41]. Following the energy analysis, a study of the building’s overheating and its effect on thermal comfort was conducted. The passive methods examined included opening up the ceiling to reveal thermal mass, installing external shade, and opening windows at night. In this research, the outside air flow velocity and pattern were predicted by creating a computational fluid dynamics (CFD) model of the complete development. Therefore, one-story buildings were selected for in-house simulation [41]. Each of the CFD simulation produces a detailed result of air temperature, relative, air flow velocity and pattern [43]. The macro flow is used to simulate the indoor environment. The displays presented in this report consist of the 3d views of the airflow pattern taken from either horizontal or vertical sections through the space [17]. Most simulations are performed at a constant state temperature of 28 Co in an isothermal environment. The apartment’s computational elements were all set to 0.2m, whereas those nearer the buildings and the ground were all set to 1m. The windows diagram analysis uses a northerly wind direction with a mean speed of 3 m/s as an external boundary condition.

3.1.7. Detailed of Site Description

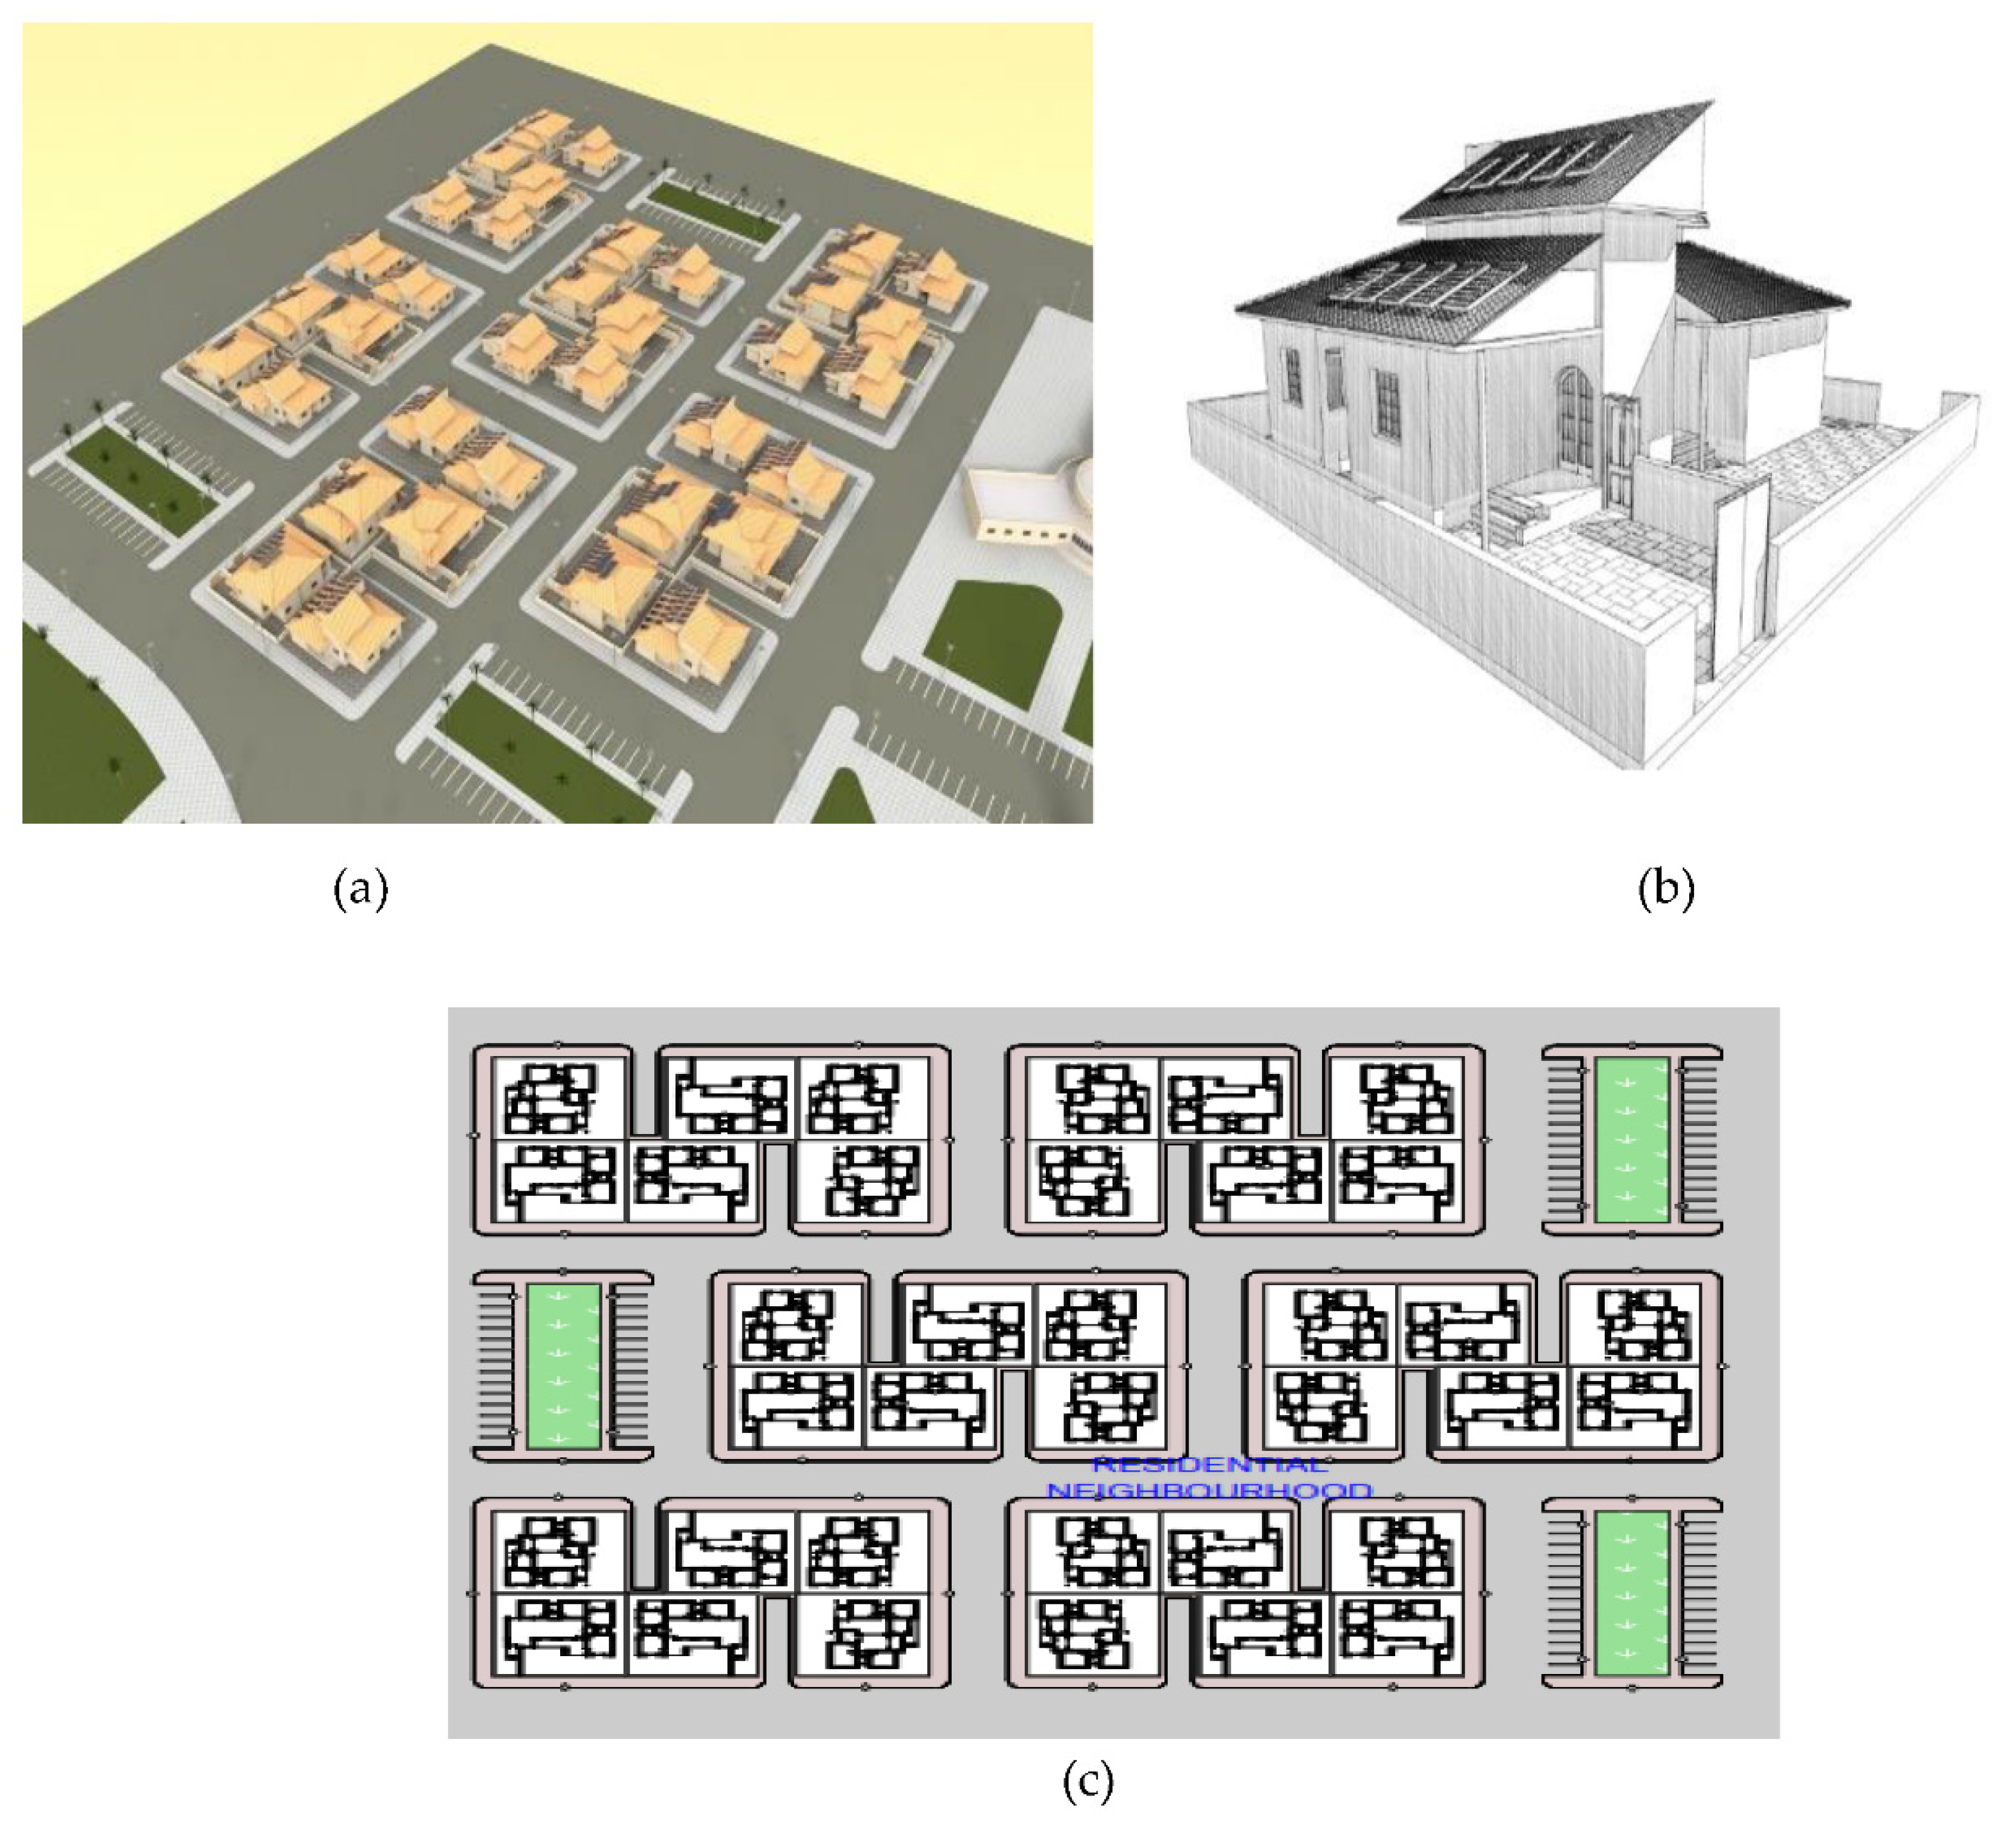
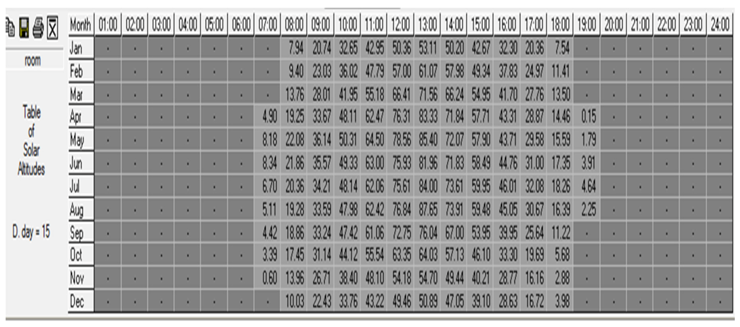
The Ministry of Planning and Engineering Affairs in Khartoum, Sudan, was able to provide all of the available and essential data, including plans of Alazhari City. The information here will be used to develop a blueprint for the development of Alazhari City’s Block No. 10. Suburban neighborhoods’ homes [2]. The study developed a house design in an urban area which is considered as the third-class houses area in Khartoum state by adopting the architecture needs which is mainly climatically appropriate [6]. The area of the 1-family-home is a 200 m2 with an extra 100 m2 for courtyard, also designed and supported by [6] as shown in Figure 4 (a) and (b). This design creates a house plan that can accommodate 6-7 people. According to the design, it is possible to keep a pleasant temperature inside a house year-round if the house is planned with the cooling impact of the site (hot, dry climate) in mind, as simulated in Table 1 by researchers. For this reason, the design of the house allows for a significant amount of sunshine to enter the house throughout the winter in order to provide sufficient interior heating, day lighting, and natural ventilation for human needs [2,5,6]. As well limiting the sunlight that enters the house as much as possible during the summer to maintain the interior cooling. In response to this, the architects and planners at the proposed site, Block No. 10, made sure to position the building so that it faces south, where it would receive the most sunlight and benefit most from the cooling effects of natural air circulation [44]. It had relatively unobstructed southern exposure so that the atmospheric air being heated by the sun can enter the house easily to make the interior cool during the summer season similar to [2,21] resulted the environment site planning allows appropriate levels of natural ventilation and energy consumption into each dwelling, similar with [45].

4. Dissections and Results

4.1. Low-Energy House Technology Options at Alazhari City (Urban of Khartoum State)

The design includes wide windows with dimensions of 1.5m ×1.5m to cover the maximum area of the most indirect natural light of south and north exposure. The inclusion of the cover on the roof and the refraction of the sunlight, According to the overarching plan of the building, windows can be designed to selectively admit sunshine and disperse daylight throughout the day and the year [2,5]. Therefore, window orientations were integrated in the rule to produce the right combination of light for the construction, depending on the climate and latitude of Khartoum state of north for more effective natural ventilation. Researcher improved the amount of light by using a large light in the room using window size as above as clear in Figure 1. [46,47] determined the affect the amount of light transmission through the windows as a main element effect of sustainable design and sustainable architecture to find an optimum design of low energy building [48,49].

4.2. IES Virtual Environment> (IES VE>) was used for computational simulation.

The IES Virtual Environment (IES VE) is a collection of applications that all collaborate together and have the same user interface and data model [41]. The software provides a framework for in-depth design evaluation, allowing structures and systems to be optimized in light of comfort and energy efficiency requirements [41,50]. The Virtual Environment (VE) was chosen for this research because it allowed us to use a single component for all of the study’s needs.

4.3. Simulated Weather Data Analysis

Khartoum climate design test data and the IESV software reference year were used to collect and analyze the weather data. The data used to create the IESV weather file is collected over the course of a year to ensure that it is indicative of a typical year’s worth of weather [51]. Figure 4.46 shows the results of the simulations run using the IESV file to analyze energy use. Served as input for analyses and simulations of the effects of local climate factors like temperature and wind on building design.

4.3.1. Radiance Energy Plus Integration

Once the simulation list has used Radiance to computing daylight availability and lighting control response [52], this information was used to inform the energy plus model as clear in Figure 5. This is generally able by defining a lighting plan for the Energy Plus model in concentrate, switching off the resident Energy Plus day lighting calculation and simply using the lighting schedule dictated by Radiance-based simulation.

4.3.2. Air Movement and Ventilation

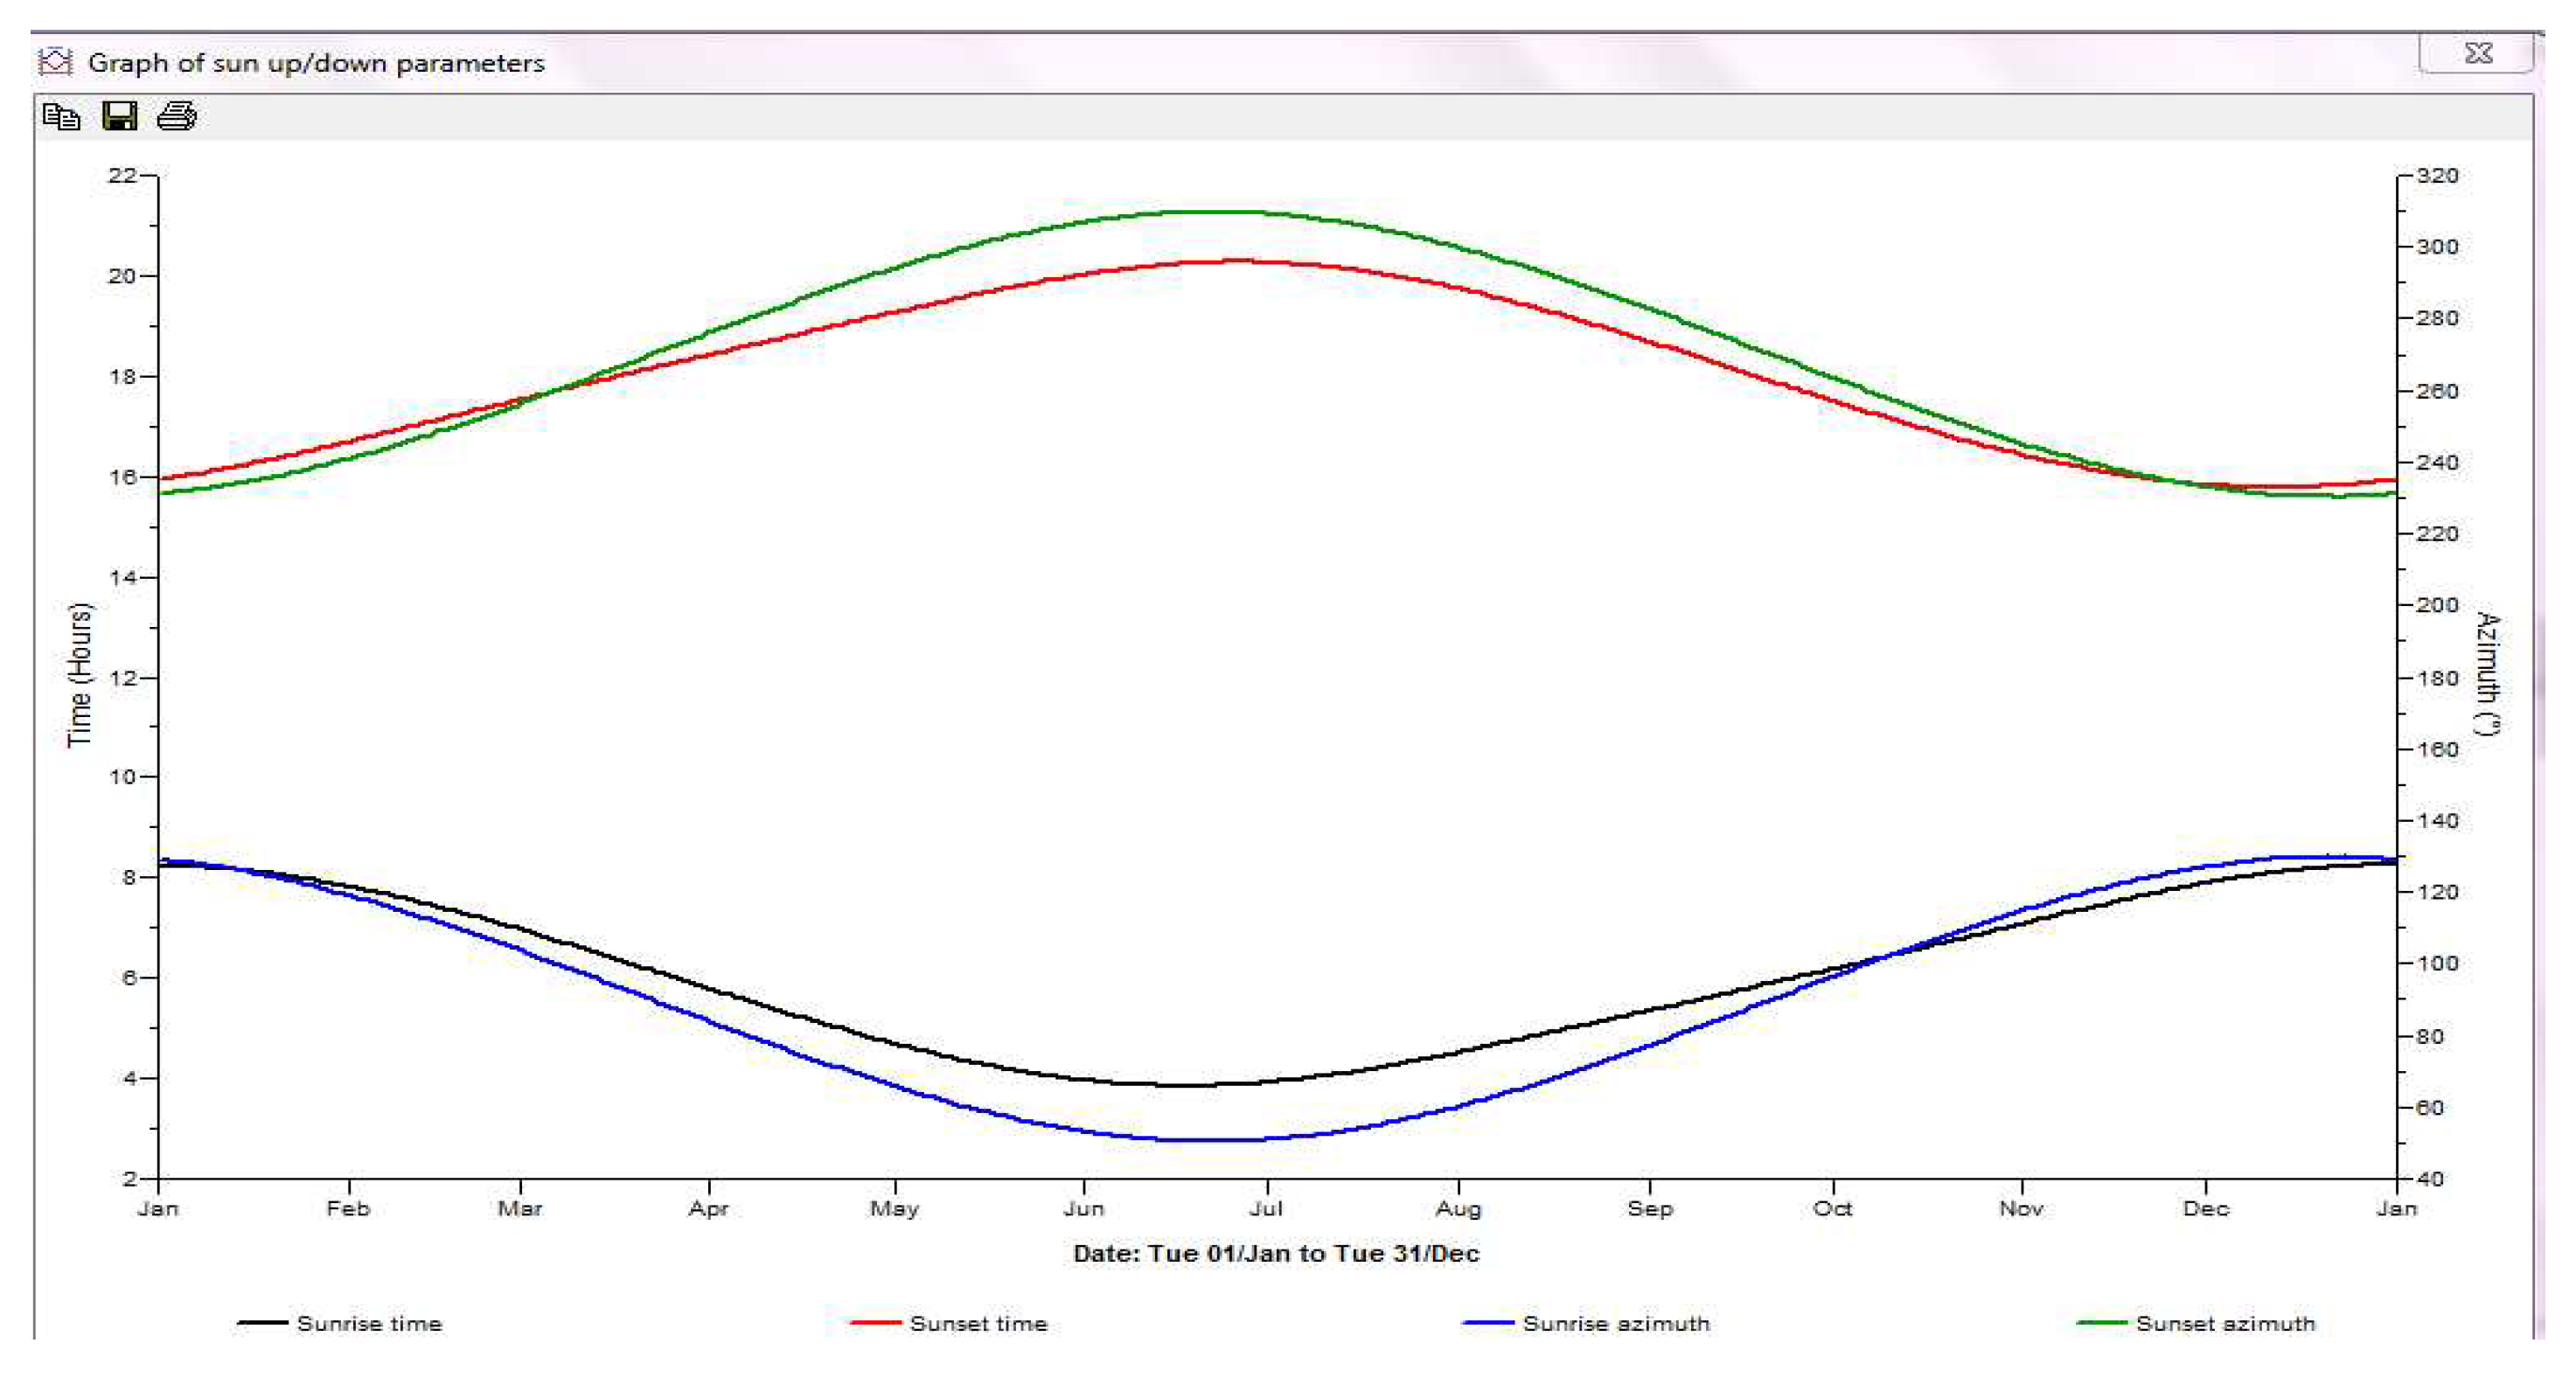
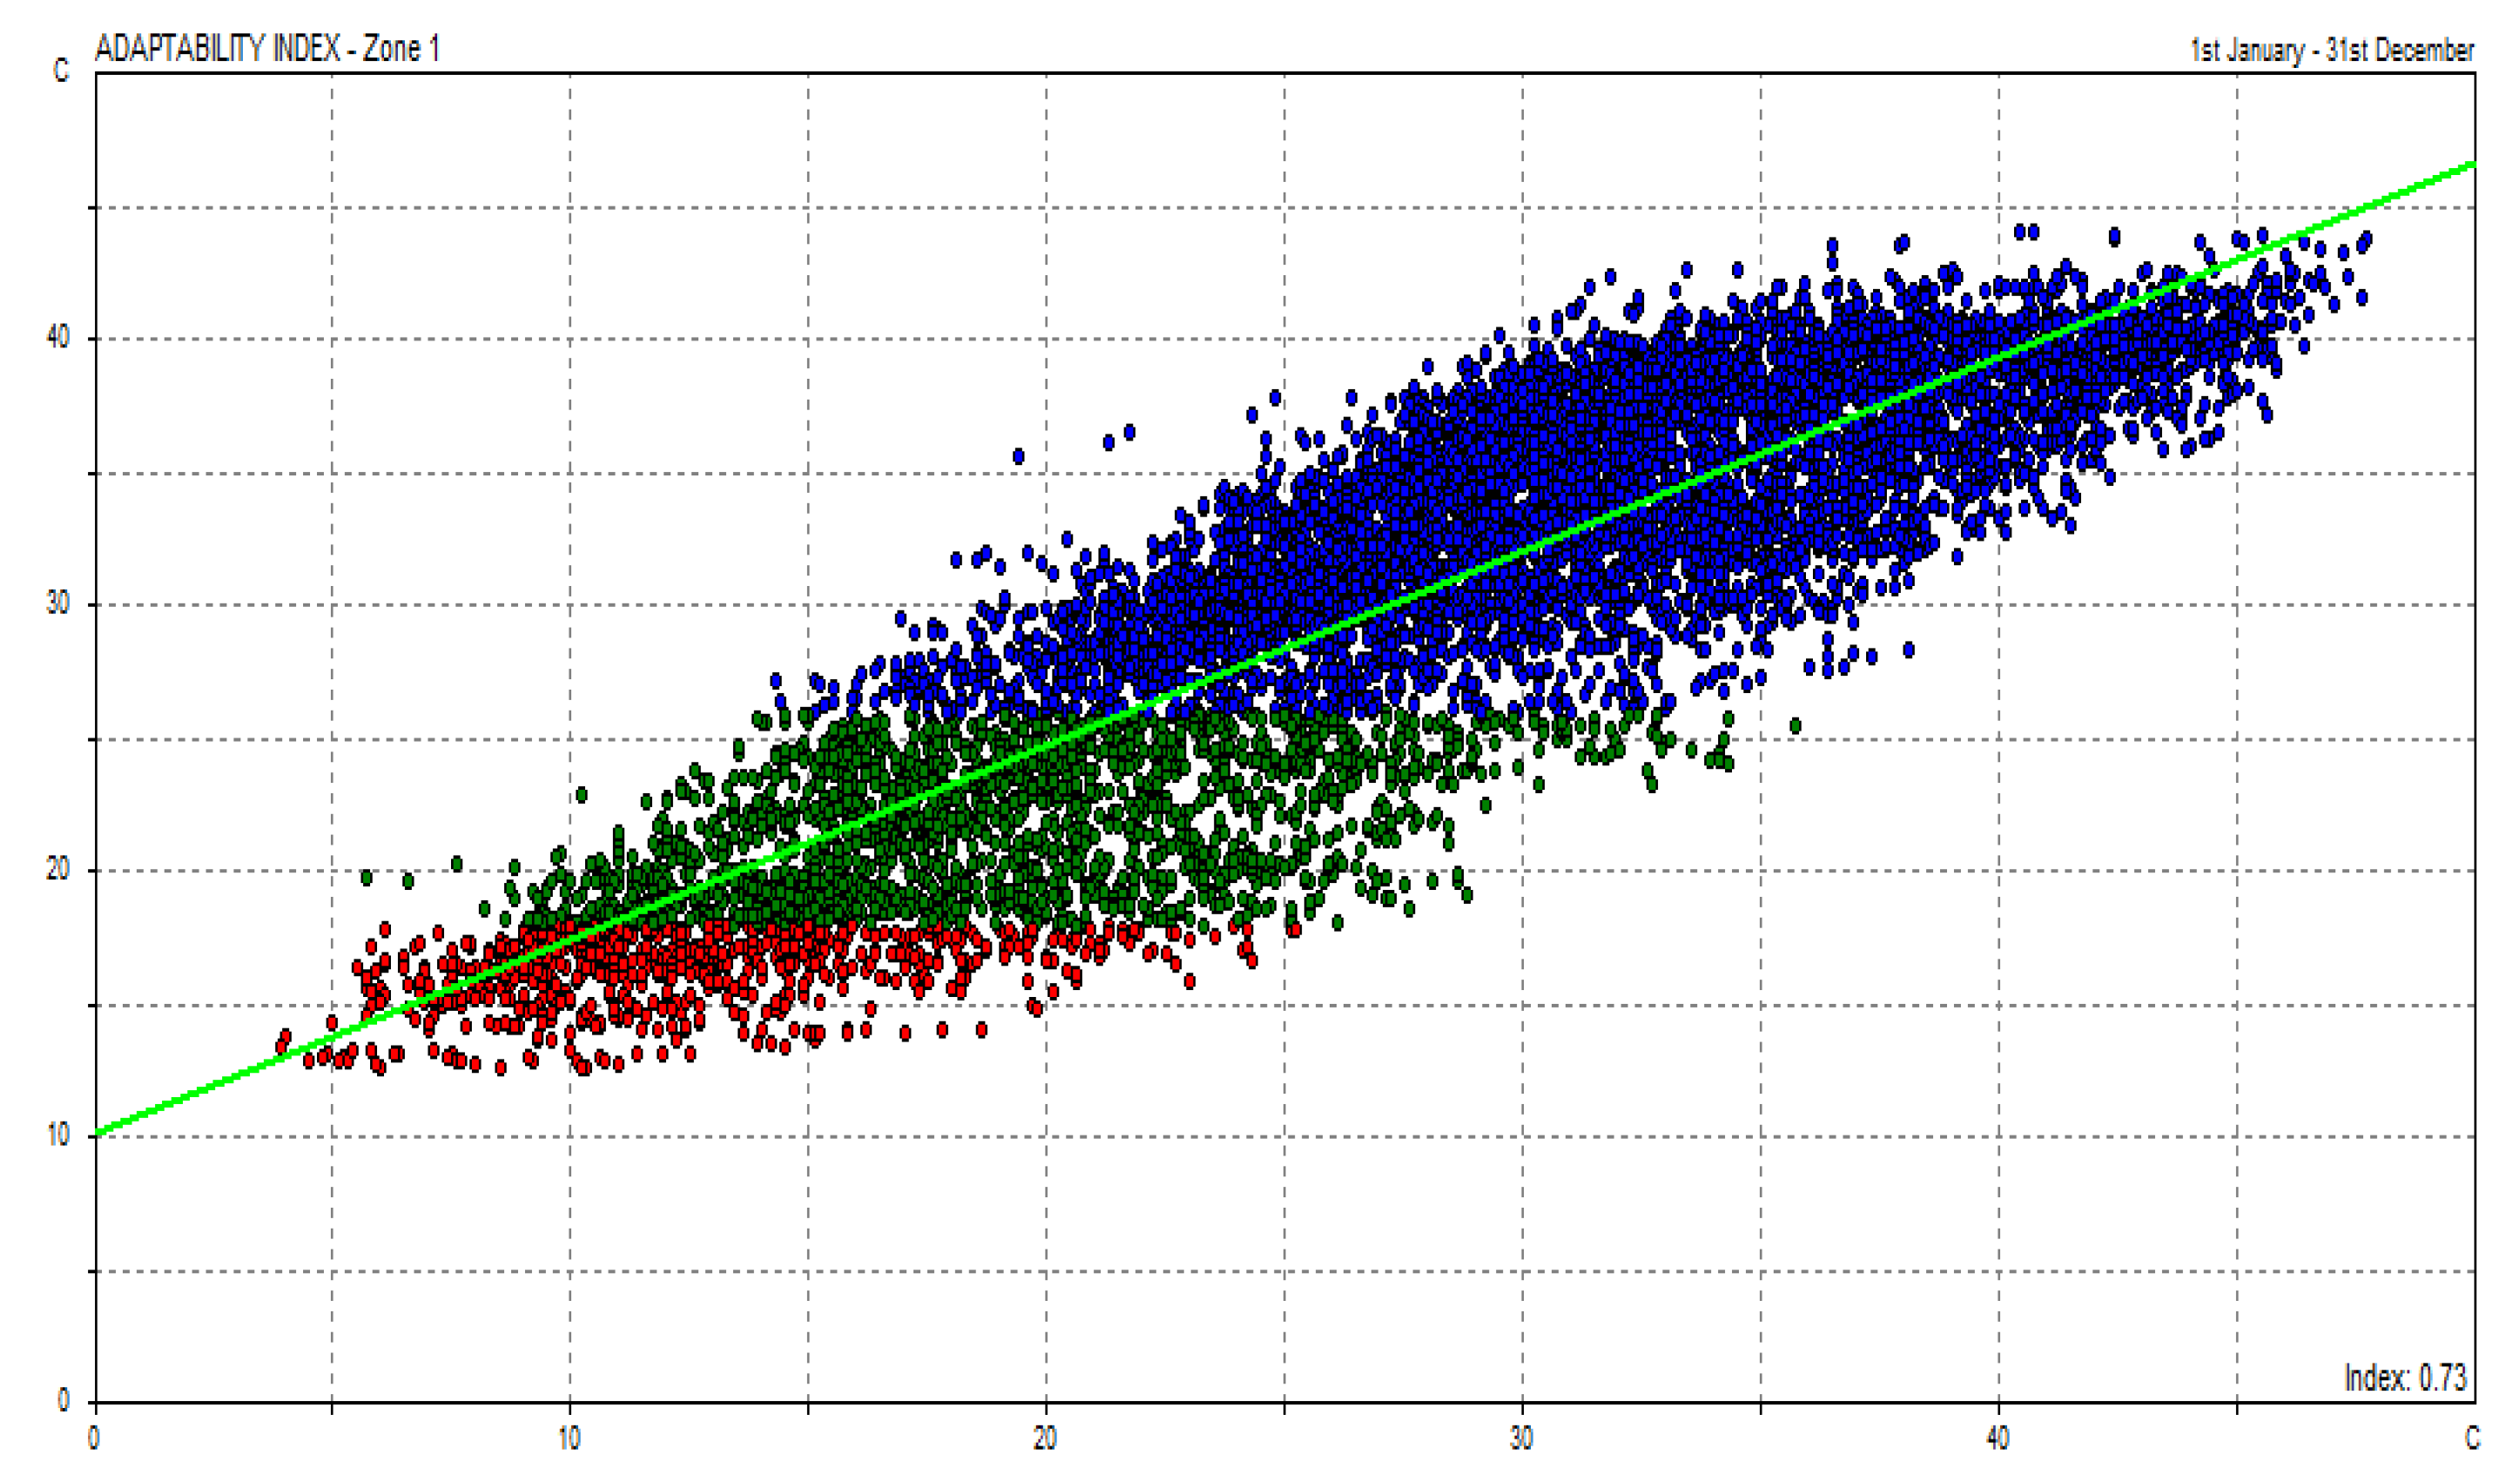
In hot and dry areas like Khartoum, Alazhari City, the outside air during the day is so hot that the movement of air into a building is not encouraged [6]. In this design, in the summer the hot season is found at night, ventilation is desirable to cool the structure of the building, and detailed by using IESV software. As resulted in Figure 6; Sun at a high angle, high temperatures, and a moderate south airflow characterize the summer months of March through June. The months of July to October, termed as the rainy season, are usually colder than the rest of the year. also the air is going down into the interior while the heated internal air is exhausted. To obtain the prevent heating by day; opening was opened to produce ventilation, as air movement during the day will not be required. Winter months (November–February) have the lowest solar angle and mildest average temperatures (Figure 7). Furthermore, it prevents heat accumulation. Furthermore, the researcher creates large windows to accommodate the climate conditions [53] Contribute to this outcome by serving in Khartoum. As depicted in Figure 4.49, the designs considered for obtaining natural ventilation in buildings depend on the airflow in the area to reduce the temperature inside the building. Using IESV software, the annual air temperature ranges from 21° to 35°C, while the relative humidity ranges from 45 to 95%, with the exception of July and August, when it falls below 20%. Cool night as depicted in Figure 7 and Figure 8. This study utilized metropolitan Khartoum settings; this may be a crucial factor for natural ventilation design in Khartoum. It was comparable to [54,55] in the similar range of natural ventilation 30⁰-36⁰. In the location of case study, for the hot and dry condition, a building has a heavy structure; as a first study using this software in Khartoum and details the future of cooling a house [56].

4.4. Inputs and Assumptions for the Simulation

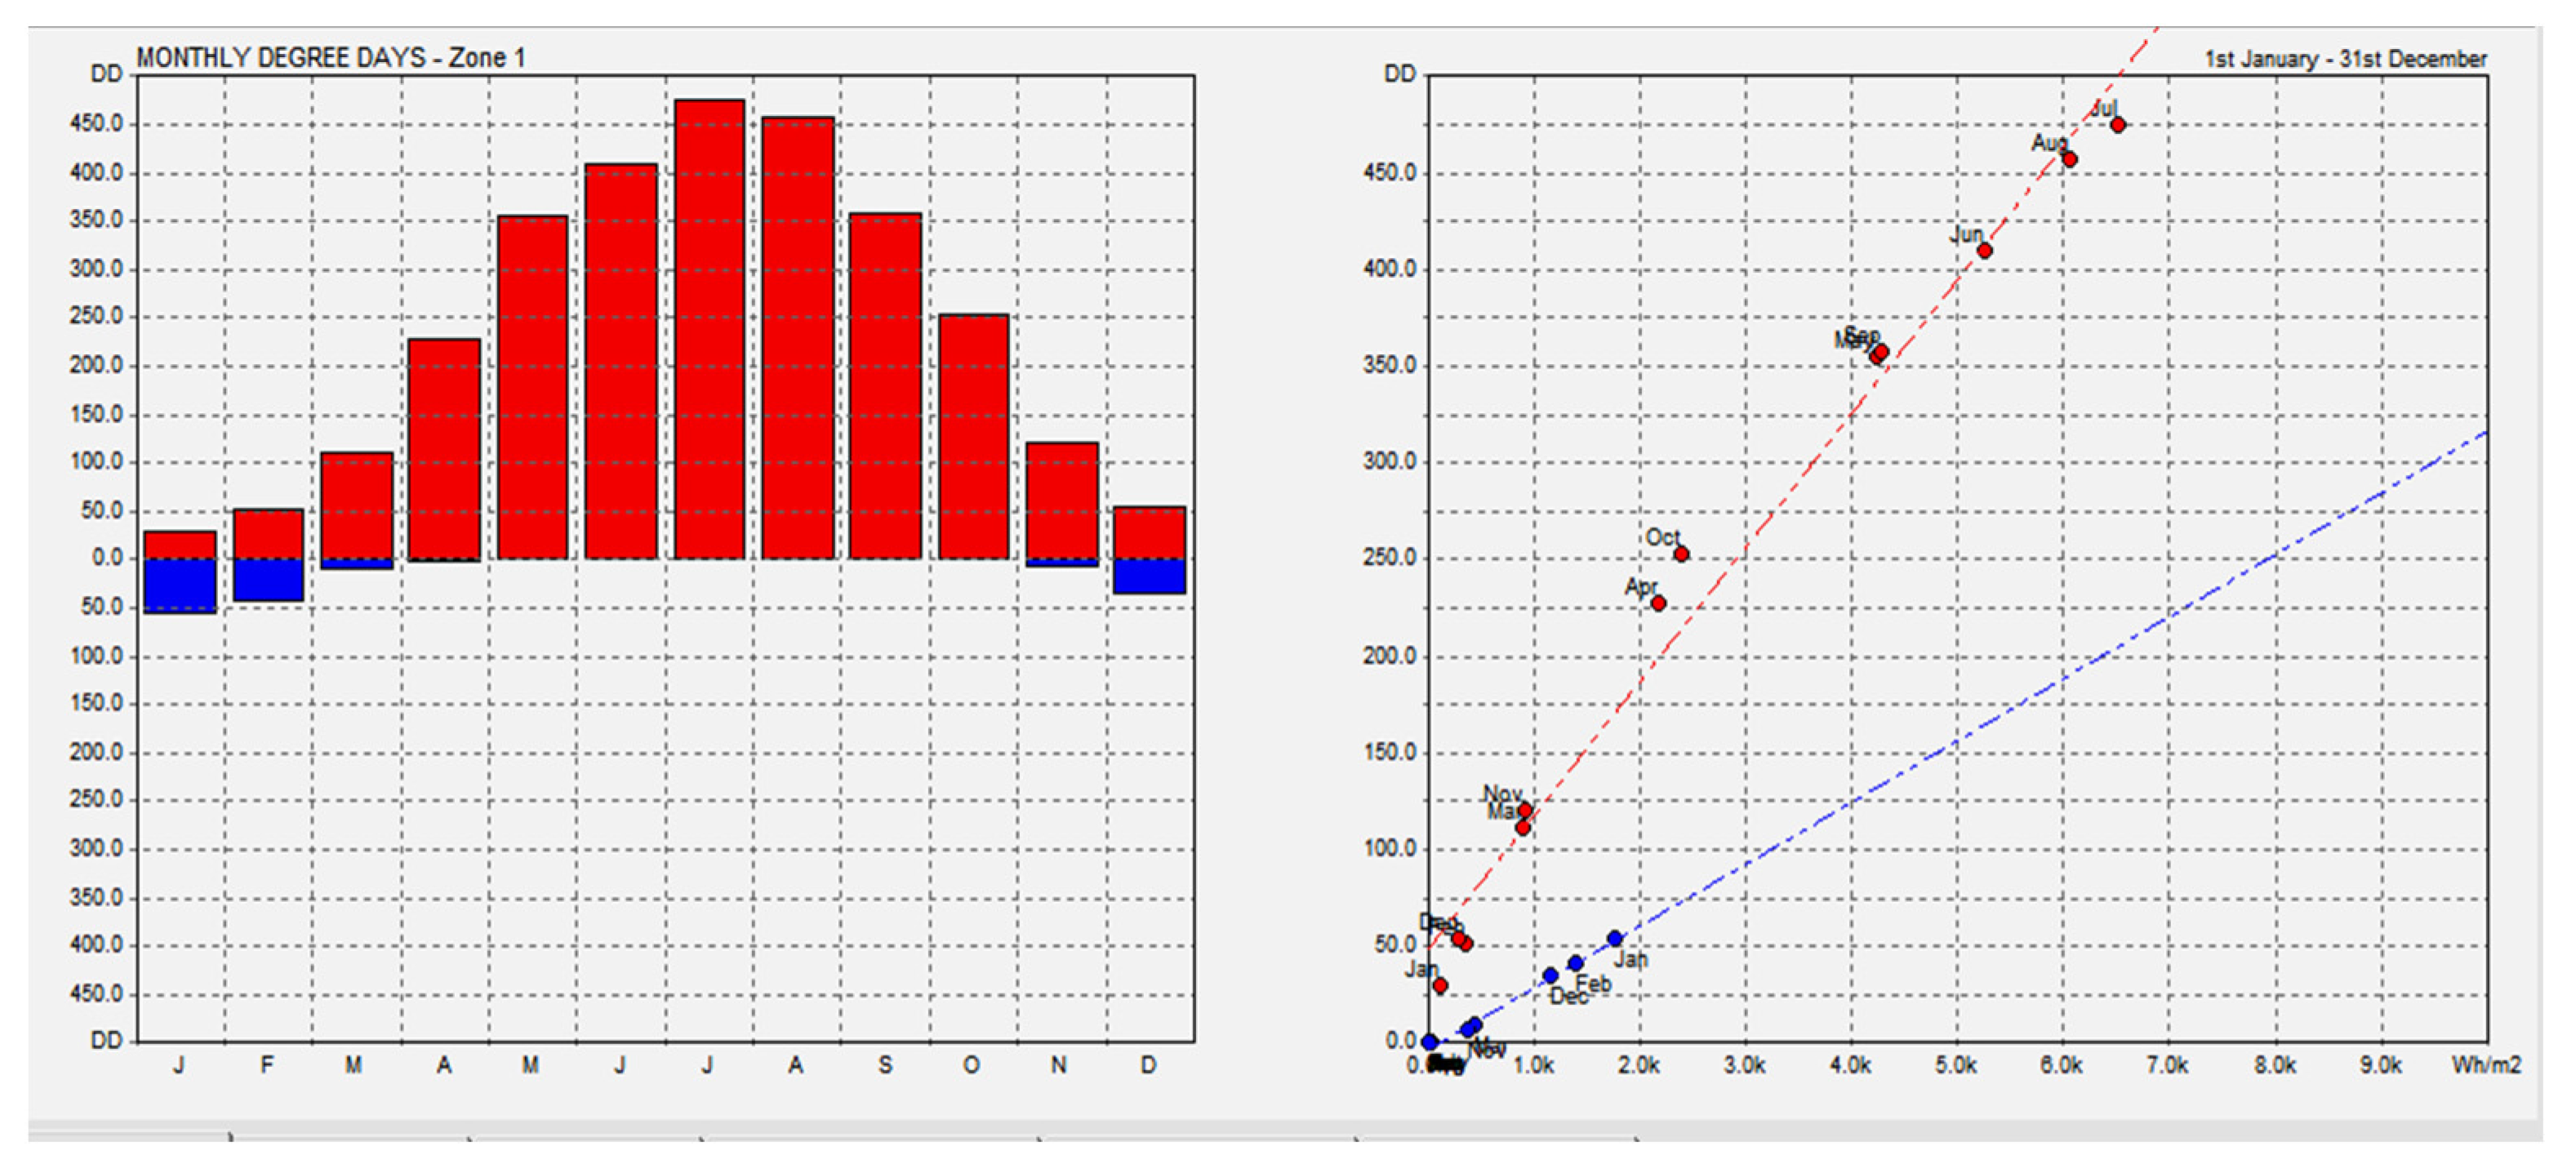
All analyses utilized the identical exterior constructions as the planned baseline building. In order to prevent overheating, the inside ceilings of certain examined scenarios were finished with bare concrete rather than ceiling tiles. Figure 8 depicts the construction U values employed in the study. It was essential, when conducting the building study, to employ profiles and acquire features that were representative of how the house would be utilized in practice. The activity database served as the basis for assumptions on internal gain. The profiles utilized in the study were derived from the findings of the investigation. Figure 4.51 depicts the Occupancy profiles utilized for analysis. For the energy analysis, a minimum quantity of fresh air for 1 to 10 individuals is required. This was replaced with natural ventilation rates determined by the volume air flow analysis similler for the overheating study [57].

4.4.1. Cooling by Natural Ventilation in Alazhari City

The process of supplying natural air in this design to occupied spaces to offset heat and contaminants produced by people or brought into the space by outside air is known as ventilation. This design had the indoor air quality is controlled by removal of the outdoor element temperature. In these low energy houses, the energy requirement associated with cooling can be maximized through the implementation of natural ventilation. The researcher had introduced the natural ventilation in the urban planning and the architeure design for the purpose during the summer to keep air movement make suitable with a comfortable degree with a human body [58].

4.4.2. Design and Control of Ventilation in a House

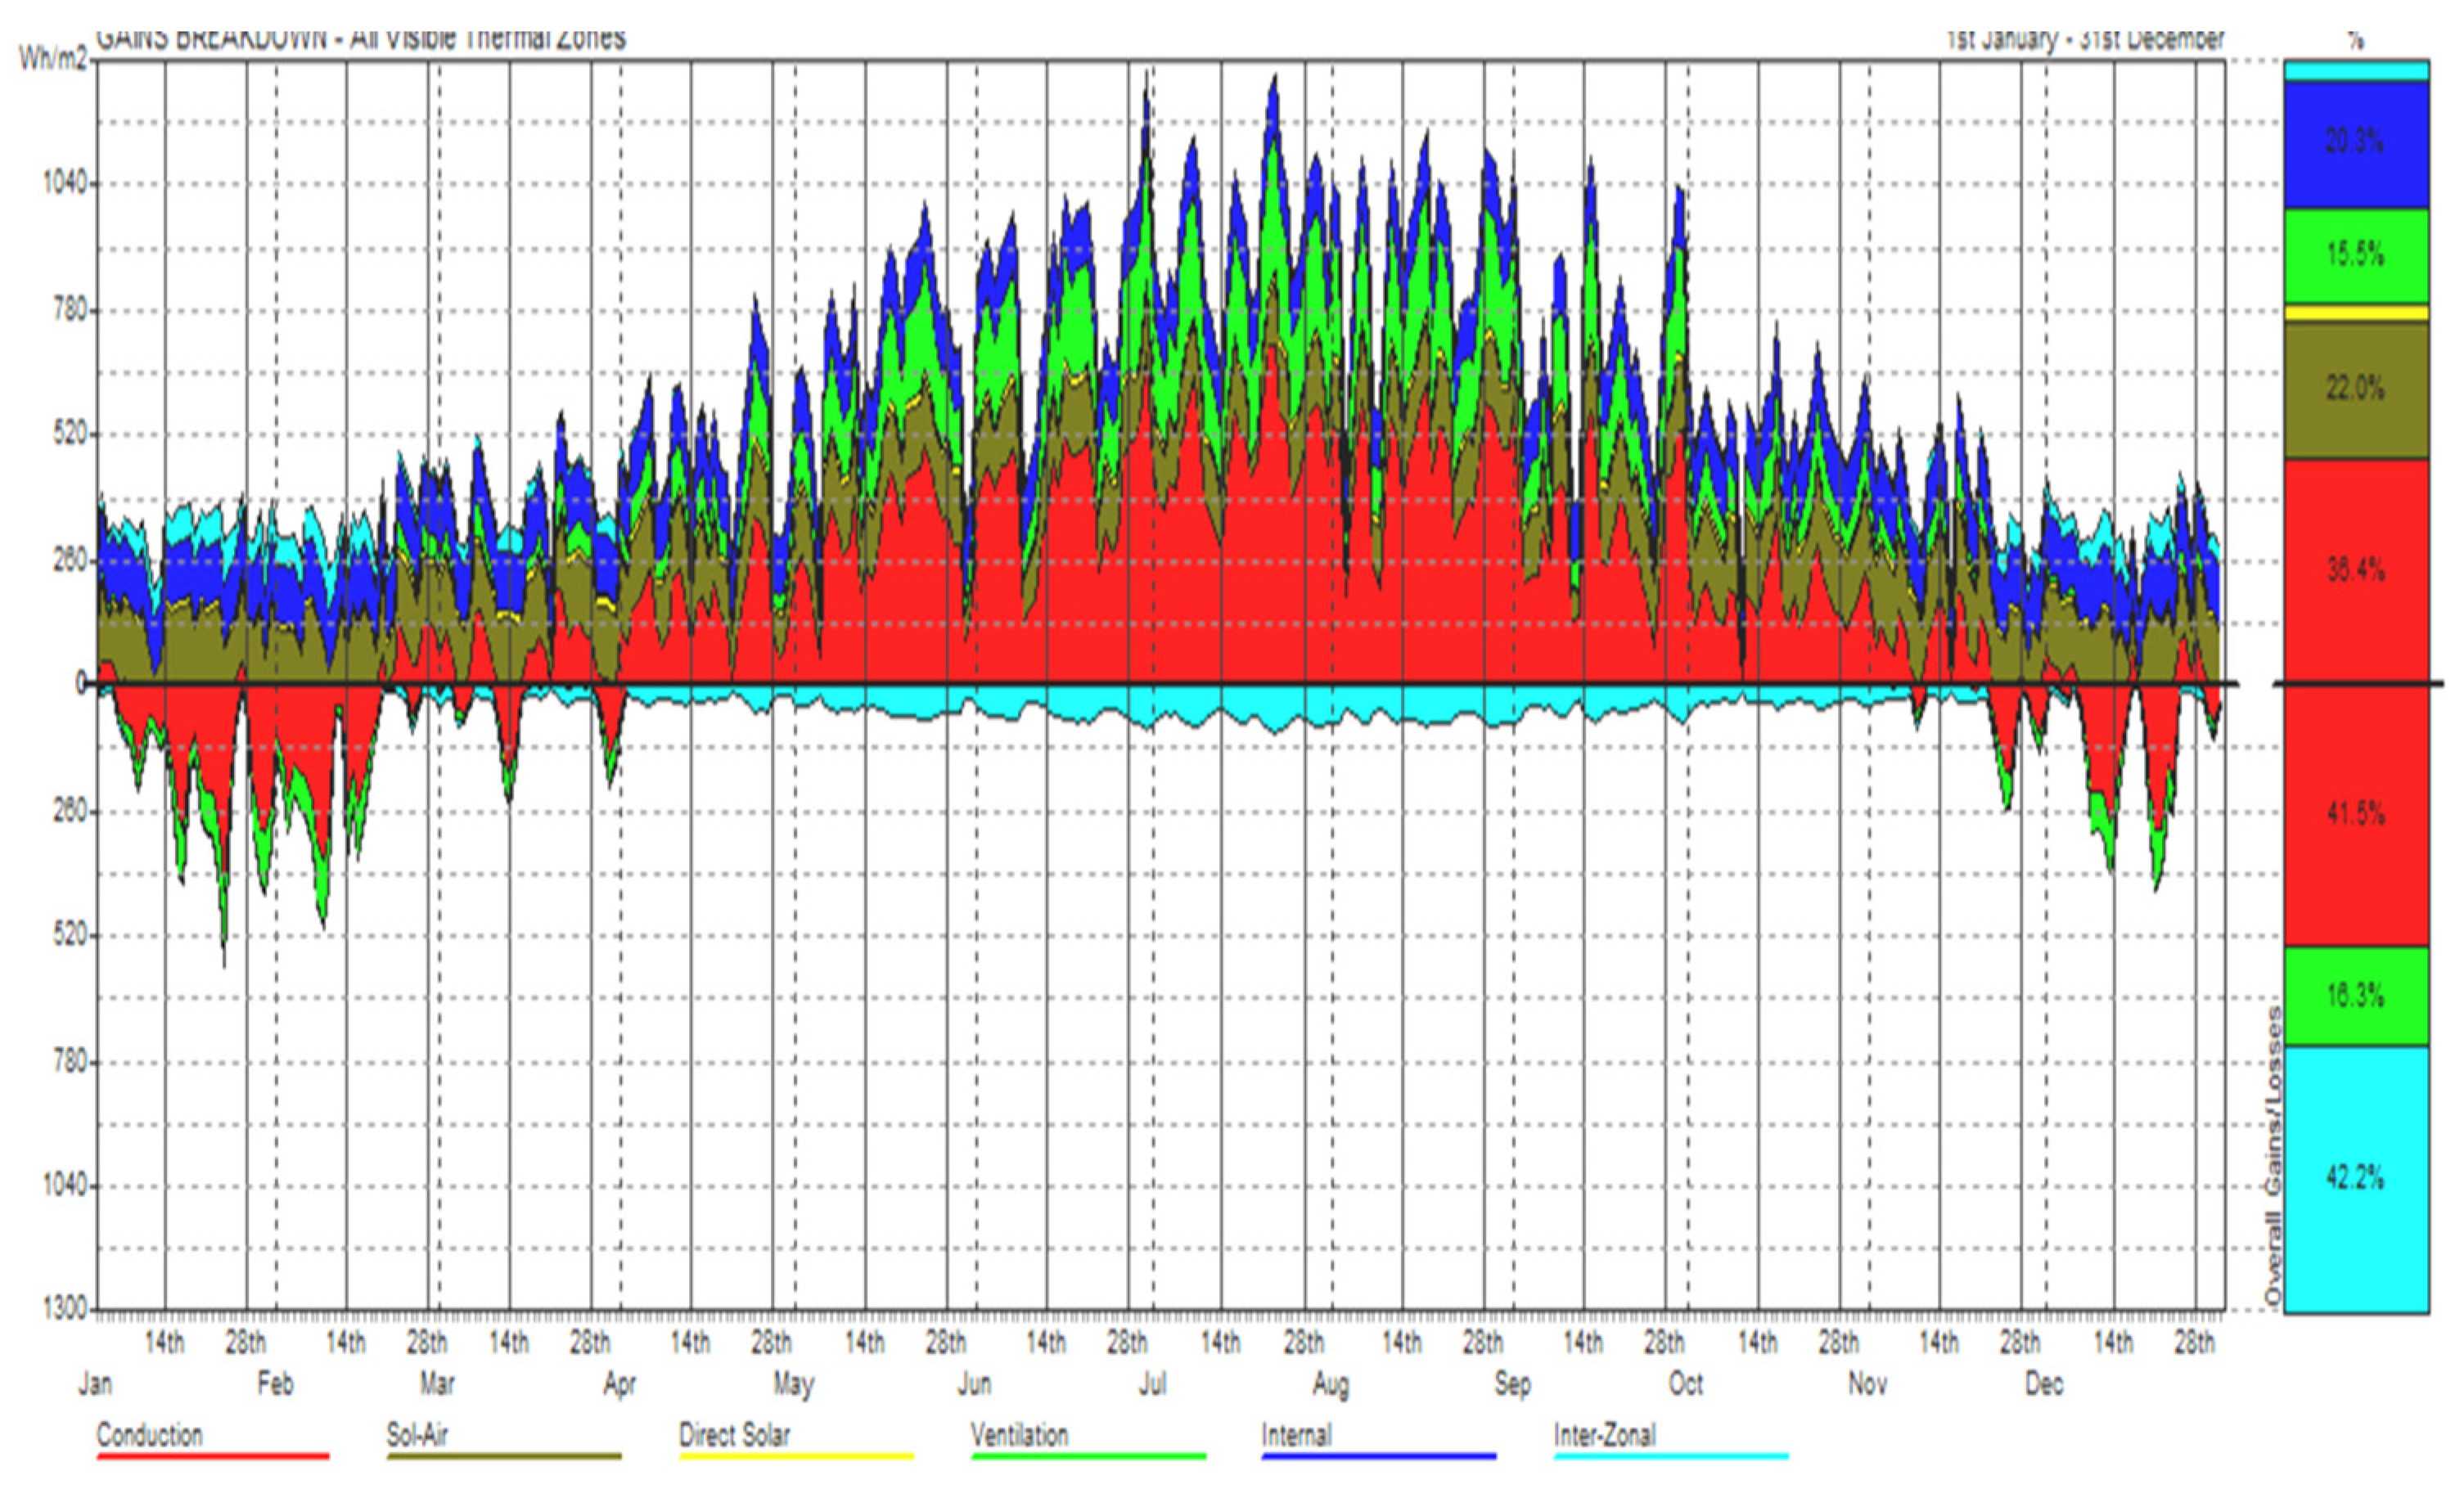
The design was basically considered with the architectural layout of a house at the location of the study used IESV software. The consecrations of the design of natural ventilation were gotten efficient enough to natural air. The air flow path or window positions were taken into consideration in the. In this research, to control of the temperature of the room using the natural ventilation, it depends on the most wind in Khartoum. It was the North and South wind in the winter and West and South in a whole year, the most thermal wind as the result was 41% it was in July and August as shown in Figure 9. It deals with [59] results with different locations depending on the most wind. That obtain the natural ventilation system distributes constantly pure and fresh air.

4.5. Boundary Conditions

4.5.1. Atmospheric Boundary Conditions

All the simulation is the set under isothermal condition of 28 air temperature at Khartoum state condition. The environment coarseness for the surrounding building and landscape are model using [60], air flow around buildings. Air movement in buildings has been investigated using the IESV model. IESV’s accuracy and efficiency in investigating airflow in and around buildings hinge on two factors: the incoming wind to the building site and the size of the computational area. To get accurate results in a reasonable amount of time using IESV’s computational efficiency, the next two parts will cover how to simulate the oncoming wind and how to determine the computational domain.

4.5.2. Simulated Wind

Differing sets of data on the incoming wind are provided by the on-site measurements and wind, each of which has a 1/4 power law represent-wind profile and the same turbulent intensity. However, [61] wind pressure variations across buildings and indoor airflow distributions are rarely consistent. They said the differences could be attributed to the ebb and flow of the wind. The speed and direction of the natural wind were highly unpredictable, making its generation in a wind tunnel difficult [62,63,64]. Natural wind, on the other hand, changes the direction and velocity over time, while in a traditional wind tunnel, the wind direction is fixed. The histogram for the simulated natural wind’s direction shows some evidence of a normal distribution at high wind speeds (4.46 m/s), consistent with the simulation’s results. But the histogram tends to be uniform at low wind speeds (1.17 m/s). Wind speed and direction at the Khartoum site are displayed in Figure 4.55. [65,66] conclusions that are similar.
IESV took a variety of ways to simulating the incoming flow, as natural wind and the macro flow from a wind tunnel have distinct properties. In the chase through the wind tunnel, IESV manipulated the wind’s direction. Referring to Figure 10 for the simple situation of a single location. Depending on the strength of the simulated wind, IESV generated a normal or uniform distribution [28,39]. [67] found that the average change in wind direction over a 15-minute period is roughly 80 degrees. Time in the simulations was around 10–20 minutes, and the wind direction varied by 80 degrees, as shown in Figure 4.56. On-site measurements showed that the wind speed was anything from 0.5 to 4 m/s just over the roof of the building. Below the roof, the wind speed would be significantly less. This analysis therefore assumed that there was no discernible pattern to the varying incoming wind directions. According to the weather reports from Khartoum, [68] which is the nearest to the development site windrose diagrams were plotted the annual of the year is blowing from the north direction with an average wind speed of 3m/s as shown in Figure 11.

4.5.3. Selection of the Best, Worst and the Average Unit

Based on the external CFD simulation of the entire development, the best, worst and the average unit are identified and chosen for internal wind velocity ranges from 0.02 to 3m/s. The spaces between the apartment blocks signify an important role in providing negative pressure; which are required for the improvement of cross ventilation similar with (Hawa, L. & Mat, S. 2012). That means the effect will enhance cross natural ventilation if there is sufficient if window opening on both front and back of the apartment. Refer to Figure 4.56 below.

4.6. Analysis of the Best, Worst and Average Case Situation

4.6.1. Best Case Situation

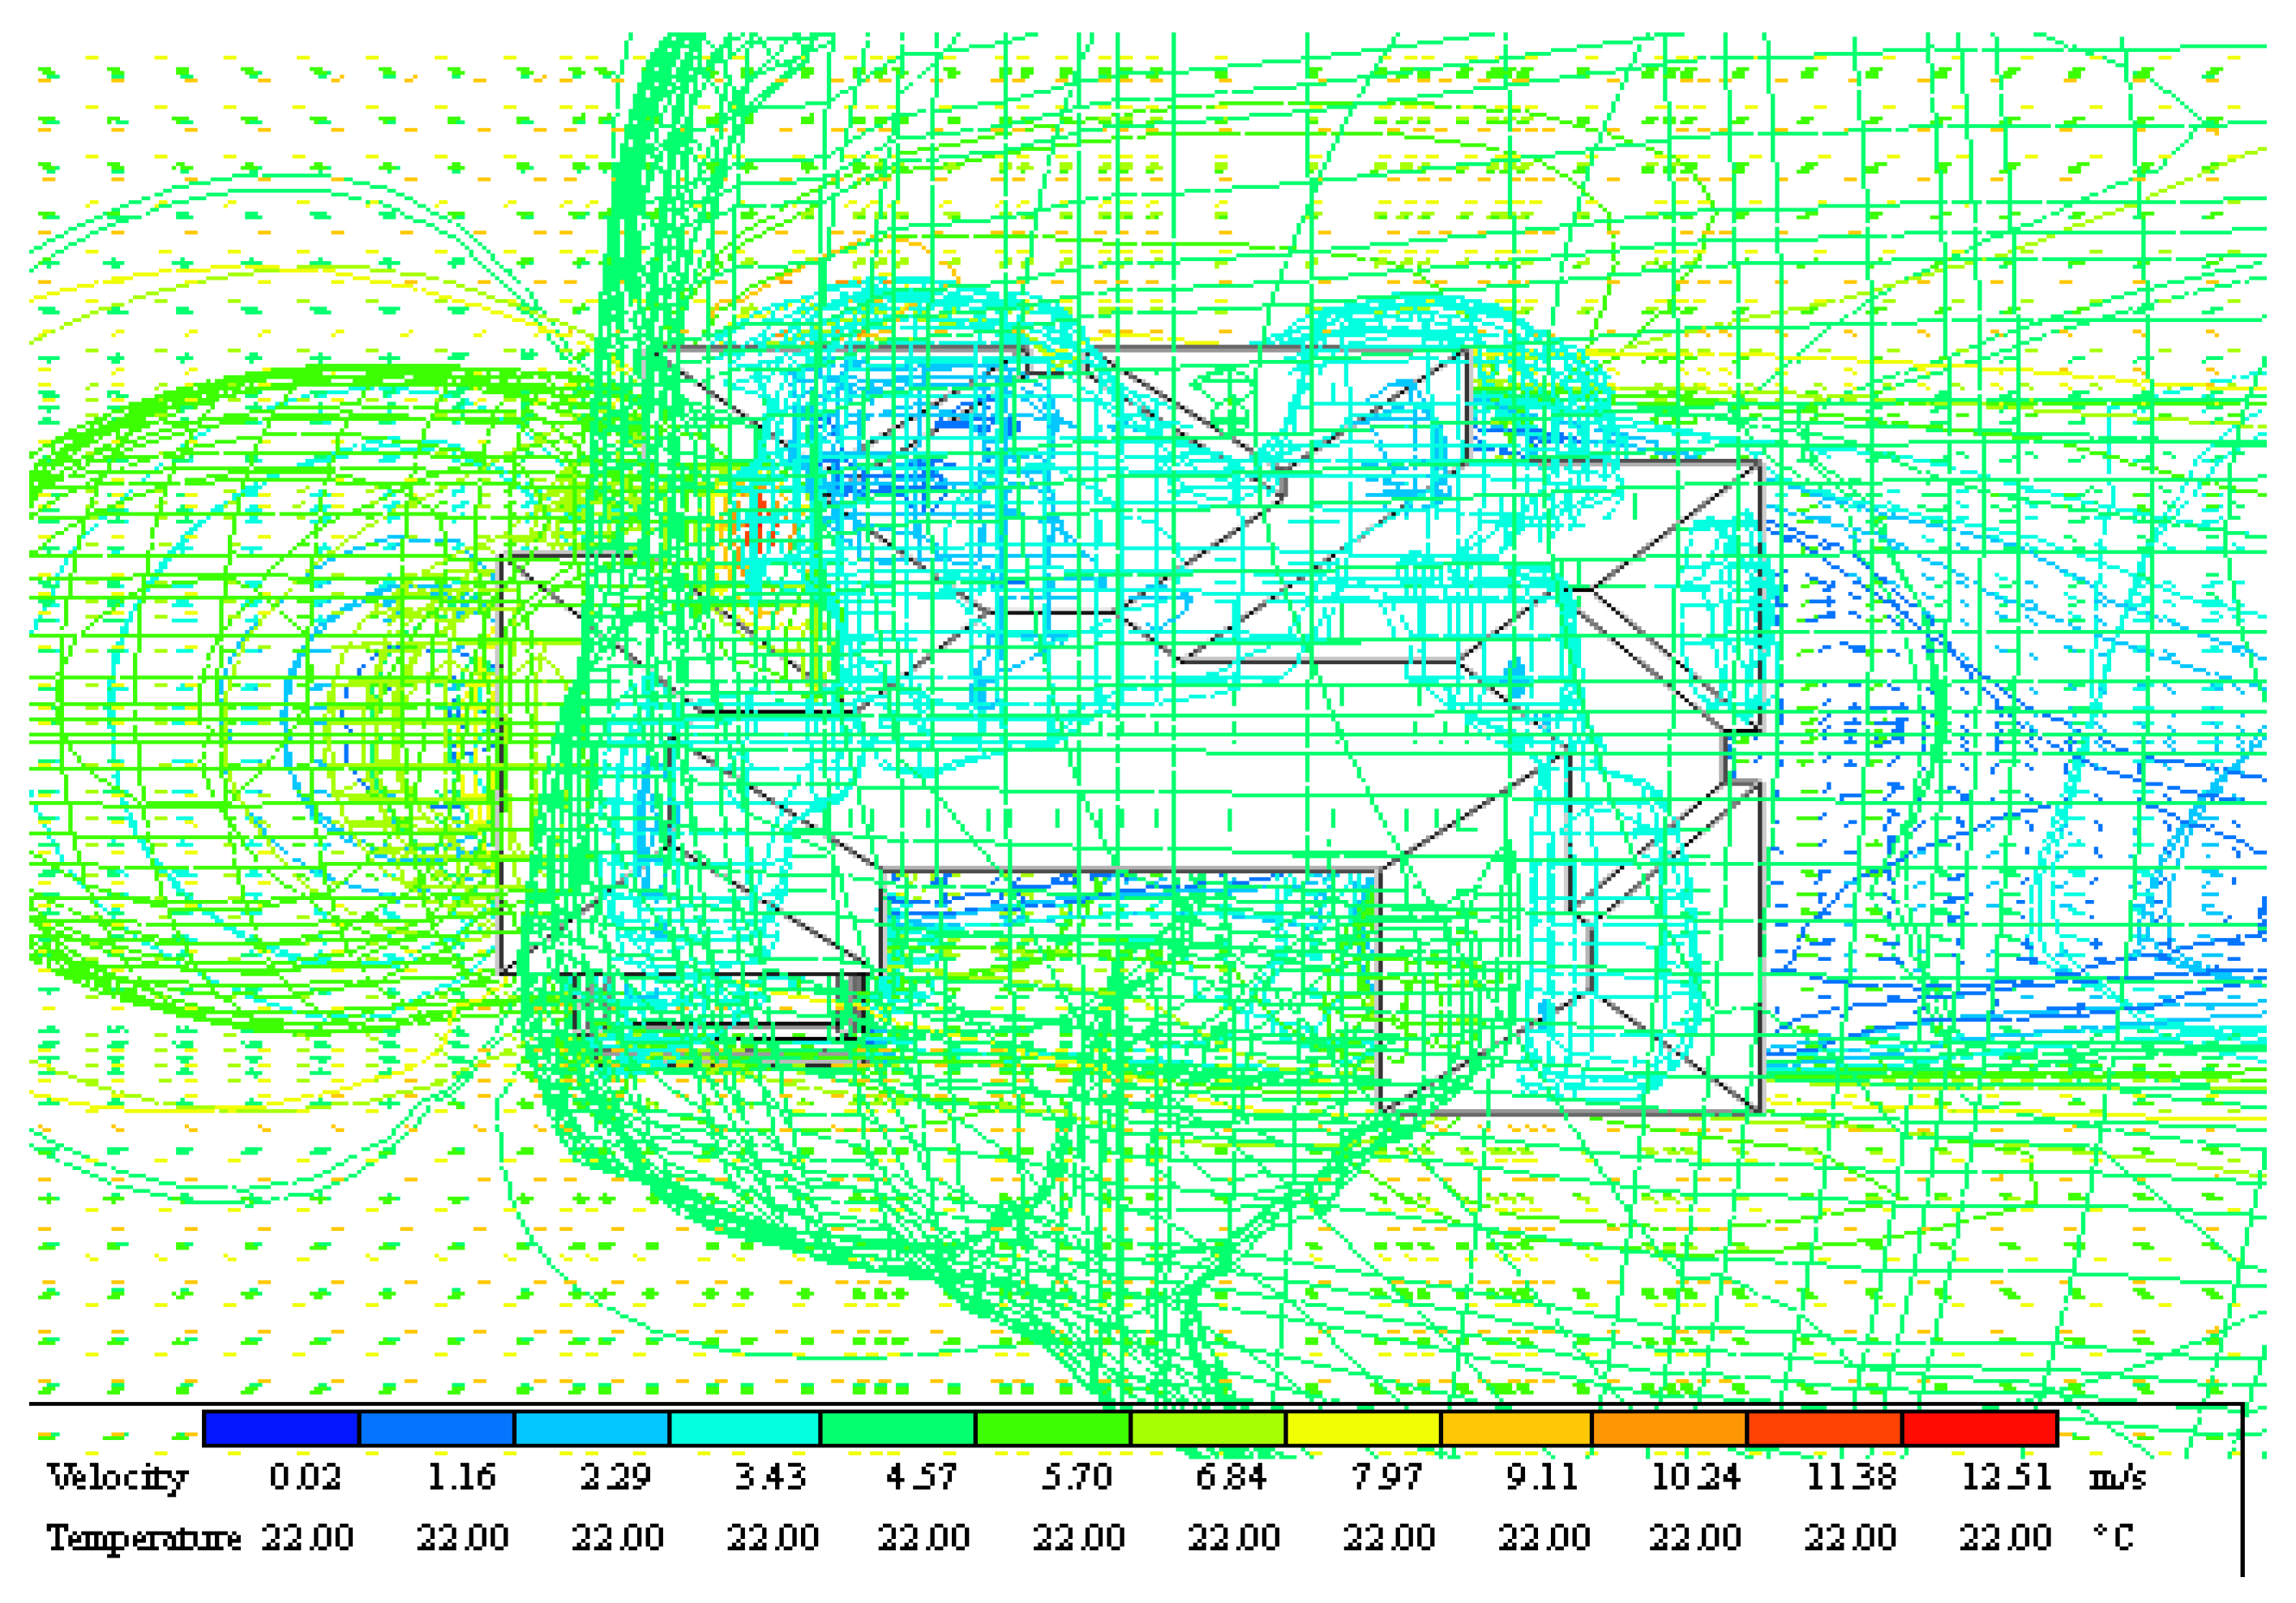
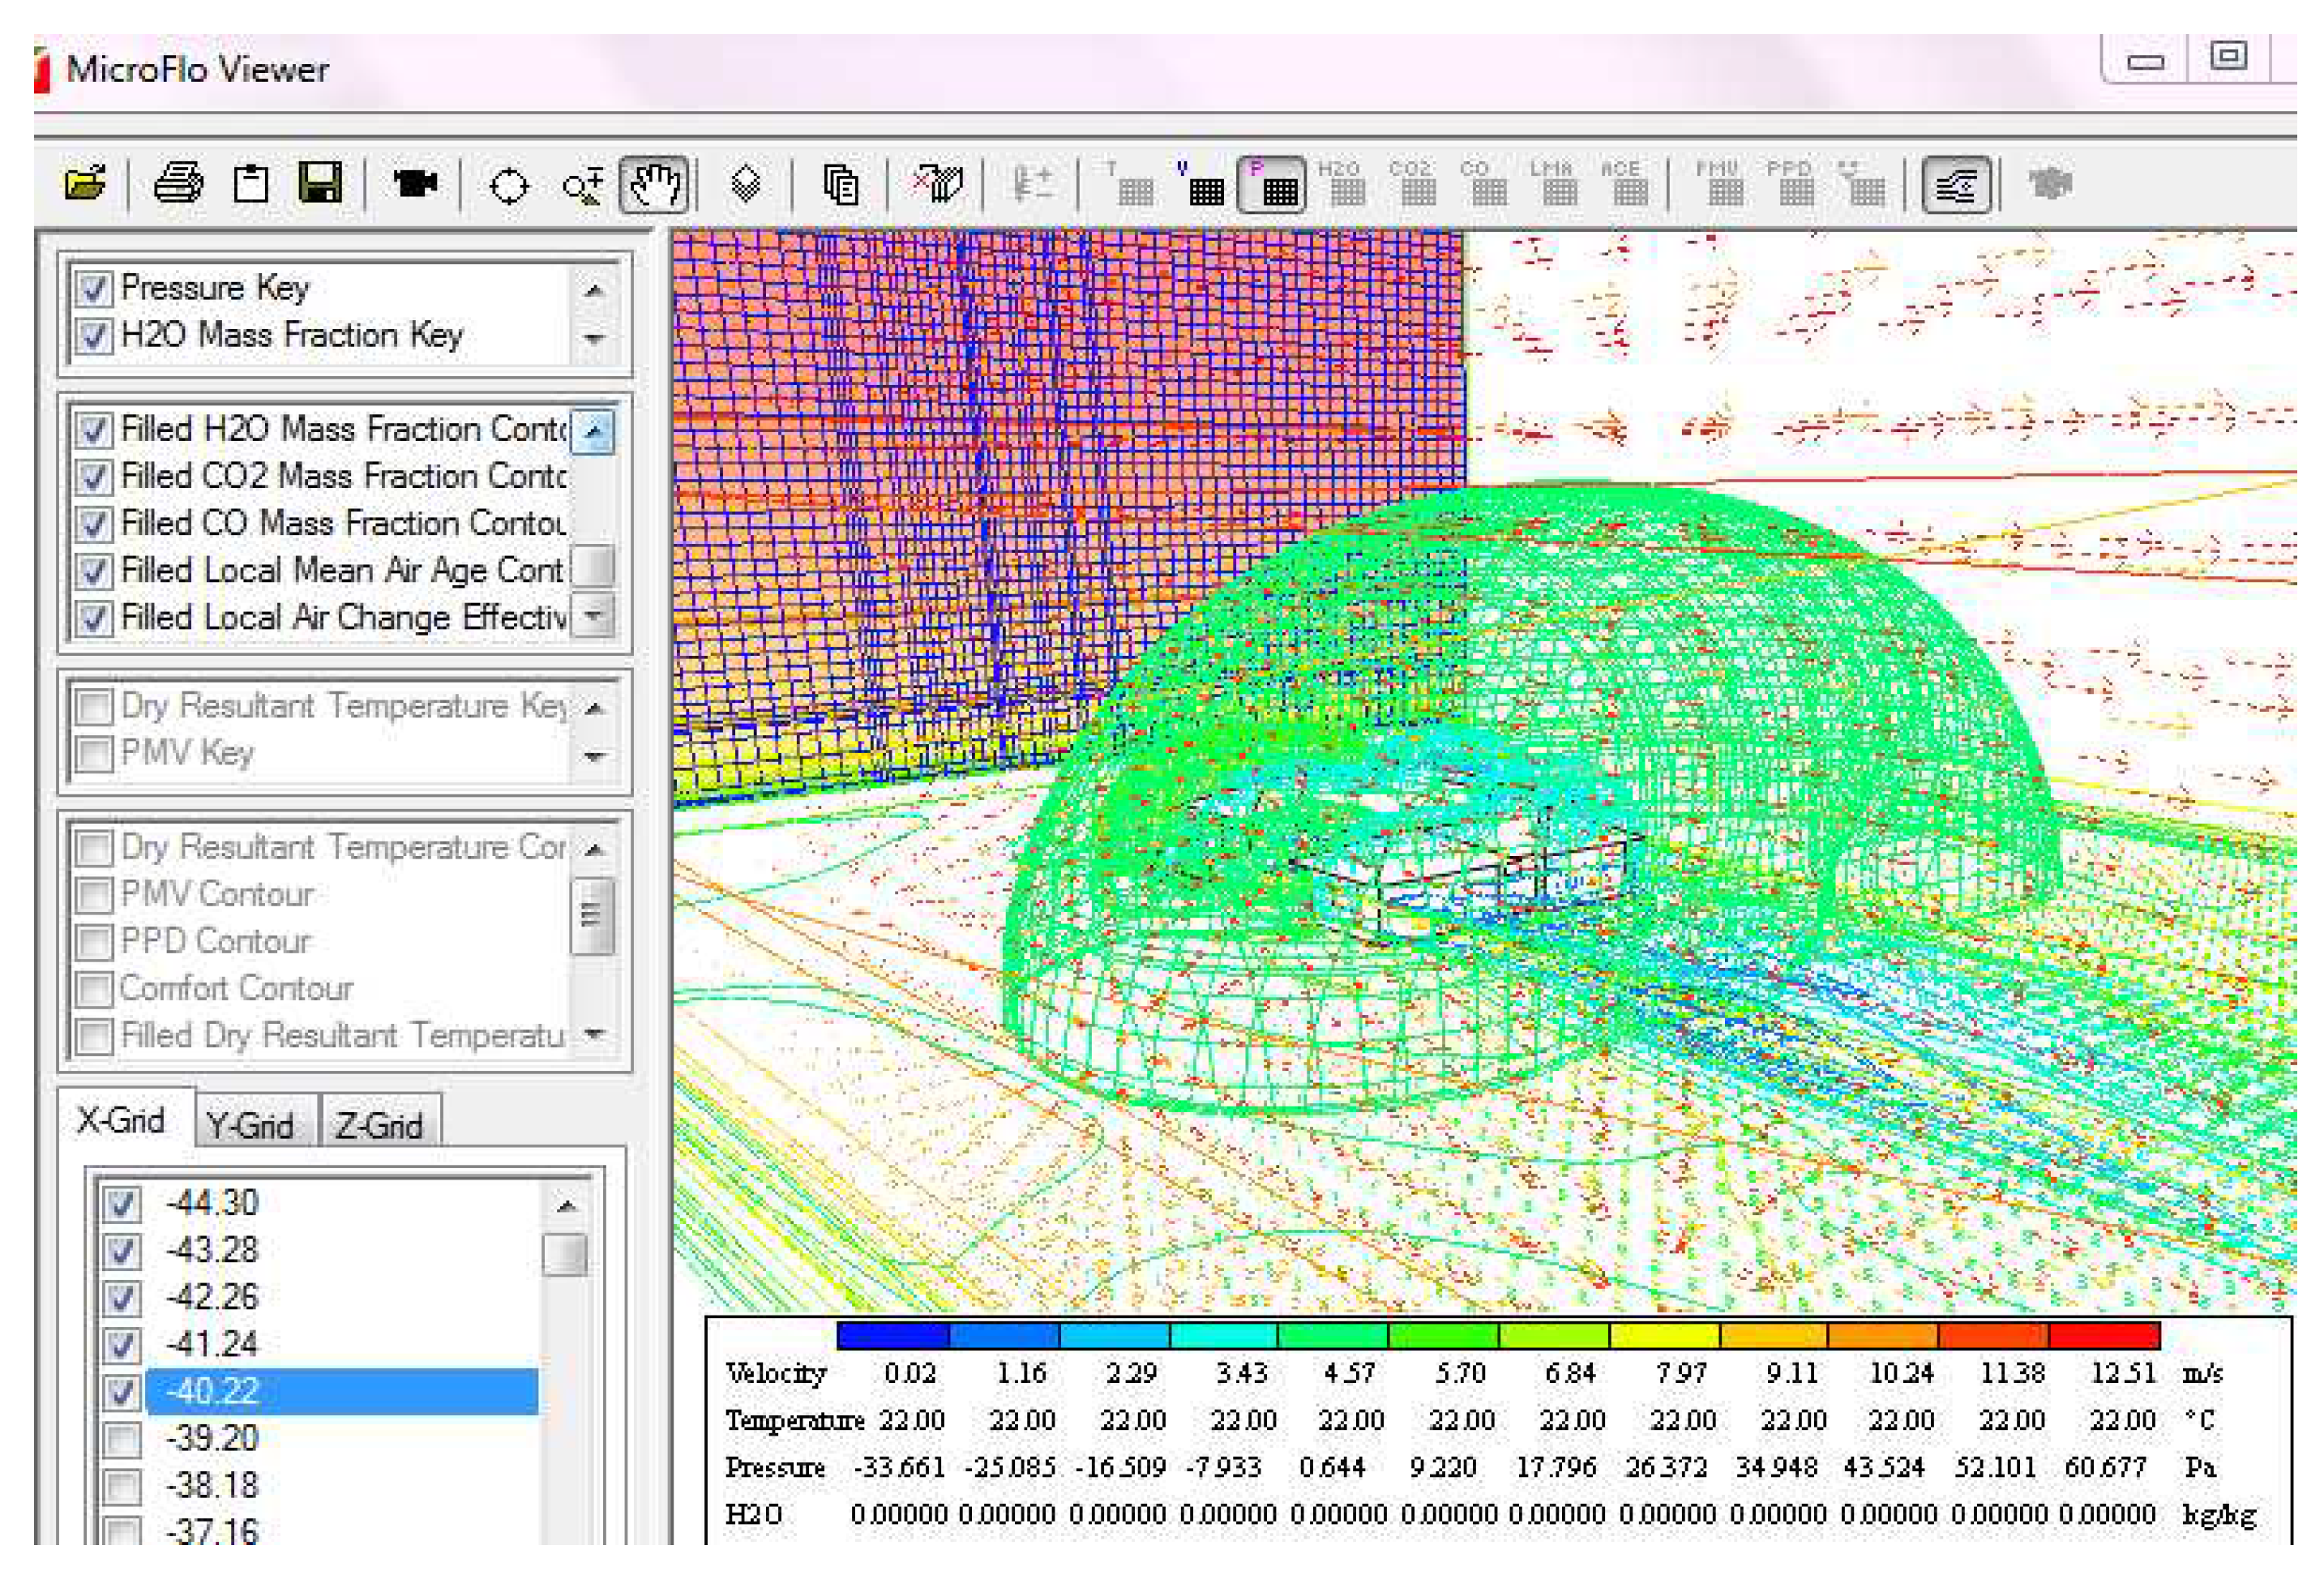
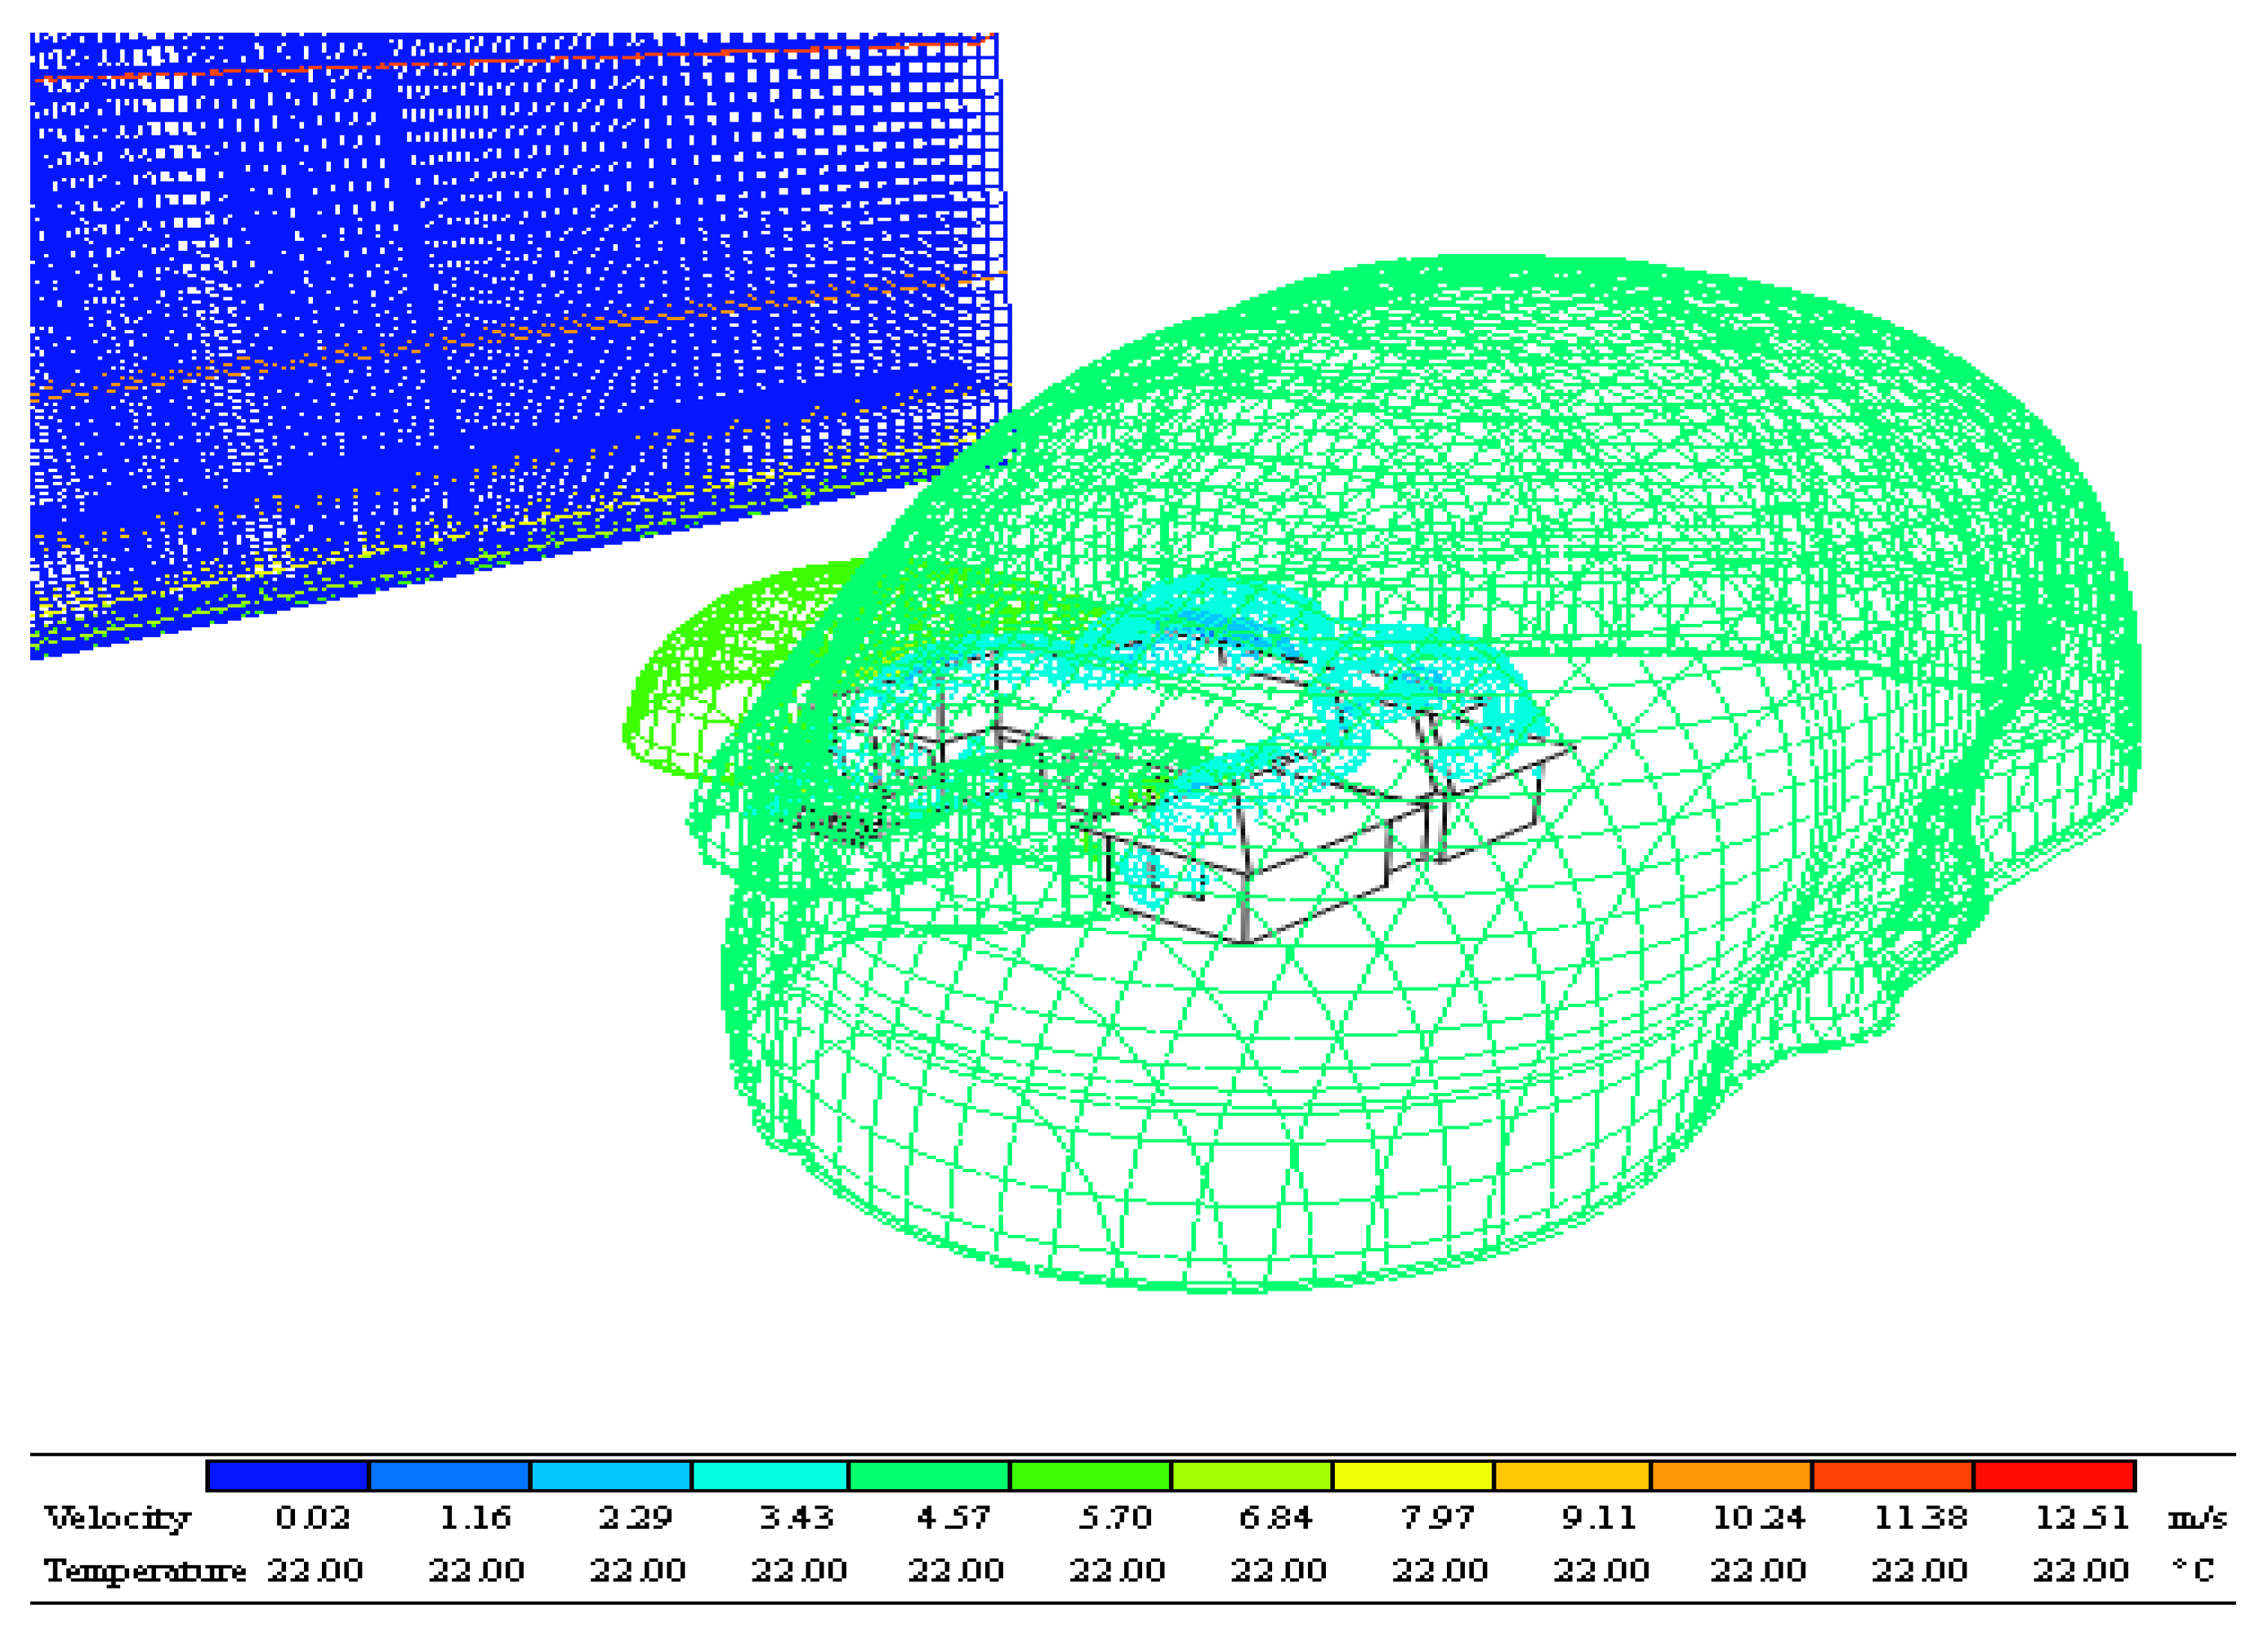
Based on the CFD simulation, the one storey. Has the bet internal air velocity of approximately 0.7m/s. The wind velocity starts to slow down towards the rear of the apartment spaces. Approximately 95% of the internal areas have average air velocity between 0.43 m/s to 0.9 m/s. Refer to Figure 11. Internal Air flow pattern single floor house plan at Alazhari City; showing the internal air velocity of 0.7m/s near the window opening positions this detailed in Figure 12. with the wind directions in the details and pressure of the air as worst case situation, Figure 4.58 with velocity and temperature of the air with average 22o as a best case situation similar with [69,70].

4.6.2. Worst Case Situation

Based on the CFD simulation, eastern / western direction one story building in Alazhari has the worst air velocity. 80% of the internal space of the eastern / western direction one story building has air flow anywhere between 0.05 m/s and 0.01 m/s / s accepted near the window opening where the air flow is approximately 0.1 m / s. This is appropriate to no window openings are located at the both West and East directions of the house, the window openings are only located at the North and South of the unit it is observed that window openings which are located at the East and West on the unit are inadequate to improve more air flow speed for cross ventilation for the eastern /western direction one story building as details in Figure 13. as [71] found.

4.6.3. CFD Simulation Situation

Detailed of result clear in Figure as the result of a simulation that mean The house or the type has better ventilation rate in the evaluation of the one storey building. That obtained the one story building type has more windows opening at the north of the house it was Approximately 60 % of the internal areas have average internal air velocity 0.49m/s. Also [72] resulted in the typical case situation in Malaysia, the opposite unit of the 3 storeys or Semi-Detached apartment type able to obtain average of internal air flow velocities of 0.46 m/s around the window openings.

4.8. Saving Energy

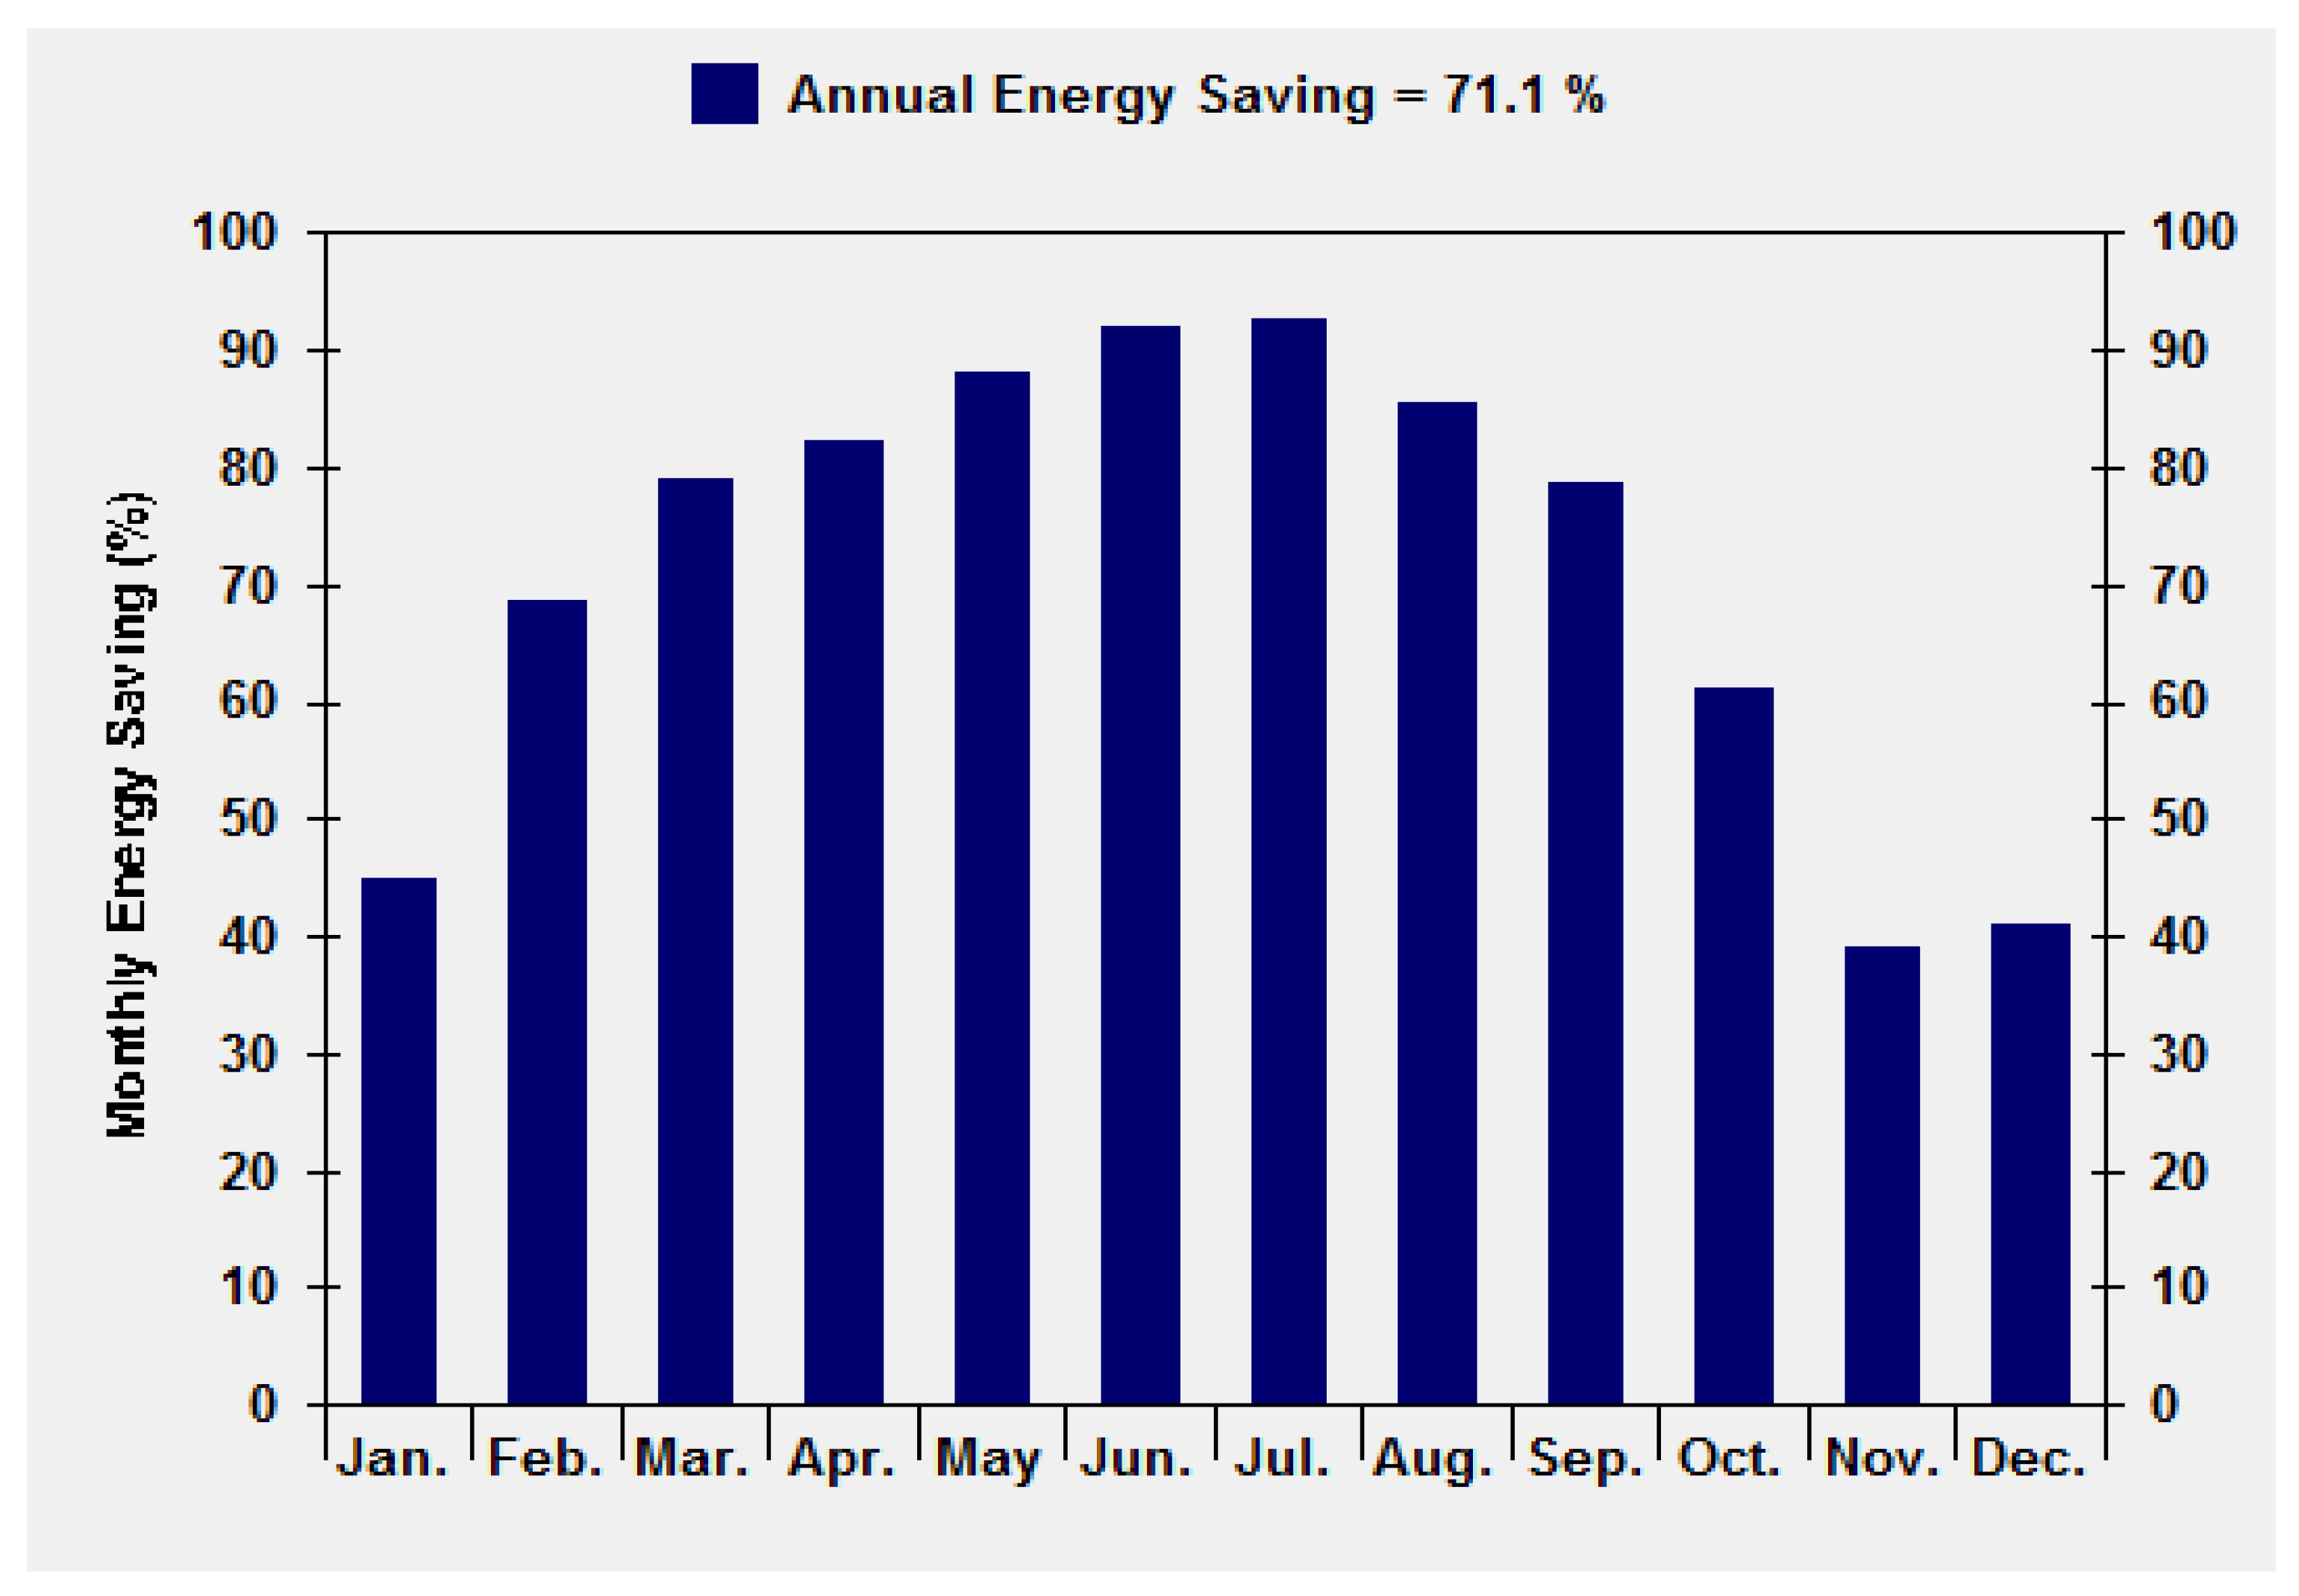
This design that includes modifications to improve the indoor environment may increase the building’s energy consumption. Figure 14 illustrates the proportional breakdown of the basic building’s energy consumption. Simulation application IES Virtual Environment (VE) is utilized to run a series of sensitivity analyses on a collection of design parameters that have the potential to affect the building’s performance. The results revealed that the yearly energy savings as the primary objective were 71.1%. It is relatively simple to determine the optimal solution for a single analysis criterion based on the previous results. It is essential that a design fulfills an acceptable quality across all analyzed criteria. This selection can be aided by an integrated performance view that compares the characteristics of each design choice. Out of the scenario provides the finest overall performance, as indicated by the fact that obtaining the location indicates its performance. This additional energy is smaller than the amount of heat energy that can be recovered in a naturally ventilated environment [71].

4.9. Validation

Analysis of the impacts of physical diffusion on cross-ventilation flow and validation of CFD models of coupled outdoor wind flow and internal airflow for four distinct configurations of simple, isolated, single-house have been the primary focuses of this research. The following limitations on the scope of the research are mentioned:
-
The effects of physical diffusion are subjected to the same restrictions. Buildings in suburban and urban regions, which are dominated by high-velocity wind jets through channels between buildings, are predicted to feel at least the same, if not more severe, effects [73,74]. Natural ventilation was the only method considered for this analysis. To better understand how physical diffusion influences one-sided ventilation flow, more research is needed. Considering these limitations, it’s worth noting that: - To our knowledge, this is the first study to examine the impacts of physical diffusion on cross-ventilation flow in the Khartoum area in such depth. There is no agreement in the scientific literature on how to obtain turbulent kinetic energy profiles from the recorded mean wind speed and turbulence intensity profiles, therefore understanding the impacts of physical diffusion is essential. [4,75] propose a parameter value of a = 1, which was found to be optimal in the current investigation. Computational grids for suburban and urban configurations are generally very unstructured grids, on which convergence can only be attained by introducing adequate diffusion, utilizing the schemes as a result of these types of configurations [74,76].
-
The size of the upstream standing current is reduced, and the jet’s spread inside the buildings is widened, as shown by the velocity-vector fields. Inside the structure, the effects were most obvious along the central axis between the apertures, while outside the building, they were more muted.

5. Conclusions

The second part was the designing of urban planning and appropriate solutions in implementing the low energy design of the residential buildings and the, natural ventilation and loads of energy simulations at an Alazhari City in Khartoum - Sudan. The main finding of the planning idea was concerned. The tilt roof’s orientation and slope will determine the result. The modules and roof can face south with a 32 degree tilt if the location is at a latitude of 32 degrees north. In this design, the basic material was used in construction was of solid brick. The following type was designed in this article implemented for energy saving towards to low energy houses. The final design of Energy Consumption Using Natural Ventilation in Dwelling Design, CFD Simulation In Hot Dry Climate technology was put into effect with sustainable design, sustainable architecture, and a low energy building natural ventilation used for cooling to decrease the house energy cost or consumption using high levels of installation in the site location was a basic contribution of this research. The government of Sudan needs to review their green policies and programmes regularly in order to maintain a sustainable market environment for rapid adoption of BIPV technology. The main result of calculate natural ventilation in this design was dependent through the window. During the construction, the building’s orientation was maximized to the northern and southern direction. Also, important part of the design, towards to energy consumption the natural ventilation was suitable for cooling the house to go in green architecture and reduce the electrical load. For cooling, the natural ventilation in this design was used to get the indoor temperature at a comfortable level during the summer, while also saving energy with Sudan being a hot region. The average is through the analysis of Autodesk IEVS software daylight. This study was the first research in Khartoum for designing a clean and energy consumption house using BIPV towards to sustainable architecture. The findings of this design determined a grid planning is a suitable for block 29 at Alazhari City, based on all the requirements of planning spatially on the location and general in Khartoum state. A low energy house was designed with two types of urban design focusing on architecture design and urban planning in the location with a low energy house constructed spatially with natural ventilation. There are several options for low-energy, single-family homes that can be comfortable and sustainable if the right design and structure are included during the building process.

References

  1. Shirzadi, M.; Mirzaei, P.A.; Naghashzadegan, M. Development of an adaptive discharge coefficient to improve the accuracy of cross-ventilation airflow calculation in building energy simulation tools. J. Affect. Disord. 2018, 127, 277–290. [Google Scholar] [CrossRef]
  2. Elhassan, Z.A.M.; Zain, M.F.M.; Sopian, K.; Abass, A.A. Optimum Arrangement of Photovoltaic Systems in Housing at Khartoum: Application of Renewable Energy in Urban Design. Urban Stud. Res. 2011, 2011, 1–6. [Google Scholar] [CrossRef]
  3. Aldawoud, A. Windows design for maximum cross-ventilation in buildings. Adv. Build. Energy Res. 2016, 11, 67–86. [Google Scholar] [CrossRef]
  4. Ray, S.D.; Gong, N.-W.; Glicksman, L.R.; Paradiso, J.A. Experimental characterization of full-scale naturally ventilated atrium and validation of CFD simulations. Energy Build. 2014, 69, 285–291. [Google Scholar] [CrossRef]
  5. Elhassan, Z.A.M.; Zain, M.F.M.; Sopian, K.; Awadalla, A. Output Energy of Photovoltaic Module Directed at Optimum Slope Angle in Kuala Lumpur, Malaysia. Res. J. Appl. Sci. 2011, 6, 104–109. [Google Scholar] [CrossRef]
  6. Zeinab, A.M.E.; Muhammad, F.M.Z.; Kamaruzzaman, S. Building integrated photovoltaics (BIPV) module in urban housing in Khartoum: Concept and design considerations. Int. J. Phys. Sci. 2012, 7, 487–494. [Google Scholar]
  7. Ohba, M.; Lun, I. Overview of natural cross-ventilation studies and the latest simulation design tools used in building ventilation-related research. Adv. Build. Energy Res. 2010, 4, 127–166. [Google Scholar] [CrossRef]
  8. Hong, S.-W.; Exadaktylos, V.; Lee, I.-B.; Amon, T.; Youssef, A.; Norton, T.; Berckmans, D. Validation of an open source CFD code to simulate natural ventilation for agricultural buildings. Comput. Electron. Agric. 2017, 138, 80–91. [Google Scholar] [CrossRef]
  9. Mochida, A.; Lun, I.Y. Prediction of wind environment and thermal comfort at pedestrian level in urban area. J. Wind. Eng. Ind. Aerodyn. 2008, 96, 1498–1527. [Google Scholar] [CrossRef]
  10. Ai, Z.; Mak, C. CFD simulation of flow in a long street canyon under a perpendicular wind direction: Evaluation of three computational settings. J. Affect. Disord. 2017, 114, 293–306. [Google Scholar] [CrossRef]
  11. Cuce, E.; Sher, F.; Sadiq, H.; Cuce, P.M.; Guclu, T.; Besir, A.B. Sustainable ventilation strategies in buildings: CFD research. Sustain. Energy Technol. Assessments 2019, 36, 100540. [Google Scholar] [CrossRef]
  12. Li, Y.; Li, X. Natural ventilation potential of high-rise residential buildings in northern China using coupling thermal and airflow simulations. Build. Simul. 2014, 8, 51–64. [Google Scholar] [CrossRef]
  13. Wesseling, P. Principles of Computational Fluid Dynamics; Springer Science and Business Media LLC: Dordrecht, GX, Netherlands, 2001; ISBN:.
  14. Guo, W.; Liu, X.; Yuan, X. Study on Natural Ventilation Design Optimization Based on CFD Simulation for Green Buildings. Procedia Eng. 2015, 121, 573–581. [Google Scholar] [CrossRef]
  15. Zhong, W.; Yu, A.; Zhou, G.; Xie, J.; Zhang, H. CFD simulation of dense particulate reaction system: Approaches, recent advances and applications. Chem. Eng. Sci. 2015, 140, 16–43. [Google Scholar] [CrossRef]
  16. Zhai, Z. Application of Computational Fluid Dynamics in Building Design: Aspects and Trends. Indoor Built Environ. 2006, 15, 305–313. [Google Scholar] [CrossRef]
  17. Tan, A.Y.K.; Wong, N.H. Natural ventilation performance of classroom with solar chimney system. Energy Build. 2012, 53, 19–27. [Google Scholar] [CrossRef]
  18. Hafazalla, A.A. The urban development planning of Greater Khartoum: coping with urban dynamics. in Urban Housing in Sudan, Proceedings of the Architects’ Third Scientific Conference, Khartoum, Sudan, 28th-30th April. 2008.
  19. ELKHEIR, O. The urban environment of Khartoum. in Proceedings of National Civic Forum (NCF), Rio+ 20 Civil Society Preparatory Process. 2012.
  20. Hamid, G.M. and I.Z. Bahreldin, Khartoum 2030 Towards An Environmentally-Sensitive Vision for the Development of Greater Khartoum, Sudan. L’architettura delle città-The Journal of the Scientific Society Ludovico Quaroni, 2014. 2(3-4-5).
  21. Yakoub, W.A., et al. Urbanism as it should be: An overview of Environmental Urban Movements and Initiatives towards Sustainability. in Proceedings of the Second International Conference (Tenth Conference of Sustainable Environmental Development), Sharm El Sheikh, Egypt. 2019.
  22. Mohammed, H.E. Evaluation of Sudan’s Experience with Foreign Urban Planning Consultancy: The Case of Greater Khartoum. Sudan Geogr. J. 2020, 2. [Google Scholar]
  23. Hassan, S.S., et al., Urban planning of Khartoum. History and modernity. Part I. History. Wiadomości Konserwatorskie, 2017. [CrossRef]
  24. Elnazir, R.; Feng, X.-Z. Urban planning: A tool for urban poverty alleviation in Sudan. Chin. Geogr. Sci. 2004, 14, 110–116. [Google Scholar] [CrossRef]
  25. Davies, H. and M.A. Sin, The heart of the Sudan. The future of Sudan’s Capital Region: A study in Development and Change, 1991: p. 1-10.
  26. Hamid, G.M.; Bahreldin, I.Z. Environmental sustainability in Greater Khartoum between natural assets and human interventions. Int. J. Sustain. Build. Technol. Urban Dev. 2013, 4, 100–110. [Google Scholar] [CrossRef]
  27. Doxiadis, C.A. Architecture, planning and Ekistics. Ekistics 1959, 7, 293–298. [Google Scholar]
  28. Abdallah, S.; Fan, I.S. Framework for e-government assessment in developing countries: case study from Sudan. Electron. Gov. Int. J. 2012, 9, 158. [Google Scholar] [CrossRef]
  29. Doxiadis, C., Khartoum: A long term Programme and a Master Plan for the Development of the Town. 1959, Athens.
  30. Elhassan, Z.A.M.; Zain, M.F.M.; Sopian, K.; Abass, A.A. Design and performance of photovoltaic power system as a renewable energy source for residential in Khartoum. International Journal of Physical Sciences 2012, 7, 4036–4042. [Google Scholar]
  31. Saeed, A.M. and D.E. Ali, Sustainability of the livelihood strategies of the internally displaced residents of Soba El Aradi settlement in Khartoum State, Sudan. 2013.
  32. Givoni, B. Comfort, climate analysis and building design guidelines. Energy Build. 1992, 18, 11–23. [Google Scholar] [CrossRef]
  33. Ahmad, A.M.; Sultan, A.E.-I.M.; Abdalla, M.M.; Malik, A.O.; Said, M.A.; Mukhtar, E.-S.M.; El-Mufti, N.M. Low-cost housing projects in Khartoum with special focus on housing patterns. Habitat Int. 2002, 26, 139–157. [Google Scholar] [CrossRef]
  34. Ahmad, A.M. The neighbourhoods of Khartoum: Reflections on their functions, forms and future. Habitat Int. 1992, 16, 27–45. [Google Scholar] [CrossRef]
  35. Lindgren, I.; Mukherjee, D. On the connectivity criteria in the open-shell coupled-cluster theory for general model spaces. Phys. Rep. 1987, 151, 93–127. [Google Scholar] [CrossRef]
  36. Lo, S.; Yiu, C.; Lo, A. An analysis of attributes affecting urban open space design and their environmental implications. Manag. Environ. Qual. Int. J. 2003, 14, 604–614. [Google Scholar] [CrossRef]
  37. Koohsari, M.J.; Mavoa, S.; Villanueva, K.; Sugiyama, T.; Badland, H.; Kaczynski, A.T.; Owen, N.; Giles-Corti, B. Public open space, physical activity, urban design and public health: Concepts, methods and research agenda. Heal. Place 2015, 33, 75–82. [Google Scholar] [CrossRef]
  38. Beck, K. and M. Fowler, Planning extreme programming. 2001: Addison-Wesley Professional.
  39. Pollock, M., et al., Building simulation as an assisting tool in designing an energy efficient building: A case study. Building Simulation, Glasgow, 2009.
  40. Ahmed, T.; Kumar, P.; Mottet, L. Natural ventilation in warm climates: The challenges of thermal comfort, heatwave resilience and indoor air quality. Renew. Sustain. Energy Rev. 2020, 138, 110669. [Google Scholar] [CrossRef]
  41. Oleiwi, M.Q.; Mohamed, M.F.; Sulaiman, M.K.A.M.; Che-Ani, A.I.; Raman, S.N. Thermal Environment Accuracy Investigation of Integrated Environmental Solutions-Virtual Environment (IES-VE) Software for Double-Story House Simulation in Malaysia. J. Eng. Appl. Sci. 2019, 14, 3659–3665. [Google Scholar] [CrossRef]
  42. Roetzel, A. Occupant behaviour simulation for cellular offices in early design stages—Architectural and modelling considerations. Build. Simul. 2014, 8, 211–224. [Google Scholar] [CrossRef]
  43. Ramponi, R.; Blocken, B. CFD simulation of cross-ventilation flow for different isolated building configurations: Validation with wind tunnel measurements and analysis of physical and numerical diffusion effects. J. Wind. Eng. Ind. Aerodyn. 2012, 104-106, 408–418. [Google Scholar] [CrossRef]
  44. Zhai, Z. (.; El Mankibi, M.; Zoubir, A. Review of Natural Ventilation Models. Energy Procedia 2015, 78, 2700–2705. [Google Scholar] [CrossRef]
  45. Frampton, K., A Genealogy of modern Architecture. Comparative Critical Analysis of Built Form, 2015.
  46. Fuller, R. and P. Taylor. Better definitions, better buildings? in AUBEA 2010: Construction Management (s): Proceedings of the 35th Australasian Universities Building Education Association annual conference. 2010. AUBEA.
  47. Zahnd, A.; Kimber, H.M. Benefits from a renewable energy village electrification system. Renew. Energy 2009, 34, 362–368. [Google Scholar] [CrossRef]
  48. Nilsson, A.M.; Roos, A. Evaluation of optical and thermal properties of coatings for energy efficient windows. Thin Solid Films 2009, 517, 3173–3177. [Google Scholar] [CrossRef]
  49. Doukas, H.; Papadopoulou, A.; Savvakis, N.; Tsoutsos, T.; Psarras, J. Assessing energy sustainability of rural communities using Principal Component Analysis. Renew. Sustain. Energy Rev. 2012, 16, 1949–1957. [Google Scholar] [CrossRef]
  50. Chung, L.P.; Ossen, D.R. Comparison of integrated environmental solutions< virtual environment> and autodesk ecotect simulation software accuracy with field measurement for temperature. Sustain. Built Environ. I 2012, 85. [Google Scholar]
  51. Amir, A. , et al., Assessment of indoor thermal condition of a low-cost single story detached house: A case study in Malaysia. Alam Cipta 2019, 12, 80–88. [Google Scholar]
  52. Matsui, T.; Santanello, J.; Shi, J.J.; Tao, W.-K.; Wu, D.; Peters-Lidard, C.; Kemp, E.; Chin, M.; Starr, D.; Sekiguchi, M.; et al. Introducing multisensor satellite radiance-based evaluation for regional Earth System modeling. J. Geophys. Res. Atmos. 2014, 119, 8450–8475. [Google Scholar] [CrossRef]
  53. Cheng, Y.; Lin, Z.; Fong, A.M. Effects of temperature and supply airflow rate on thermal comfort in a stratum-ventilated room. J. Affect. Disord. 2015, 92, 269–277. [Google Scholar] [CrossRef]
  54. Karatasou, S., M. Santamouris, and V. Geros, Urban building climatology, in Environmental Design of Urban Buildings. 2013, Routledge. p. 119-143.
  55. Givoni, B. Climatic aspects of urban design in tropical regions. Atmospheric Environ. Part B. Urban Atmosphere 1992, 26, 397–406. [Google Scholar] [CrossRef]
  56. Raja, I.A.; Nicol, J.F.; McCartney, K.J.; Humphreys, M.A. Thermal comfort: use of controls in naturally ventilated buildings. Energy Build. 2001, 33, 235–244. [Google Scholar] [CrossRef]
  57. Tantasavasdi, C.; Srebric, J.; Chen, Q. Natural ventilation design for houses in Thailand. Energy Build. 2001, 33, 815–824. [Google Scholar] [CrossRef]
  58. INVALID CITATION !!!
  59. Jomehzadeh, F.; Nejat, P.; Calautit, J.K.; Yusof, M.B.M.; Zaki, S.A.; Hughes, B.R.; Yazid, M.N.A.W.M. A review on windcatcher for passive cooling and natural ventilation in buildings, Part 1: Indoor air quality and thermal comfort assessment. Renew. Sustain. Energy Rev. 2017, 70, 736–756. [Google Scholar] [CrossRef]
  60. Aynur, T.N.; Hwang, Y.; Radermacher, R. Simulation evaluation of the ventilation effect on the performance of a VRV system in cooling mode—Part II, simulation evaluation. HVAC&R Res. 2008, 14, 783–795. [Google Scholar]
  61. Martilli, A. Current research and future challenges in urban mesoscale modelling. Int. J. Climatol. A J. R. Meteorol. Soc. 2007, 27, 1909–1918. [Google Scholar] [CrossRef]
  62. Negrao, C.O.R., Conflation of computational fluid dynamics and building thermal simulation. 1995: University of Strathclyde Glasgow.
  63. Zhai, Z., et al. Strategies for coupling energy simulation and computational fluid dynamics programs. 2001.
  64. Beausoleil-Morrison, I., et al., Further developments in the conflation of CFD and building simulation. 2001.
  65. Jiang, G.; Yoshie, R. Large-eddy simulation of flow and pollutant dispersion in a 3D urban street model located in an unstable boundary layer. J. Affect. Disord. 2018, 142, 47–57. [Google Scholar] [CrossRef]
  66. Xie, Z.-T.; Castro, I.P. Large-eddy simulation for flow and dispersion in urban streets. Atmospheric Environ. 2009, 43, 2174–2185. [Google Scholar] [CrossRef]
  67. Wang, H.; Liu, Y.; Cheng, W.Y.Y.; Zhao, T.; Xu, M.; Liu, Y.; Shen, S.; Calhoun, K.M.; Fierro, A.O. Improving Lightning and Precipitation Prediction of Severe Convection Using Lightning Data Assimilation With NCAR WRF-RTFDDA. J. Geophys. Res. Atmos. 2017, 122. [Google Scholar] [CrossRef]
  68. Osman, M.M.; Sevinc, H. Adaptation of climate-responsive building design strategies and resilience to climate change in the hot/arid region of Khartoum, Sudan. Sustain. Cities Soc. 2019, 47, 101429. [Google Scholar] [CrossRef]
  69. Barbason, M.; Reiter, S. Coupling building energy simulation and computational fluid dynamics: Application to a two-storey house in a temperate climate. J. Affect. Disord. 2014, 75, 30–39. [Google Scholar] [CrossRef]
  70. Wang, L.; Robertson, A.; Kim, J.; Jang, H.; Shen, Z.-R.; Koop, A.; Bunnik, T.; Yu, K. Validation of CFD simulations of the moored DeepCwind offshore wind semisubmersible in irregular waves. Ocean Eng. 2022, 260. [Google Scholar] [CrossRef]
  71. Murga, A.; Long, Z.; Yoo, S.-J.; Sumiyoshi, E.; Ito, K. Decreasing inhaled contaminant dose of a factory worker through a hybrid Emergency Ventilation System: Performance evaluation in worst-case scenario. Energy Built Environ. 2020, 1, 319–326. [Google Scholar] [CrossRef]
  72. Fang, Y.; Fan, J.; Kenneally, B.; Mooney, M. Air flow behavior and gas dispersion in the recirculation ventilation system of a twin-tunnel construction. Tunn. Undergr. Space Technol. 2016, 58, 30–39. [Google Scholar] [CrossRef]
  73. Gousseau, P.; Blocken, B.; Stathopoulos, T.; van Heijst, G.J.F. CFD simulation of near-field pollutant dispersion on a high-resolution grid: A case study by LES and RANS for a building group in downtown Montreal. Atmos. Environ. 2011, 45, 428–438. [Google Scholar] [CrossRef]
  74. Blocken, B.; Carmeliet, J. Validation of CFD simulations of wind-driven rain on a low-rise building facade. J. Affect. Disord. 2007, 42, 2530–2548. [Google Scholar] [CrossRef]
  75. Gousseau, P.; Blocken, B.; Stathopoulos, T.; van Heijst, G.J.F. CFD simulation of near-field pollutant dispersion on a high-resolution grid: A case study by LES and RANS for a building group in downtown Montreal. Atmos. Environ. 2011, 45, 428–438. [Google Scholar] [CrossRef]
  76. Defraeye, T.; Blocken, B.; Koninckx, E.; Hespel, P.; Carmeliet, J. Aerodynamic study of different cyclist positions: CFD analysis and full-scale wind-tunnel tests. J. Biomech. 2010, 43, 1262–1268. [Google Scholar] [CrossRef]
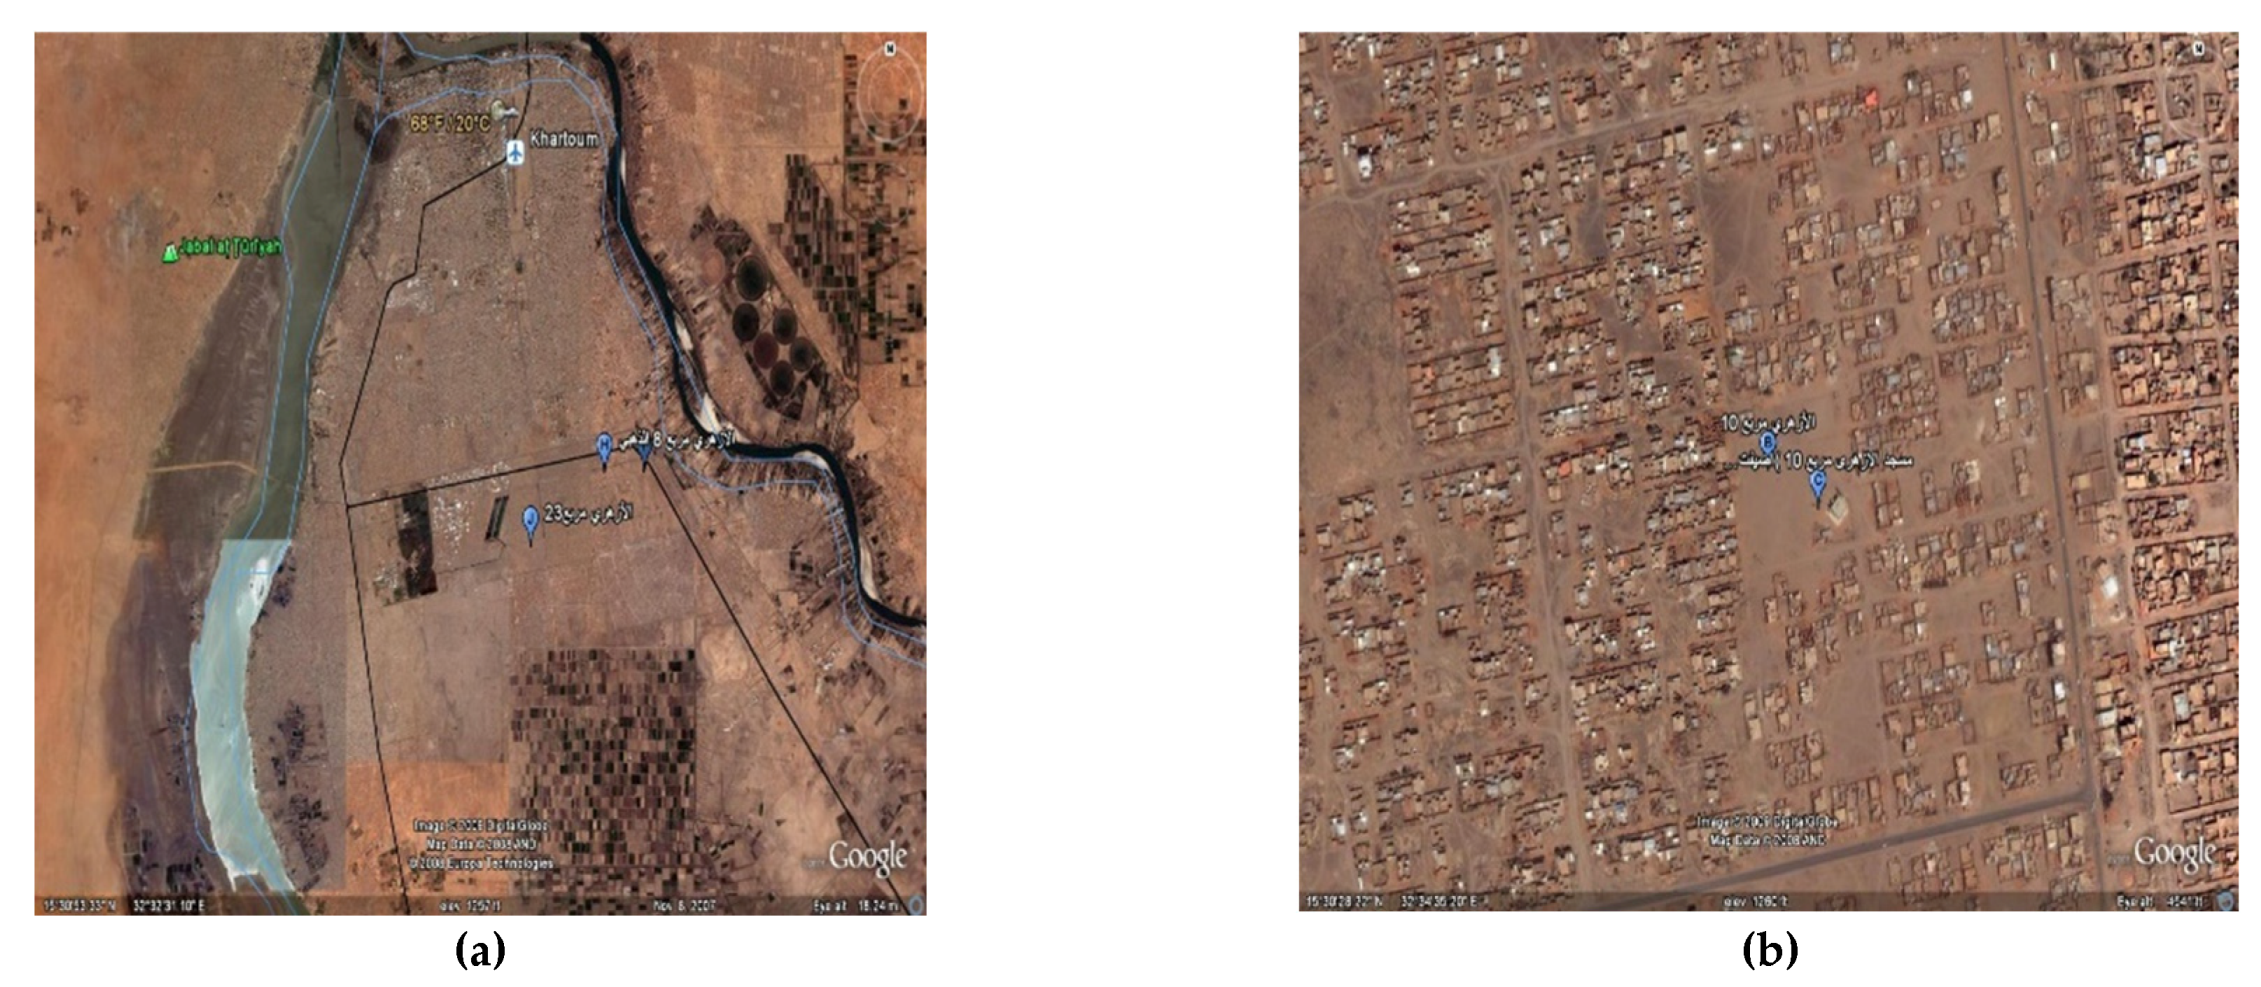
Figure 1. Al-Azhari City (uburban of khartoum) it describe (a) The Location of Al-Azhari City, Khartoum State and (b) Azhari City Block No.10 The Area.
Preprints 67032 g001
Figure 2. Window Position of Location.
Preprints 67032 g002
Figure 3. Ability for Saving Energy.
Preprints 67032 g003
Figure 4. View of Designed Residential one type of a house designed at Azhari City Block No.10 The Area. (a) Prespective of designed site (b) Prespective of a house (c) Urban planning of block 10.
Preprints 67032 g004
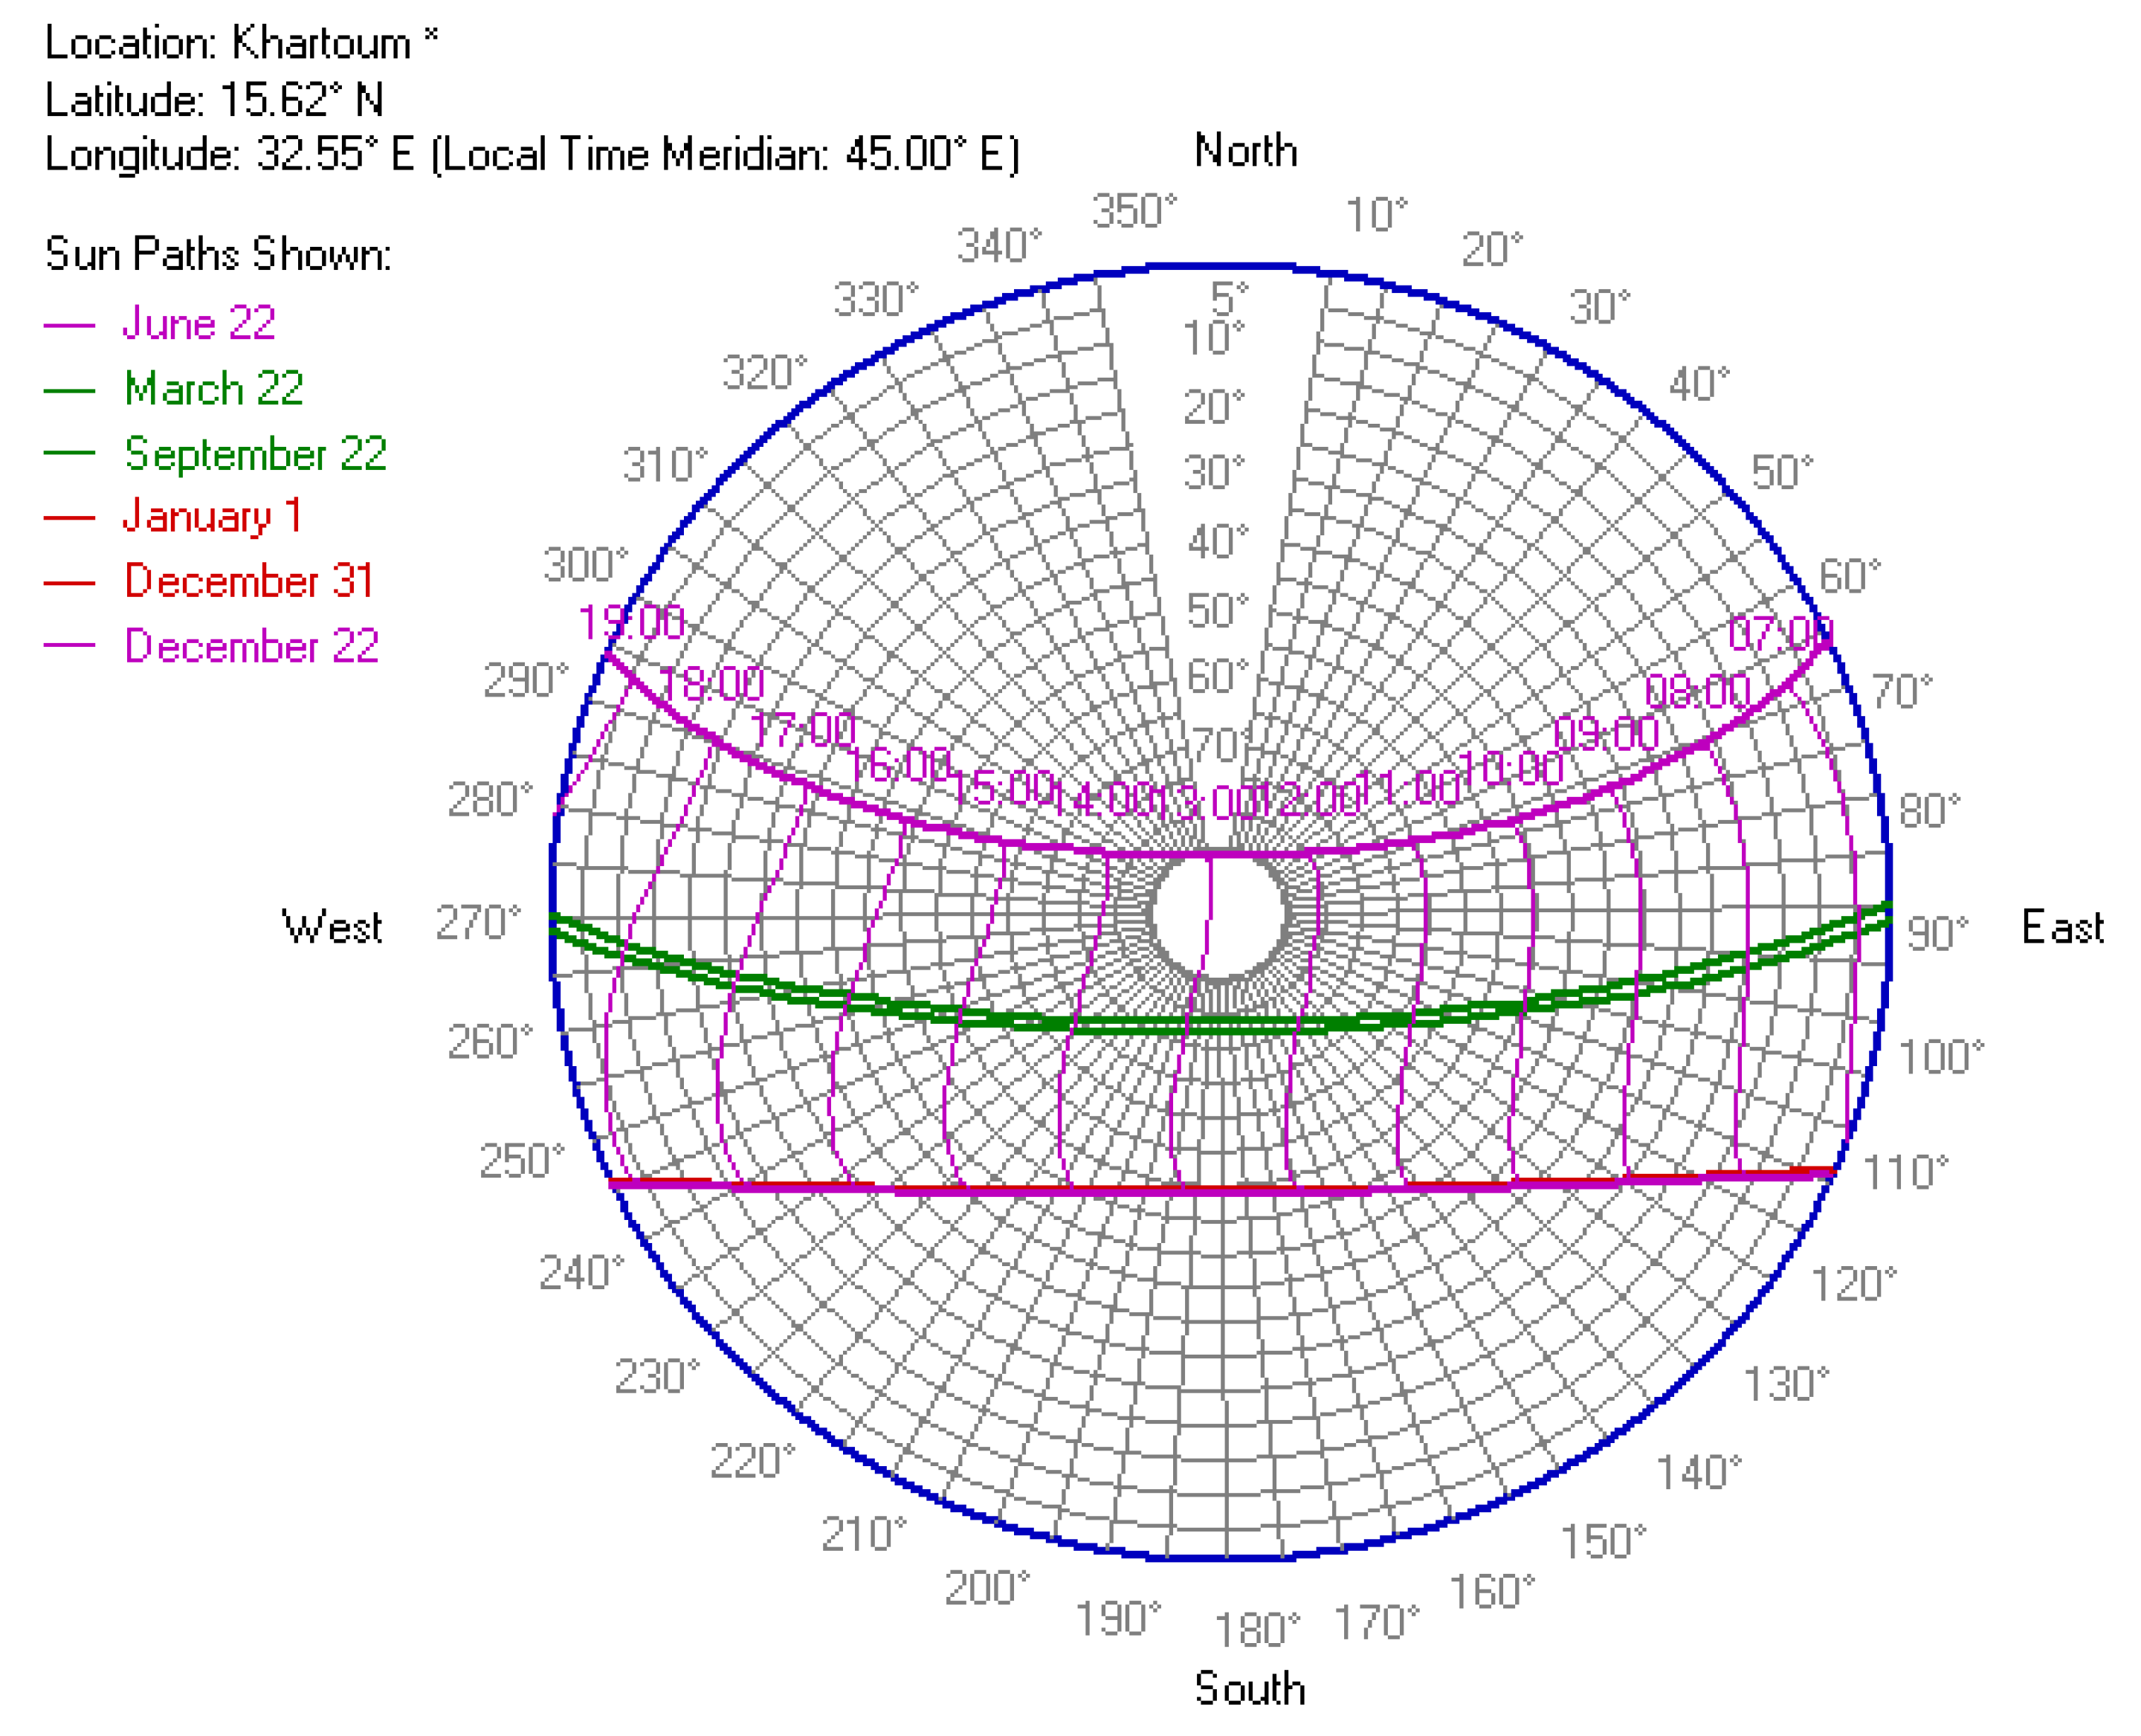
Figure 5. Sun Path in Khartoum.
Preprints 67032 g005
Figure 6. Up and Down Parameters of Climate.
Preprints 67032 g006
Figure 7. Outside Temperatures.
Preprints 67032 g007
Figure 8. Monthly Degrees Zone.
Preprints 67032 g008
Figure 9. Different Values of Cooling.
Preprints 67032 g009
Figure 10. This figure is two parts (a) analysis wind (b) shown the size of windows related to analysis the flow of wind matching to the size of windows.
Preprints 67032 g010
Figure 11. Windrose at the location (house).
Preprints 67032 g011
Figure 12. Worst Case Situation.
Preprints 67032 g012
Figure 13. Best Case Situation.
Preprints 67032 g013
Figure 14. Annual Energy Saving at location.
Preprints 67032 g014
Table 1. This is a table shown a solar attitude, heat consumption at location of study.
Preprints 67032 i001
Disclaimer/Publisher’s Note: The statements, opinions and data contained in all publications are solely those of the individual author(s) and contributor(s) and not of MDPI and/or the editor(s). MDPI and/or the editor(s) disclaim responsibility for any injury to people or property resulting from any ideas, methods, instructions or products referred to in the content.
Copyright: This open access article is published under a Creative Commons CC BY 4.0 license, which permit the free download, distribution, and reuse, provided that the author and preprint are cited in any reuse.
Prerpints.org logo

Preprints.org is a free preprint server supported by MDPI in Basel, Switzerland.

Subscribe

© 2024 MDPI (Basel, Switzerland) unless otherwise stated