Preprint
Article

Altered Mesenchymal Stem Cells Mechanotransduction from Oxidized Collagen. Morphological and Biophysical Observations

Altmetrics

Downloads

177

Views

60

Comments

0

A peer-reviewed article of this preprint also exists.

Submitted:

08 January 2023

Posted:

09 January 2023

You are already at the latest version

Alerts
Abstract
ECM provides various mechanical cues that are able to affect the self‑renewal and differentiation of mesenchymal stem cells (MSC). Little is known however how these ques work in a pathological environment, such as acute oxidative stress. To better understand the behavior of human adipose tissue-derived MSC (ADMSC) in such conditions here we provide morphological and quantitative evidence for significantly altered early steps of mechanotransduction when adhering to oxidized collagen (Col-Oxi). This affects both focal adhesion (FA) formation and YAP/TAZ signaling events. Representative morphological images show that ADMSCs spread better within 2 h of adhesion on native collagen (Col), while they tended to round up on Col-Oxi. It correlates also with the less development of the actin cytoskeleton and FA formation, confirmed quantitatively by morpho-metric analysis using ImageJ. As shown by immunofluorescence analysis, oxidation also affected the ratio of cytosolic to nuclear YAP/TAZ activity, concentrating in the nucleus for Col while remaining in the cytosol for Col-Oxi, suggesting abrogated signal transduction. Comparative AFM studies show that native collagen forms relatively coarse aggregates, much thinner with Col-Oxi, possibly reflecting its altered ability to aggregate. On the other hand, the corresponding Young's moduli were only slightly changed, so viscoelastic properties cannot explain the observed biological differences. However, the roughness of the protein layer decreases dramatically, from RRMS equal to 27.95 + 5.1 nm for Col to 5.51 + 0.8 nm for Col-Oxi (p<0.05), which dictates our conclusion that it is the most altered parameter in oxidation. Thus, it appears to be a predominantly topo-graphic response that affects the mechanotransduction of ADMSCs by oxidized collagen.
Keywords: 
Subject: Biology and Life Sciences  -   Cell and Developmental Biology

1. Introduction

The extracellular matrix (ECM) initiates several mechanical cues that are able to activate intracellular signaling events through cell-matrix interactions [1,2,3,4]. It is generally agreed that the quality and quantity of ECM determine its physical parameters, which in turn affects cellular response [5]. This also applies to the behavior of stem cells [3,6,7,8,9]. Each organ or tissue provide specific mechanical cues [3] that has to be understood in the context of the entire multicellular organization [5,10] . The situation is different however, when cells interact with surfaces (in 2D system), which is often the case with implanted biomaterials. Here the surface roughness and surface energy (unified as nanotopography) play a pivotal role 7-10. The surface nanotopography strongly influences, for example osteoblastic proliferation, differentiation, and extracellular matrix proteins expression [5]. A line of research proves that surface roughness modification of titanium implants improves bone-to-implant contact [11,12]. Other examples are the nanofibers [13] , or other linear structures, where the organization of adhesive sites dictates the cellular response [3]. Collectively, a growing body of evidence suggest that both surface stiffness and surface topography affect cell fate, gene expression and whole cell cycle progression in various cell types [9,14,15,16]. Cell-matrix interaction is mediated by focal adhesions (FA), the main hub for mechanotransduction, connecting the ECM proteins, integrins, and the cytoskeleton [17] . Focal adhesions however develops better on 2D surfaces, driven by the stiffness, topography and surface energy [18], as well as by the organization of adsorbed adhesive proteins [13,19] . The forces exerted on cell adhesion molecules further regulate the RhoA signalling pathway by controlling the activities of guanine nucleotide exchange factors (GEFs) and GTPase activating proteins (GAPs) [1]. Recently become clear that the intracellular Hippo signaling pathway is the next hub that regulates a number of important biological processes, including cellular proliferation, survival and differentiation [20,21,22,23] , and thus determine the organ size and tissue homeostasis [20,21,22]. Originally discovered in Drosophila melanogaster, the Hippo pathway is highly conserved across species, as equivalent genes and their products can be found in mammals [20] as a complex cascade of serine/threonine-protein kinases STK3 and STK4 [2,4]. They form a complex with the adaptor protein SAV1 that can phosphorylate and to activate the effector protein, large tumor suppressor 1/2 (LATS1/2). At the same time, it inhibits the transcription cofactors Yesassociated protein (YAP1) and its transcriptional co-activator with PDZ-binding motif (TAZ) [19,20,24,25,26,27].
A growing body of evidence suggests that YAP/TAZ signaling is a next intracellular key for driving cell behavior via the Hippo pathway. When “off”, the phosphorylated YAP/TAZ retaining in the cytoplasm where it could undergo proteolytic degradation [5,19], but when “on”, the unphosphorylated YAP/TAZ moves into the nucleus and binds to transcription factors called TEA DNA-binding proteins (TEAD1–4) regulating various proliferative and pro-survival genes, thus having a important impact on cell behavior [20,21,22,23,24,25,26]. Works from the past decade has tremendously expanded our knowledge about the mesenchymal stem cells (MSC) physiology in response to physical signals in the environment [3,6,7,8].
MSCs are a group of progenitor cells characterized by their ability for self-renewal and directed differentiation [3,28]. Within their local tissue microenvironment, or niche, MSCs communicate with ECM accepting various chemical, physical and mechanical cues to regulate their fate and behavior [3,7,8,27,29,30,31]. Today is generally agreed that MSCs perceive their microenvironment through both soluble (diffusible) signals and mechanical cues, such as ECM stiffness, nanotopography or confined adhesiveness [3,23,24,25,26,27,29]. For example, MSCs have the ability to differentiate into neuroblast, chondrocyte, osteoblast, adipocyte and numerous other cell types when reside within matrices that mimic the stiffness of their native substrate [10,20,24] . However, it reflects their physiological environment providing specific viscoelastic properties, while the topographic response is less studied though is proposed that may also determine the local response of stem cells toward tissue repair and regeneration [24]. Collagen is the most abundant protein in the ECM, critical for its mechanical properties, including stiffness, roughness, extracellular forces, and topography, thus affecting various cell functions and communications [32,33,34]. Though our knowledge for the composition of natural ECM is continuously growing, the impact of its structural organization on the adjacent cellular microenvironment is not well understood, particularly in pathological conditions [32,35].
The oxidative stress is one such condition known to strongly affect the collagen structure and turnover, [36,37] including its extracellular processing [32] and remodelling [38,39]. Despite these processes are extensively studied, direct investigations utilizing adsorbed collagen layers are rather sparse. From this point, our recent study showing that the oxidation of adsorbed type I collagen alters its remodelling by stem cells [39] , open the door for further research.
The use of Adipose Tissue Derived MSCs (ADМSCs) as cellular model also draw notable attention as they combine the relatively easy availability and less donor site morbidity and possessing the characteristic multi-potency making them very suitable for tissue engineering applications [39,40]. Here we provide morphological and quantitative (morphometric) evidence for the altered mechanotransduction of ADMSCs adhering on oxidized collagen involving both focal adhesions (FA) and YAP/TAZ signaling pathways, aiming to better understand the stem cells behavior in the conditions of acute oxidative stress.

2. Results

2.1. Initial Cell Attachment

Glass coverslips were coated with native (Col) or oxidized collagen (Col Oxi) to follow the initial attachment of ADMSCs after 2 hours of incubation in a serum-free medium. The study was focused on the early signalling events (see below), since at later stages was expectable that cells will produce a plethora of matrix proteins that may scramble the collagen effect alone. For the same reason, the serum was omitted from the medium. After incubation, the cells were fixed and permeabilized before being stained according to 1st protocol (see Methods section) for actin (to view the cytoskeleton), vinculin (to visualize focal adhesions) and nucleus. Phase contrast pictures of living cells were also captured. Representative images are shown in Figure 1. As evident from the low magnification phase contrast pictures (A and D) and the morphometric data on Table 1, ADMSCs attached equally well on both substrata, but spread differently: much better on native Col (A) with spreading area of 216.0 μM2 versus 179.6 μM2 for the oxidized samples (D). At the same time the cells display more rounded morphology on Col-Oxi, as pointed with yellow arrows on (D), and confirmed quantitatively by the higher CSI index for the oxidized samples (0.33 versus 0.25 for the native ones) as presented on Table 1. Note, the CSI index tends to 1.0 for a circle and to 0 for a line, thus reflecting quantitatively the tendency for delayed spreading of ADMSC (more rounded morphology) when attached to Col-Oxi. This effect corroborates with the less actin cytoskeleton development and focal adhesion formation in the oxidized samples compared to native ones, pointed with white arrows on Figure 1B and Figure 1C, respectively.
The quantitative data for FA formation are presented on Table 2, confirming again the significantly higher values for ADMSC adhering on native collagen, namely: Number of FA, Total FA area and the Mean area per a single FA, amounting respectively: 317, 1085 and 3.66, versus 143, 406 and 2.84 for the oxidized samples were calculated from the images [42,43,44].
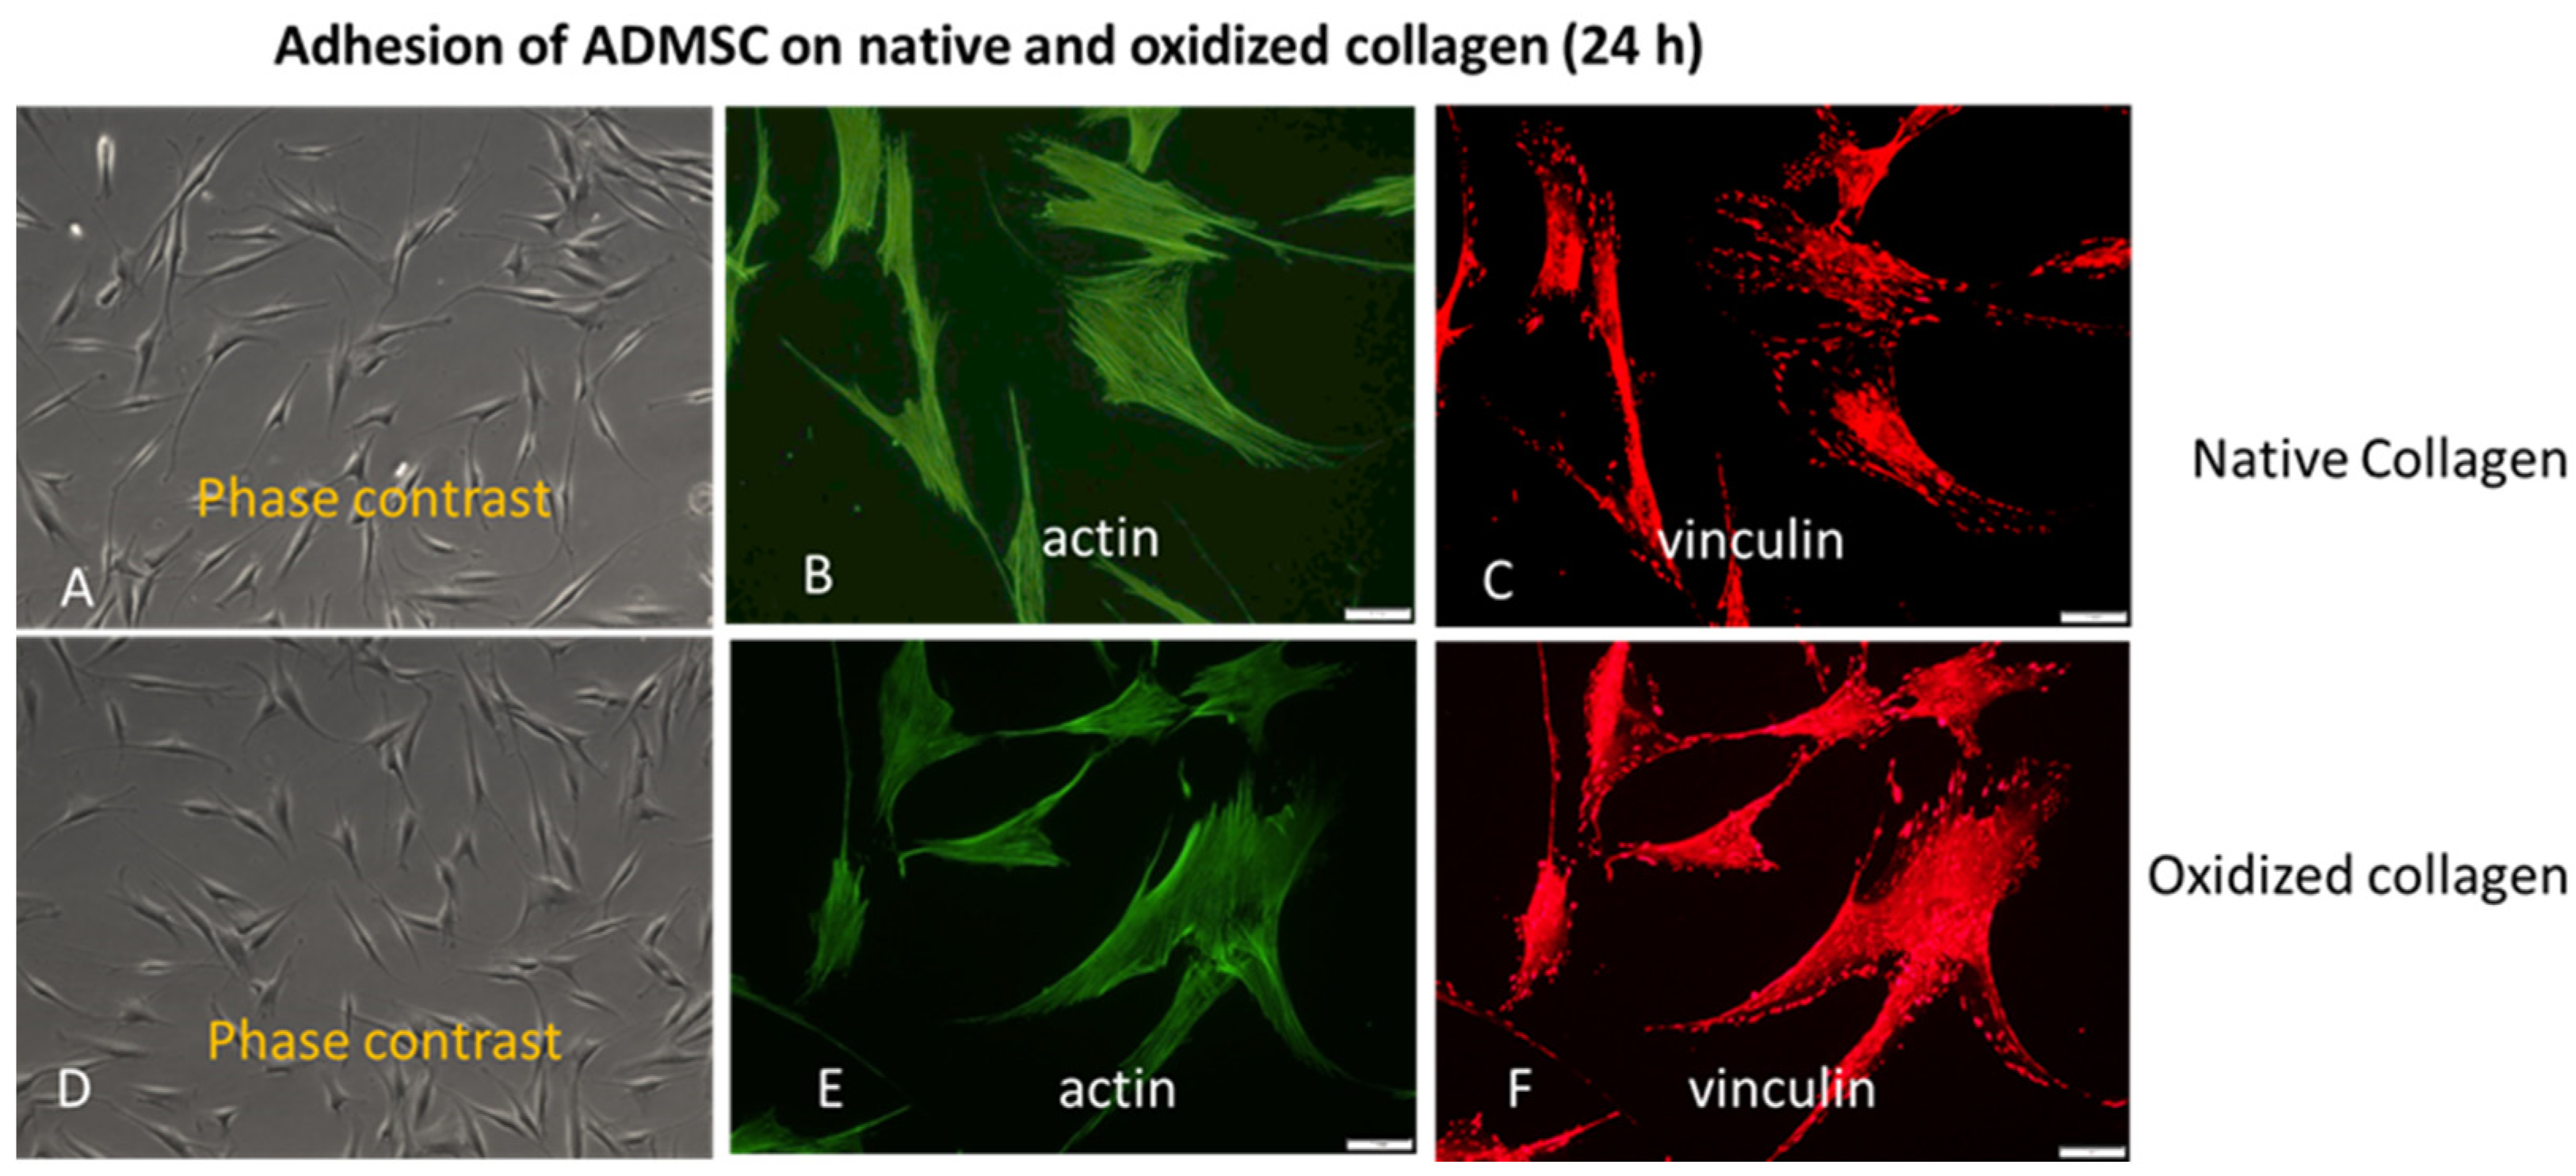
We also conducted a study covering the later stages of adhesion. As evident from Figure 2, all these morphological differences did not persist at the 24th hour of incubation, apparent from the phase contrast pictures (A, D), equally developed actin cytoskeleton (B, E) and focal adhesions formation (C, E) on both, Col (upper row) and Col-Oxi samples (bottom row). Quantitative analyses were not performed here. In fact, this result supported our initial desire to focus on the early stages of cellular interaction and signalling events giving option to evaluate the specific effect of collagen oxidation.

2.2. YAP/TAZ Signalling Events

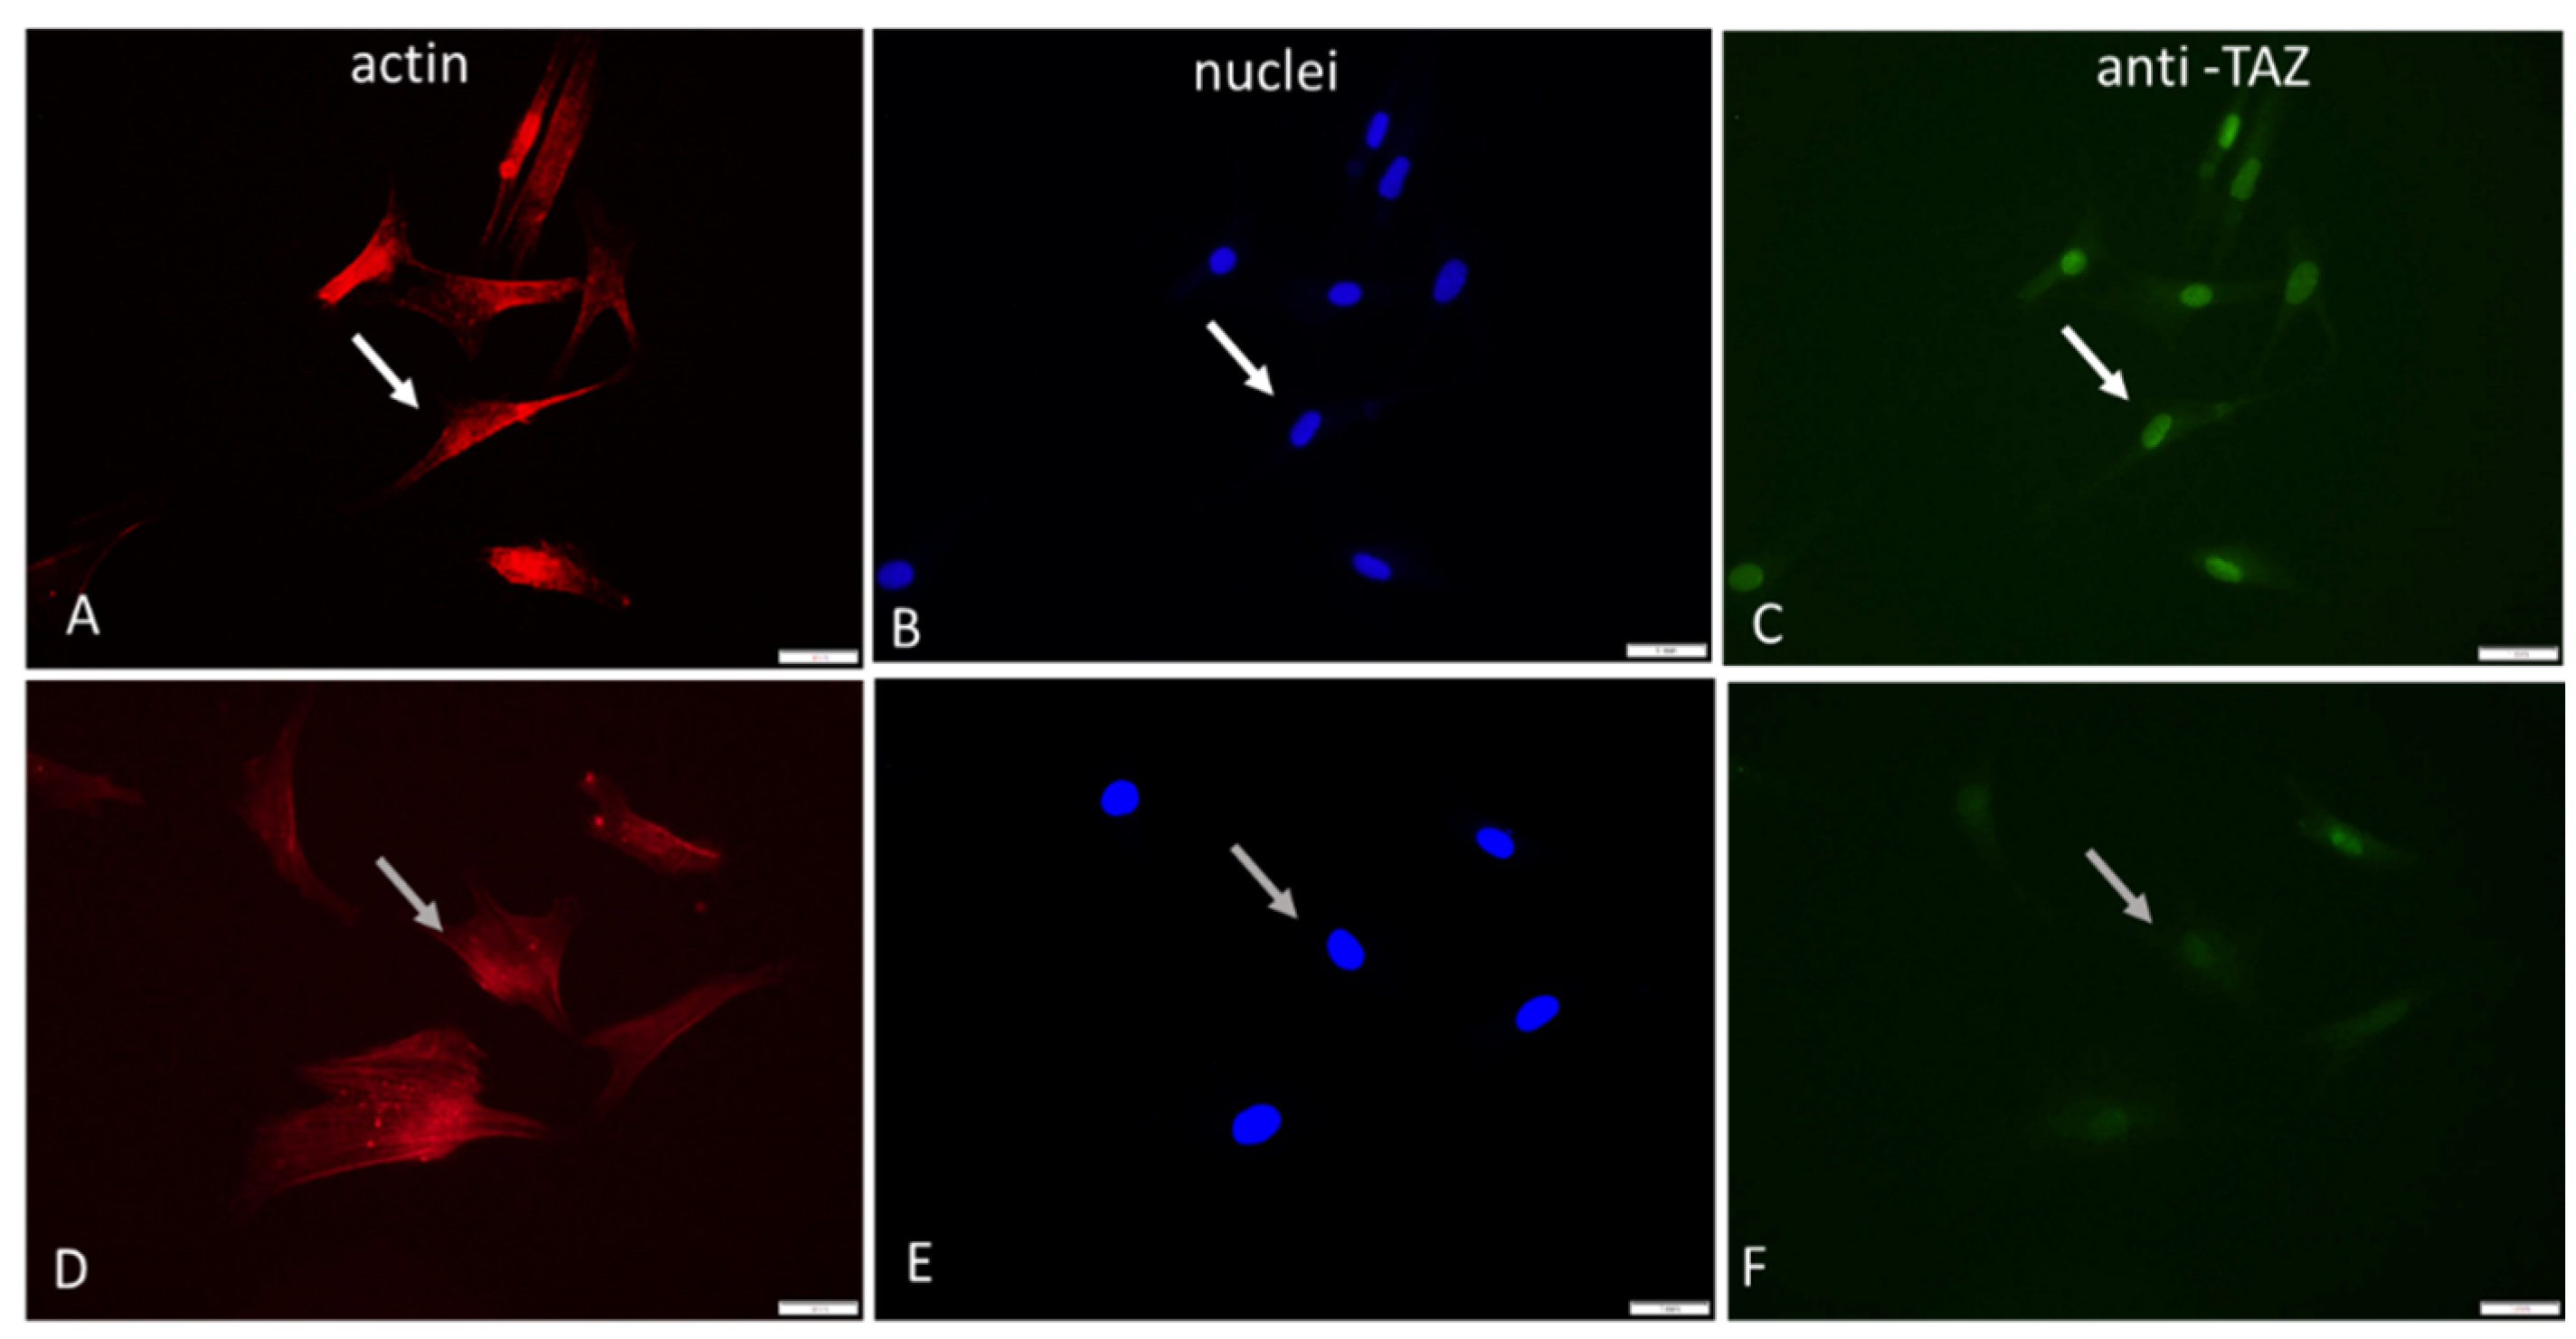
To follow the intracellular signalling events upon adhesion of ADMSCs, we fixed and permeabilized the cells at the 2nd hour of incubation before staining simultaneously for actin, nucleus and TAZ activity (see 2nd protocol in Methods section).
Figure 3 shows typical images of cells examined sequentially on the red, blue and green channels, respectively.
As evident from these images (Figure 3) and from the supporting quantitative analysis presented in Table 3, the YAP/TAZ activity that coincide with the nucleus is apparently higher for native Col compared to Col-Oxi, corresponding to 229.3 versus 178.2 pixels and ratio 176.2 versus 14.4, respectively, as shown on Table 3. These values suggest a significantly better signal transmission to the nucleus for native collagen samples (p< 0.05 Cytosolic TAZ (pixels) 1.3 12.4 P< 0.05 Ratio TAZ Nuclei/TAZ Cytosol 176.2 14.4 P< 0.05
Collectively, this unequal distribution of TAZ in the nucleus and in the cytosol for native and oxidized samples confirms the significantly different signal transduction activity.
Another interesting observation from these images was the difference in the overall nuclear shape: the nuclei in native collagen - Col were more flattened compared to the Col-Oxi ones (see Figure 3 B vs. E), suggesting а greater pressure from the cytoskeleton for ADMSC adhering on native collagen. This observation was partly confirmed by the nuclear size and shape analysis presented on Table 4: the Mean Nuclear area per cell was significantly lower in native collagen samples compared to the oxidized ones, amounting at 17.0 μM2 versus 21.2 μM2 (p<0.05). The effect on the nuclear shape was not so pronounced, we found only a nonsignificant trend for lowering the mean NSC (0.81 versus 0.86) and the NAR from 1.68 versus 1.34 for ADMSC adhering on native vs. oxidized collagen, respectively.

2.3. Comparative AFM Study

The morphology and the mechanical properties of adsorbed native and oxidized collagen, compared with the denatured one, was further examined in nanoscale using AFM. For these experiments collagen was adsorbed to glass cover slips at identic conditions with cellular studies (at 37 oC for 1 h). The measurements were performed by AFM operating in contact mode at room temperature in air.
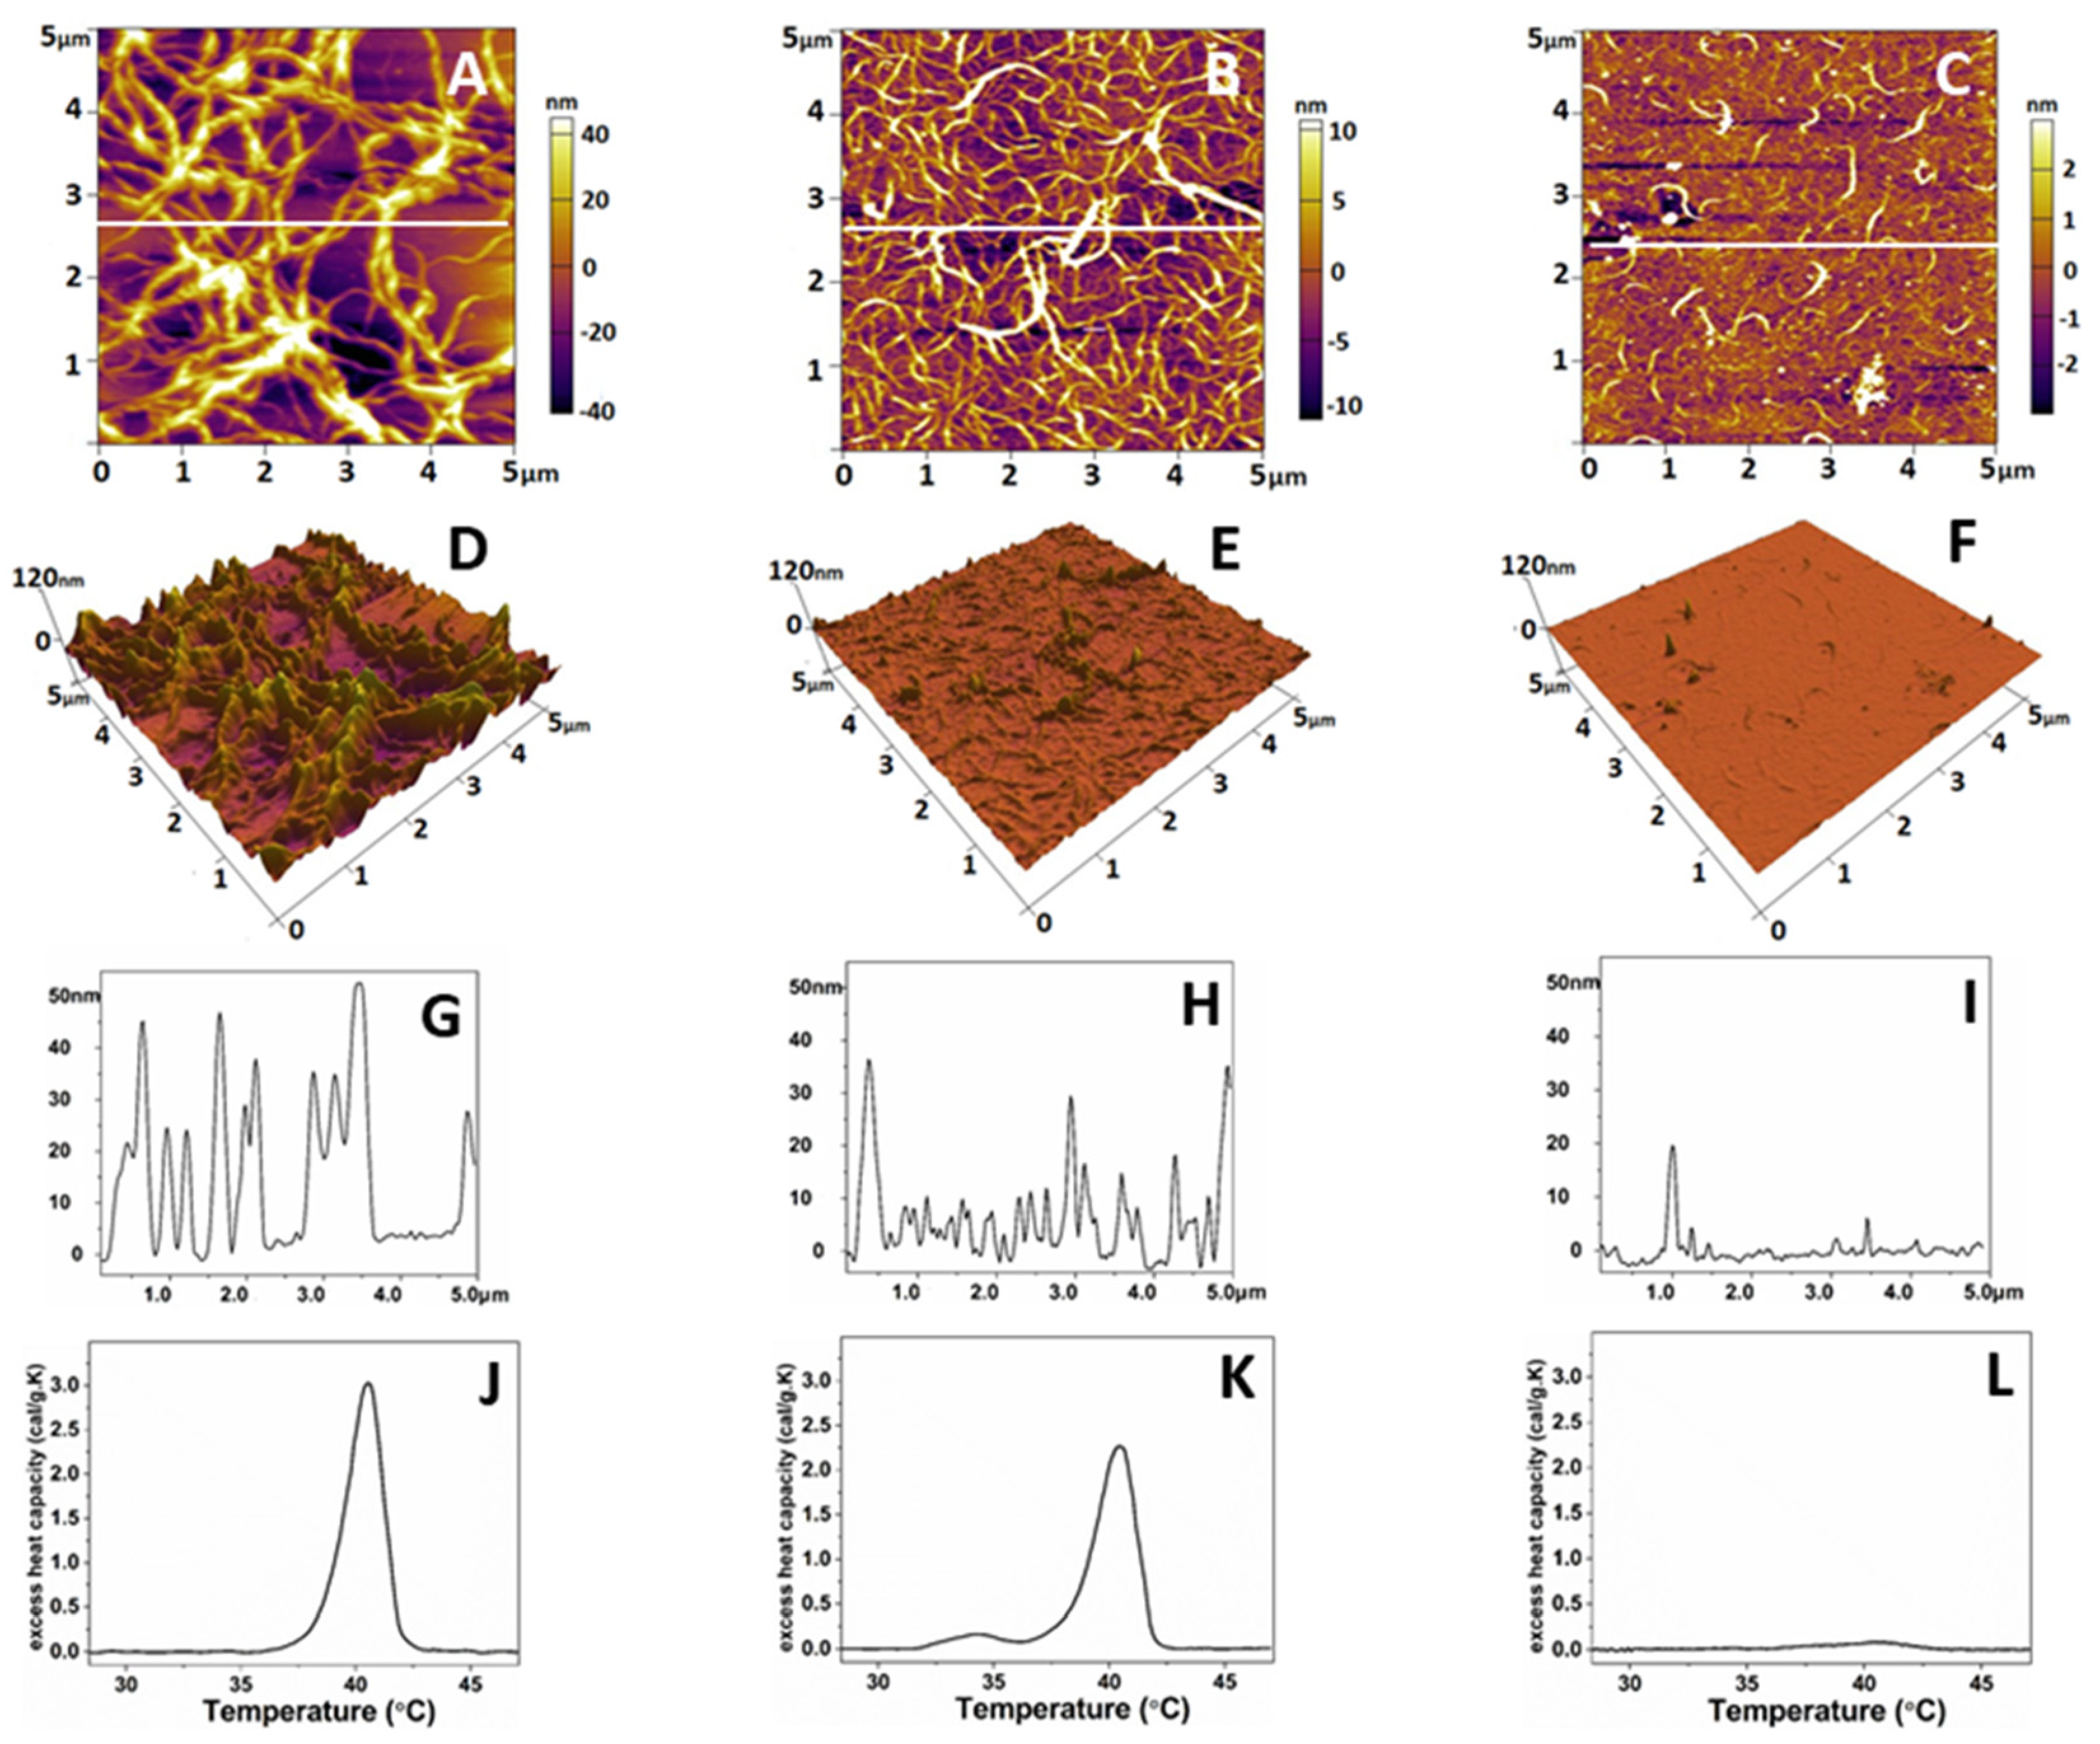
As shown on Figure 4, the native collagen forms relatively large linear structures (Figure 4A), resembling thick interlaced fibers. More detailed 3D analysis however showed that these structures are sooner coarse aggregates growing to the z-direction (Figure 4D,G). These linear structures were much thinner on oxidized collagen samples (Figure 4B), showing tendency for networks formation, combined with less growth in the z direction (Figure 4E,H). In the denatured collagen samples, most of these structures were absent (Figure 4C,F,I). Thermal denaturation curves (Figure 4J–L) obtained separately by Differential Scanning Calorimetry (DSC) also confirm the rather minute structural changes in Col-Oxi, thus matching our previous investigation for appearance of small pre-pic at 35 oC, apart from the complete absence of any thermal changes in denatured collagen.
To follow the mechanical properties of the obtained collagen features the same AFM scans were used to calculate the roughness values (RRMS) and Young’s modules (Ea). Force-distance curves taken on the collagen samples were selected manually from the force images. Only indentation curves located at the top of the fibrils and at the overlap region of the collagen aggregates (Figure 4D–F) were considered. Young’s modulus of the native collagen was 56.6 ± 8 MPa, whereas that for the oxidized collagen was 66.8 ± 5 MPa (Table 5), respectively. However, no significant difference (p>0.05) was evident between the two forms of collagen. Conversely, the data in Table 5 shows that upon oxidation the roughness of adsorbed collagen features drops dramatically (approx. 7 times), from 27.95 + 5.1 to 5, 51 + 0.8 nm reflecting a strongly altered ability of protein to aggregate, apart from the native collagen forming big aggregates with pic to valley distance of about 28 nm (p<0.05). The denaturation leads to a relatively vague assembly of collagen in aggregates.

3. Discussion

It is widely accepted that ECM anchors cell and directs cell functions not only by biochemical signals, but also via specific mechanical cues [2,3]. Stem cells receive such cues from their microenvironment in the niche through mechanosensing and mechanotransduction [7,8,10,13,45], where collagens play significant role [30,32,46]. Collagen is chiefly important because determine most of the mechanical properties of the tissues and organs [5,32,40,47,48,49].
It is today clear that the physical cues affect proliferation, self-renewal, and the differentiation of MSCs into specific cell fates [3,8,9]. A little is known however how these ques works at pathological environments, such as the acute oxidative stress known to affect numerous homeostatic parameters in the body [36,37]. Recently we developed a useful in vitro model to study the effect of collagen oxidation on MSC behavior. More specifically we used adsorbed collagen of either native or preoxidized form [39] as substratum for ADMSCs adhesion, to follow their behavior under the conditions that mimic acute oxidative stress [41]. Using this model, we found that the oxidation leads to a significant suppression of extracellular collagen remodelling by ADMSCs due to minute changes in collagen structure, which opened the door for further applications of this model. Here we show that it may relates to an altered transduction of the mechanical signal to the cell interior. A reasonable question rise: how MSCs sense such altered collagen structure? Collagen binding is primarily provided by integrins, mainly α1β1 and α2β1, but also α10β1 and α11β1 [33,34] with affinity for RGD and GFOGER-like sequences in collagen molecule [33,34]. Integrins are family of major cell surface receptors generally involved in mediating cellular response to ECM binding [5]. Composed of alpha and beta subunits, integrins form structural and functional linkages between the ECM fibrils and the intracellular cytoskeletal linker proteins [34]. Binding to immobilized collagen promote integrin activation and clustering in focal adhesions, which further associate with intracellular actin filaments through above mentioned linker proteins [5] . One such protein is vinculin, a cytoskeletal constituent associated with cell-cell and cell-matrix junctions. It is the most used marker for focal adhesions involved in anchoring F-actin to the membrane [46,50]. Our results show that ADMSCs hardly develop vinculin containing focal contacts upon attachment to oxidized collagen, apart from the native collagen where these structures are well pronounced. It correlates with the substantially diminished cell spreading and cell polarization monitored once morphologically (Figure 1) and confirmed by ImageJ morphometry analysis (Table 1, Table 2, Table 3 and Table 4). We show significantly reduced cell spreading area (from 216 to 179 μM2) and CSI tending to 0.25 (i.e. to more circular shape) compared to 0.33 for Col (Table 1). It has to be noted however that this morphological difference was valid only for the initial stages of cell spreading, as at the 24th hour it was no longer observed: ADSCs attached and spread equally well on both substrata (Figure 2), actually confirming our previous investigation [39]. We are prone to explain this by the constitutive ability of ADMSCs to produce very soon their own matrix, containing many other adhesive proteins capable to obliterate the initial collagen effect. As noted above, this was the reason we focused the present study on the initial stage of cell adhesion and the corresponding signalling events, to be sure that ADSCs attach to collagen only. Another interesting finding here was the observed tendency for flattening of ADMSCs nuclei in samples with native collagen, while on oxidized one the nuclei were bigger and visibly rounding – a trend confirmed quantitatively by morphometry analysis (Table 1). It is well documented that focal adhesions and stress fibers generated on stiff substrata transduce mechanical forces to the nucleus, leading to a nuclear flattening [5,46,47]. Thus, we got additional evidence for the successful transmission of mechanical signal to the cell nuclei that works better for ADMSC adhering on native collagen than on oxidized one. There are proofs that deformation increases the nuclear import of signalling molecules by decreasing mechanical restriction in nuclear pores [16,47], which presumably happens also in our system, as judged by the nuclear accumulation of TAZ activity. Using immunofluorescent visualization of the YAP/TAZ signalling cascade (anti-TAZ antibody) we demonstrated its substantially stronger accumulation in the nuclear region (Figure 3), again valid mostly for the ADMSC adhering on native collagen. It was confirmed statistically with morphometry (Table 3), while on the oxidized samples the signal was considerably fainter (p0.05). On deeper analysis, however, we decided that this fact should not puzzle us considering that this is an adsorbed protein and the role of the underlying substrate stiffness can hardly be ignored. In contrast, the AFM data demonstrated a significant change in surface roughness measured over the adsorbed collagen molecules: from relatively thick linear structures, characterized as coarse aggregates in 3D images, they visibly switch to a much thinner linear features on oxidized samples (Figure 4A–F). Moreover, the calculated roughness values (RRMS) showed that upon oxidation the roughness of adsorbed collagen features drops dramatically to about 5.5 nm (pick to valley distance), compared to 28 nm for native collagen samples (i.e., approx. 7 times less) reflecting a significantly altered ability (p<0.05) of oxidized protein to aggregate under these conditions. It has to be noted here, that the adsorption of proteins was performed at 37o C for 1 h, i.e., in the conditions absolutely identical to the cellular studies, meaning that it represented the real roughness that cells experience from the substratum. Though not directly related to collagen, there exist a line of studies confirming the topographic response of stem cells [7,8,9,11,16,17]. This necessitates the conclusion that the most altered parameter to which cells are exposed in our conditions is the roughness of adsorbed protein, i.e. per se it is a kind of response of ADMSCs to substrate topography, which determine the impaired mechanotransduction from oxidized collagen.

4. Materials and Methods

4.1. Collagen Preparation

Collagen type I was produced from rat tail tendon by acetic acid extraction and salting out with NaCl, as described elsewhere [39,41]. After centrifugation at 4 000 rpm at 4oC, the pellets were redissolved in 0.05 M acetic acid. The excess of NaCl was removed by dialysis against 0.05 M acetic acid. All procedures were performed at 4oC. Thus, a nearly monomolecular composition of collagen solution, in which the collagen content approaches 100% of the total dry mass, was prepared. The collagen concentration in the solutions was measured by the optical absorbance at 220-230 nm [41].

4.2. Collagen Oxidation Procedure

The collagen solution (2 mg/ml) was incubated in 0.05M acetic acid, pH 4.3, with 50 µM FeCl2 and 5 mM H2O2 for 18 hours at room temperature as previously described ( 41 ). The oxidant solutions were freshly prepared. 10 mM EDTA was used to stop the oxidation reaction folllowed by intensive dialysis versus 0.05 M acetic acid to remove the excess of oxidants. The oxidized collagen - Col-Oxi was freshly prepared before the experiments.

4.3. Cells

Human ADMSCs of passage 1 was received from Tissue Bank BulGen using healthy volunteers with written consent before liposuction. The cells were maintained in DMEM/F12 medium containing 1% GlutaMAX™, 1% Antibiotic-Antimycotic solution and 10% Gibco Fetal Bovine Serum (FBS) all purchased from (Thermo Fisher Scientific, USA). In every two days the medium was replaced until the cells reach approximately 90% confluency to be used for the experiments up to 7th passage.

4.4. Morphological Study

For the morphological observations collagen (100 µg/ml), dissolved in 0.05M acetic acid was used to coat regular glass coverslips (12x12 mm, ISOLAB Laborgerate GmbH) for 60 min at 370C, placed in 6-well TC plates (Nunc, Denmark). Then the cells were seeded at 5 x 10⁴ cells/well density in final volume of 3 mL serum-free medium before incubated for 2 h, or for 24 h. In later case 10% FBS was added at the end of 2nd hour. The initial cell adhesion and overall cell morphology were studied at the 2nd hour and imaged under phase contrast using inverted microscope Leica DM 2900 or processed for immunofluorescent analysis in two protocols, as follows:
1st protocol (cell spreading and FA formation):
After incubations (2 or 24 h) the samples were fixed with 4% paraformaldehyde and permeabilized with 0.5% Triton X-1000 before fluorescence staining. Green fluorescent Alexa fluorTM 444 Phalloidin (Invitrogen, Spain) was used to visualize actin cytoskeleton, while the cell nuclei were stained by Hoechst 33342 (Sigma-Aldrich, dilution 1:2000). Focal adhesions were viewed with Anti-Vinculin Mouse Monoclonal Antibody (Clone: hVIN-1) IgG (1:150) followed by fluorescent Alexa Fluor 555 conjugated goat anti mouse IgG (minimal x-reactivity) antibody (both provided by SigmaAldrich) used in dilution 1:100.
2nd protocol (YAP/TAZ signaling events):
To follow the YAP/TAZ signaling events separate samples from the same series were stained with a rabbit polyclonal anti-TAZ antibody followed by green fluorescent Alexa FluorTM 444 conjugated goat anti rabbit antibody (both provided by Sigma-Aldrich) used in dilution 1:100, further counterstained for cell nuclei with Hoechst 33342 and red fluorescent Rhodamine Phaloidin (Sigma-Oldrich) to view actin cytoskeleton, using dilutions as above.
Finally, all samples were mounted upside down on glass slides with Mowiol and viewed for 1st protocol using the blue (nuclei), green (actin cytoskeleton) and red (vinculin) channels of an inverted fluorescent microscope (Olympus BX53, Upright Microscope) with objectives UPlan FLN (40x/0.50). TAZ samples (2nd protocol) were viewed separately in the green (TAZ activity), blue (nuclei) and red (actin) channels, respectively. Minimum three representative images were obtained for each sample. The different colours were merged by the respective image processing software. All experiments were quadruplicated

4.5. Image Analysis

4.5.1. Quantitative Analysis of Raw Format Images by ImageJ

All image analysis was performed on a per-cell basis using ImageJ which provides a wide range of processing and analysis approaches. The fluorescence intensity of the fibrillary arrays were measured based on raw format images of cells captured from at least three separate images under the same conditions. Pixel-based treatments are performed to highlight the regions of interest (ROIs) and allow the removal of artefacts. A default black and white threshold was used in the segmentation module. Images of equal size (W: 1600 px/H: 1200 px) were examined. All measurements were performed at the respective channel of the two or three coloured images.

4.5.2. Quantification of Overall Morphological Parameters

Four metrics were acquired: Spread Area (SA), Cell Shape Index (SCI), Aspect ratio (AR), and Focal Adhesions size. The individual cellular domains were determined by generating binary masks using Otsu’s intensity-based thresholding method from fluorescent actin images. Cellular masks were then used to calculate ADMSC SA, and CSI. The CSI was calculated using the formula:
CSI=4π×A/P2,
where A is mean cell area and P is mean cell perimeter.
With this metric, a line and a circle have CSI values of 0 (indicating an elongated polygon), and 1 (indicating a circle), respectively. AR were calculated as the ratio of the largest and smallest side of a bounding rectangle encompassing the cell. The same counter function was then used to calculate the nuclear surface area (NSA) and overall nuclear shape index (NSI) as important morphometric characterization for each cell.

4.5.3. YAP/TAZ Signaling

To quantify YAP/TAZ nuclear-to-cytosolic ratio, binary masks of the nuclei were generated using Otsu’s intensity-based thresholding method from fluorescent Hoechst images and were superimposed with corresponding actin masks to generate masks that encompass the cytosol yet exclude the nucleus. Fluorescent TAZ images were then superimposed either with the nuclear or cytosol-only masks to isolate TAZ signal in the nucleus or cytosol, respectively. Integral TAZ signal intensity was then determined in these domains and their ratio was normalized to the corresponding areas. The ratio of TAZ activity in the nucleus versus cytoplasm was further calculated and compared for both native and oxidized samples.

4.5.4. Quantification of Focal Adhesions (FA)

Focal adhesions were estimated following the procedure described by Horzum et al.. The steps of image processing were carried out using ImageJ. Briefly, the raw fluorescent images were processed in several steps, as follows: [42] Choose sliding paraboloid option with the rolling ball radius set to 50 pixels [43]; Enhance the local contrast of the image. We used the following values: block size =19, histogram bins =256, maximum slope=6, no mask and fast [44] ; Apply mathematical exponential (exp) to further minimize the background; (iv) Adjust brightness & contrast automatically; (v) Run log3d (Laplacian of Gaussian or Mexican Hat) filter. Here we defined the size of log3Step 1b of log3d filter as sigma X = 5 and sigma Y = 5); (vi) Run log3d (Laplacian of Gaussian or Mexican Hat) filter; (vii) Execute analyse particles command using the following parameters: size = 50, infinity and circularity = 0.00–0.99.

4.6. AFM Studies

AFM imaging and force-distance curves of native, oxidized and denatured collagen were performed using Atomic Force Microscope (MFP-3D, Asylum Research, Oxford Instruments, Santa Barbara, California 93117, USA). All measurements were taken in the air and at room temperature. Silicon AFM tips (Nanosensors, type qp-Bio) of 50 kHz resonance frequency and 0.3 N/m nominal spring constant were used.
For all imaging experiments, collagen solutions were deposited on a clean class cover slip and incubated at 37 oC for one hour to ensure maximal adsorption for each sample. Afterwards, the collagen coated glasses were washed gently with distilled water to avoid buffer crystallization on the surface. Morphometrical (roughness value) and nanomechanical characterization was accomplished using IgorPro 6.37 software. The mechanical properties of the three types of collagen were assumed by Young’s modulus defined by the force-distance (f-d) curves. The value of the elastic modulus was obtained by fitting the force–indentation data to the Hertz model with the embedded IgorPro software, considering the Poisson’s ratio to be ≈0.5:
E=3F(1-ν^2)/4√(rδ^3 )
where F is the applied force on the sample, δ is the indentation depth, r is the tip radius, and E and ν are Young’s modulus and Poisson’s ratio, respectively.

4.7. DSC Measurements

DSC measurements were performed using DASM4′s (Privalov, BioPribor) built-in, high-sensitivity calorimeter with a cell volume of 0.47 ml. The collagen concentration was adjusted to 2 mg/ml in 0.05 M acetic acid. To prevent any degassing of the solution under study, constant pressure of 2 atm was applied to the cells. The samples were heated at a scanning rate of 1.0°C/min from 20°C to 65°C and were preceded by a baseline run with buffer-filled cells. Each collagen solution was reheated after cooling from the first scan to evaluate the reversibility of the thermally-induced transitions. The calorimetric curve corresponding to the second (reheating) scan was used as an instrumental baseline and was subtracted from the first scans, as collagen thermal denaturation is irreversible. The calorimetric data were analysed using the Origin Pro 2018 software package.

4.8. Statistical Analysis

All experiments were conducted with at least 3 independent series with 3-4 cells per group. One-analysis of variance (ANOVA) followed by Tukey-HSD post-hoc tests were performed on all data sets. Error is reported in bar graphs as the standard error of the mean unless otherwise noted. Significance was indicated by *, corresponding to P < 0.05.

Author Contributions

G.A. and R.K.-P.—Conceptualization of the study; G.A., R.K.-P., S.T.,V.S, A.Y., M.I. and B.D- Methodology and Investigation; G.A., R.K.-P., S.K., P.T. and S.T.—Analysis and interpretation; P.T.— ImageJ analysis; G.A. and R.K.-P.—Writing, Original Draft Preparation; G.A.,R.K.-P.— Review & Editing; R.K.-P. S.K. —Project Administration, funding acquisition; G.A and R.K.-P—Primary responsibility for the final content. All authors have read and agreed to the published version of the manuscript.

Funding

This work was conducted with the financial support of multidisciplinary project BG05M2OP001-1.002-0010-C01 financed by the operative program “Science and education for intelligence growth” within the European Regional Development Fund and further supported by the Medical University, Pleven, Bulgaria.

Institutional Review Board Statement

The study was conducted according to the guidelines of the Declaration of Helsinki and approved by the Institutional Ethics Committee of Medical University-Pleven.

Data Availability Statement

Not applicable.

Acknowledgments

We acknowledge the support and donations of materials used for experiments, given by Tissue Bank BulGen, Bulgaria. We acknowledge that research equipment of Distributed Research Infrastructure INFRAMAT, part of Bulgarian National Roadmap for Research Infrastructures, supported by Bulgarian Ministry of Education and Science was used in this investigation.

Conflicts of Interest

The authors declare no potential conflict of interest.

References

  1. Burridge K, Monaghan Benson E, Graham DM. Mechanotransduction: from the cell surface to the nucleus via RhoA. Phil. Trans. R. Soc. 2019. B 374: 20180229. [CrossRef]
  2. Yamashiroa Y, Quoc Thangb B, Ramireza K, Jae Shina S, Kohatae T, Ohataf S, Anh Vu Nguyena T, Ohtsukie S, Nagayamaf K, Yanagisawaa H Matrix mechanotransduction mediated by thrombospondin-1/integrin/YAP in the vascular remodeling. PNAS, 2020, vol. 117, no. 18. [CrossRef]
  3. Vining KH and Mooney DJ: Mechanical forces direct stem cell behavior in development and regeneration. Nat Rev Mol Cell Biol, 2017, 18: 728-742,. [CrossRef]
  4. Halder G, Dupont S and Piccolo S: Transduction of mechanical and cytoskeletal cues by YAP and TAZ. Nat Rev Mol Cell Biol 13: 591-600, 2012. [CrossRef]
  5. Humphrey J. D., Dufresne E. R., Schwartz M. A., Mechanotransduction and extracellular matrix homeostasis. Nat. Rev. Mol. Cell Biol. 15, 802–812 (2014). [CrossRef]
  6. Engler AJ, Sen S, Sweeney HL and Discher DE: Matrix elasticity directs stem cell lineage specification. Cell 126: 677-689, 2006. [CrossRef]
  7. Li D, Zhou J, Chowdhury F, Cheng J, Wang N and Wang F: Role of mechanical factors in fate decisions of stem cells, Regen Med. 2011 Mar; 6(2): 229–240. [CrossRef]
  8. Lee JH, Park HK and Kim KS: Intrinsic and extrinsic mechanical properties related to the differentiation of mesenchymal stem cells. Biochem Biophys Res Commun 473: 752-757, 2016. [CrossRef]
  9. Hou Y, Xie W, Yu L, Cuellar Camacho L, Nie C, Zhang M, Haag R, Wei Q. Surface Roughness Gradients Reveal Topography-Specific Mechanosensitive Responses in Human Mesenchymal Stem Cells, Small, 16 (10). [CrossRef]
  10. Wang Y, Wang G, Luo X, Qiu J and Tang C: Substrate stiffness regulates the proliferation, migration, and differentiation of epidermal cells. Burns 38: 414 420, 2012. [CrossRef]
  11. Shalabi MM, Gortemaker A, Van’t Hof M A, Jansen J A, Creugers N H J. Implant surface roughness and bone healing: a systematic review J Dent Res. 2006 Jun;85(6):496-500. [CrossRef]
  12. Matos GRM (2021) Surface Roughness of Dental Implant and Osseointegration Maxillofac Oral Surg. 2021 Mar; 20(1): 1–4. [CrossRef]
  13. Llopis-Hernandez V, Rico P, Moratal D, Altankov G and Salmeron-Sanchez M (2013) Role of Material-Driven Fibronectin Fibrillogenesis, Acta Biomaterialia, 77, pp. 74-84. [CrossRef]
  14. Klein E. A. et al., Cell-cycle control by physiological matrix elasticity and in vivo tissue stiffening. Curr. Biol. 19, 1511–1518 (2009). 4. [CrossRef]
  15. Nedjari S, Awaja F & Altankov G (2017) Three Dimensional Honeycomb Patterned Fibrinogen Based Nanofibers Induce Substantial Osteogenic Response of Mesenchymal Stem Cells, Scientific Reports, 7, 15947. [CrossRef]
  16. Kim D., Provenzano P.P, Smith C. L., Levchenko A., Matrix nanotopography as a regulator of cell function J. Cell Biol.2012, 197, 351. [CrossRef]
  17. Sun Z., Guo S. S., Fässler R. Integrin-mediated mechanotransduction. J. Cell Biol. 215, 445–456 (2016). [CrossRef]
  18. Majhy B., Priyadarshinia P., Sen A. K. Effect of surface energy and roughness on cell adhesion and growth – facile surface modification for enhanced cell culture RSC Adv., 2021, 11, 15467. [CrossRef]
  19. Horbett T.A. The role of adsorbed proteins in animal cell adhesion Colloids and Surfaces B: Biointerfaces Vol 2, Issues 1–3, 14 March 1994, Pages 225-240. [CrossRef]
  20. Dupont S, Morsut L, Aragona M, Enzo E, Giulitti S, Cordenonsi M, Zanconato F, Le Digabel J, Forcato M, Bicciato S, et al: Role of YAP/TAZ in mechanotransduction. Nature 474: 179-183, 2011. [CrossRef]
  21. Meng, Z., Moroishi, T. & Guan, K. Mechanisms of Hippo pathway regulation. Genes & Development 30, 1-17 (2016). [CrossRef]
  22. Zinatizadeh, M. et al. The Hippo Tumor Suppressor Pathway (YAP/TAZ/TEAD/MST/LATS) and EGFR-RAS-RAF-MEK in cancer metastasis. Genes & Diseases (2019). [CrossRef]
  23. Pobbati, A. & Hong, W. A combat with the YAP/TAZ-TEAD oncoproteins for cancer therapy. Theranostics 10, 3622-3635 (2020). [CrossRef]
  24. Janmey P. A., Wells R. G., Assoian R. K., McCulloch C. A., From tissue mechanics to transcription factors. Differentiation 86, 112–120 (2013). [CrossRef]
  25. Johnson R., Halder G. The two faces of Hippo: Targeting the Hippo pathway for regenerative medicine and cancer treatment. Nat. Rev. Drug Discov. 13, 63–79 (2014). [CrossRef]
  26. Wang K.C., Yeh Y.T., Nguyen P., Limqueco E., Lopez J., Thorossian S., Guan K.L., Li Y.S. J., Chien S., Flow-dependent YAP/TAZ activities regulate endothelial phenotypes and atherosclerosis. Proc. Natl. Acad. Sci. U.S.A. 113, 11525–11530 (2016). [CrossRef]
  27. Li Y, Wang J, Zhong W (2021) Regulation and mechanism of YAP/TAZ in the mechanical microenvironment of stem cells Mol Med Rep. 2021 Jul; 24(1): 506. Published online 2021. [CrossRef]
  28. Samsonraj R. M., M.Raghunath,V. Nurcombe, J. H. Hui, A. J. van Wijnen, S.M. Cool, Concise Review: Multifaceted Characterization of Human Mesenchymal Stem Cells for Use in Regenerative Medicine, Stem Cells Translational Medicine, Volume 6, Issue 12, December 2017, 2173–2185. [CrossRef]
  29. Dupont S. et al., Role of YAP/TAZ in mechanotransduction. Nature 474, 179–183 (2011). [CrossRef]
  30. Dupont S., Role of YAP/TAZ in cell-matrix adhesion-mediated signalling and mechanotransduction. Exp. Cell Res. 343, 42–53 (2016). [CrossRef]
  31. Bao M., Xie J., Huck W. T. S. Recent Advances in Engineering the Stem Cell Microniche in 3D Adv. Sci. 2018, 5, 1800448. [CrossRef]
  32. Mouw JK, Ou G, Weaver VM. Extracellular matrix assembly: a multiscale deconstruction. Nat Rev Mol Cell Biol. 2014;15(12):771-785. [CrossRef]
  33. Heino J. Cellular signaling by collagen-binding integrins.Adv Exp Med Biol 2014;819:143-55. [CrossRef]
  34. Zeltz C, Gullberg D.J, The integrin-collagen connection - a glue for tissue repair? Cell Sci. 2016 Mar 15;129(6):1284. [CrossRef]
  35. Myllyharju, J. Intracellular Post-Translational Modifications of Collagens. In: Brinckmann, J., Notbohm H, Müller, P K (eds) Collagen. Topics in Current Chemistry, vol 247. Springer, Berlin, Heidelberg. [CrossRef]
  36. Kennett EC, Chuang CY, Degendorfer G, Whitelock JM, Davies MJ. Mechanisms and consequences of oxidative damage to extracellular matrix. Biochem Soc Trans. 2011, 39(5):1279-87. [CrossRef]
  37. Boin, F., Erre, G.L., Posadino, A.M. et al. Oxidative stress-dependent activation of collagen synthesis is induced in human pulmonary smooth muscle cells by sera from patients with scleroderma-associated pulmonary hypertension. Orphanet J Rare Dis 9, 123 (2014). [CrossRef]
  38. Lu P, Takai K, Weaver VM, Werb Z. Extracellular matrix degradation and remodeling in development and disease. Cold Spring Harb Perspect Biol. 2011;3(12):a005058. Published 2011 Dec 1. [CrossRef]
  39. Komsa-Penkova R, Stavreva G, Belemezova K, Kyurkchiev S, Todinova S, Altankov G. Mesenchymal Stem-Cell Remodeling of Adsorbed Type-I Collagen-The Effect of Collagen Oxidation. Int J Mol Sci. 2022 Mar 11;23(6):3058. [CrossRef]
  40. Bao M., Xie J., Huck W. T. S. Recent Advances in Engineering the Stem Cell Microniche in 3D Adv. Sci. 2018, 5, 1800448. [CrossRef]
  41. Komsa-Penkova, R.; Koynova, R.; Kostov, G.; Tenchov, B., Discrete reduction of type I collagen thermal stability upon oxidation. Biophys. Chem. 2000, 83 (3), 185-195. [CrossRef]
  42. Horzum U, Ozdil B, Pesen-Okvur D. Step-by-step quantitative analysis of focal adhesions. MethodsX. 2014 Jul 7;1:56-9. [CrossRef]
  43. Saalfeld S. 2009. CLAHE (Contrast Limited Adaptive Histogram Equalization) Available from: http://rsbweb.nih.gov/ij/plugins/clahe/index.html (updated 2009/11/17) [Google Scholar].
  44. Sage D., Neumann F.R., Hediger F., Gasser S.M., Unser M. Automatic tracking of individual fluorescence particles: application to the study of chromosome dynamics. IEEE Trans. Image Process. 2005;14(September (9)):1372–1383. PubMed PMID: 16190472 (Epub 2005/09/30) [PubMed] [Google Scholar]. [CrossRef]
  45. Park J., Kim D., Levchenko A., Allan C., Ker A., Smith C.L.C.,Tsimbouri P.M., Borsoi J., Neill S.O, Gadegaard N., Wolfenson H., Yang B., Sheetz M.P. Steps in Mechanotransduction Pathways that Control Cell Morphology. Annu. Rev. Physiol.2019, 81, 585. [CrossRef]
  46. Wang JH, Thampatty BP, Lin JS, Im HJ. Mechanoregulation of gene expression in fibroblasts. Gene. 2007 Apr 15;391(1-2):1-15. doi: 10.1016/j.gene.2007.01.014. Epub 2007 Jan 31. [CrossRef]
  47. Wolfenson H. Yang B., Sheetz M. P. Steps in Mechanotransduction Pathways that Control Cell Morphology. Annu. Rev. Physiol.2019, 81, 585. [CrossRef]
  48. Elango J, C. Hou, B. Bao, S.Wang, J. E.Maté Sánchez de Val and W. Wenhui (2022) The Molecular Interaction of Collagen with Cell Receptors for Biological Function, Polymers 14(5), 876; [CrossRef]
  49. Ruggiero F, Champliaud M.F., Garrone R, Aumailley M. Interactions between Cells and Collagen V Molecules or Single Chains Involve Distinct Mechanisms Experimental Cell Research,Volume 210, Issue 2, February 1994, Pages 215-223(1994). [CrossRef]
  50. Burridge K, Feramisco JR. Microinjection and localization of a 130K protein in living fibroblasts: a relationship to actin and fibronectin”. Cell. 1980, 19 (3): 587–95. [CrossRef]
  51. Elango J, Hou C, Bao B, Wang S, Eduardo Maté Sánchez de Val J, Wenhui W. The Molecular Interaction of Collagen with Cell Receptors for Biological Function, Polymers 14(5), 876; (2022). [CrossRef]
  52. Park J., Kim D., Levchenko A. , Allan C., Ker A. , Smith C.L.C., Tsimbouri P.M. , Borsoi J., Neill S.O., Gadegaard N., Surface Roughness Gradients Reveal Topography-Specific Mechanosensitive Responses in Human Mesenchymal Stem Cells, Small 2020, 16, 1905422. [CrossRef]
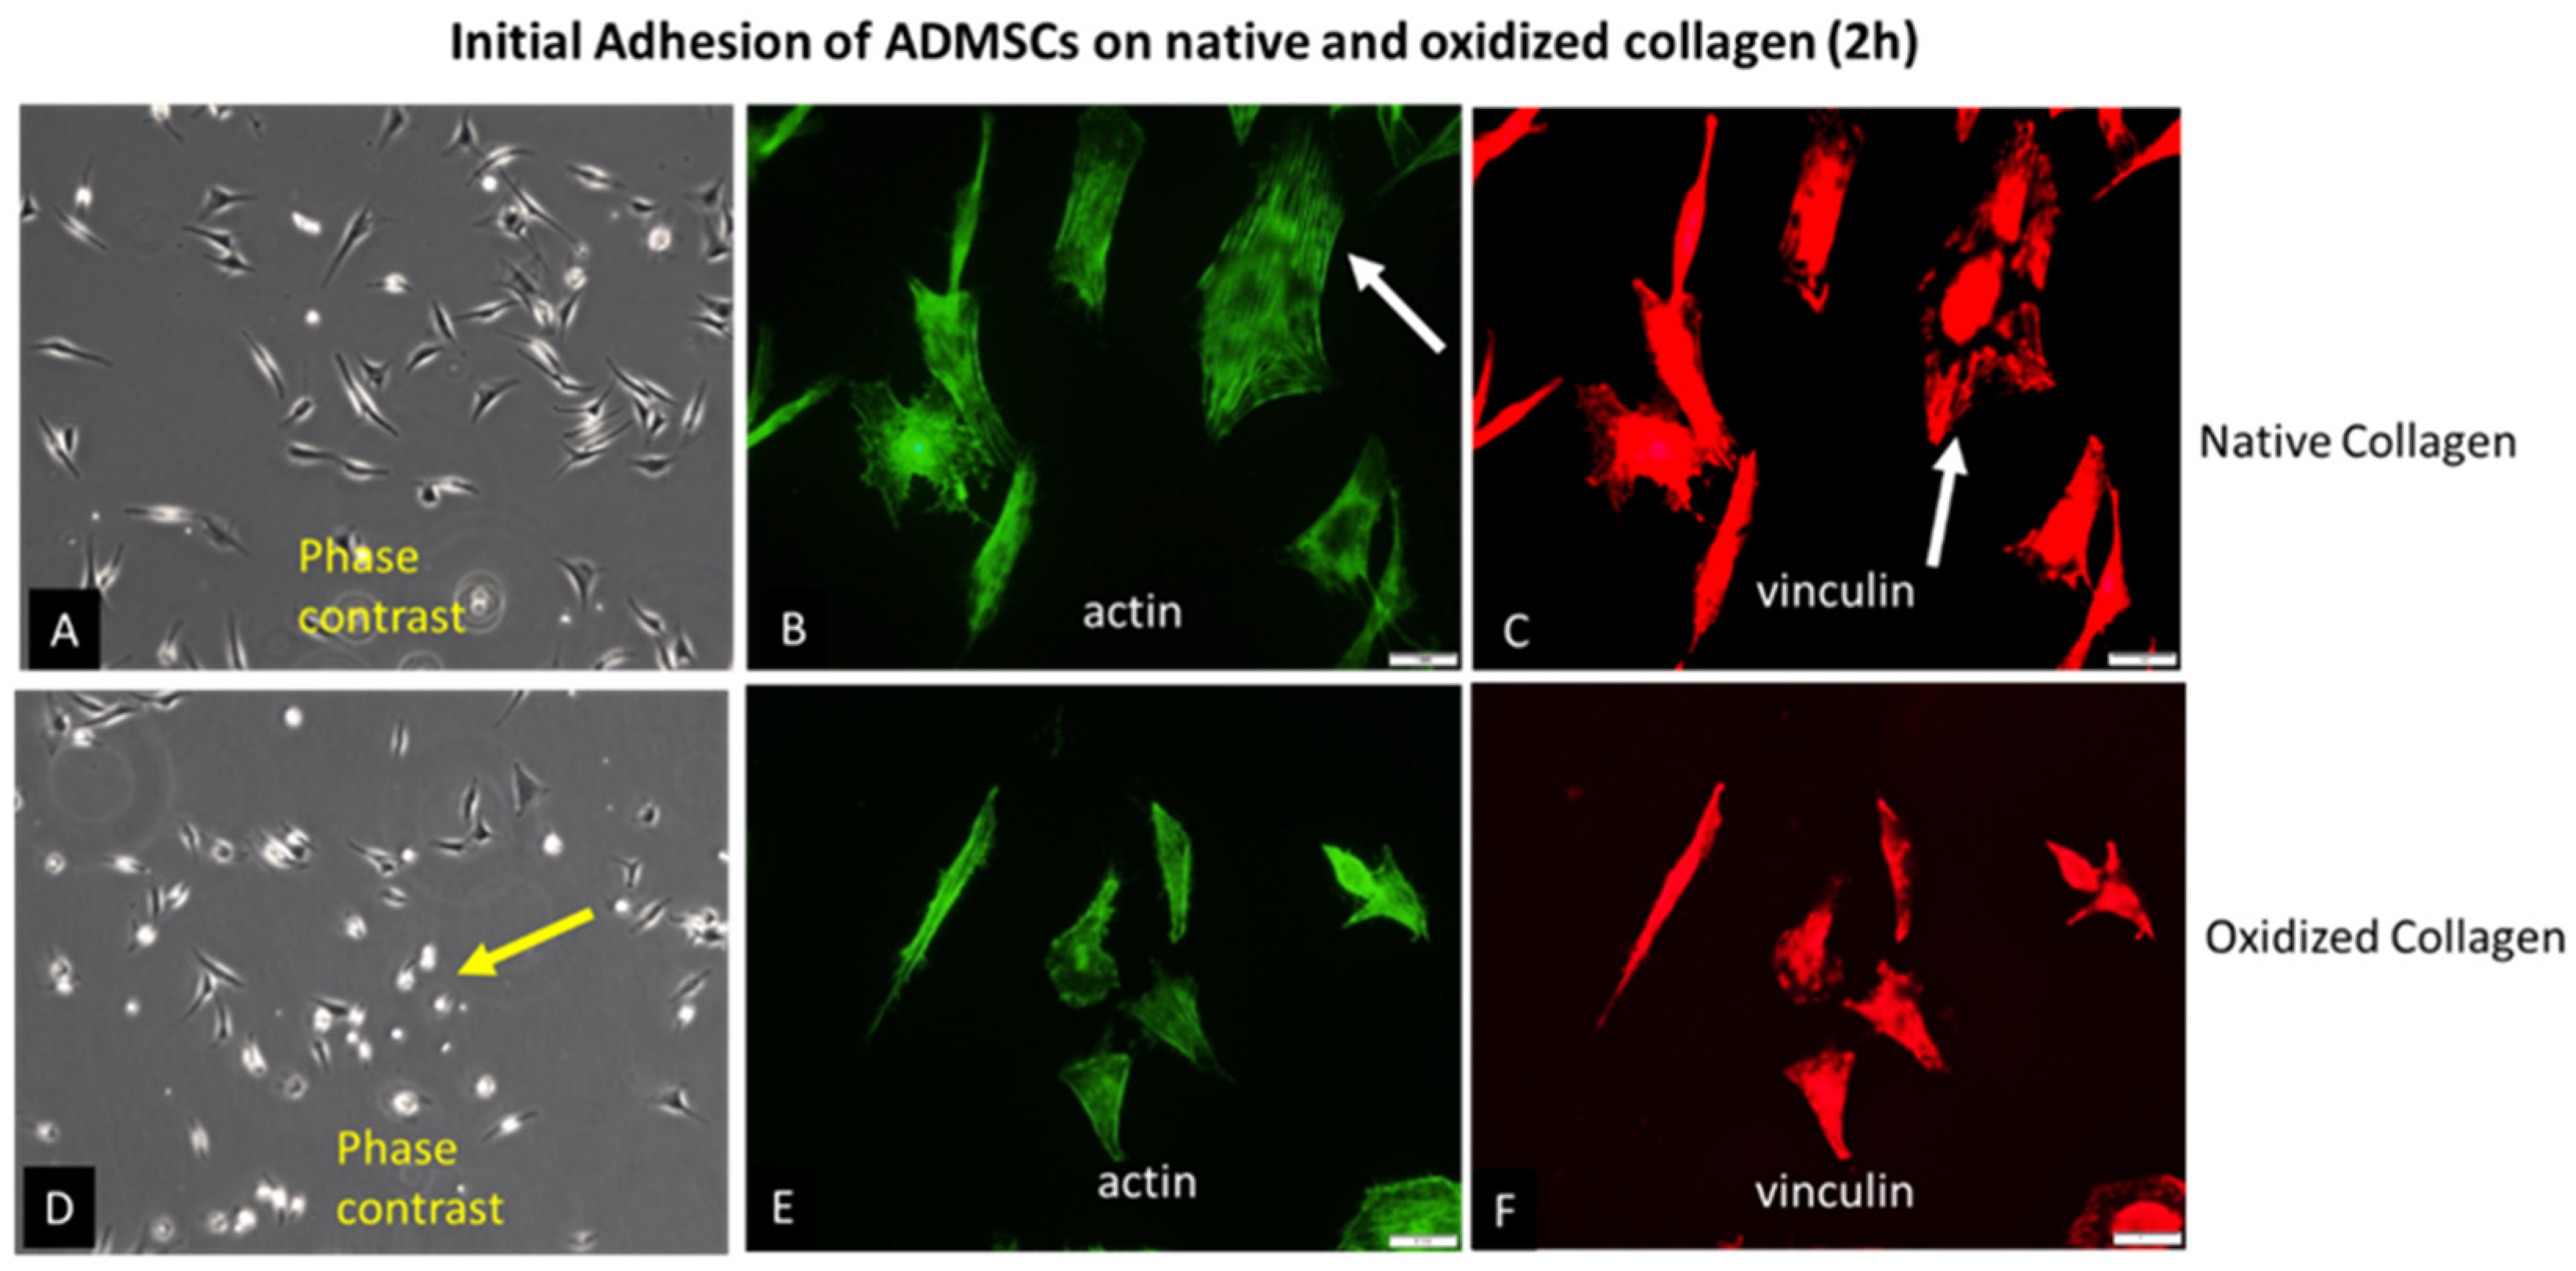
Figure 1. Initial adhesion of ADMSCs to native (A, B, C) and oxidized collagen (D, E, F) for 2 hours in serum free medium. The samples were viewed at 10x Phase contrast (A, D), or at 40X using the green channel of fluorescent microscope to view actin cytoskeleton (B, E) or red for focal adhesions (C, F). The yellow arrow on D point for a delayed spreading of ADMSC on oxidized collagen (more rounded cells), while withe arrows on B and C point the better actin cytoskeleton development and focal adhesions formation in native collagen samples when compared to oxidized counterparts (E and F, respectively). Bars on B, C, E and F are 20 μm.
Preprints 67199 g001
Figure 2. The approximately equal cell spreading (A, D) corroborates with the similar actin cytoskeleton development (B, E) and focal adhesions formation (C, F) at 24th hour of ADMSC adhesion to native (upper row) and oxidized collagen (bottom row). Bar 10 μm.
Preprints 67199 g002
Figure 3. Immunofluorescent visualization of YAP/TAZ activity in ADMSCs adhering on native (A, B, C) and oxidized collagen samples (D, E, F). One and the same field was viewed at different channels of microscope: red (actin cytoskeleton): blue (nucleus) and green (for TAZ activity).
Preprints 67199 g003
Figure 4. Representative 2D AFM images of native (A), oxidized (B), and denatured (C) collagen; the corresponding 3D topographical images of the images of A, B, and C (D, E, and F) and cross-section plot shapes (G, H, and J) corresponding to the white lines in A, B, and C. The images were taken in tapping mode in air, at room temperature. The denaturation DSC profiles of native, oxidized, and denatured collagens were presented in panels J, K, and L, respectively.
Preprints 67199 g004
Table 1. Morphometric analysis of ADMSC adhering on native and oxidized collagen, including Cell Spreading Area, Cell shape index (CSI), Aspect ratio (AP) and corresponding р values.
Cellular Parameters Col Col-Oxi p
Cell spreading Area (μm2) 216.0 179.6 p> 0.05
Cell Shape Index (CSI) 0.25 0.33 p< 0.05
Cell Aspect ratio (CAR) 3.33 2.61 p> 0.05
Table 2. Focal adhesions formation: Number of FA, Total area of FA and Mean area per FA.
Cell Col Col-Oxi p
Number of FA 317 143 p <0.05
Total FA area (μm2) 1085 406 p <0.05
Mean area per FA (μm2) 3.66 2.84 p >0.05
Table 3. Nuclear and Cytosolic TAZ values and their ratio.
Parameters Col Col-Oxi p
Nuclear TAZ (pixels) 229.3 178.2 p <0.05
Cytosolic TAZ (pixels) 1.3 12.4 p <0.05
Ratio TAZ Nuclei/TAZ Cytosol 176.2 14.4 p >0.05
Table 4. Morphometric analysis of ADMSC nuclei adhering on native and oxidized collagen: Total Nuclear Area, Nuclear Area per cell, Nuclear Shape Index (NCI), Nuclear Aspect ratio (NAP) and corresponding р values.
Nuclear Parameters Col Col-Oxi p
Nuclear Area per cell (M2 ) 17.01 21.2 p< 0.05
Nuclear Shape Index (NCI) 0.81 0.86 p> 0.05
Nuclear Aspect ratio (NAR) 1.68 1.34 p> 0.05
Table 5. Roughness values and Young’s modulus calculated for native, oxidized, and denatured collagen.
Samples RRMS (nm) Ea (MPa)
Collagen native 27.95 ± 5.1 56.6 ± 8
Col-Oxidized 5.51 ± 0.8 66.8 ± 5
Col denatured 1.04 ± 0.6 3610 ± 59
Disclaimer/Publisher’s Note: The statements, opinions and data contained in all publications are solely those of the individual author(s) and contributor(s) and not of MDPI and/or the editor(s). MDPI and/or the editor(s) disclaim responsibility for any injury to people or property resulting from any ideas, methods, instructions or products referred to in the content.
Copyright: This open access article is published under a Creative Commons CC BY 4.0 license, which permit the free download, distribution, and reuse, provided that the author and preprint are cited in any reuse.
Prerpints.org logo

Preprints.org is a free preprint server supported by MDPI in Basel, Switzerland.

Subscribe

© 2024 MDPI (Basel, Switzerland) unless otherwise stated