1. Introduction
Fusarium oxysporum Schlechtend.:Fr. is an anamorphic species complex comprised of saprophytes and plant colonizers. The second group of strains may live inside the plant roots as endophytes or infect and cause disease in many important crops. However, the pathogenic individual isolates generally are able to infect only a single species, or a small group of them, which allows to classify them into host-specific forms known as formae speciales [
1].
The wide pathogenic ability of
F. oxysporum as species complex but restricted specificity at the strain level is surprising in comparison with other species of the genus Fusarium, such as
Fusarium graminearum and
Fusarium verticillioides. Recently, 106 formae speciales have been well document and 37 more have been reported but insufficiently documented [
2]. Although
F. oxysporum is mostly a plant colonizer its abilities are not restricted to the vegetal kingdom. There have been described isolates able to infect
Caenorhabditis elegans [
3], mice and humans [
4]. The genetic basis responsible for this versatility probably rely in the particular architecture of the
F. oxysporum genome. The core genome, very similar among all the formae speciales sequenced to date and also to the related species
F. graminearum and
F. verticillioides, encompasses 11 chromosomes that contain genes required for basic metabolism and differentiation. The accessory genome, which spands several lineage-specific chromosomes and some parts of the core genome chromosomes, contains sophisticated genomic elements linked to pathogenicity, virulence and host specificity [
5,
6]. The term “accessory” relates to the fact that the genetic elements in this genome are not required for basic saprophytic growth and development.
Horizontal transfer of whole or partial chromosomes may explain how an endophytic or saprophytic strain may become pathogenic and also the diversification of formae speciales [
7,
8]. However, it is not the only mechanism as pathogenicity also may evolve independently [
7]. In this case, the most plausible scenario would imply mutation and functional diversification of preexisting genes in the core genome. To analyze this hypothesis a good starting point is the observation of how gene families have evolved and diversified.
Several gene families involved in pathogenicity and virulence have been described in
F. oxysporum. The two most important ones are the
SIX gene family of effectors [
9] and the
FTF gene family of transcription factors. Currenlty, 14
SIX genes have been identified in
F. oxysporum f. sp.
lycopersici. The corresponding proteins share the common feature of being “secreted in xylem”, but the coding genes are not phylogenetically related. On the contrary, the
FTF gene family is composed of a unique core genome gene,
FTF2, which is present in nonpathogenic strains and pathogenic strains of all formae speciales and encode a predicted polypeptide 1072 amino acids in length, and a variable number of
FTF1 paralogs [
10]. The number of paralogs range from a single one in formae speciales
arabidopsis and
conglutinans up to 10 in forma specialis
lycopersici race 2. These paralogs may be putative functional genes showing some variability in the length of the encoded proteins (from 930 to 1070-1079 amino acids) or putative nonfunctional truncated pseudogenes that show combinations of small and large deletions and premature stop codons. In most cases they are linked to transposons, which suggests that duplication and translocation may be involved in their origin and diversification.
The
FTF1 paralogs have been shown to be important virulence factors that are only expressed
in planta during host colonization [
11] and regulate the expression of some, if not all, the SIX effectors. The attenuation of
FTF gene expression by means of gene silencing results in a dramatic reduction of virulence and reduced expression of several
SIX genes. Gene replacement of the
FTF2 gene in a highly virulent strain results in a less important reduction of virulence towards the host plant (common bean) [
10].
In this work, we address the precise role of FTF2 in plant colonization, the nature of the genes regulated by this transcription factor and the type of defensive response that its expression induces in the plant host. We also propose a model to explain how the expression of the FTF gene family modulates virulence in F. oxysporum.
4. Discussion
It has been proposed that one of the main advantages of an accessory genome would be the acquisition of novel virulence factors that can expand host range [
26] or modify the colonizing abilities. Novel or modified gene functions evolved from gene duplications and subsequent divergence might be well tested in the context of accessory chromosomes. It is not easy to explain how this mechanism may produce entirely new proteins able to perform new functions, except that already existing transcription factors may change to alternative forms with different regulatory abilities, thus reprograming the expression of whole sets of genes. The best known pathogenicity chromosome in
F. oxysporum is chromosome 14 in the reference strain
F. oxysporum f. sp.
lycopersici 4287, which is part of the accessory genome. It contains 13 predicted transcription factor genes that cluster into nine families [
25]. Interestingly, all these transcription factors, except TF3, have a homologue in the core genome, which strongly support the hypothesis that they have evolved by gene duplication of the core genome homologues. In the case of the
FTF transcription factors gene family, the core genome homologue is
FTF2 (chromosome 9 in the reference strain), and all the
FTF1 paralogs are located in chromosomes pertaining to the accessory genome (chromosomes 3, 6, 14, 15 and the variable segment of chromosome 1) [
10]. In the highly virulent strains of
F. oxysporum f. sp.
phaseoli, where this gene family was first described [
8,
11,
14], all the
FTF1 paralogs are located in a small chromosome, likely homologue to chromosome 14 [
10,
11,
27].
To ascertain what advantages in terms of virulence may provide the FTF1 transcription factors a comparative analysis with FTF2 is required. In a former work we generated null
FTF2 mutants from a highly virulent strain (FOP-SP1) to analyze
FTF1 when
FTF2 is inactive [
10]. In the present work we describe and analyze null
FTF2 mutants from a weakly virulent strain (FOP-SP4), which is devoid of all the
FTF1 paralogs, with the aim to study the phenotypic effect of the complete absence of
FTF genes.
First, multiple alignments and three-dimensional modelling were carried out to identify differences in the predicted spatial structure of the two main domains: the Zn(II)
2Cys
6 binuclear cluster and the middle homology region. No significative differences were found in the former one that might account for differences in DNA binding capabilities. The MHR domain is involved in the regulation of the activity of Zn(II)
2Cys
6 binuclear transcription factors [
28]. The crystal structure of Cep3, a fungal transcription factor containing a MHR region has showed that this region contains eight motifs included in an all-alpha domain, called MHD (Middle Homology Domain) [
29,
30]. The multiple alignment of the amino acid sequences that encomprise MHD indicates that this domain shows some diversity, both in comparison to FTF2 and among the FTF1 proteins. However, the 3D analysis did not show any evidence that those differences might be correlated with modifications of the basic all-alpha domain. It cannot be ruled out that some of the polymorphisms observed may alter the function of the corresponding FTF1 proteins. However, both the alignment and the 3D modelling do not show changes in the all-alpha domain between FTF2 and all the FTF1 proteins that may suggest differences in the regulation abilities of both types of transcription factors.
Mutants altered in
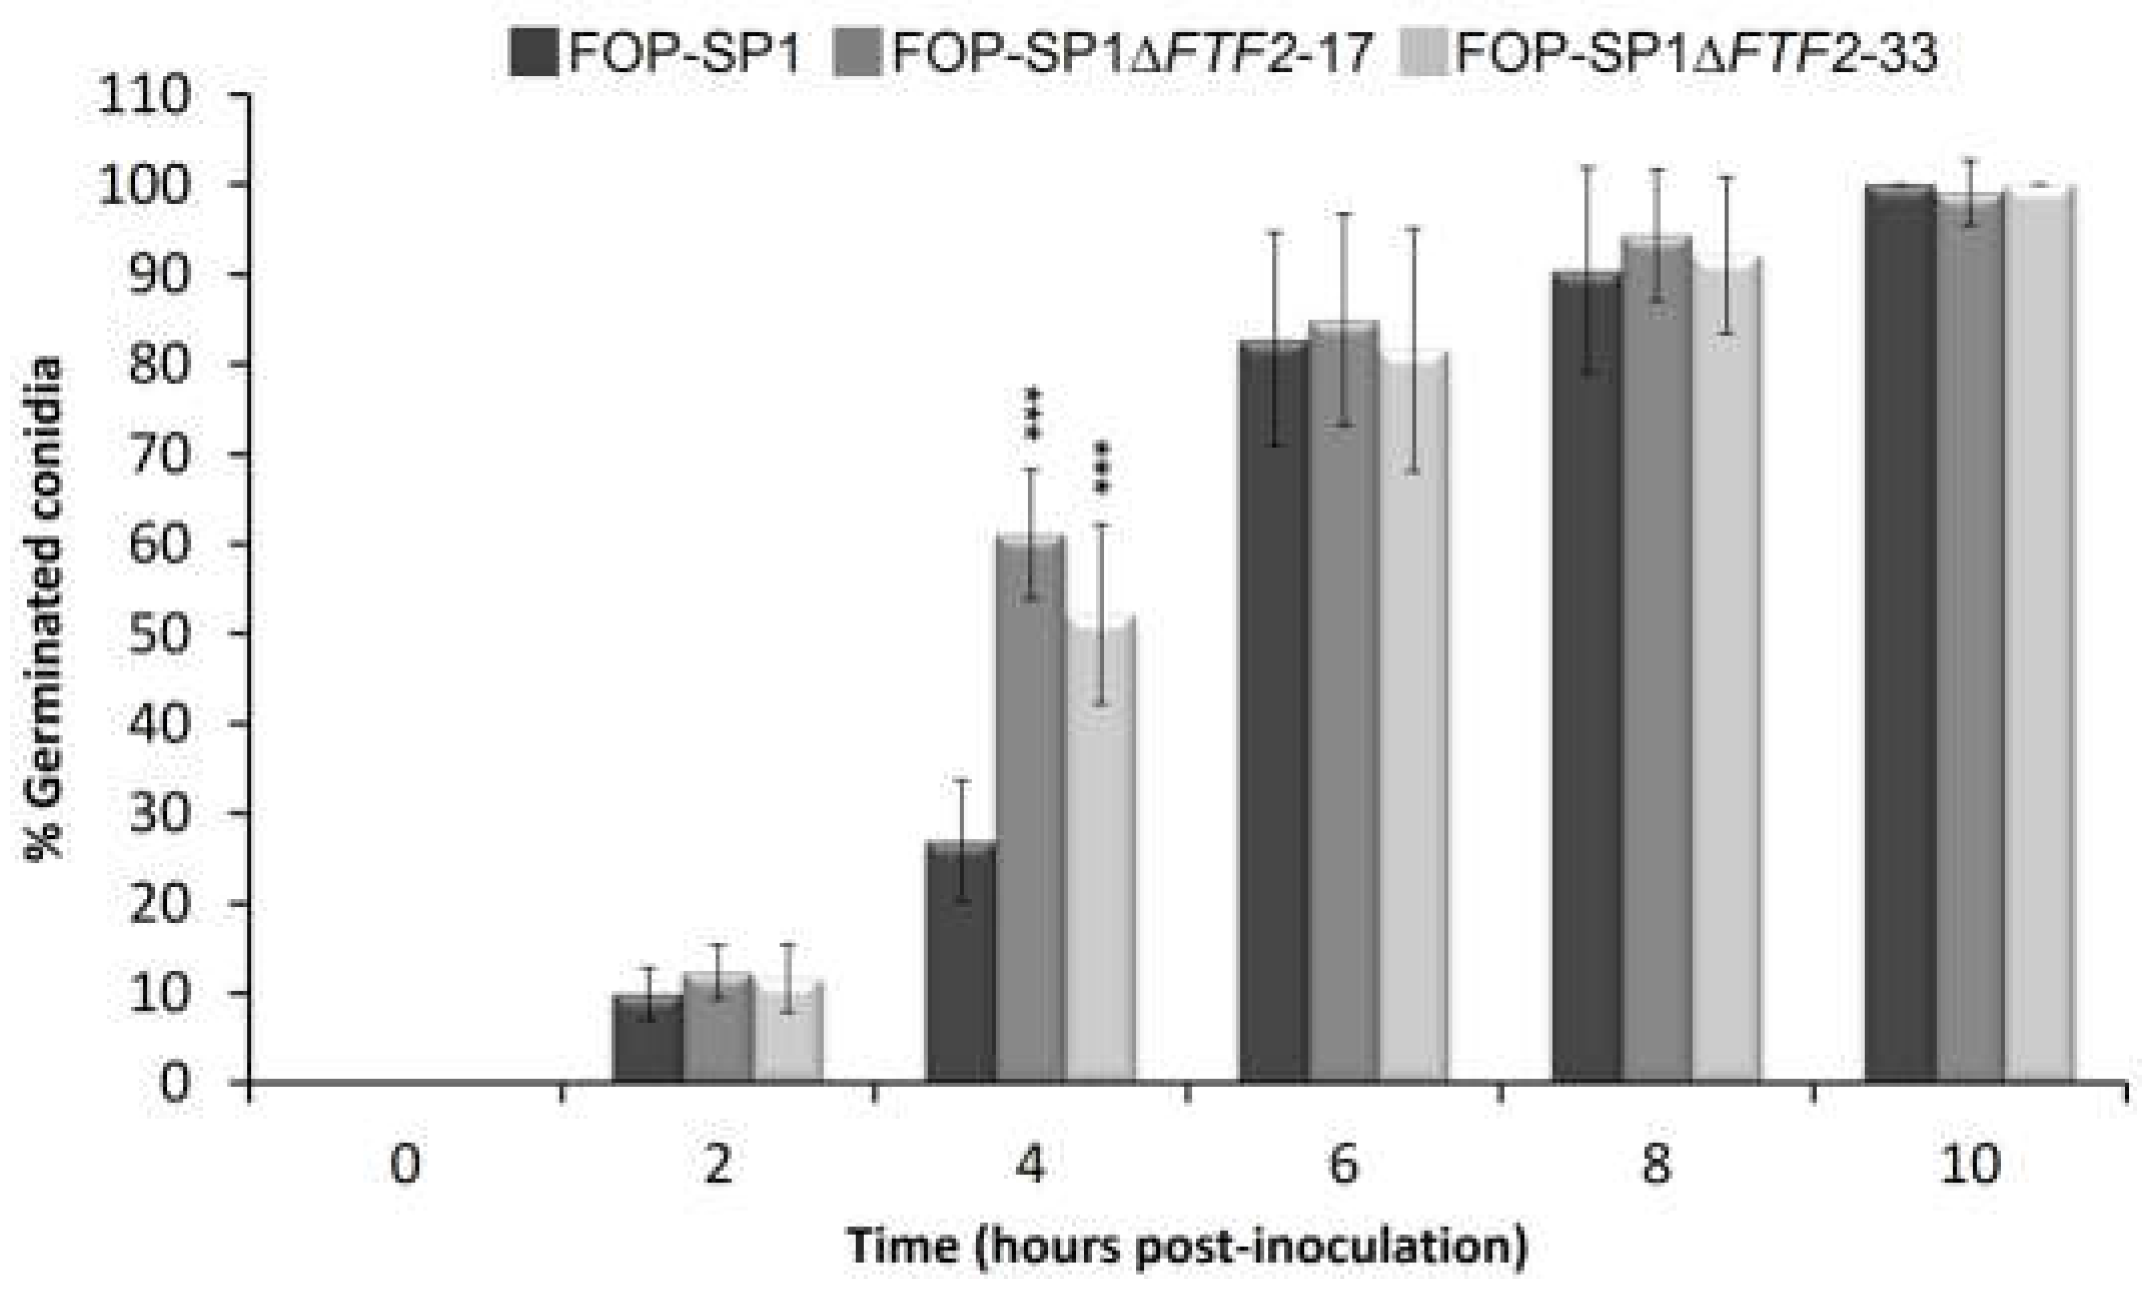
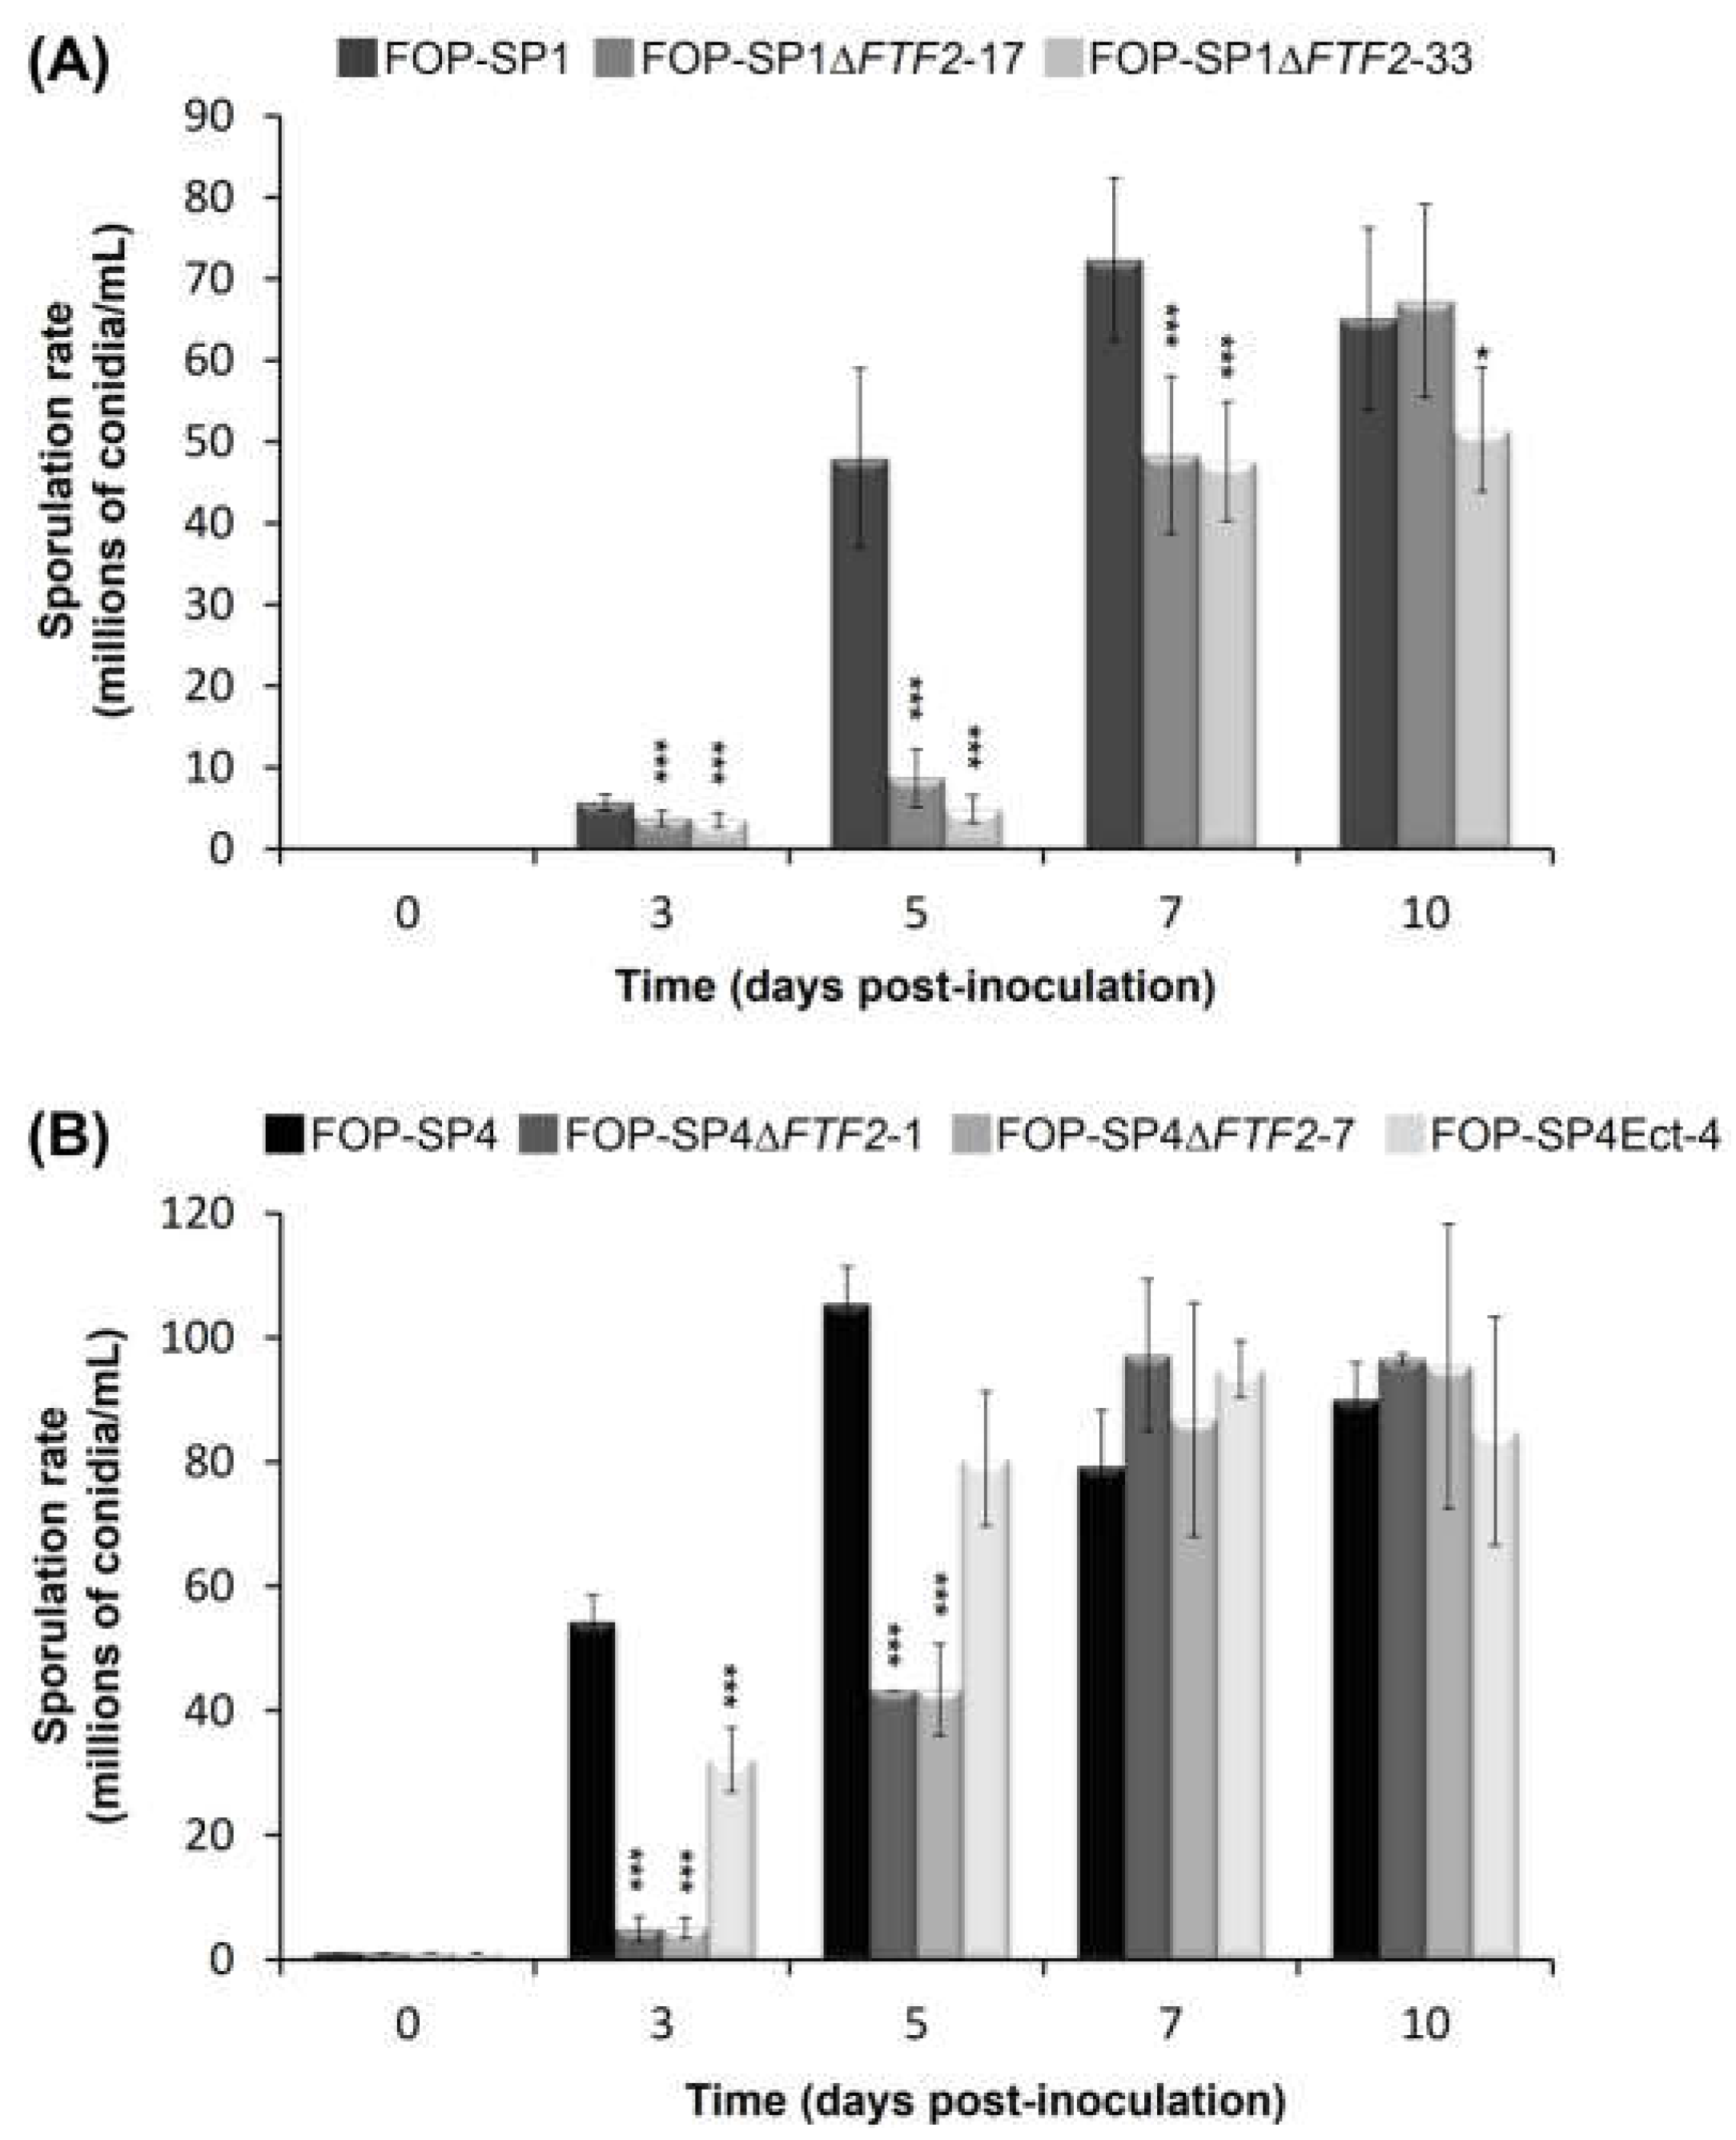
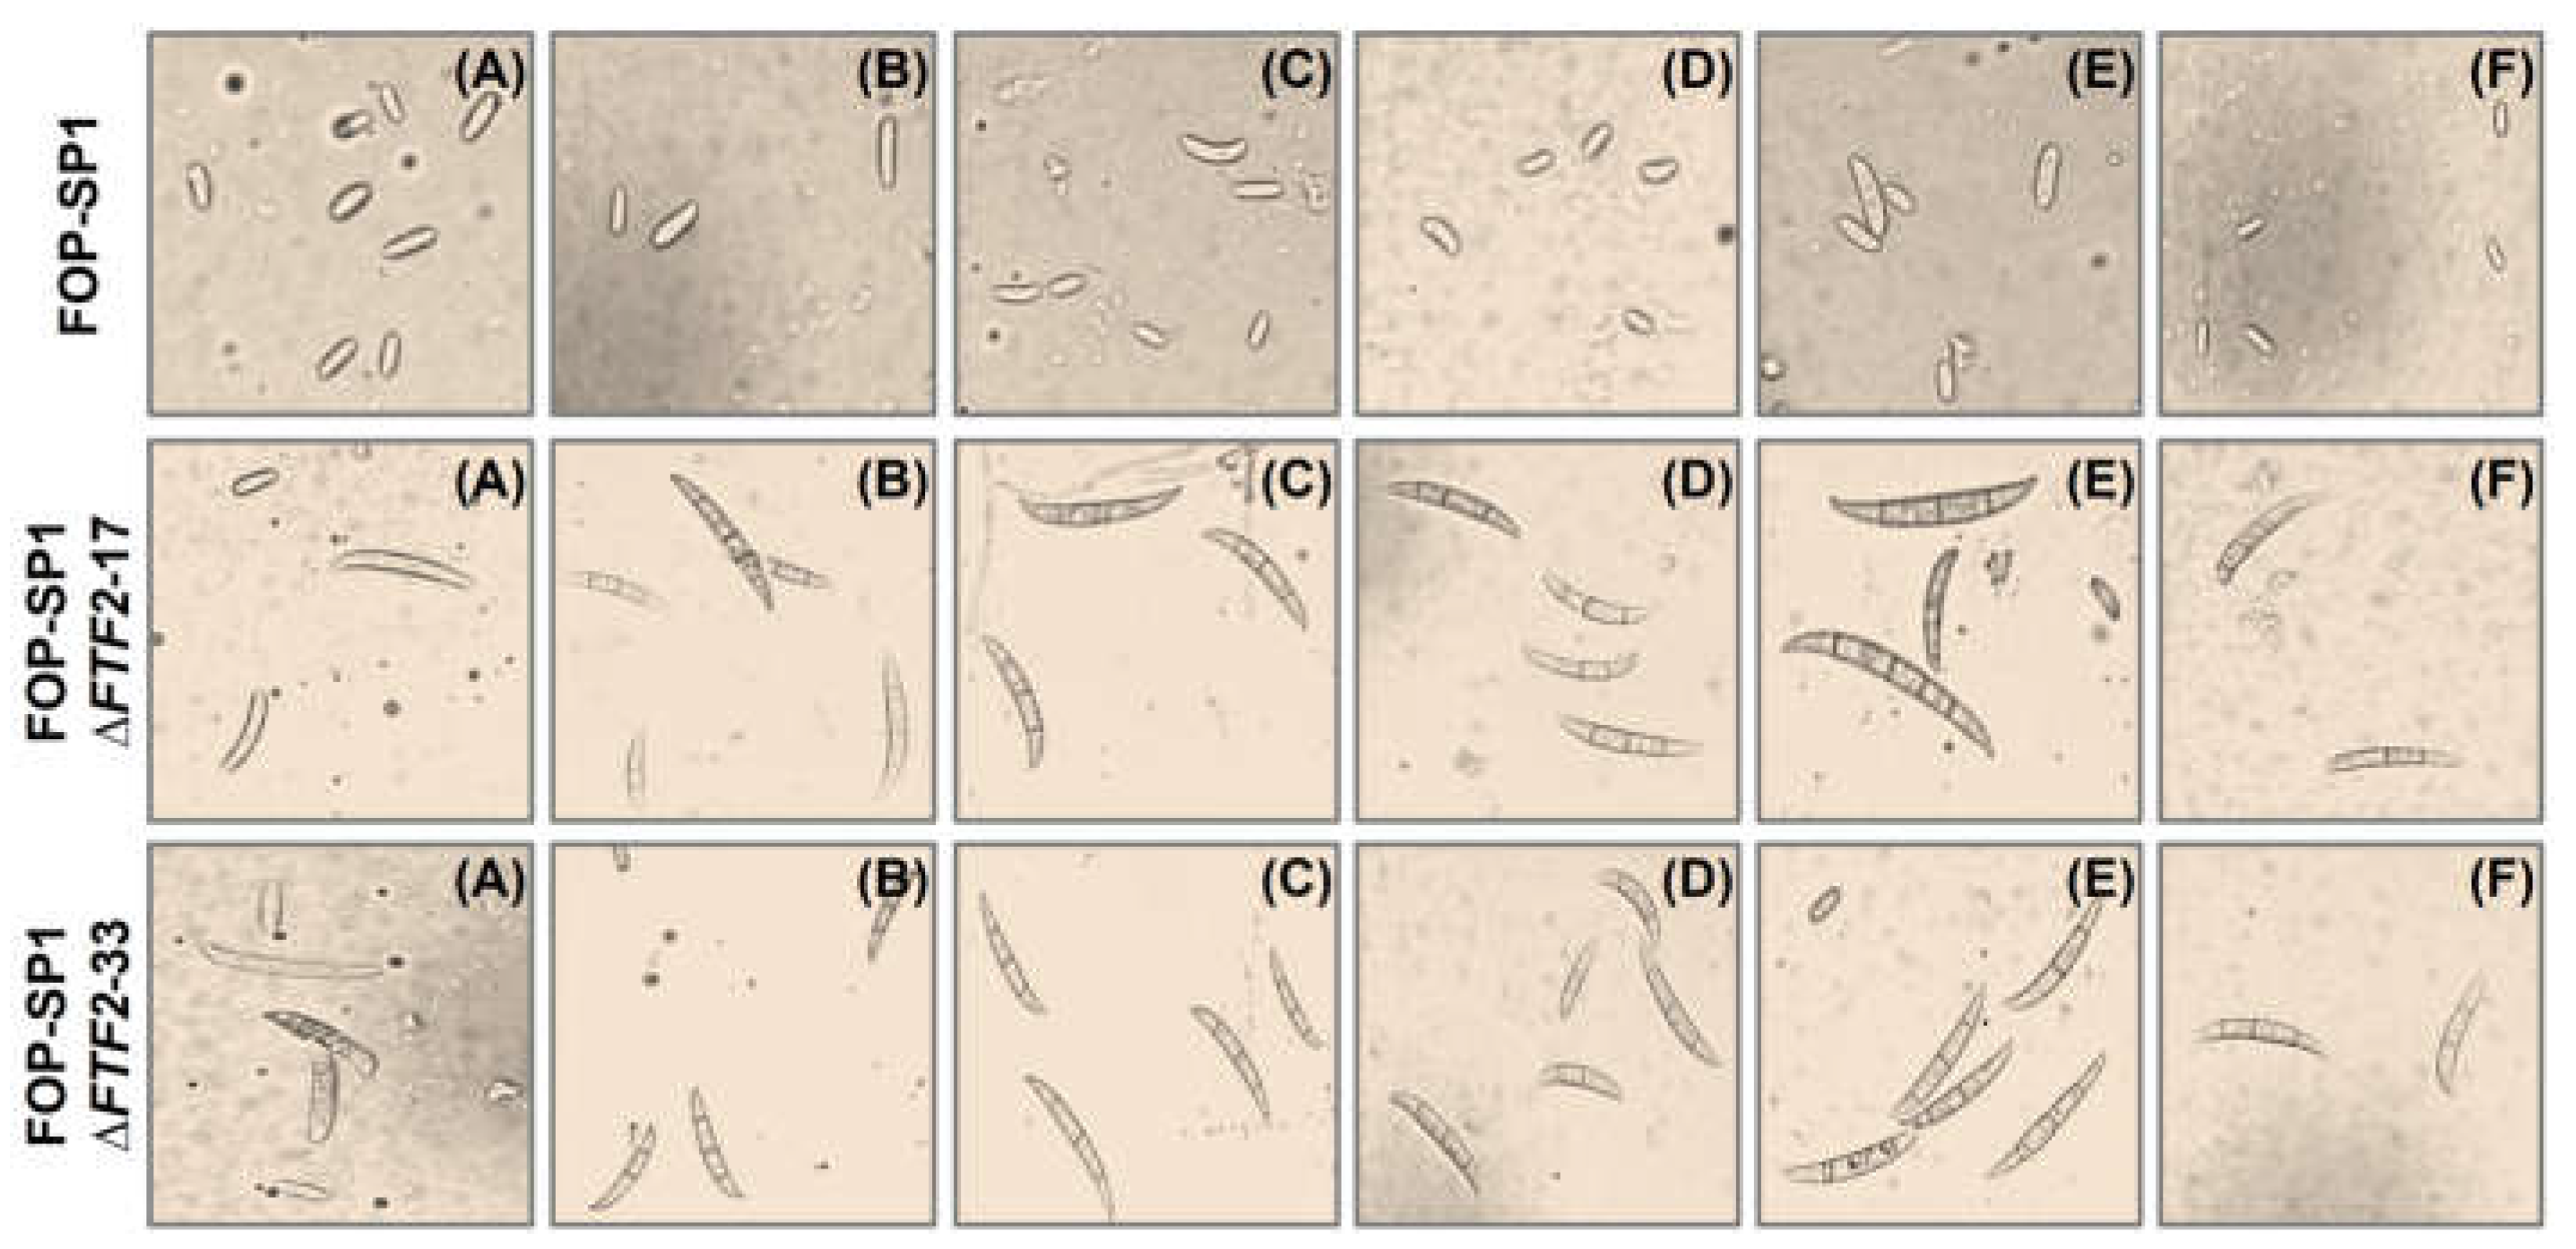
FTF2 showed slight differences with the wild types in sporulation and germination rates. However, the most striking difference was the drastic increase in the production of macroconidia when grown in solid media (either PDA or minimal medium supplemented with different carbon sources). Several transcription regulators essential for conidiation have been described in
F. oxysporum. REN1 is required for normal development of micro and macronidia [
31], while STUA is a positive regulator for the development of macroconidia and a negative regulator for the development of chlamydospores [
32]. Also, several components of the Velvet complex are involved in conidiation. Disruption of
veA,
velB and
velC causes a derepression of conidiation and an increase in the shape of microconidia [
33]. The phenotype displayed in solid media by the
FTF2 mutants is different to the above described and strongly suggests that FTF2 might be a negative regulator of the production of macroconidia.
FTF2 mutants show a slight reduction in virulence [
10] but whether this is caused by an enhanced plant defensive response or a reduction in colonization capabilities has not been dilucidated. The results here reported strongly indicate that both causes contribute to the observed reduction. The plant colonization pattern exhibited by the
FTF2 mutant here analyzed is characterized by first, a reduced ability to colonize the root system at early stages, and second, an increased ratio of parenchymal colonization versus vascular colonization at later stages. Both features are also distinctive of the colonization patterns exhibited by weakly virulent strains [
20] and mutants attenuated in the expression of the
FTF genes [
10], although the
FTF2 mutants are more virulent than the mutants attenuated in the
FTF genes and as virulent as the weakly virulent strains. The reduced colonization of the root system is not a consequence of the reduction of fungal biomass, as it was also observed for the weakly virulent strains [
20]. Our results strongly support the role of the
FTF1 paralogs as critically required for massive colonization of the vascular system, which results in enhanced virulence towards the host plant. The higher rate of parenchymal colonization displayed by the
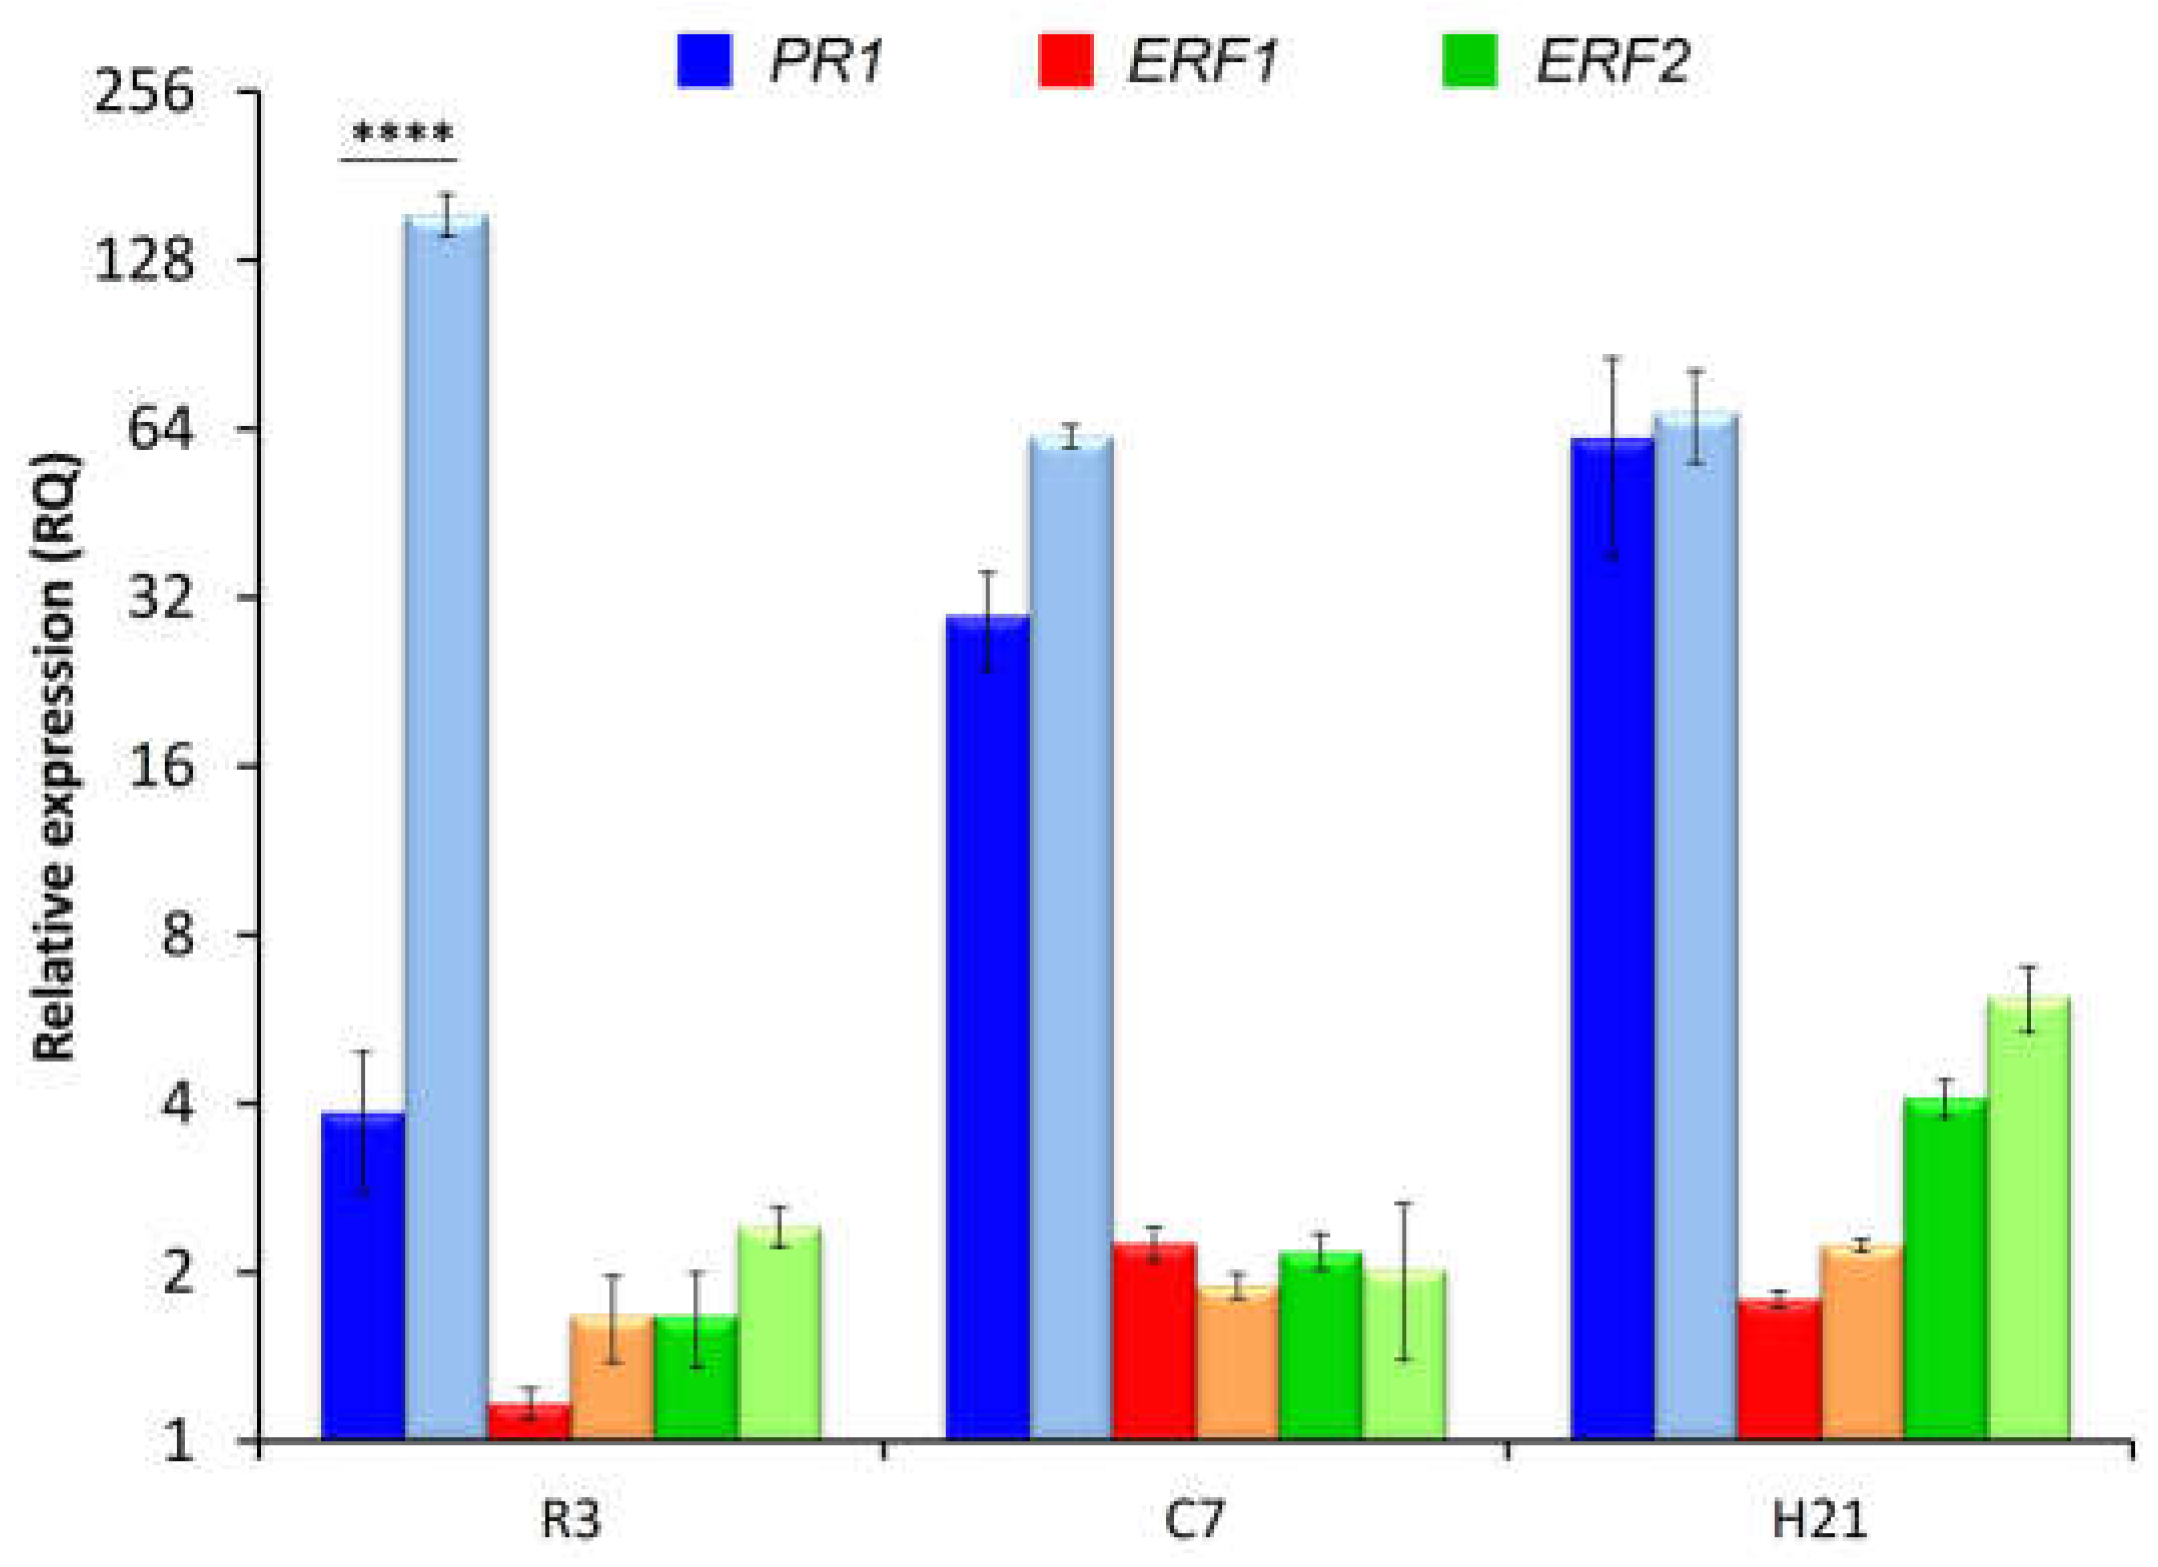
FTF2 mutant correlates with an increased expression of
PR1 by the host plant. This result agrees with former reports on the colonization pattern showed by weakly virulent strains [
20].
Taking together all these observations, two basic plant colonization patterns by F. oxysporum may be depicted. Naturally occurring weakly virulent strains (such as FOP-SP4) or mutants with an altered expression of virulence factors (such as those defective in FTF2 or attenuated in the FTF genes) show an increase in the parenchymal/vascular colonization ratio that correlates with an induction of the host defensive response mediated by SA (as shown by the increased expression of PR1). On the opposite, highly virulent strains quickly enter the vascular cylinder and spread through the xylem vessels of the host plant. This rapid progression towards the vasculature of the plant requires avoidance of the SA mediated plant defensive response and high expression of all the members of the FTF gene family.
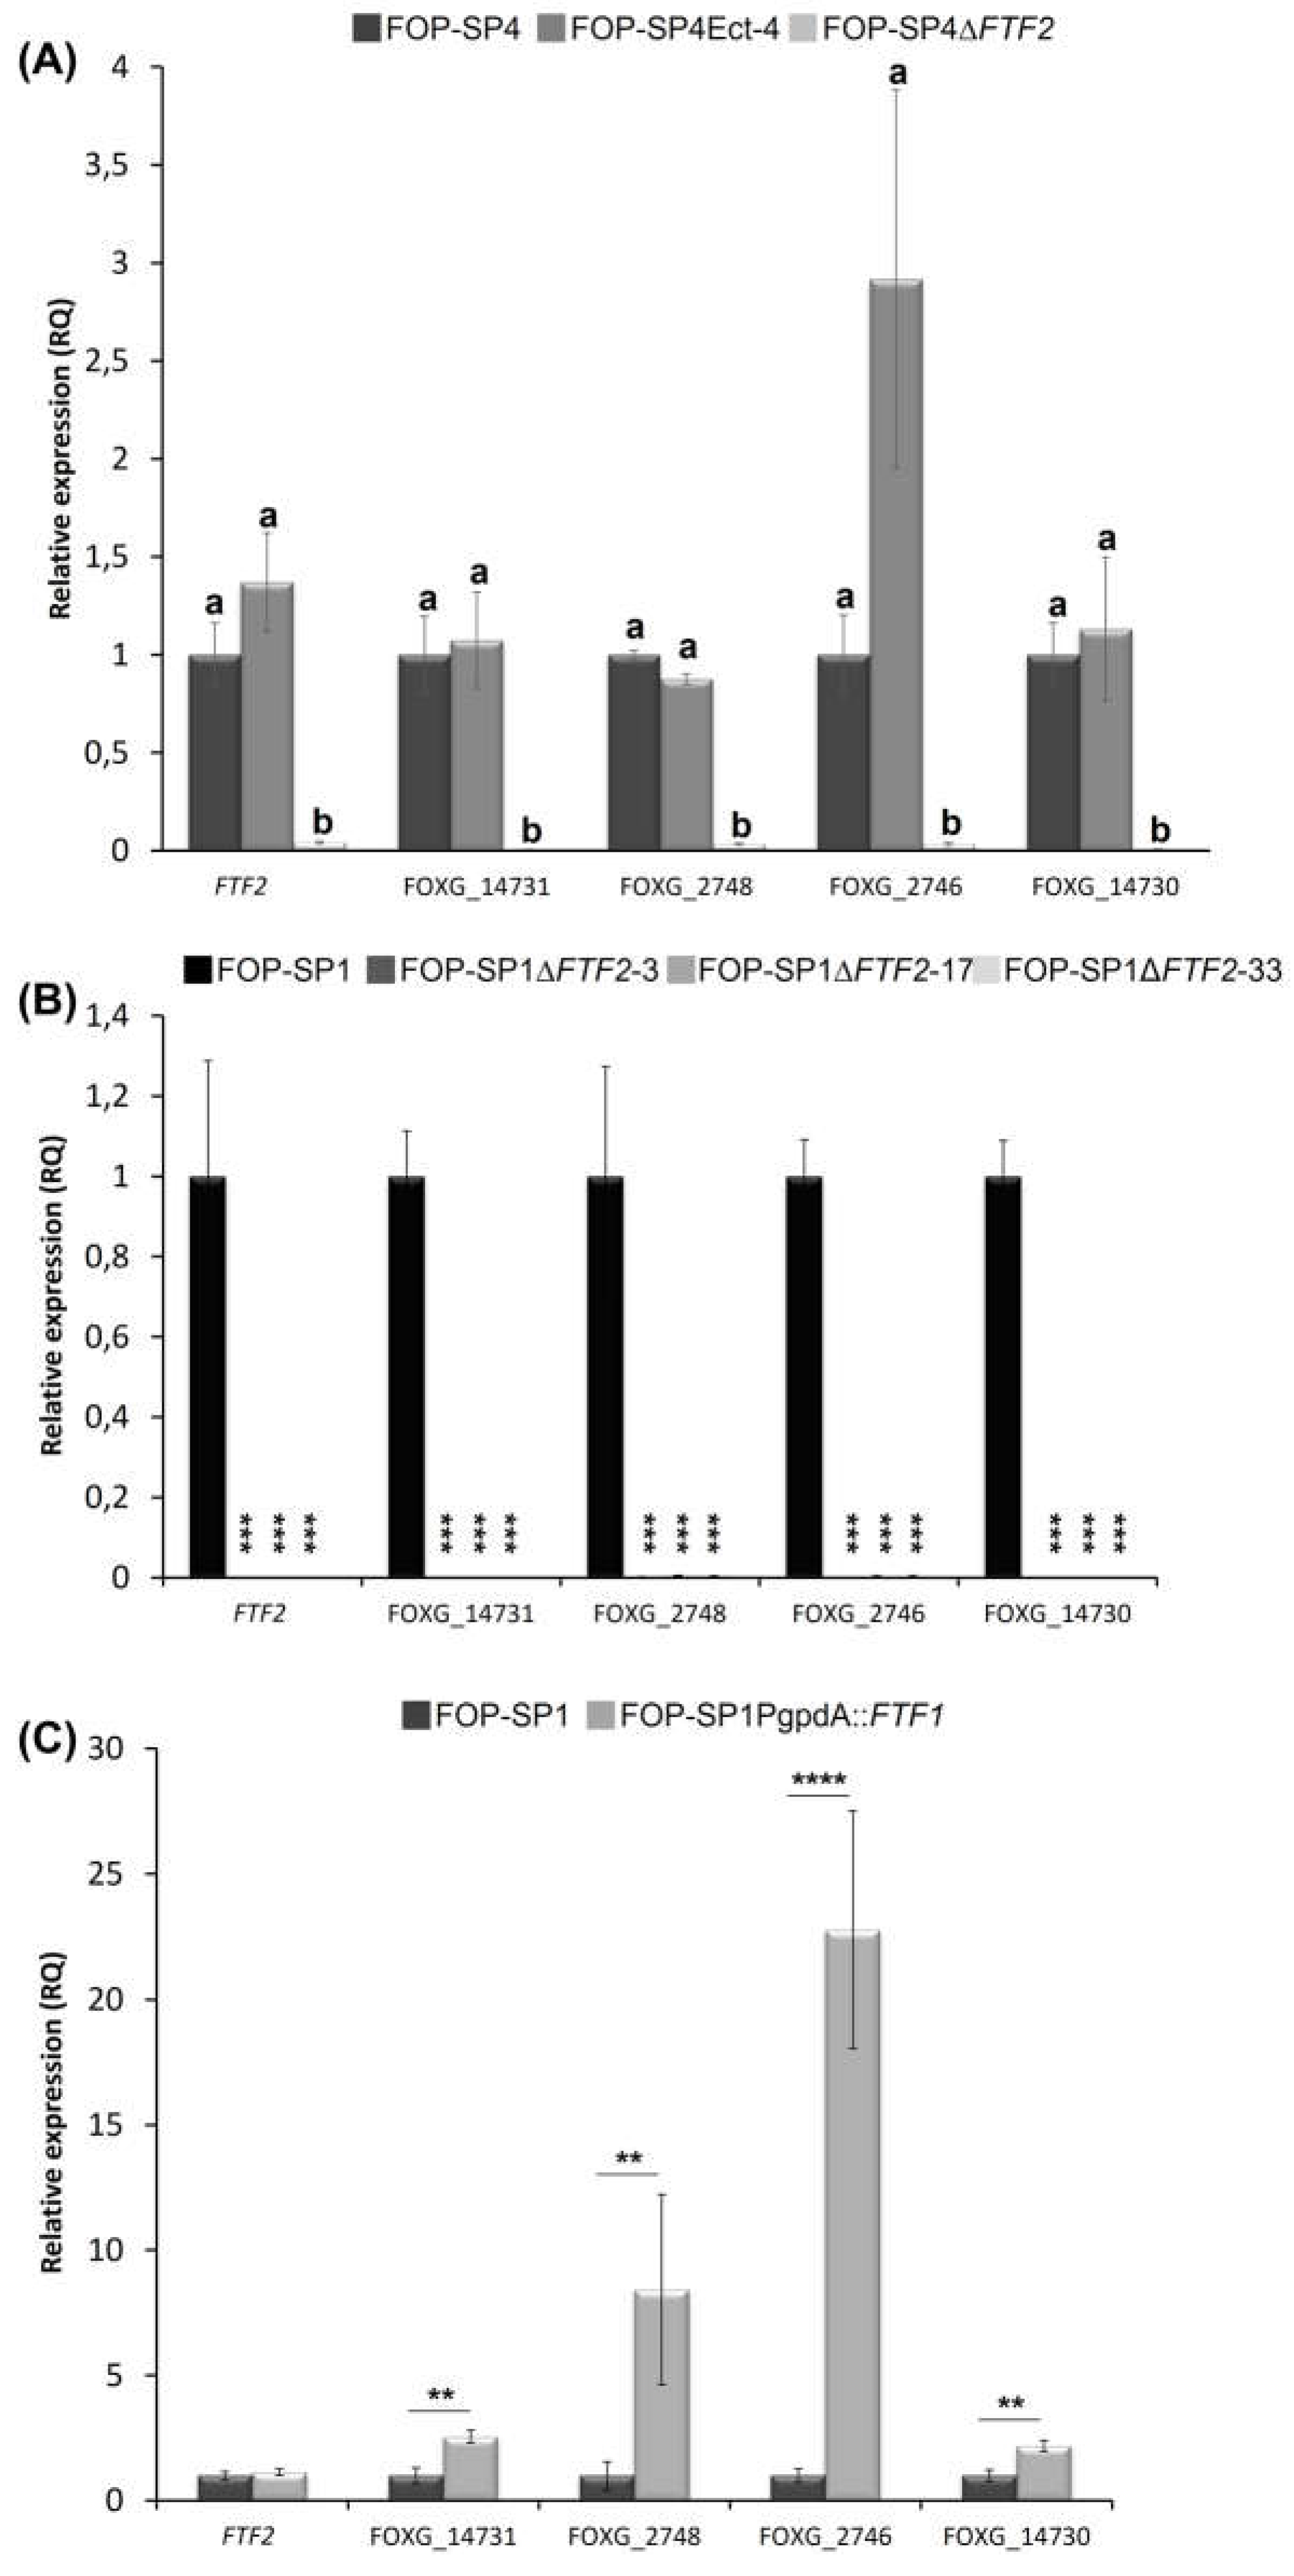
The structure of the functional domains in FTF2 and FTF1 do no suggest functional differences between both transcription factors. However, we show that, at least under different growing conditions, they regulate different genes. The genes encoding for a hydrophobin II, the protein with SET domain and the oxygenase do not show detectable expression during plant colonization by the FOP-SP1 mutant that lacks FTF2, although they respond to FTF1 overexpression during in culture growth. These results demonstrate that although FTF1 may potentially regulate these genes, their naturally occurring regulation, both in culture and in planta, correspond to FTF2.
Among the five genes selected to verify their possible regulation by FTF2, loci FOXG_02748 and FOXG_02746 are predicted to encode fungal hydrophobins. Hydrophobins are low molecular weight secreted proteins. They are characterized by moderate to high levels of hydrophobicity and the presence of eight conserved cysteines [
34]. The stablished role for hydrophobins in fungi is to form a layer that allows fungal structures to breach the air-water interface or prevent water-logging [
35]. They are also involved in rendering the conidial surface hydrophobic and resistant to water, thus facilitating dispersal of spores in the air [
36]. Surface hydrophobins play a role in preventing immune recognition of airborne fungal spores [
37]. Hydrophobins have been shown to play a role in fungal plant pathogenicity as mutants altered in their expression show reduced virulence towards the host plant [
38,
39,
40]. This contribution to virulence has also been confirmed in
F. graminearum, as mutants deficient in hydrophobins FgHyd2 and FgHyd3 show reduced growth and ability to penetrate through the water-air interface in the plant host. [
41]. Regulation of the expression of hydrophobin encoding genes by FTF2 suggests the involvement of this transcription factor in conidia production and also in plant colonization, in accordance with the phenotype described for null mutants. These results are in line with those reported for another xylem colonizer such as
Verticillium dahliae, which is able to produce hydrophobins in tomato xylem sap [
42].
Transcriptomic analysis carried out in
FTF2 overexpression mutants of
F. oxysporum f. sp.
lycopersici suggested that two SIX efectors (SIX1 and SIX6) are regulated by FTF2 [
25]. Our results confirm this role, as both SIX1 and SIX6 are downregulated in FOP-SP1
DFTF2 mutants during host colonization. Previously it had been shown that SIX1 and SIX6 are under positive control of the
FTF1 paralogs [
10]. The results here presented extend positive control of SIX effectors to the whole
FTF gene family. Taking into account the differential expression of the members of the family in the time spatial frame of plant colonization, it is likely that a fine modulation of the expression of the effectors take place.
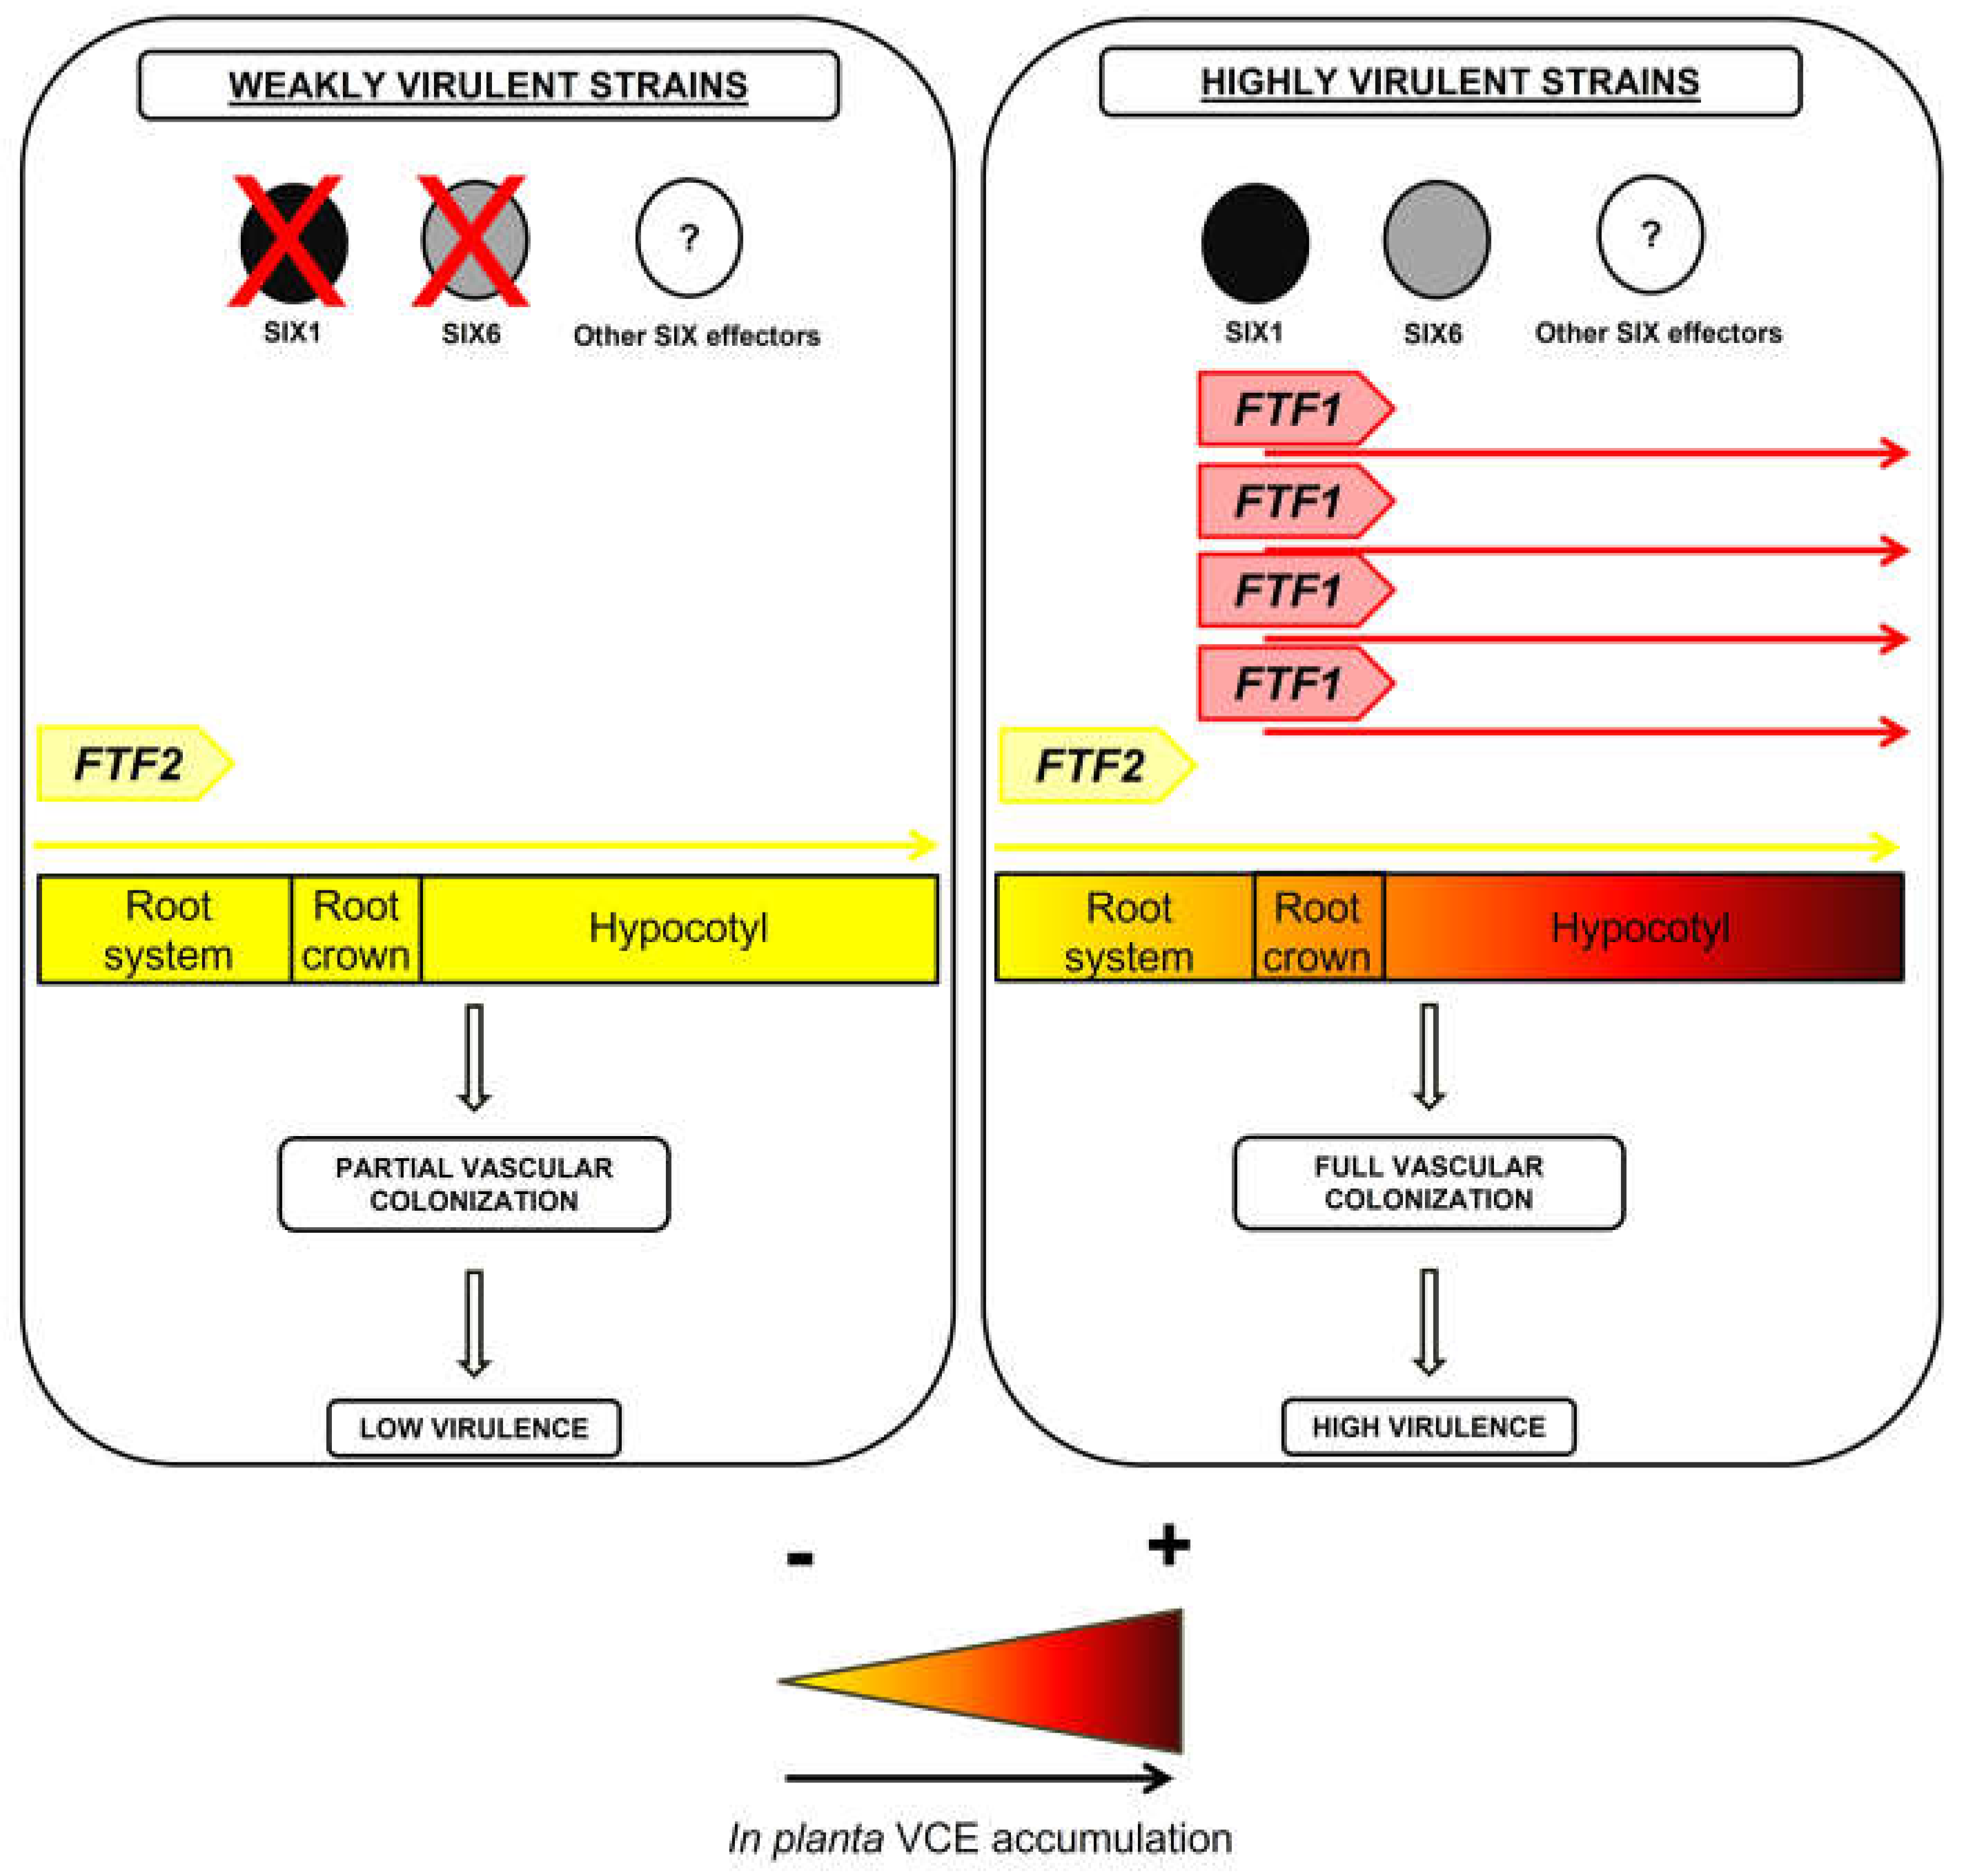
We propose the model depicted in
Figure 9 to explain the role of the FTF family of transcription factors in plant colonization and the severity of disease produced by
F. oxysporum [
27]. Virulence and the degree of symptoms produced in the host would be the consequence of a cumulative expression of the active members of the
FTF gene family and the repertoire of effectors present in the fungal strain. Lack of
FTF1 paralogs and a reduced number of
SIX effectors would result in mild symptoms, as those displayed by weakly virulent strains. On the other hand, an extended set of effectors and several active copies of the
FTF1 paralogs would drastically increase the severity of disease (including death of the plant), as happens in the infections produced by highly virulent strains. This model predicts probable genetic features of
F. oxysporum endophytes. As these strains are able to colonize plant parenchymal tissues with almost no growth inside the vasculature, they should lack
FTF1 paralogs and show a reduced effector gene repertoire. A recent study conducted with
F. oxysporum endophytes and more than 100 pathogenic strains confirms this prediction. It was found that a pathogenic lifestyle is associated with extended effector gene catalogs, while the endophytes analyzed clustered together based on the scarcity of effector candidates in their genomes [
43]. Although no data on the presence of
FTF1 is provided in the study, all the endophytic
F. oxysporum strains we have analyzed to date are devoid of
FTF1 copies, as it happens for the weakly virulent strains (data not shown). Moreover, the presence of
FTF1 is proof of virulence [
18].
The expression of the
FTF gene family members to regulate virulence offers a good example of coordinated crosstalk between elements of the core genome and the accesory genome in
F. oxysporum. It has been suggested the need of a spatial association between the gene expansion of transcription factors and their regulated genes [
44]. However, there is no association between
FTF2 (chromosome 9) and the target genes
SIX1 and
SIX6 (chromosome 14), thus showing that transcription factors in the core genome may regulate effector genes in the accessory genome.
Figure 2.
Sporulation rates of FOP-SP1ΔFTF2 (A) and FOP-SP4ΔFTF2 (B) strains. Mutants and wild-type strains were cultured in PDB media for a maximum period of 10 days. Each bar represents the media ± standard deviation of three independent biological experiments. Significant differences were tested using an ANOVA analysis followed by a Dunnett´s test and are indicated by * (P < 0.05) and *** (P < 0.001).
Figure 4.
Macroconidia production by FOP-SP1ΔFTF2 strains. Fungal strains were inoculated on synthetic solid media (PDA -A-, and minimal medium amended with NaNO3 as nitrogen source and glucose -B-, sucrose -C-, xylose -D-, mannose -E- or glycerol -F- as carbon source) under controlled conditions (25°C and a 16/8 h light/dark photoperiod). The conidia were harvested 6 days post-inoculation. Images of a suspension of harvested conidia were taken using a Leica DC300F camera adapted to the Leica DLMB microscope (Leica Microsystems, Bensheim, Germany).
Figure 5.
Common bean colonization by FOP-SP1ΔFTF2 mutant. Sections of plants colonized by FOP-SP1 and a selected FOP-SP1ΔFTF2 mutant were double-stained with WGA Alexa FluorTM 488 and propidium iodide. Confocal laser microscopy was used to visualize the progress of in planta growth. Sections from the root system (A-F) were sliced at 1 (A, D), 2 (B, E) and 3 (C, F) dpi, from the root crown (G-J) at 5 (G, I) and 7 (H, J) dpi, and from hypocotyls (K-N) at 14 (K, M) and 21 (L, N) dpi. Upper images in each panel show plant tissues colonized by FOP-SP1, while bottom images correspond to the FOP-SP1ΔFTF2 mutant.
Figure 6.
RT-qPCR analysis of expression of common bean genes involved in the defense response (PR1, Pathogenesis Response; ERF, Ethylene Response Factors) in inoculated plants. The plant regions assayed and the time intervals after inoculation are indicated in the X axis (R3, root system 3 dpi; C7, root crown 7 dpi; H21, hypocotyls 21 dpi). The relative expression measurements in the Y axis are indicated in a logarithmic scale. Dark bars of each color indicate gene expression in plants colonized by FOP-SP1; light bars indicate gene expression in plants colonized by FOP-SP1ΔFTF2. The expression ratios were normalized by using the common bean actin gene as endogenous control. The value 1.0 was denoted for the transcript level of all genes in mock inoculated plants for each plant region (data not shown). The levels of expression for a pair of measurements.
Figure 8.
RT-qPCR analysis of expression of putative FTF2-responsive genes (A) and two SIX effector genes (B) during common bean colonization by a FOP-SP1ΔFTF2 mutant. The plant regions assayed and the time intervals after inoculation are indicated in the X axis (R3, root system 3 dpi; C7, root crown 7 dpi; H21, hypocotyls 21 dpi). The relative expression measurements in the Y axis in (B) are indicated in a logarithmic scale. Dark bars indicate expression in plants colonized by FOP-SP1; light bars indicate expression in plants colonized by FOP-SP1ΔFTF2. The expression ratios were normalized by using the EF1α gene as endogenous control. The value 1.0 was denoted for the transcript level of genes FTF2 and FOXG_02746 in wild-type R3, of genes FOXG_14730 and FOXG_14731 in wild-type C7, and genes SIX1 and SIX6 in wild-type H21. The levels of expression for a pair of measurements were tested using a t-test and significant differences are indicated by * (P < 0.05), ** (P < 0.01), *** (P < 0.001) and **** (P < 0.0001).
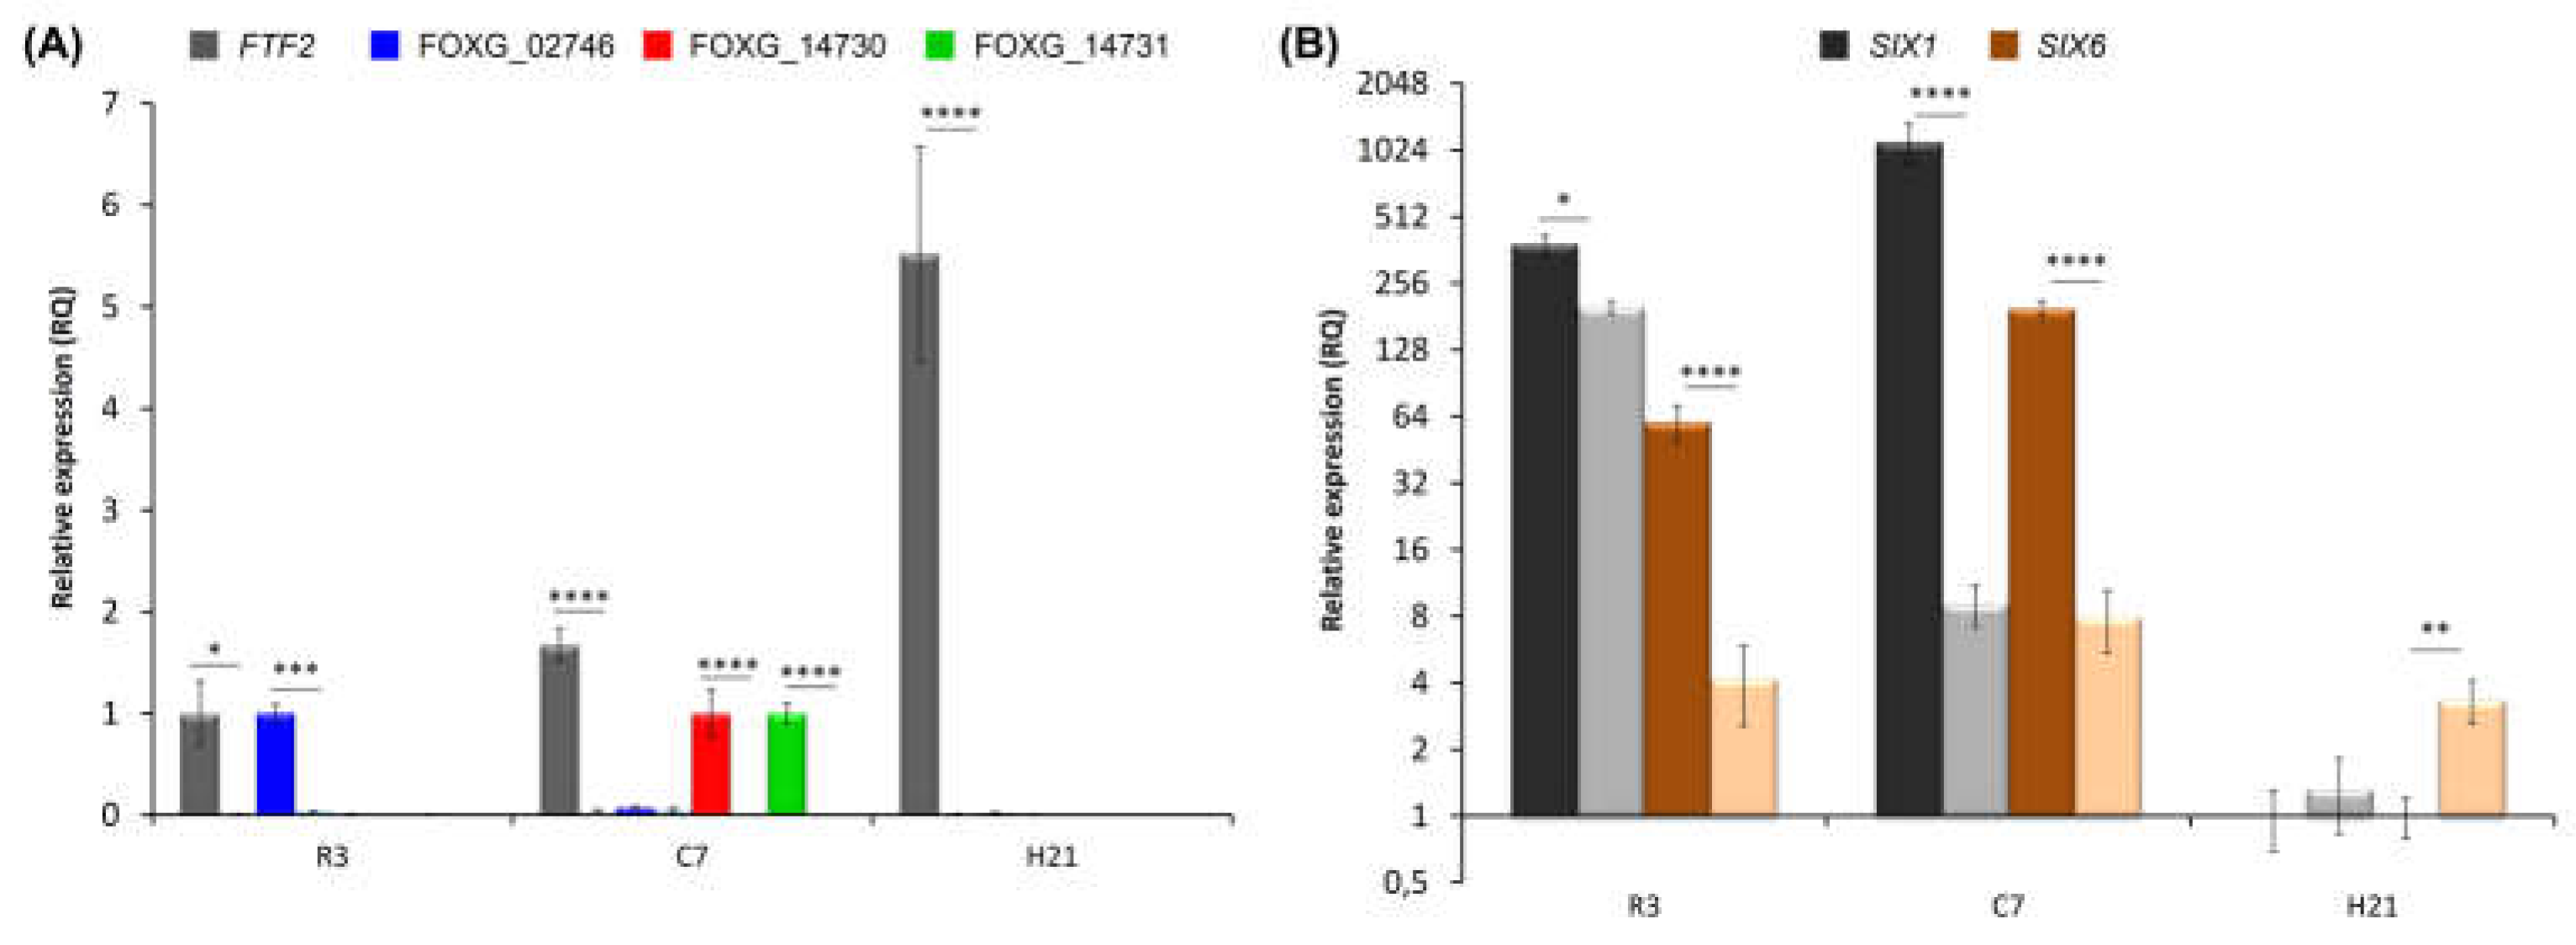
Figure 9.
Hypothetical model of regulation of vascular colonization effectors (VCE) and virulence during host plant colonization by F. oxysporum. VCE: Vascular Colonization Effectors. The yellow to red shade transition represents the buildup of effectors as the result of gene expression activation by the FTF family of transcription factors and the subsequent enhanced virulence.

