Preprint
Article

Investigation of Morphology, Crystal Structure, and Gas Sensing Behavior of Composite Ceramic

Altmetrics

Downloads

236

Views

110

Comments

0

Submitted:

12 January 2023

Posted:

17 January 2023

You are already at the latest version

Alerts
Abstract
This report aimed to know the performance of local mineral-based composite ceramic. The materials used consist of Indonesian local minerals, which are jarosite and manganite minerals as sources of oxide iron and Mangan. The materials were synthesized using the precipitation method, whereas composite ceramic was fabricated using a screen printing method and fired at 600 oC using a furnace. The results of the characterizations indicate that the sample forms three phases on diffraction peaks. The differences in the resistance values in ambient and ethanol environments indicate that the sample has very different responses. The high porosity of the sample greatly support the gas adsorption process. Thus, the sample has a high level of sensitivity. With the above characteristics, the composite ceramic which was fabricated has the potential to be applied to gas sensors, especially ethanol gas sensors.
Keywords: 
Subject: Chemistry and Materials Science  -   Ceramics and Composites

1. Introduction

Metal Oxide Semiconductor (MOS) has interesting characteristics in terms of optical, electrical, and magnetic characteristics. These interesting characteristics are due to its band-gap values which can easily be set. Thus, the MOS currently intrigues many researchers. In its utilization, the MOS is often used for gas sensor [1,2,3], photocatalyst [4], photoluminescence [5], nanofluids [6], temperature/ humidity sensor [7], battery [8], and magnetic applications [9].
Fe2O3–based MOS contains various minerals that are abundant in Indonesia, such as hematite, jarosite, magnetite, manganite, and ilmenite. Fe2O3 can be obtained from jarosite minerals [10]. The use of the Fe2O3 semiconductor for ethanol gas detection was discussed in our previous work. We used jarosite mineral as a source of Fe2O3 because it has many advantages. Our previous works showed that the samples have a lower operating temperature [11] than the common MOS(~200 oC) [12] and high sensitivity [13]. It is a promising material to be developed and will have a high value economically.
The synthesis of gas detection materials is greatly variable. The researcher conducted a different method to improve the gas sensor performance such as the response of the gas sensor, selectivity, stability, and working temperatures. A method usually used to synthesize such as the Template-free hydrothermal method [14], Solvothermal [15], Hummers [16], Facile multi-step reaction [17], chemical solution [18], combination co-precipitation and Microwave irradiation [19], simple soak drying [20], the precipitation method [21]. Therefore, the choice of the sensor material synthesis method with low cost and easy is technically advantageous.
Gas sensor performance neither affected by the synthesis method but also calcination temperature. The calcination temperature affects the crystallinity of the materials. With increasing the calcination temperature, the crystallinity is higher and so good to form the great defects that can enhance response [22]. However, the calcination temperature is too higher, it should be prevented due to agglomeration of the gas sensor materials. Where agglomeration affecting to increase crystal size and reduce the surface area which causes reduce the response of the sensor [23]. The calcination temperature resulted in different working temperatures. There is a correlation non-linear between calcination and the working temperature of the sensor. Because they are affected by the synthesis route of the sensing materials like mentioned above. For example, refer to [22], at 700 OC calcination temperature, the working temperature of the gas sensor is at 200 OC. It is lower than the calcination temperature of 500 and 900 OC. Refer to [22], 600 OC calcination temperature has a little higher working temperature than 400 OC and lower than 800 OC. Therefore, based on the references above that a calcination temperature matched for gas sensor performance is between 600 and 700 OC.
Indeed, MOS-based gas sensors have many advantages, such as high sensitivity, fast response, and recovery. However, they generally operate at high temperature between 200-500 oC [12], which causes high energy consumption, limit applications, and have an impact on practical usage. They affect to decrease the stability and age of the gas sensor [24]. So the gas sensor performance with high sensitivity and the low working temperature is being carried out.
In this research, a sensor was fabricated based on composite from Fe2O3 and Mn2O3 materials (local mineral base), and ZnO by using a screen-printing method. Meanwhile, the synthesis of mixture materials was done by precipitation method that is very effective to obtain composite structure materials. The Mn2O3-Fe2O3-ZnO composite was expected to improve sensor parameters which are still considered weak in the previous research and to complete the minimum parameter. Thereby, an ethanol gas sensor of local mineral composite-based that is eligible to be manufactured commercially can be obtained.

2. Materials and Methods

Preparations of Composite Powdersby Precipitation

Mn2O3-ZnO-Fe2O3(MZF) composite powders were synthesized employing precipitation method. The materials used to synthesize the powders consist of Indonesia local minerals which are jarosite and manganite minerals as the sources of oxide iron and Mangan respectively, and oxide zinc coming from market (Merck). Jarosite and Manganite were firstly extracted to obtain the Fe2O3 and Mn2O3 powders. The extraction of those powders was conducted by precipitation method. The mass ratios of the three materials were 50% : 40% : 10% for Fe2O3, ZnO, and Mn2O3 respectively. Each material was mixed with 5M HCl by using a stirrer at 80 oC until they were homogeneous. The three solvents were then mixed until they were homogenous. The step-by-step of mixture is as follow. Firstly, the ZnCl2 solution was mixed into the FeCl3 solution, and then the MnCl3 solution was added into the solution that had previously been mixed. After that, the mixture was precipitated with NH4OH until the pH level of the solvent was about 8.91. Its residue was filtered and then dried at 110 oC. Later on, it was calcined at 800 oC for three hours using a furnace. Calcination having been conducted was aimed to remove water content in the residue and to complete chemical reaction processes. Finally, the sample was then pounded to obtain the MZF composite powders (see Figure 1).
Fabrication of MZF composite film and characterization of electrical properties and structure
The screen-printing method was employed to fabricate the MZF composite. This method was simple and very easy to perform. The tools used could easily be obtained at a low cost. The tools for screen printing consist of a screen that is previously given checkered pattern and squeezy that functions to sweep paste on to the substrate.
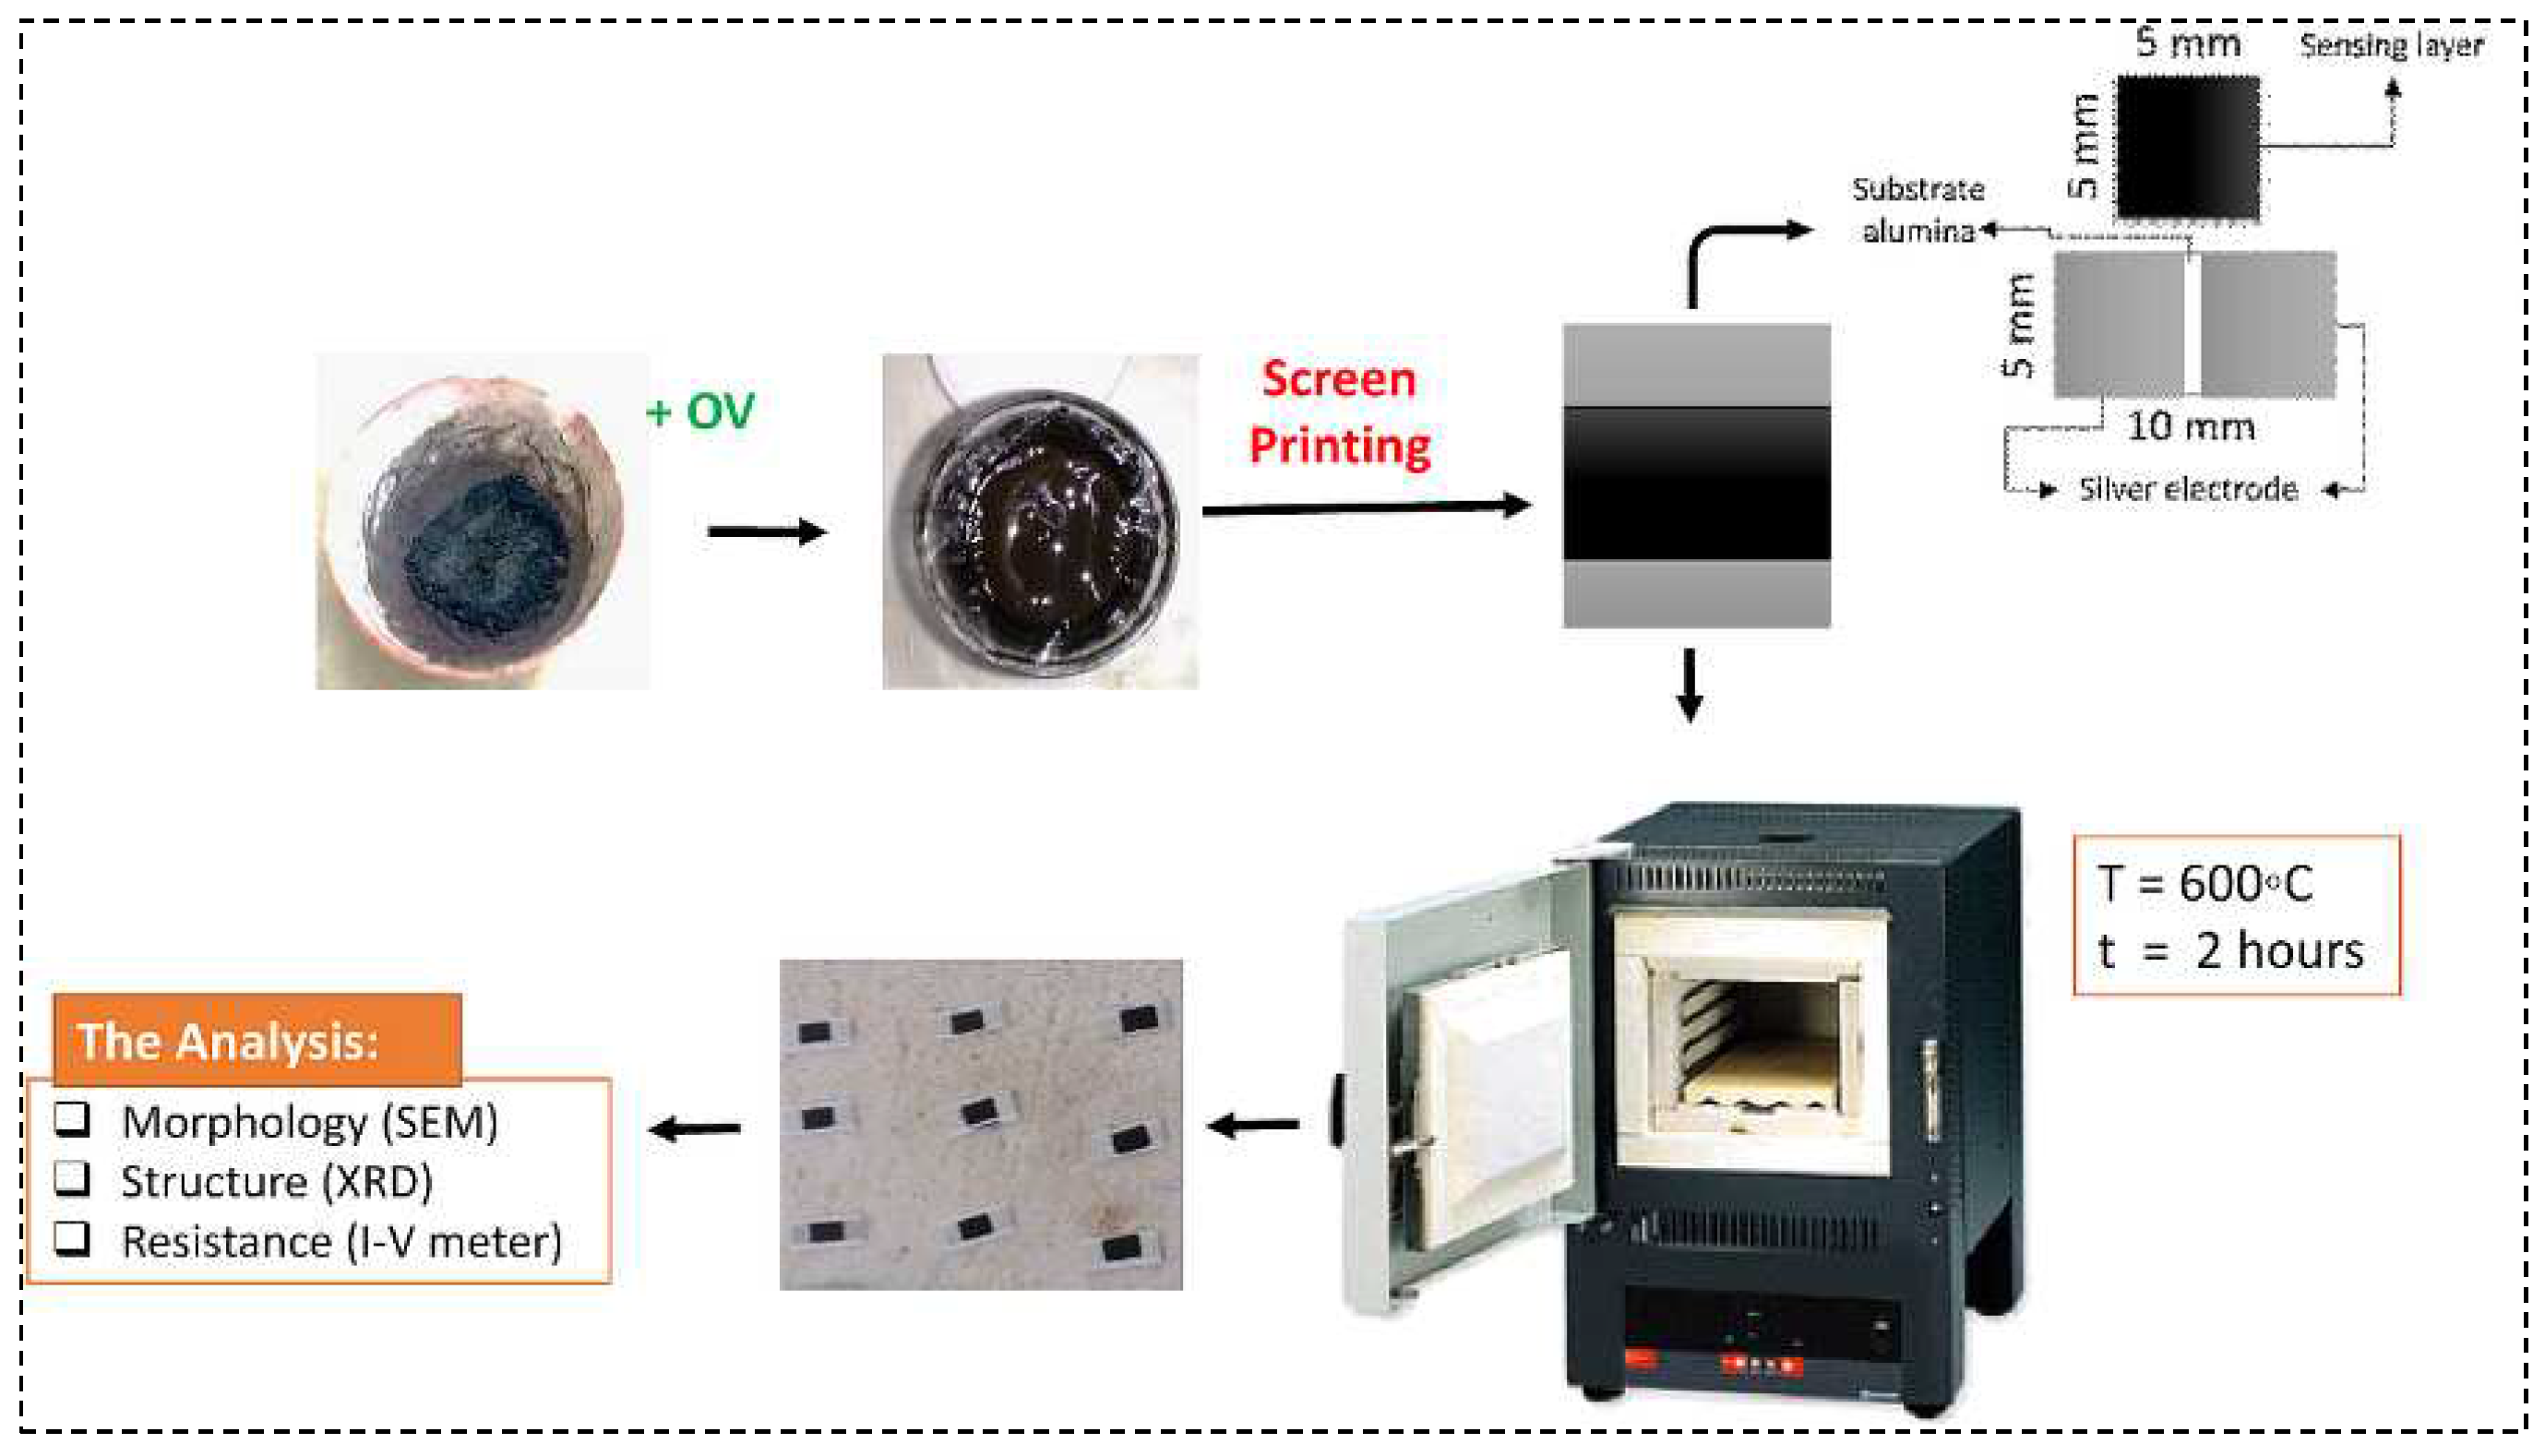
Before alumina substrate was coated using paste, some paste was created by mixing the MZF powder with Organic Vehicle (OV). The mixture was stirred manually until it took a form of paste. The %wt ratios of powder and OV were 70%:30%. The MZF paste was coated on to substrate that had previously been coated with silver electrode. Later, the sample was fired at a temperature of 600 oC for two hours by using a furnace. Finally, the MZF composite film was obtained (see the mechanism of fabrication image in Figure 2).
The MZF composite film was examined to recognize its characteristics. The electrical characteristic was examined using gas sensing performance analyzer. The equipment works based on resistance function R () to a working temperature T (°C). The data obtained were then processed to get %response to ethanol gas in different concentrations, optimum working temperature, and its behavior when the sample was added with different concentrations of ethanol (ppm).
The sample was then examined using X-Ray Diffractometer Philips PW 1710 BASED to find out its crystal structure. The X-ray of Cu with wave length of 1.54060 Å was used to take the XRD pattern at 25 oC temperature. The XRD data was analyzed with a software of X’Pert Highscore plus version 4.6a. To find out morphological structure, the sample was examined using Scanning Electron Microscope JEOL JSM-6360LA. The SEM data was analyzed by using an Image-J software.

3. Results and Discussion

3.1. Sensing Behavior as an Indicator for Gas Sensor
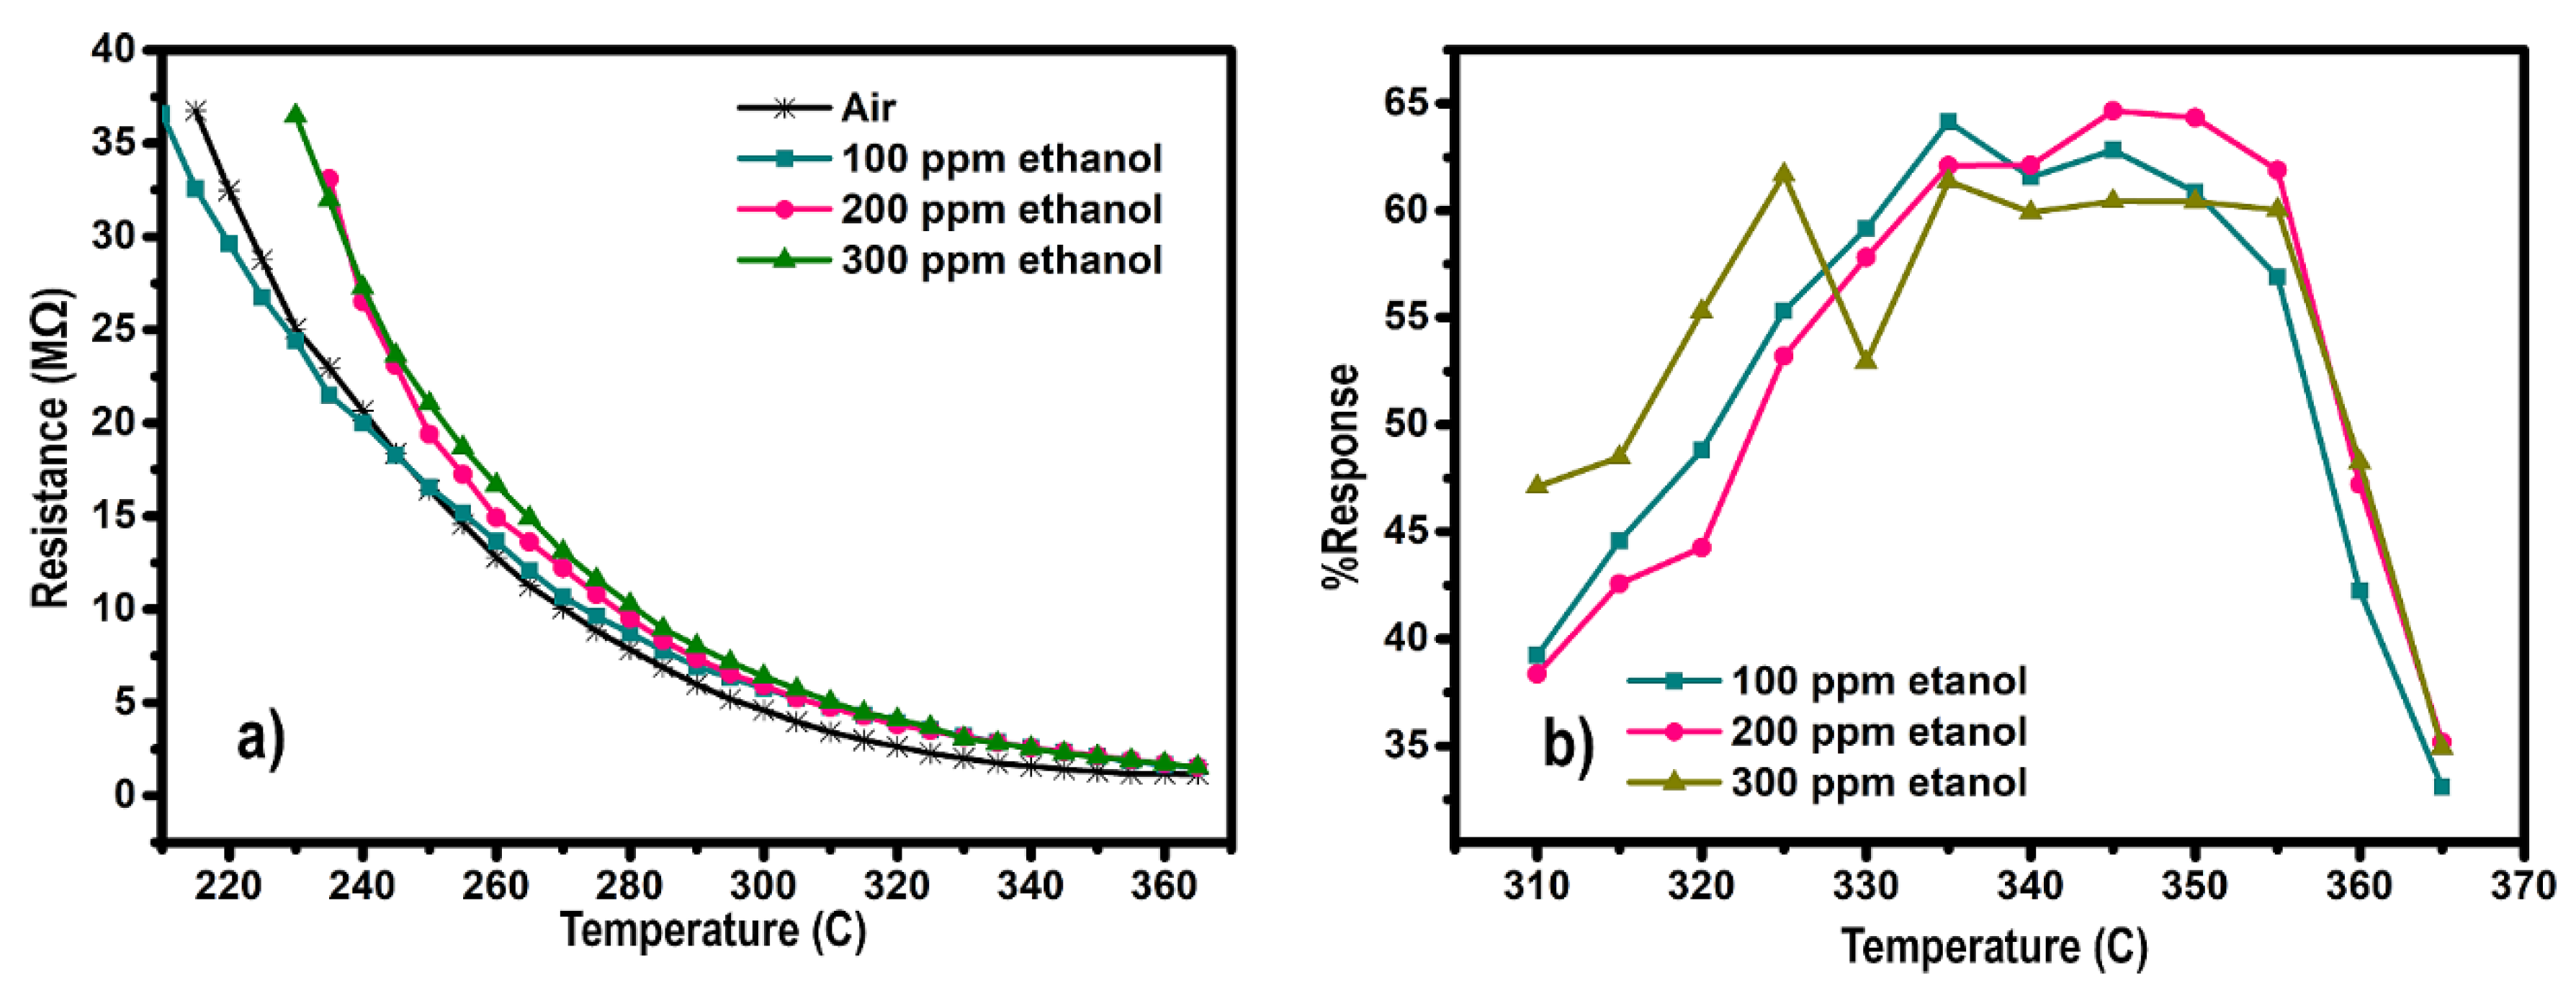
Electrical characteristics of the MZF composite had been tested in air and ethanol gas (100, 200, and 300 ppm) environments. The characteristics of the sample can be seen in Figure 3a which shows the sample operating in the temperature range of 210-365 oC. On the other hand, decrease in resistance value happens on every 5 oC increasing temperature. The more increasing the temperature, the more decreasing the resistance value will be. This characteristic shows the properties of semiconductor materials in which their conductivity increases together with their increasing the temperature.
Differences on resistance values at different ethanol concentration show that the sample gives a different response. In the range 210-255 oC operating temperature, the sample was still unstable to detect the ethanol gases. So, the electrical resistance value had a random trend. However, when the sample above 255 oC operating temperature, the sample had a higher resistance than that of not given ethanol gas (Figure 3a)). This is caused by electrons excited from valence band to conduction band. Then, they recombine with holes. The detailed description above shows that the composite ceramic materials which have been fabricated are the P-type semiconductor [21,22,23,24,25]:
O 2 ( g ) O 2 ( a d s )
O 2 ( a d s ) + e O 2 ( a d s )
O 2 a d s + e 2 O ( l a t t )
C 2 H 5 O H ( g ) + 6 O ( l a t t ) 2 C O 2 + 3 H 2 O + 6 e
The gas sensing mechanism of MZF can be represented by Equations (1), (2), (3), and (4). In an ambient condition, the oxygen is absorbed by the surface of the sensing layer (Eq. 1). When it is in the working temperature condition, the oxygen will react with free-electrons to form oxygen ion (Eq. 2). Then, the oxygen ion reacts with the MZF lattice (Eq. 3). This situation results in certain potential barrier which is called prior condition. Later on, ethanol is injected into that environment causing reaction between ethanol gas molecules and oxygen ion molecules in the MZF lattice. This makes the electrons recombine with lattice holes (Eq. 4), so that a new potential barrier which is denser than the previous one and is called final condition (resistance value is higher) is formed [26]. These prior and final resistances indicate the responses of the sensor: the higher difference in the resistance value between those conditions, their response and selectivity will be higher In addition, the resistance values can also be represented by the %response function of the sensor to working temperature. This is often called sensor sensitivity. Sensor sensitivity is shown in Figure 3b). At different concentrations, the sample has also different optimum working temperature. In the range of 310-355 oC, the sensor does not show its selectivity, it causes the sensor response is still random. It is assumed that the surface of MZF film is not even, so the electron transfer (ET) is unstable for resulting the current.
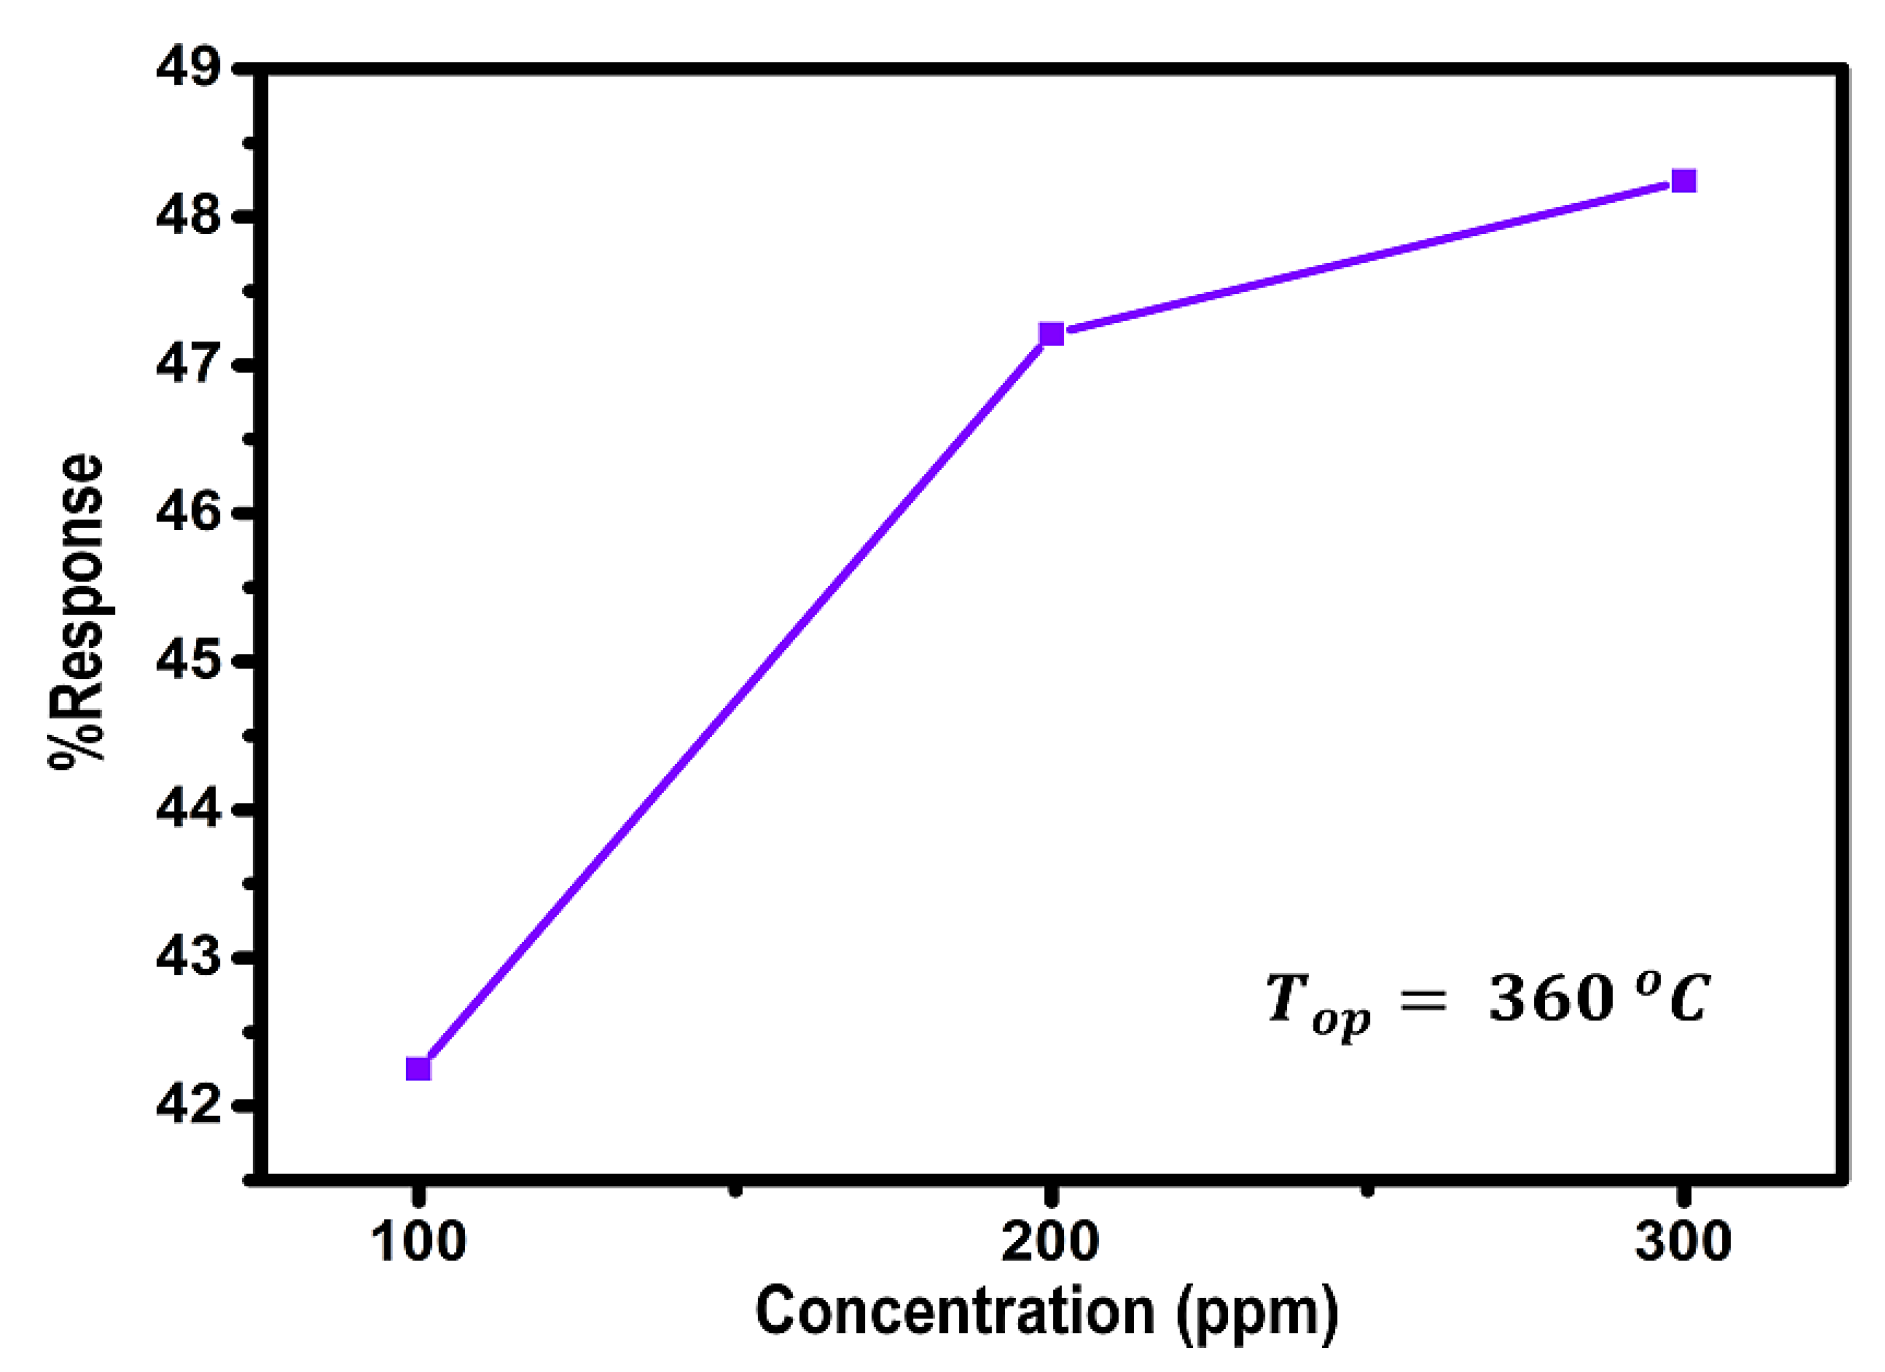
The best working performance of the sample is at 360 oC. At that temperature, the sample shows significant sensing behavior, in which its responses are approximately 42.25% (100 ppm), 47.21% (200 ppm), and 48.24% (300 ppm), respectively (see Figure 4). This operating temperature is lower another work of Fe-based gas sensor [27]. The working temperature is affected by the thickness of the sample [28,29], which is shown in Figure 6b). A thinner layer will widen depletion area and affect narrower area of electron mobility among the grains (Schottky contacts is higher). This phenomenon results in an enhancing sensitivity to target gas, but it also generates an increasing working temperature that is very avoided.
On the contrary, the sample layer which is thicker will decrease sensitivity and working temperature. This is caused by the massive mobility of the electrons since the layer of electron mobility is under the surface of the sample. It clearly shows that Schottky contact is lower [30,31].
The difference in the sensitivity of the composite ceramic to ethanol gas indicates that the sample is able to distinguish different ethanol gas concentrations. Even though the precursor sources are different with another research, the fabricated MZF composite has a compete performance compared with the use of high purity precursors of Fe-based [18,27]. Otherwise, even this work had a lower sensitivity than our previous work [32], this because difference of treatment on the temperature of firing the film. We assumed that the temperature of firing in this work has not created the homogenous crystal. So that, the distance between grain is various which cause the operating temperature is high as we can see in the Figure 3b). This shows that the MZF composite which is fabricated using local minerals of Indonesia has also good responses and is suitable to be utilized as an ethanol gas sensor device.
Crystal and morphological structures
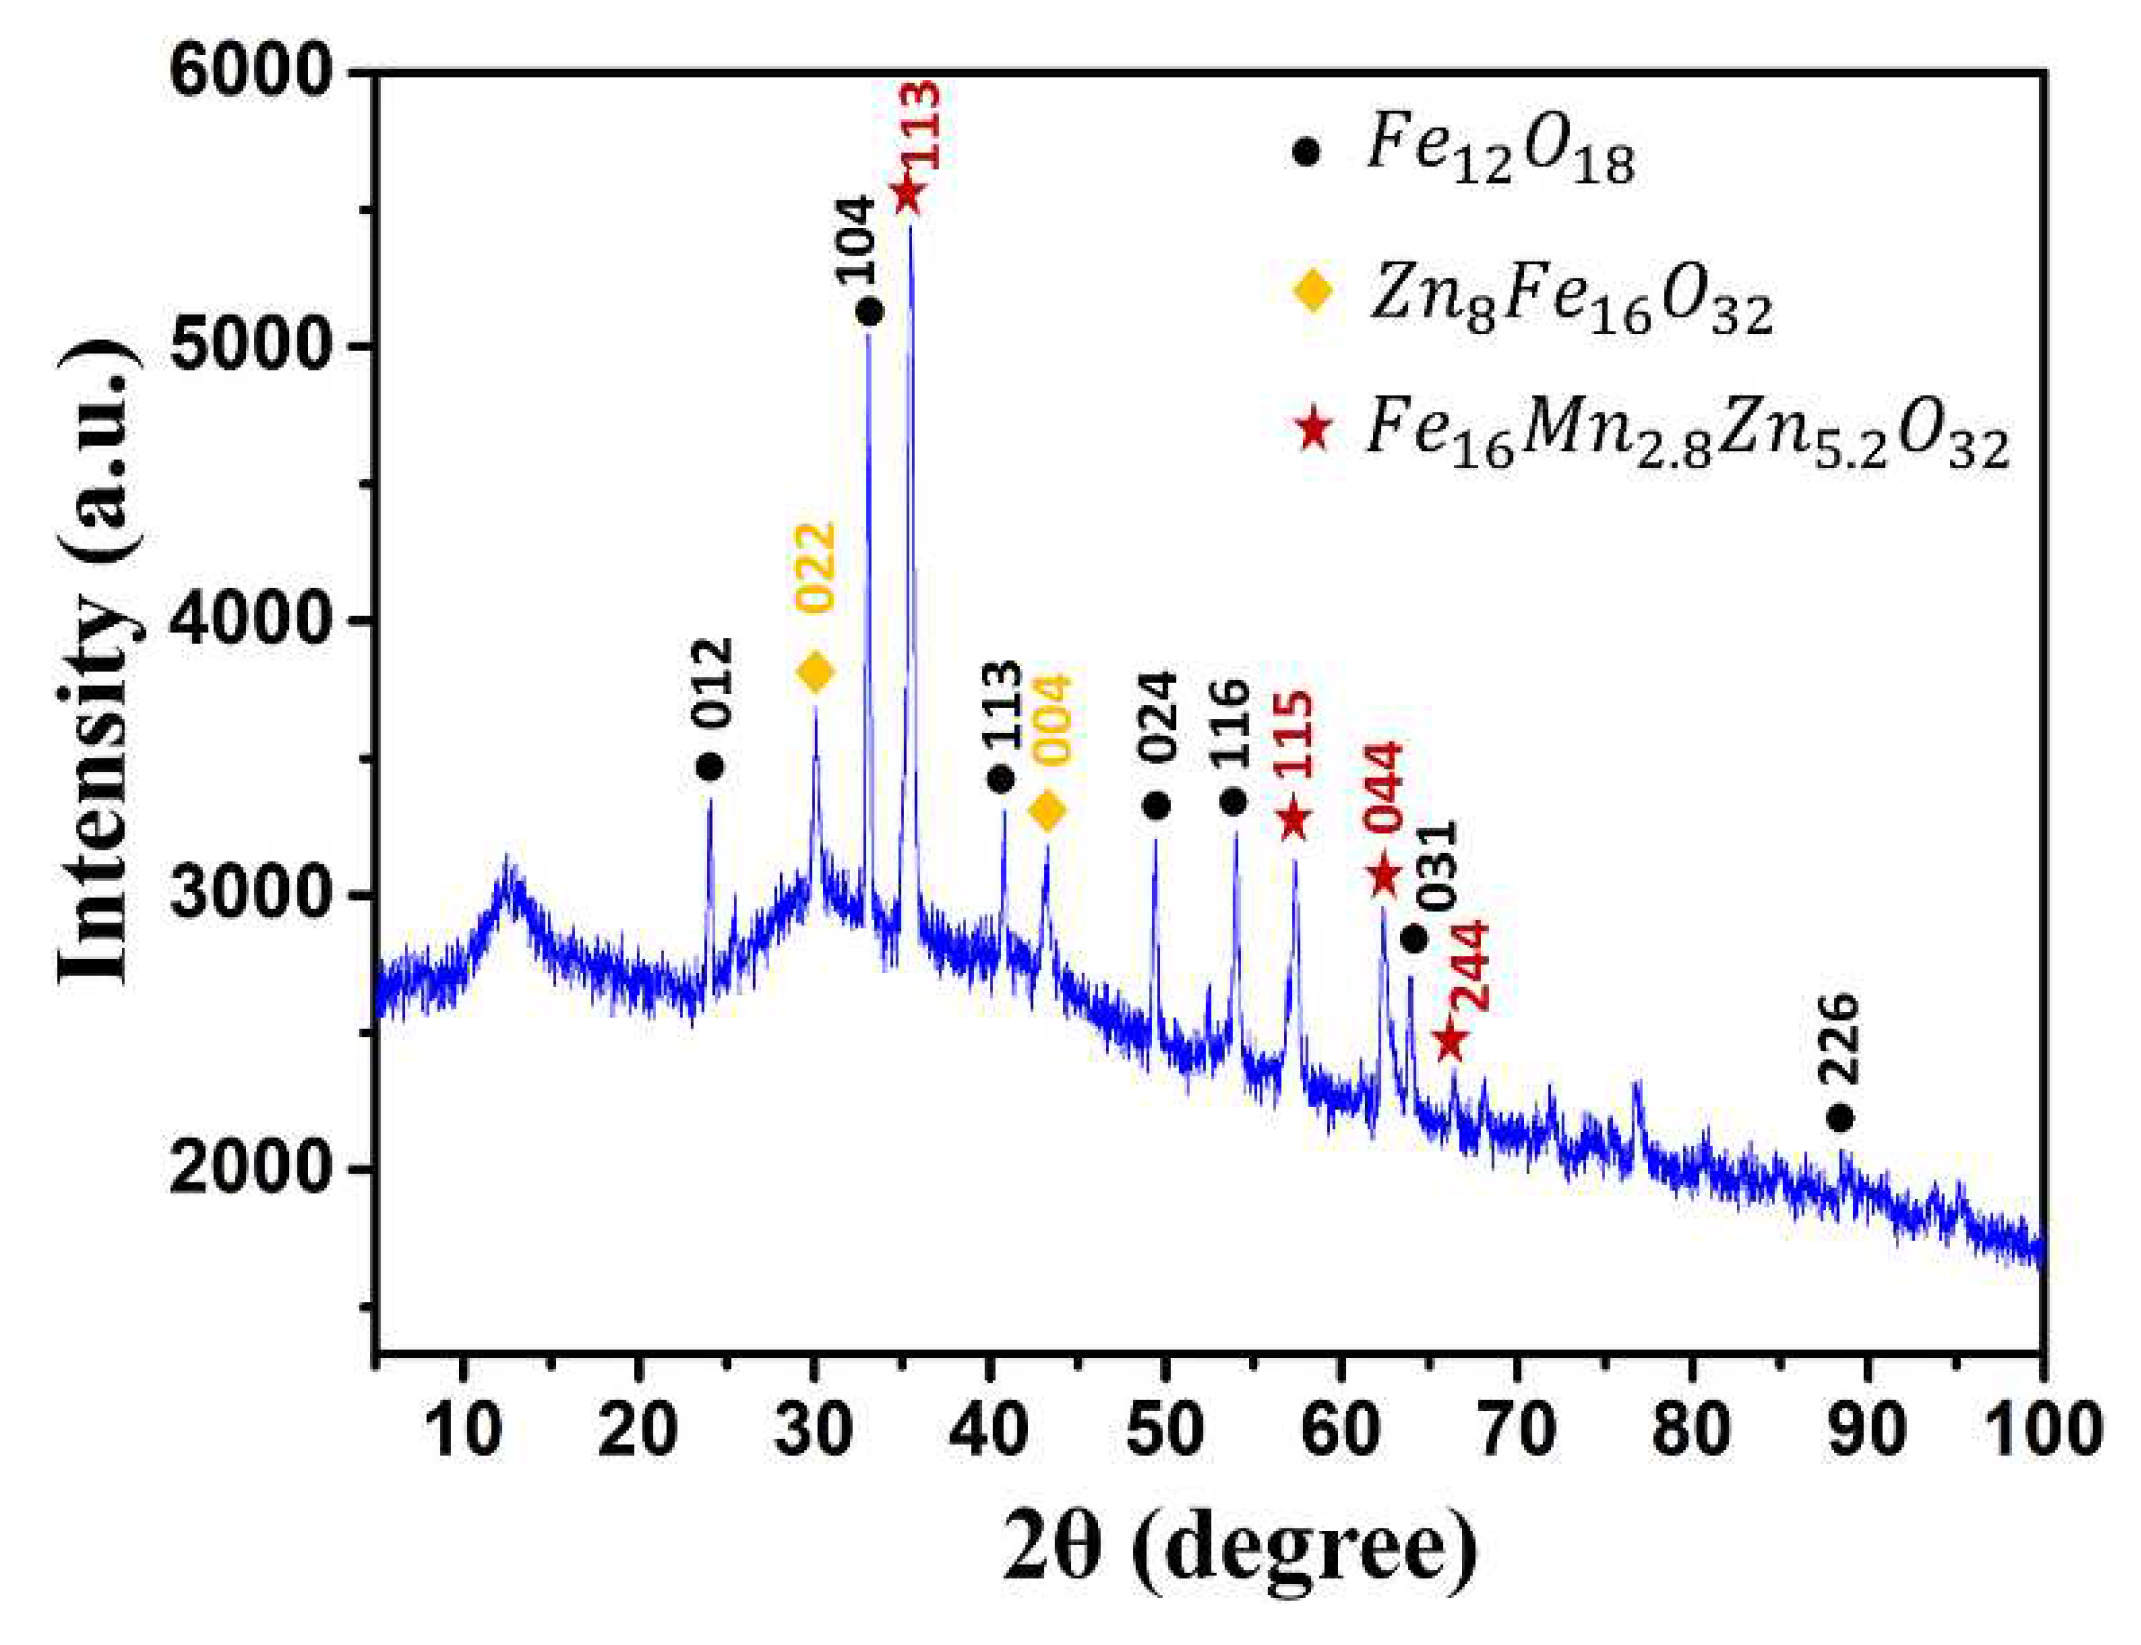
The scanning angle of 2θ was used from 5 to 100o. The XRD pattern of the sample was shown in Figure 5. The XRD patterns match with the database of ICDD (International Center for Diffraction Data) or COD (Crystallography Open Database). The ICDD No. 96-200-9104 (No. 2009103 in COD database) matches with the Fe16Mn2.8Zn5.2O32 (*) at the position of 35.17, 56.51, and 62.05o [33]. The ICDD No. 96-900-6897 (No. 9006896 in COD database) matches with the Zn8Fe16O32 (♦) at the position of 30.21 and 43.25o [34]. The ICDD No. 96-900-0140 (No. 9000139 in COD database) matches with the Fe12O18 (•) at the diffraction peak positions of 24.13, 33.112, 40.83, 49.42, 54.00, 63.96, and 71.82o [35]. These patterns look like the XRD results of [36] which employed different source of Fe.
The addition of Mn2O3 into ZnO-Fe2O3 causes changing in the type of the semiconductor material. The semiconductor of ZnO-Fe2O3 has N-type [18,19]. When the Mn2O3 is added, the type of the semiconductor material changes into P-type. This happens as Zn2+ in ZnFe2O4 is substituted by Mn3+, where the numbers of Mn3+ holes are more than the numbers of electrons from Zn2+, so that the materials of the Mn2O3-ZnO-Fe2O3 excess the holes. This scheme deals with as reported by [37,38] that they used P-type semiconductor from BixSb2-xTe3 as a source.
The three phases of the crystallite indicate that the sample is a composite which has sizes of 27.7 nm (*), 25 nm (♦), and 58.9 nm (•). The three phases are formed due to pH value in the precipitation step of the material synthesis process. The pH value of the residue is about 8.91 which indicates that it is still difficult to form singular phase. The structure of the singular MZF material may be able to be formed if the pH value is about 12.5 [39].
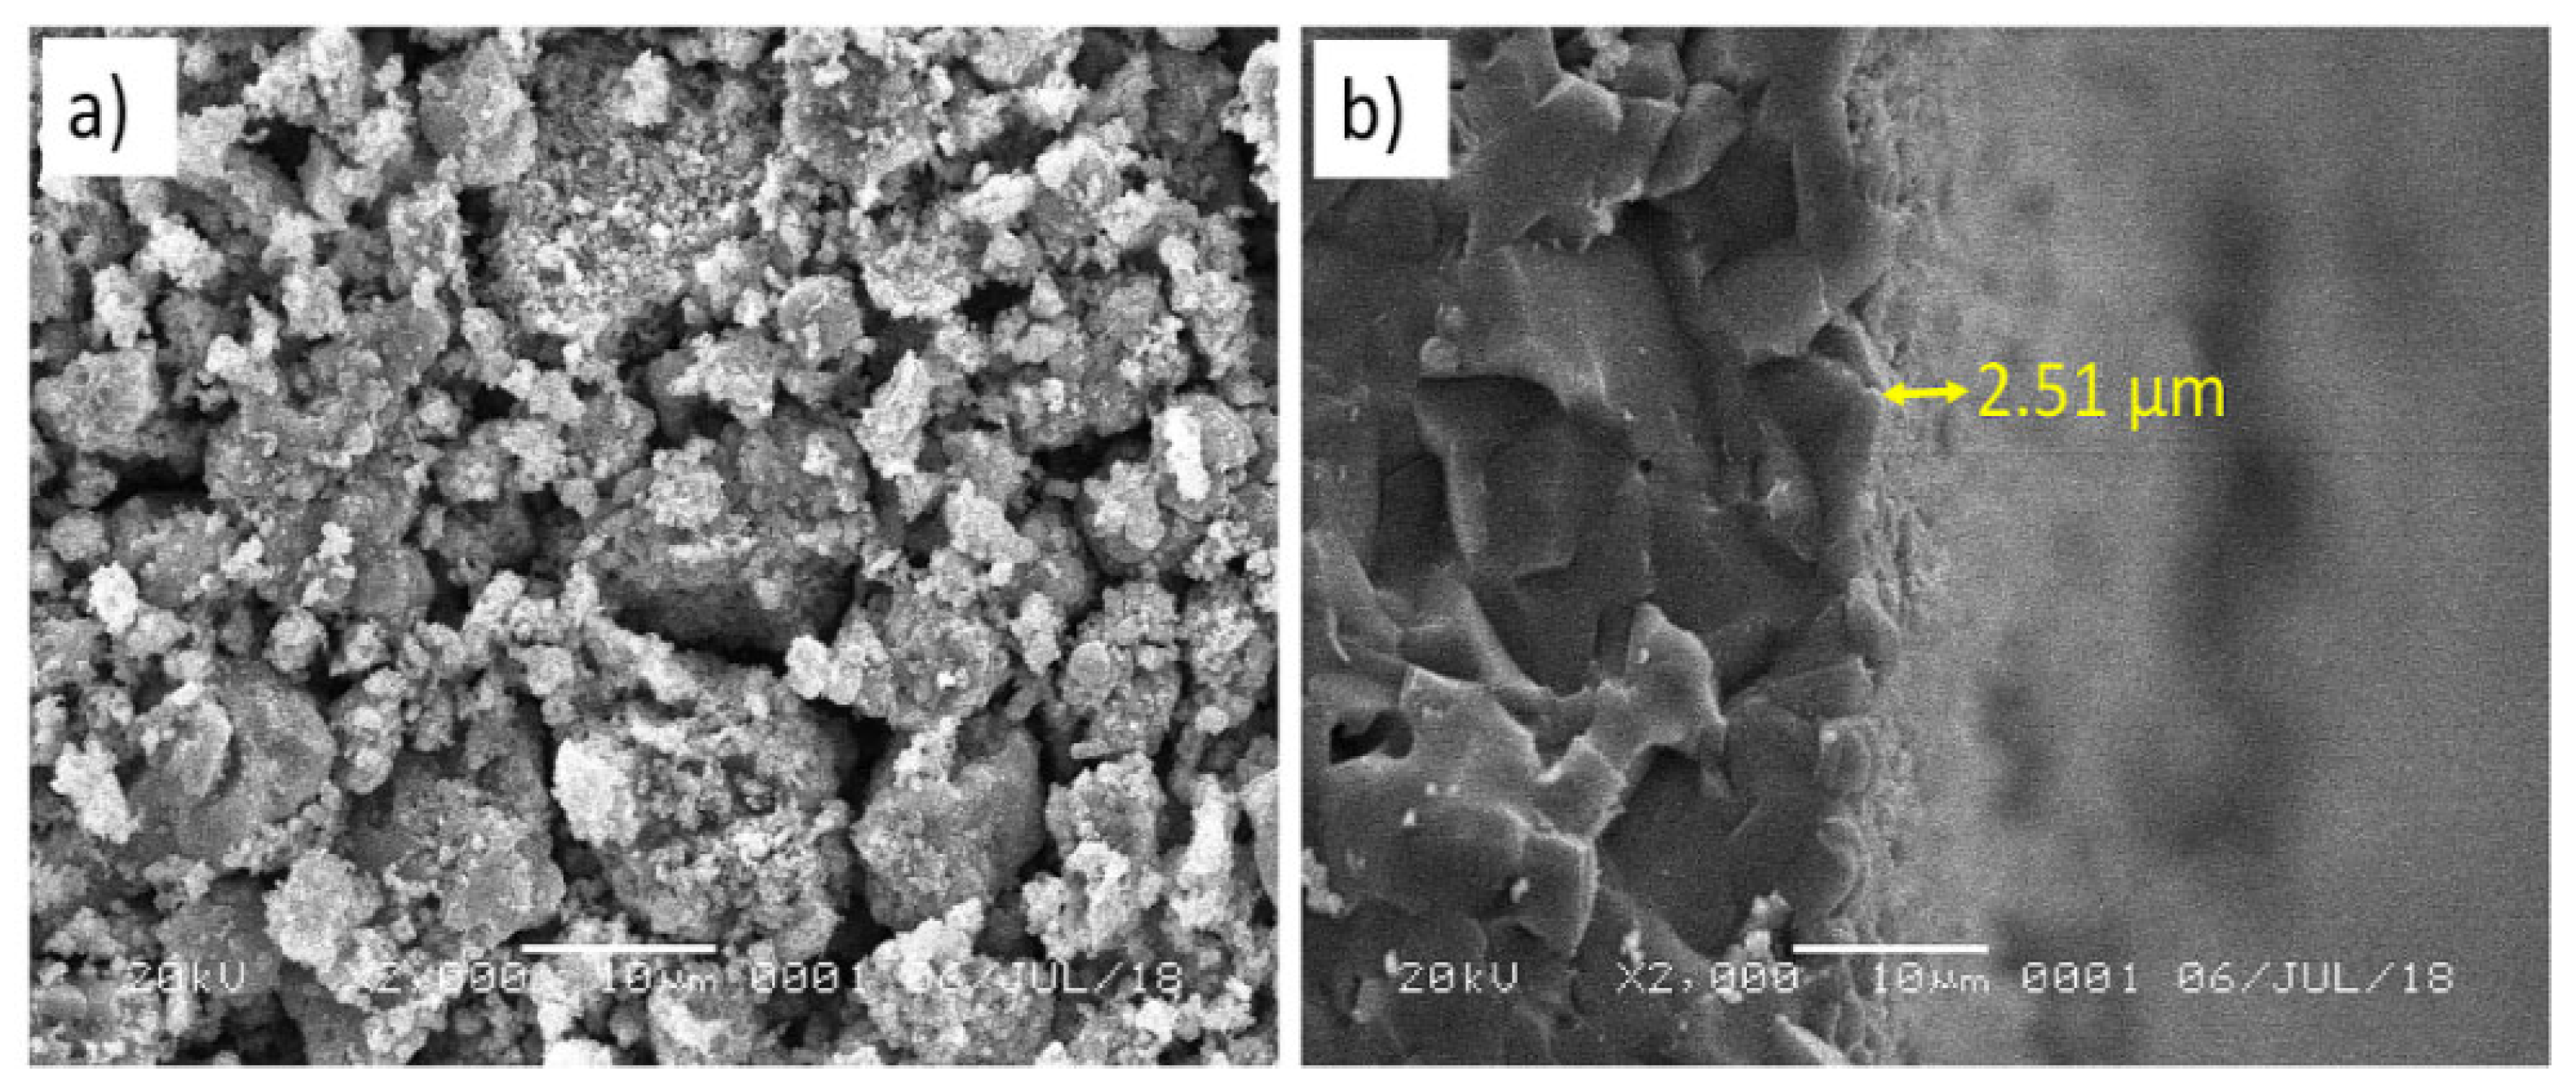
Figure 5. Morphological structure of the MZF composite: (a) surface, (b) section area.
Preprints 67341 g005
Surface morphology of the MZF composite is shown in Figure 6a). There are a lot of small-sized grains which form like granola all around the surface. The average size of the grains is 496.31 nm. In addition, the surface morphologAy has a high porosity which is approximately ~172.134,1 µm2. The thickness of the MZF composite is about 2.51 µm. The thickness morphology of the composite ceramic is shown in Figure 6b at section part. In gas sensing, the porosity and thickness are two parameters that are able to foster increasing sensitivity to gas. The small grain-size supports the electron transport, so that the electrons can be excited easily and facilitated well, and the sensor will sense the target gas quickly [40]. Nevertheless, the surface morphology is nonhomogeneous, so the transfer electron is unstable which affects to unstable of the sensor response. This means that the small size of the particle only is not enough, but we need the uniform surface to determine good response of gas sensing.

4. Conclusions

The results of the characterizations indicate that the sample which was fabricated had three phases on diffraction peaks as called a ceramic composite. The differences of the resistance values in ambient and ethanol conditions indicate that the sample has very different responses in both environments. The high porosity of the sample greatly supports the gas adsorption process. So, the sample can be used for purpose ethanol detection. Limit detection of ethanol concentration need to explore in the next research to know the minimum and maximum of concentration of ethanol can be detected. Nevertheless, the responses can compete with other gas sensors. In the future work, we recommend optimizing the firing temperature of the sensing layer due to this is very important to make homogeneity of the crystal growth that will make the good surface and enhance the sensitivity and selectivity of the gas sensor.

Author Contributions

Conceptualization, H.A., D.S. and A.S.; methodology, R.I., D.S; formal analysis, H.A., R.I.; investigation, R.I..; resources, A.T., A.D.; writing—original draft preparation, R.I; writing—review and editing, H.A., D.G., A.S., R.I.; visualization, A.T; supervision, H.A. All authors have read and agreed to the published version of the manuscript.

Funding

This research received no external funding.

Institutional Review Board Statement

Not applicable.

Informed Consent Statement

Not applicable.

Data Availability Statement

Data will be provided by request.

Acknowledgments

We would like to thank the LPPM of Universitas Islam Negeri Sunan Gunung Djati Bandung that has facilitated this research.

Conflicts of Interest

The authors declare no conflict of interest.

References

  1. S. Sharma, P. Chauhan, and S. Husain, “Liquefied petroleum gas sensor based on manganese (III) oxide and zinc manganese (III) oxide nanoparticles,” Mater. Res. Express, vol. 5, p. 015014, 2017. [CrossRef]
  2. X. F. Wang et al., “Prussian Blue analogue derived porous NiFe2O4 nanocubes for low-concentration acetone sensing at low working temperature,” Chem. Eng. J., vol. 338, no. October 2017, pp. 504–512, 2018. [CrossRef]
  3. S. Ameen, “Vertically arranged Mn2O3 nanosheets as smart sensing electrode for highly sensitive N-hydroxysuccinimide,” Microchem. J., vol. 163, p. 105912, 2021. [CrossRef]
  4. D. Michele et al., “Opto-Electronic Characterization of Photocatalysts Based on p,n Junction Ternary and Quaternary Mixed Oxides Semiconductors (Cu2O-In2O3 and Cu2O-In2O3-TiO2),” Catalysts, vol. 12, pp. 1–22, 2022.
  5. N. F. Samsudin, K. A. Matori, J. Y. C. Liew, Y. W. Fen, M. H. Mohd Zaid, and Z. N. Alassan, “Investigation on structural and optical properties of willemite doped Mn2+ based glass-ceramics prepared by conventional solid-state method,” J. Spectrosc., vol. 2015, 2015. [CrossRef]
  6. D. G. Syarif, D. H. Prajitno, and E. Umar, “Synthesis of Al2O3 nanoparticles from Local Bauxite for water-Al2O3 nanofluids egy,” in Journal of Physics: Conference Series, 2017, vol. 799, p. 012014.
  7. H. Wang and P. P. Mercier, “Near-Zero-Power Temperature Sensing via Tunneling Currents Through Complementary Metal-Oxide-Semiconductor Transistors,” Sci. Rep., vol. 7, no. 1, pp. 1–7, 2017. [CrossRef]
  8. Y. Shan, M. Y. Zhang, Y. Bai, M. Du, X. Guo, and H. Pang, “Design and synthesis of transition metal oxide/zeolitic imidazolate framework-67 composites,” Chem. Eng. J., vol. 429, no. June 2021, p. 132146, 2022. [CrossRef]
  9. D. Kaya, H. S. Aydınoğlu, E. Şenadım Tüzemen, and A. Ekicibil, “Investigation of optical, electronic, and magnetic properties of p-type NiO thin film on different substrates,” Thin Solid Films, vol. 732, no. February, p. 138800, 2021. [CrossRef]
  10. H. Aliah et al., “Structure analysis of nanocomposite ZnO:Fe2O3 based mineral yarosite as Fe2O3 source and its application probability,” in Materials Today: Proceedings, 2019, vol. 13, pp. 36–40.
  11. H. Aliah et al., “Semiconductor Ceramic Mn0.5Fe1.5O3-Fe2O3 from natural minerals as ethanol gas sensors,” in IOP Conference Series: Materials Science and Engineering, 2018, vol. 367, no. 1, pp. 0–6.
  12. D. T. Dimitrov, “From gas sensors to detection of etanol vapour to sensor of bacteria detection,” J. Russ. Univ. Radioelectron., vol. 22, no. 5, pp. 93–106, 2019. [CrossRef]
  13. H. Aliah, D. G. Syarif, R. N. Iman, W. Darmalaksana, A. Setiawan, and A. Sawitri, “Preliminary studies of Mn(x)Zn(2-x)FeO4 (x = 0 dan 0.1) thick film semiconductors as an ethanol gas sensor,” in IOP Conference Series: Materials Science and Engineering, 2018, vol. 434, no. 1, pp. 0–7.
  14. [C. M. Hung, N. D. Hoa, N. Van Duy, N. Van Toan, D. T. T. Le, and N. Van Hieu, “Synthesis and gas-sensing characteristics of α-Fe2O3 hollow balls,” J. Sci. Adv. Mater. Devices, vol. 1, no. 1, pp. 45–50, 2016.
  15. K. Fan, J. Guo, L. Cha, Q. Chen, and J. Ma, “Atomic layer deposition of ZnO onto Fe2O3 nanoplates for enhanced H2S sensing,” J. Alloys Compd., vol. 698, pp. 336–340, 2017. [CrossRef]
  16. N. T. A. Thu et al., “Fe2O3 nanoporous network fabricated from Fe3O4/reduced graphene oxide for high-performance ethanol gas sensor,” Sensors Actuators, B Chem., vol. 255, pp. 3275–3283, 2018.
  17. Y. Chen et al., “ZIF-8 derived hexagonal-like α-Fe2O3/ZnO/Au nanoplates with tunable surface heterostructures for superior ethanol gas-sensing performance,” Appl. Surf. Sci., vol. 439, pp. 649–659, 2018.
  18. B. Zhang, W. Fu, X. Meng, A. Ruan, P. Su, and H. Yang, “Synthesis and enhanced gas sensing properties of flower-like ZnO/α-Fe2O3 core-shell nanorods,” Ceram. Int., vol. 43, no. 8, pp. 5934–5940, 2017.
  19. Y. LI, L. li CHEN, and F. xian ZHAO, “Highly selective acetone sensor based on ternary Au/Fe2O3-ZnO synthesized via co-precipitation and microwave irradiation,” Trans. Nonferrous Met. Soc. China (English Ed., vol. 28, no. 1, pp. 137–144, 2018. [CrossRef]
  20. J. Ma et al., “High sensitivity and ultra-low detection limit of chlorine gas sensor based on In2O3 nanosheets by a simple template method,” Sensors Actuators, B Chem., vol. 305, no. September, p. 127456, 2020.
  21. E. Suhendi, A. E. Putri, M. T. Ulhakim, A. Setiawan, and D. G. Syarif, “Investigation of ZnO doping on LaFeO3/Fe2O3 prepared from yarosite mineral extraction for ethanol gas sensor applications,” AIMS Mater. Sci., vol. 9, no. 1, pp. 105–118, 2022.
  22. S. Bai et al., “Reverse microemulsion in situ crystallizing growth of ZnO nanorods and application for NO2 sensor,” Sensors Actuators, B Chem., vol. 190, pp. 760–767, 2014. [CrossRef]
  23. S. D. Shinde, V. B. Gaikwad, G. E. Patil, D. D. Kajale, and G. H. Jain, “Gas sensing performance of nanostructured ZnO thick film resistors,” Int. J. Nanoparticles, vol. 5, no. 2, pp. 126–135, 2012. [CrossRef]
  24. Y. Ma, Y. Lu, H. Gou, W. Zhang, S. Yan, and X. Xu, “Octahedral NiFe2O4 for high-performance gas sensor with low working temperature,” Ceram. Int., vol. 44, no. 2, pp. 2620–2625, 2018. [CrossRef]
  25. V. B. Kamble and A. M. Umarji, “Gas sensing response analysis of p-type porous chromium oxide thin films,” J. Mater. Chem. C, vol. 1, no. 48, pp. 8167–8176, 2013. [CrossRef]
  26. M. Gardon and J. M. Guilemany, “A review on fabrication, sensing mechanisms and performance of metal oxide gas sensors,” J. Mater. Sci. Mater. Electron., vol. 24, no. 5, pp. 1410–1421, 2013. [CrossRef]
  27. B. Xiao et al., “Mixed potential type ammonia sensor using Fe-substituted LaCoO3 sensing electrode prepared by flame spray pyrolysis,” Sensors Actuators, B Chem., vol. 346, no. June, p. 130470, 2021. [CrossRef]
  28. A. K. Srinath, L. Sankaranarayanan, R. Pandeeswari, and B. G. Jeyaprakash, “Thin films of α-Mn2O3 for resistance-based sensing of acetaldehyde vapor at ambient temperature,” Microchim Acta, vol. 182, pp. 1619–1626, 2015. [CrossRef]
  29. N. N. Jandow, A. K. Elttayef, A. F. Majied, N. F. Habubi, N. Saadeddin, and Y. Al-Douri, “Thickness effect of ZnO/PPC gas sensor on the sensing properties of NO2 gas,” AIP Conf. Proc., vol. 2083, no. 2, 2019.
  30. N. Yamazoe, “Toward innovations of gas sensor technology,” Sensors Actuators, B Chem., vol. 108, no. 1-2 SPEC. ISS., pp. 2–14, 2005. [CrossRef]
  31. L. Yuan, T. Hyodo, Y. Shimizu, and M. Egashira, “Preparation of mesoporous and/or macroporous SnO2-based powders and their gas-sensing properties as thick film sensors,” Sensors, vol. 11, no. 2, pp. 1261–1276, 2011. [CrossRef]
  32. H. Aliah et al., “The optimization of ZnFe2O4/Mn2O3-based nanocomposite ceramic fabrication utilizing local minerals as an ethanol gas detector,” Mater. Res. Express, vol. 6, no. 9, p. 95908, 2019.
  33. A. C. Doriguetto and N. G. Fernandes, “Manganese‐rich natural franklinite,” Acta Crystallogr., vol. C55, pp. 1751–1753, 1999. [CrossRef]
  34. D. Levy, A. Pavese, and M. Hanfland, “Phase transition of synthetic zinc ferrite spinel (ZnFe2O4) at high pressure, from synchrotron X-ray powder diffraction,” Phys. Chem. Miner., vol. 27, no. 9, pp. 638–644, 2000.
  35. R. L. Blake and R. E. Hessevick, “Refinement of the hematite structure,” Am. Mineral., vol. 51, pp. 123–129, 1966.
  36. P. Puspitasari, N. Yahya, N. A. M. Zabidi, and N. A. Ahmad, “Comparison of Mechanical Properties and Magnetic Properties of Mn0.8Zn0.2Fe2O4 Synthesized by Conventional Ball Milling and Self Combustion Method,” J. Appl. Sci., vol. 1999, no. December, pp. 1–6, 2006. [CrossRef]
  37. S. Zhu, H. Sun, X. Liu, J. Zhuang, and L. Zhao, “Room-Temperature NH3 sensing of graphene oxide film and its enhanced response on the laser-Textured silicon,” Sci. Rep., vol. 7, no. 1, pp. 1–8, 2017. [CrossRef]
  38. H. Qin et al., “Improved thermoelectric performance of p-type Bi0.5Sb1.5Te3 through Mn doping at elevated temperature,” Mater. Today Phys., vol. 6, pp. 31–37, 2018.
  39. Y. Jamil, M. R. Ahmad, A. Hafeez, Z. Ul Haq, and N. Amin, “Microwave assisted synthesis of fine magnetic manganese ferrite particles using co-precipitation technique,” Pak. J. Agri. Sci, vol. 45, no. 3, pp. 59–64, 2008.
  40. G. Zhang and M. Liu, “Effect of particle size and dopant on properties of SnO2-based gas sensors,” Sensors Actuators, B Chem., vol. 69, no. 1, pp. 144–152, 2000. [CrossRef]
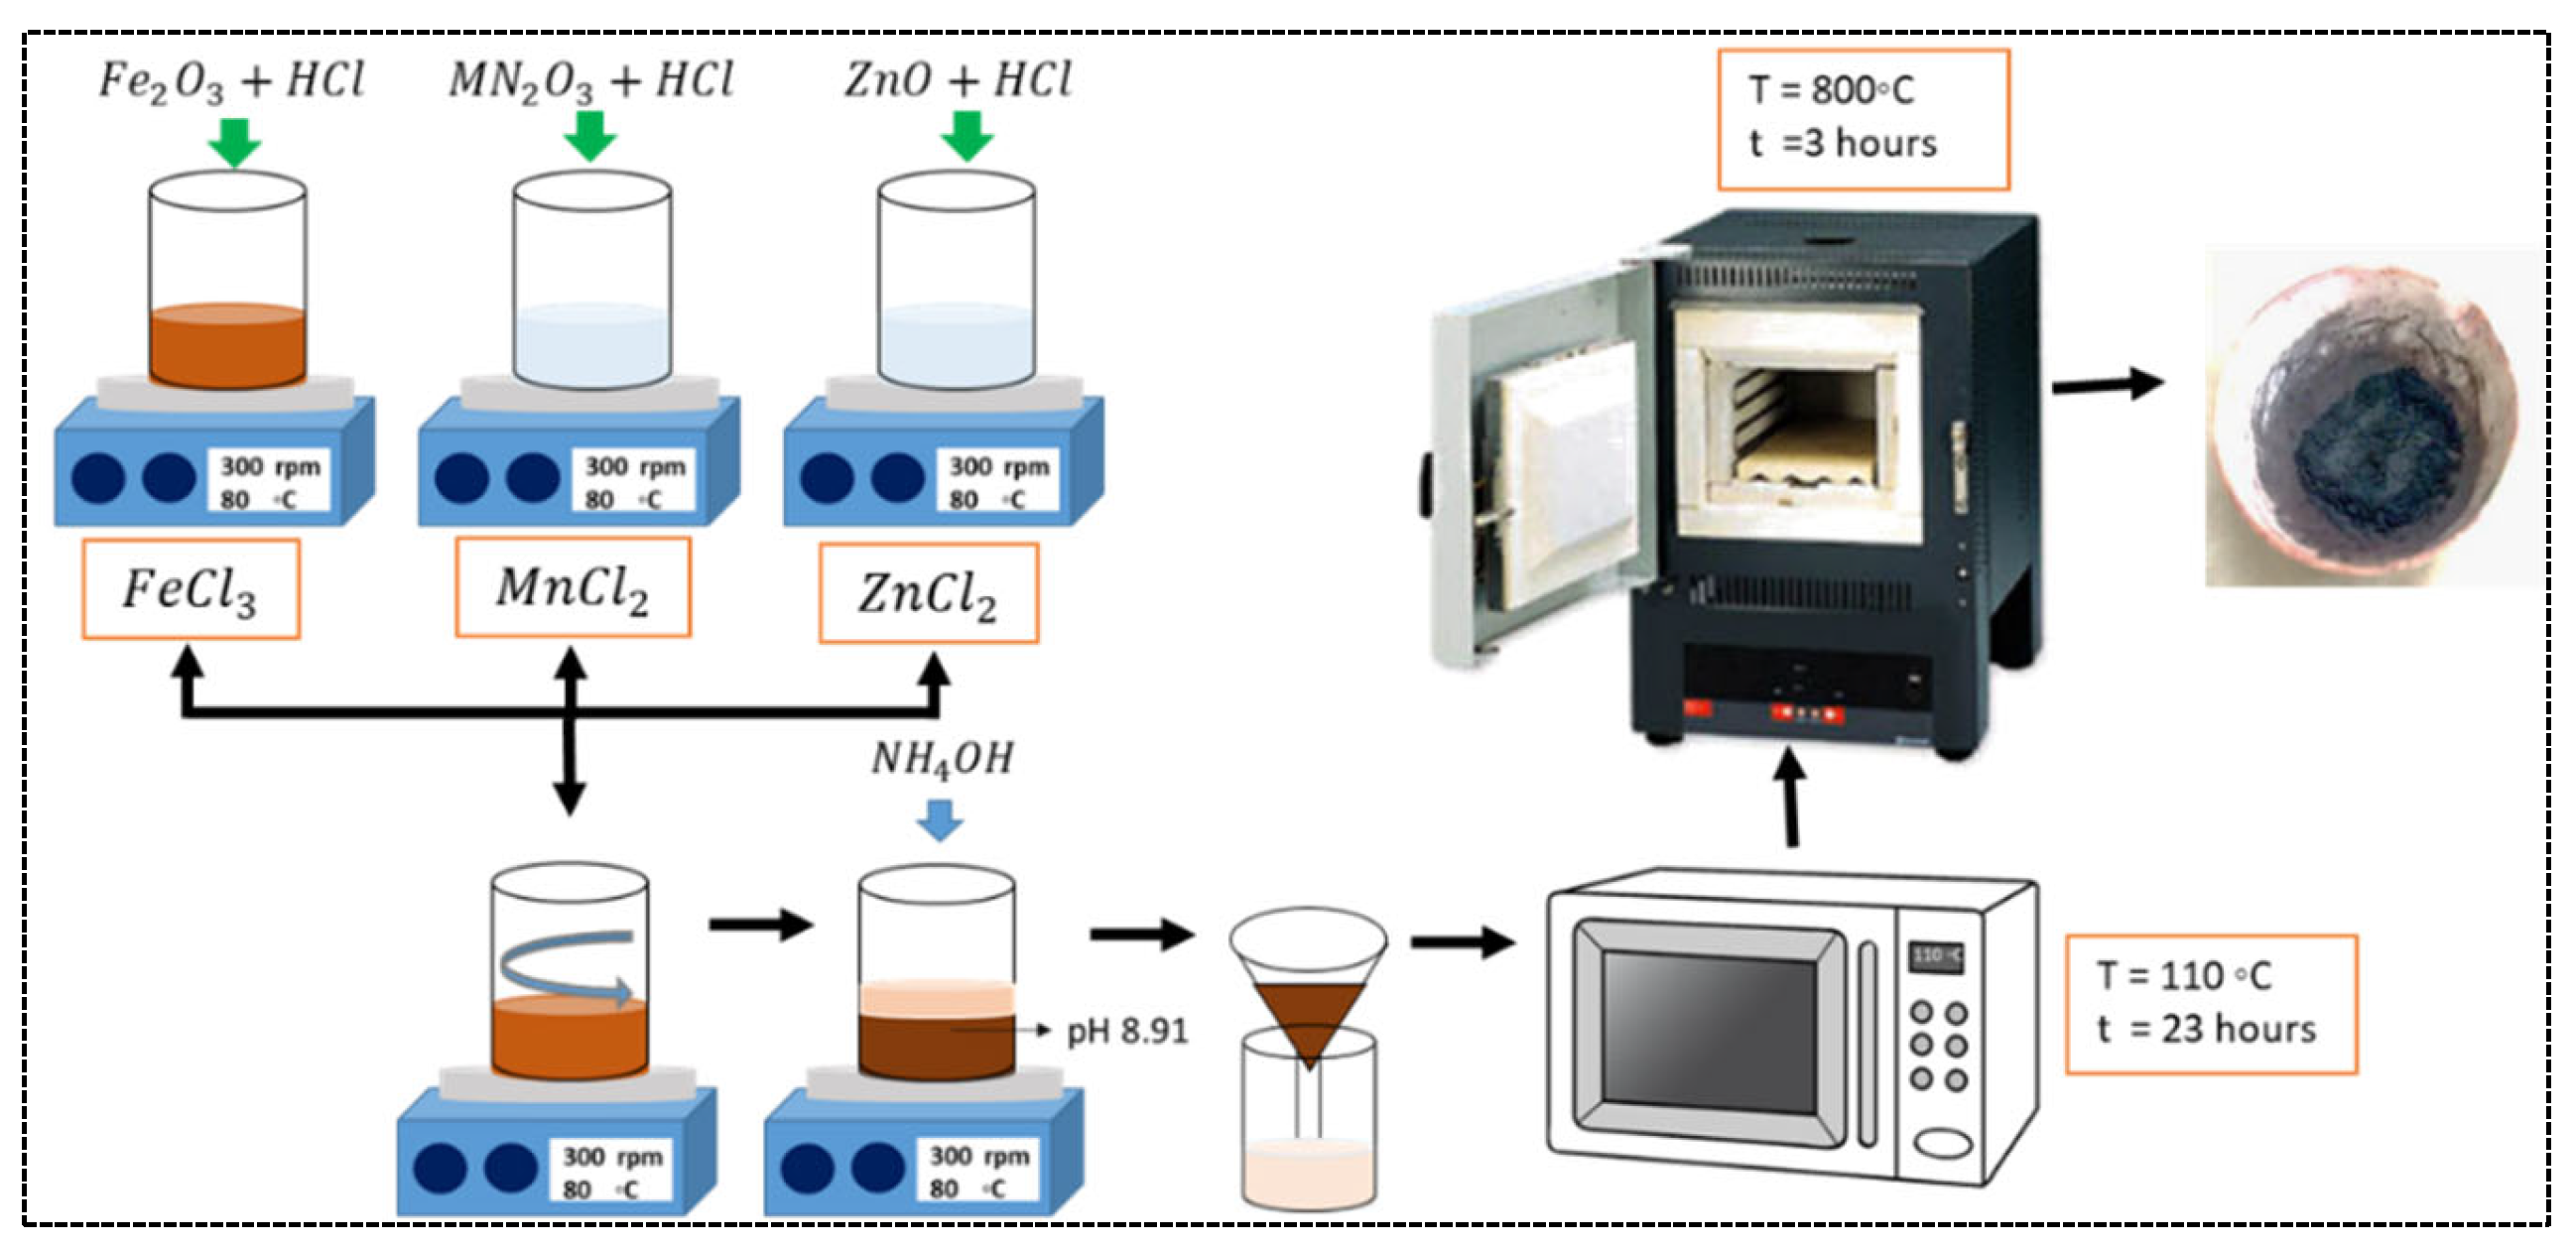
Figure 1. The Mechanism of the MZF powders synthesis.
Preprints 67341 g001
Figure 2. The mechanism of fabrication and characterization of MZF composite.
Preprints 67341 g002
Figure 3. Electrical characteristic as a gas sensor: (a) in various ethanol concentrations, (b) interpretation between %response and temperature as sensitivity
Preprints 67341 g003a
Figure 3. Relationship between %response and variation of ethanol concentrations at optimum temperature
Preprints 67341 g003b
Figure 4. XRD patterns of composite ceramics.
Preprints 67341 g004
Disclaimer/Publisher’s Note: The statements, opinions and data contained in all publications are solely those of the individual author(s) and contributor(s) and not of MDPI and/or the editor(s). MDPI and/or the editor(s) disclaim responsibility for any injury to people or property resulting from any ideas, methods, instructions or products referred to in the content.
Copyright: This open access article is published under a Creative Commons CC BY 4.0 license, which permit the free download, distribution, and reuse, provided that the author and preprint are cited in any reuse.
Prerpints.org logo

Preprints.org is a free preprint server supported by MDPI in Basel, Switzerland.

Subscribe

© 2024 MDPI (Basel, Switzerland) unless otherwise stated