Preprint
Article

Responses in the Coupling of Carbon and Water Vapor Exchanges of Irrigated and Rainfed Andean Potato (Solanum Tuberosum Subsp. Andigenum) Agroecosystems

Altmetrics

Downloads

167

Views

92

Comments

0

Submitted:

17 January 2023

Posted:

25 January 2023

You are already at the latest version

Alerts
Abstract
We studied the link between carbon and water fluxes to understand the response of net ecosystem carbon exchange (NEE) to water availability conditions of three different potato water regimes cropping systems [full irrigation (FI), deficit irrigation (DI) and rainfed (RF)]. Through the eddy covariance technique, we measured CO2 and water vapor exchanges and determined surface resistances, omega factor, and inherent water use efficiency (IWUE). Additionally, continuous plant growth determinations of leaf area index (LAI) and specific leaf area (SLA) were made over the three cropping systems. The RF potato was a net carbon source (NEE = 187.21 ± 3.84 g C m−2), while both, FI (NEE= −311.96 ± 12.82 g C m−2) and DI (−17.3 ± 4.6 g C m−2) were a net carbon sink. Greater sink activity is due to high fluxes of gross primary productivity (GPP) [where the GPP > ecosystem respiration (Reco)] and evapotranspiration (ET), and the high efficiency in the exchange of carbon and water. Without water limitations, the larger canopy, with greater photosynthetic activity (GPP/Reco > 2) as well as with low internal resistance offers a greater area for water and carbon exchange, and the highly coupled and synchronized ET – GPP fluxes are primarily controlled by the radiative environment. The lower sink capacity of the DI potato crop and the carbon source activity from the RF, are consequences of a smaller area for water and carbon exchange due to the smaller canopy, and a low IWUE from decoupled and desynchronized carbon and water exchange caused by unbalanced restrictions on ET and GPP fluxes. Specifically, at DI potato, ET remained at a high rate, while GPP was reduced by means of non-stomatal limitations. In the rainfed potato, vapor pressure deficit (VPD) played a significant role increasing midday canopy resistance (Rc) up to 13 times compared to irrigated sites, when VPD was around 0.8 kPa. In consequence, ET and GPP fluxes decreased together, but GPP decreased more than ET because of stomatal and non-stomatal limitations.
Keywords: 
Subject: Environmental and Earth Sciences  -   Environmental Science

1. Introduction

Efforts to achieve carbon neutrality and promote low-carbon development require climate-smart agriculture where crops cope with climate change impacts and emit relatively low greenhouse gases (Jennings et al., 2020; Lipper et al., 2014; X. Liu et al., 2021) such as carbon dioxide (CO2) (Bouzalakos and Mercedes, 2010; Guo et al., 2017). Vegetation plays a key role to achieve carbon neutrality through photosynthetic CO2 sequestration (Guo et al., 2017; X. Liu et al., 2021), therefore, is quite essential to understand how agroecosystems can act as carbon sinks and reduce the carbon flux from land into the atmosphere (Wood, 2021). Potatoes have comparatively low agricultural emissions compared to other crops (Clune et al., 2017; Haile-Mariam et al., 2008; Jennings et al., 2020; Nemecek et al., 2012), and one of the lowest average global warming potentials (Clune et al., 2017; Jennings et al., 2020). However, though potato is an important crop for food security, and for worldwide carbon and GHG balances (CIP, 2022; Devaux et al., 2014), little is known about its carbon sequestration potential which could be very diverse due to differences in crop management practices, especially in water management.
The net ecosystem carbon exchange (NEE), calculated as the difference between Reco and GPP, reflects the amount of CO2 captured or emitted by vegetation (X. Liu et al., 2021), and provides a means of identifying and monitoring carbon sinks (Fei et al., 2017; Wood, 2021). Nonetheless, the CO2, captured by vegetation through photosynthesis, is inherently associated with a water loss that regulates the mass-energy exchanges (Field et al., 1995; Tang et al., 2015). Plants tend to optimize the increase in carbon gain (increase GPP) while minimizing water losses (ET) (Katul et al., 2010a, 2009), resulting in a negative net ecosystem exchange (NEE) and a net gain of CO2 for the ecosystem (Díaz et al., 2022; Scott et al., 2006a). Under drought conditions, water to support GPP is limited and the rate of carbon uptake decreases (Ciais et al., 2005; Law et al., 2000; Pereira et al., 2007; Reichstein et al., 2002; Schwalm et al., 2010; Zhou et al., 2013). As a result, NEE varies from uptake to emission (Ciais et al., 2005; Jongen et al., 2011), and the potential of crops to act as carbon sinks could be reduced (Jongen et al., 2011).
Water and carbon fluxes are tightly coupled systems (Brunsell and Wilson, 2013; Díaz et al., 2022; Gentine et al., 2019; van Dijke et al., 2020a), which tend to be synchronized since they share common environmental controls, and the stomatal path of water vapor and CO2 exchange during photosynthesis (Gentine et al., 2019; Krich et al., 2022; Leuning, 1995; Lin et al., 2015; Lombardozzi et al., 2012). This essential tradeoff of water (ET) for carbon (GPP) (Díaz et al., 2022; Law et al., 2002), and their coupled relationship, could be quantified through water use efficiency (WUE), which connects water and carbon fluxes together and is a key indicator of ecosystem CO2–water coupling (Ali et al., 2017; Gentine et al., 2019; Hu et al., 2008; Keenan et al., 2013a; Li et al., 2022; Niu et al., 2011; Tang et al., 2015). However, though the WUE concept provides useful information to optimize water and carbon management in crop production (Keenan et al., 2013b; Oo et al., 2023; Xie et al., 2016) the influence of vapor pressure deficit (VPD) on canopy conductance (Monteith, 1986; Wagle et al., 2016) could lead to misinterpretation of carbon uptake and water loss responses to environment (Wagle et al., 2016). Many studies have indicated that WUE is strongly dependent on VPD at daily or hourly time scales (Abbate et al., n.d.; Beer et al., 2009; Herbst et al., 2002; Hu et al., 2008; Linderson et al., 2012; Morén et al., 2001; Tang et al., 2006; Zhou et al., 2015, 2014), and so the alternative concept Inherent Water Use Efficiency (IWUE) was suggested to include the effects of vapor pressure deficit (VPD) on the photosynthesis-transpiration relationship via stomatal conductance (Beer et al., 2009; Bierhuizen and Slatyer, 1965; Launiainen et al., 2011; Zhou et al., 2015, 2014). This approach is an analogy of the leaf level intrinsic water-use efficiency (iWUE), defined as the ratio of the fluxes of net photosynthesis and conductance for water vapor (Beer et al., 2009; Li et al., 2017).
At the ecosystem level, I W U E = ( G P P * V P D ) / E T , and it can be determined by means of carbon GPP and water ET measurements from the eddy covariance technique, since carbon assimilation is proportional to GPP, and VPD/E is a proxy for canopy conductance (Beer et al., 2009). From IWUE, the stronger linear relationship between GPP*VPD and ET (Beer et al. (2009), has been widely used to comparing diurnal cycles of carbon and water (Nelson et al., 2018a) and to explore carbon and water coupling interactions (Battipaglia et al., 2013a; Grossiord et al., 2014; Leonardi et al., 2012; Loader et al., 2011; Zhou et al., 2014). The IWUE represents the intrinsic link between carbon and water fluxes through stomatal conductance, however the extent of the surface control by stomata, will depend on the degree of decoupling [omega coefficient, (Jarvis and Mcnaughton, 1986)] between the plant canopy and the atmosphere (Steduto and Hsiao, 1998), which in turn, is controlled by VPD and soil water availability. In this sense, accounting for the effect of VPD results in a physiologically more meaningful approach for studying carbon–water interactions.
Photosynthesis and transpiration are closely related that knowledge and assumptions about one are required to understand the other (Nelson et al., 2018a). However, the interrelationship between carbon and water cycles in potatoes crops is not completely understood. To the best of our knowledge, there have been no water-carbon coupled studies that provide information to understand how water availability modulates the carbon sink or source behavior of potatoes. Specifically, research has not explored the mechanism and interactions of carbon and water coupling and its relation to the NEE. The available studies about sink capacity have been carried out for “European” potato (S. tuberosum Chilotanum Group), addressing the effect of climate and management on carbon fluxes (NEE, GPP, Reco) independently of water vapor flux (ET) (Aubinet et al., 2009; Buysse et al., 2017; Meshalkina et al., 2017, 2018; Moors et al., 2010). Likewise, only one study has reported a relatively high carbon sink capability of irrigated potato fields compared to other rainfed crop sites (Chi et al., 2016).
Around half of the global potato harvest comes from developing countries (Birch et al., 2012; Hill et al., 2021a; Mackay, 2009), where the “Andean” potatoes, S. tuberosum Andigenum Group (Ghislain et al., 2009; Raker and Spooner, 2002) are a primary source of income and the most crucial staple food (Hill et al., 2021a; Mosquera Vásquez et al., 2017). Andean potatoes are cultivated under short days of the tropical highlands in both industrial irrigated fields and rainfed systems customary among small-holders’ farmers. We hypothesize that, under well-watered conditions, a tight coupling between GPP and ET fluxes is due to Photosynthetic Photon Flux Density (PPFD)-drive high photosynthesis and evapotranspiration rates, generating the highest IWUE and therefore a larger diurnal sink activity (NEE more negative). In rainfed systems, severe drought episodes could affect the carbon sink capability of potatoes via decoupling between carbon and water fluxes and asynchronous response of GPP and ET. In this paper, we studied the close link between carbon and water fluxes to understand the response of NEE and its components GPP and Reco to water availability. We used carbon and water flux measurements from two industrial production systems and one small-scale rainfed systems to develop the following objectives: (a) quantify magnitudes of net ecosystem CO2 exchange (NEE) and its components (gross primary production, GPP, and ecosystem respiration, Reco) in irrigated and rainfed potato crops, (b) study the impact of water deficit periods on carbon and water vapor fluxes and explore the role of leaf area in controlling these fluxes, and (c) study and quantify ET-GPP coupling and inherent water use efficiency IWUE in irrigated and rainfed potato crops.

2. Methods

2.1. Site Description

The study area is in a fluvio-lacustrine plain landscape originated from the silting of an old lake that occupied different tectonic depressions formed in the process of lifting the eastern mountain range. The soils have the influence of volcanic ash from the volcanic bodies of the central mountain range and correspond predominantly to Andisol, Inceptisol and Vertisol orders (Service-USDA, 2014). The soils of the terrace relief generally have a depth greater than one meter, however, in the decaying marshes and valleys reliefs, the shallow soils are limited by the water table. The deficit irrigated (DI) cycle was carried out in a 9.5-hectare commercial lot under rain gun sprinkler system and located in the Municipality of Facatativá, Cundinamarca, Colombia (4.80371, -74.28883, ∼2573 m above sea level). Irrigation was only scheduled during periods when crop development is normally more sensitive to water stress; vegetative growth and tuberization stages. In the Municipality of Subachoque, Cundinamarca, Colombia (4.888668, -74.18668 ∼ 2609 m above sea level), the full irrigated (FI) cycle was performed in a 3.11 hectare commercial lot under a fixed-sprinkler irrigation system. The decision to irrigate the crop was made after identifying soil water deficit using a water balance calculated according to FAO-56 and monitoring the soil tensiometers installed inside crop. The rainfed (RF) cycle was carried out in a 6-hectare lot located in the municipality of Tenjo, Cundinamarca, Colombia (4.87033, -74.1294, ∼2572 m above sea level). In all study sites, a flat landscape where the soils have an isomesic texture and the parent material are medium-sized deposits and volcanic ash, and the apparent density is less than 1 g cm-3. The average annual temperature of 12 to 14 °C and an annual supply of rainfall between 500 to 1000 mm distributed in a bimodal way predominate. The June - August and December - February periods are the ones with the lowest rainfall (Martínez-Maldonado et al., 2021a).

2.2. Meteorological and Eddy Covariance Measurements

Using an eddy covariance station, net carbon exchange and weather variables inside the experimental fields were continuously recorded. In the DI site, the station was installed on March 19, 2020; in the RF site on August 13, 2020; and in the FI site on February 03, 2021. Measurements presented in this study extend from March 19, 2020, until July 30, 2020, at DI site, August 11 until December 11, 2020, at RF site and from February 02 until June 07 in FI site. The configuration of the eddy covariance EC micrometeorological station used at each evaluation site consisted of main and complementary sensors. The main sensor, the IRGASON, is a system integrated by an open-path gas analyzer (EC 150, Campbell Scientific, Inc., Logan, Utah, USA) and a 3D sonic anemometer (CSAT3A, Campbell Scientific, Inc., Logan, Utah, USA) both operated by a separated electronic module (EC100, Campbell Scientific, Inc., Logan, Utah, USA). EC tower and additional sensor configuration are described by Martínez-Maldonado et al. (2021).

2.3. NEE Partitioning between Gross Primary Productivity GPP and Ecosystem Respiration Reco

The exponential Mitscherlich light-response function, was used to partition diurnal NEE (solar global radiation >1 W m-2) into ecosystem respiration (Reco) and GPP (Falge et al., 2001; Tagesson et al., 2015):
N E E = A g m a x + R d * 1 e x p ɸ * I i n c A g m a x + R d + R d
where Agmax is the light saturated CO2 uptake [µmol (CO2) m–2 s–1]; Rd is respiration [µmol (CO2) m–2 s–1] and ɸ is the quantum yield [µmol (CO2) µmol (photon) -1], and Iinc is the incident PPFD [µmol (photon) m–2 s–1]. Calculations, data post-processing, quality control, gap-filling, energy balance closure, uncertainty, statistical analysis methods and balance closure are described in Martínez-Maldonado et al. (2021a).

2.4. ET-GPP Coupling Analysis

2.4.1. Inherent Water Use Efficiency

The IWUE was determined to both, daily and half hour temporal scales following the theoretical approach proposed by Beer et al. (2009) which is based on the intrinsic water-use efficiency (iWUE) concept, defined as the ratio of the fluxes of net photosynthesis and conductance for water vapor (Leonardi et al., 2012):
i W U E = A g H 2 O   v = g c * c 1.6 * g c = c 1.6
where 1.6 is the molar diffusivity ratio of CO2 - H2O (i.e., gH2O = gCO2 *1.6, lighter H2O molecules diffuse more rapidly than does CO2) “1.6*gc” is the stomatal conductance for water vapor (Gentilesca et al., 2021). Approximating at the ecosystem level, the vapor pressure difference v is atmospheric VPD, leaf level carbon assimilation A is GPP from eddy covariance observations and g H 2 O   v is g ’ that is solved as:
g = E T 1.6 * V P D  
where g’ is the conductance at the ecosystem level proposed by Beer et al. (2009). The usage of marker ‘ indicates that variables are analyzed at ecosystem level. The inherent water use efficiency (IWUE) was then represented by:
I W U E = G P P g = g * c 1.6 * g = c 1.6 = G P P 1.6 *   E T 1.6 * V P D = G P P * D P V E T

2.4.2. Diurnal and Daily ET-GPP Coupling and Synchrony

From Equation (6), there is a linear relationship between GPP and ET, adjusted by VPD. To quantify the degree of carbon–water coupling for an individual day, the linear correlation coefficient ET vs GPP*VPD was computed using the half-hourly data (Aguilos et al., 2021; Nelson et al., 2018a; Zhou et al., 2014). The correlation coefficients were determined on both, the daily scale during all crop growth for each site, and the average half-hour for each growth stage “vegetative”, “tuberization” and “tuber bulking” for each site. When correlation values are close to unity (r > 0.85), the two signals tend to be well coupled and synchronized. In contrast, low correlation values indicate carbon–water decoupling and a poor synchronization of the two fluxes (Nelson et al., 2018a).

2.4.3. Coupling between the Plant Canopy and the Atmosphere

The extent to which stomatal and canopy conductance may control water vapor and CO2 exchange was determined through the decoupling factor omega (Ω) calculated at daily scale using the expression of Jarvis & Mcnaughton (1986):
Ω = 1 1 + 2 R c s ϒ + 2 * R a
where Ra is the aerodynamic resistance of the canopy, Rc is the canopy stomatal resistance to vapor diffusion, and ϒ is the psychrometric constant. The Rc was calculated to both daily and half hour temporal scales by using:
R c = ρ * c p * V P D ϒ * L E + ϒ β 1 * R a
where ρ is the mean air density, cp is the specific heat for air, ϒ is the psychrometric constant, Δ is the slope of the saturation vapor pressure-temperature curve calculated at the air temperature Taβ is the Bowen ratio and Ra is the aerodynamic resistance. Finally, ra was calculated to both, daily and half hour temporal scales by:
r a = ln Z Z o v u *   K 2
where k is the von Karman constant, u* is the friction velocity (m·s−1), z is the measurement height and zov is the surface roughness (≅0.01h) for water vapor.

2.5. Biological Measurements and Growth Analysis

From planting and during crop growth, sampling of plants with sequential harvesting was performed. Every 11 or 12 days, ten plants were randomly uprooted for growth analysis after 35, 41, 48, 57, 63, 69, 78, 84, 97, 104, 112, 124, 133, and 147 days post planting (DPP) at DI site; after 25, 37, 47, 54, 65, 75, 85, 98, 105, and 116 DPP at RF site and 33, 46, 57, 70, 80, 96, 110, 122, 135 and 152 DPP, at FI site. The plants were partitioned into four components: green leaves (lamina and petiole), roots, stems, and tubers. The total leaf area and fresh weight of each sample were measured. Plant material was then placed in paper bags and dried in a forced-air drying oven to constant weight at 70 °C. Dry weight data for leaves, roots, stems, and tubers were fitted to nonlinear functions.
Growth and morphological parameters such as specific leaf area (SLA) and leaf area index (LAI) were calculated as outlined by (Hunt, 1990).
L A I = L A P
where LA is total leaf area per plant, and P is unit of land area. The SLA measure the density or relative thinness of leaves, which relates the leaves’ areas with their dry weight (Hunt, 1990):
S L A = L A 1 L W 1 + L A 2 L W 2 2
where LW is total leaf dry weight per plant.

3. Results

3.1. Meteorological Conditions

The average of daily mean PPFD was significantly higher (p < 0.05) in the FI site (724.5 ± 216.7 µmol photons m−2 s−1) compared to DI (382.45 ± 288.86 µmol photons m−2 s−1) and rainfed (567.9 ± 230.7 µmol photons m−2 s−1). The average daily maximum vapor pressure deficit (VPD) was higher in the RF site (0.80 KPa ± 0.24) compared to FI (0.73 KPa ± 0.25) and DI(0.59 KPa ± 0.16), while the average daily mean VPD was lower at the DI site (0.29 KPa ± 0.09) compared to FI (0.38 KPa ± 0.12) and RF (0.40 KPa ± 0.16) sites. The accumulated rainfall for the RF site was 229 mm, with a non-uniform time distribution, including events of consecutive dry days followed by high rainfall events, observed by the end of the crop cycle, reaching 98 mm in one week (101 to 107 DPP). The accumulated rainfall for the FI (306 mm) and DI (293 mm) sites were higher and more uniformly distributed, however, at FI site, a drier lapse occurred, from 50–90 days. At the DI site, accumulated rainfall was 306 mm. Low water availability in RF site (SWC < WP) was around 71% of total crop growth days, however, an increase of SWC occurs after 100 days because of higher rain. At the DI site, SWC was closer to the WP level than FC, and was < WP around 40% mainly during initial crop growth days (20 -50 DPP) (Figure 1).

3.2. Carbon Fluxes of NEE, GPP, and Reco

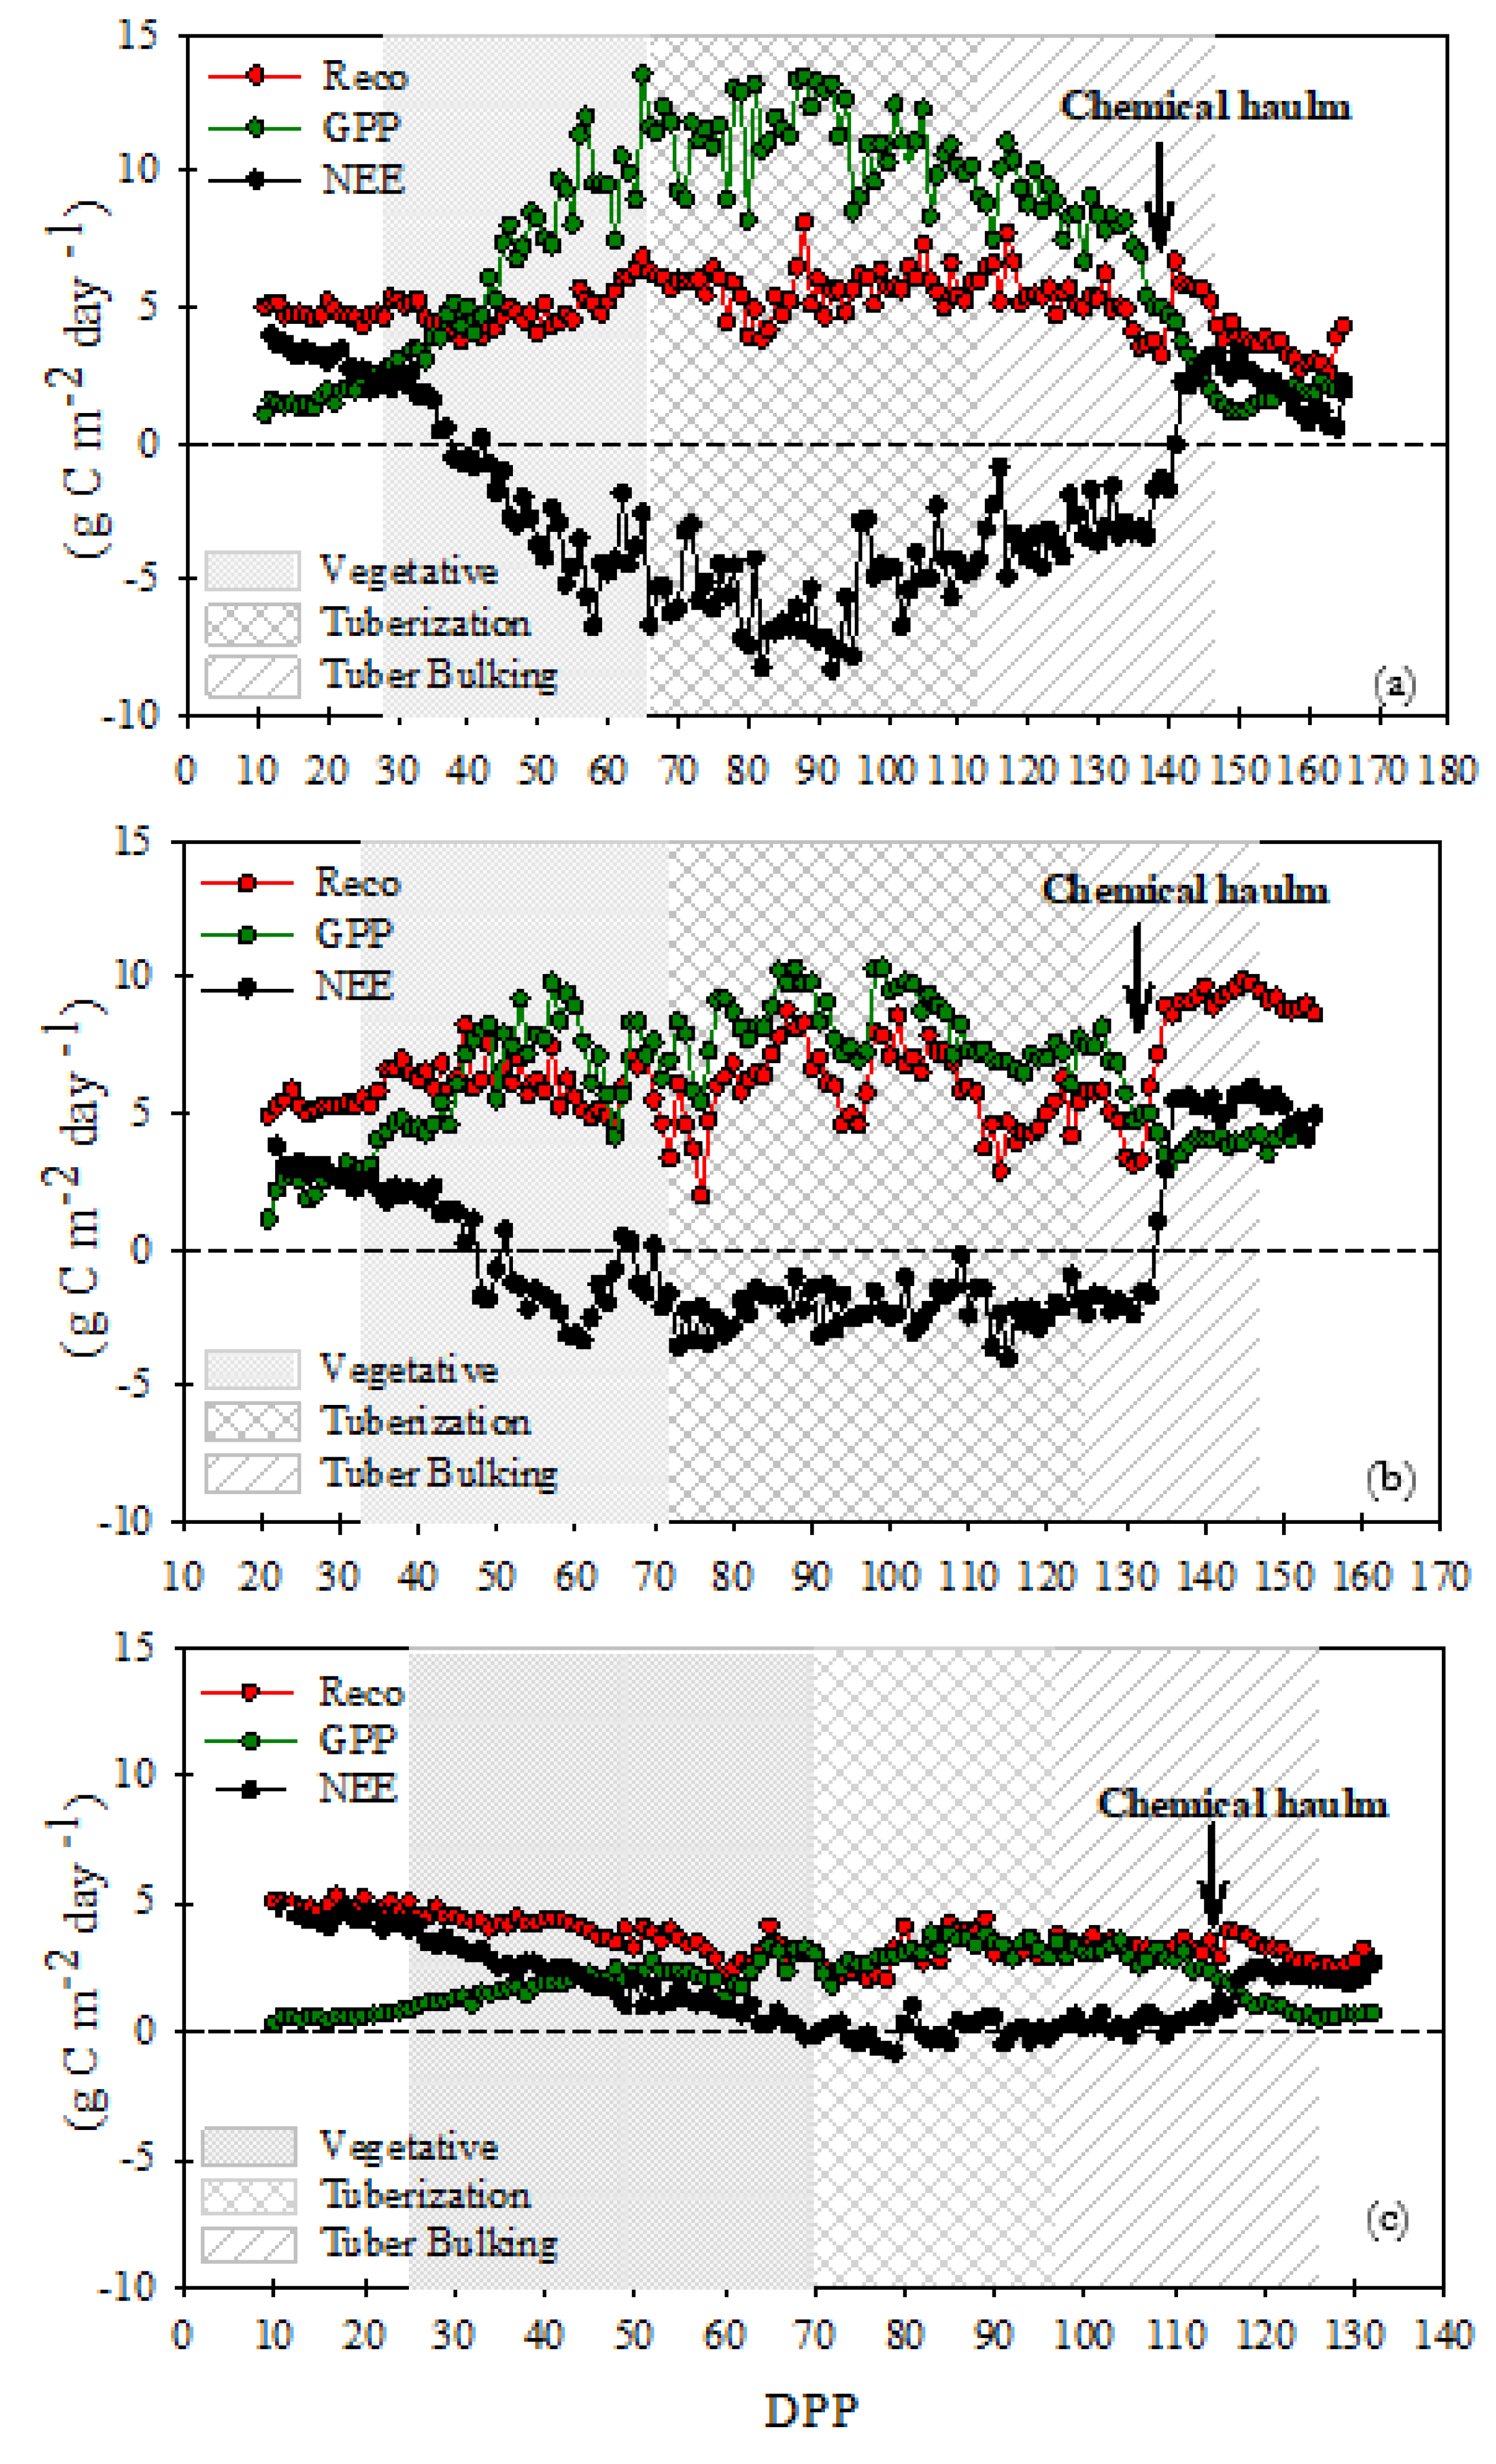
In the FI site, GPP was the dominant process over the different growth stages, while Reco values were lower and had stable values near 5 g C m-2 d-1. Daily GPP and Reco peaked at 13.53 g C m-2 d-1 and 8.1 g C m-2 d-1, respectively, in the tuberization growth stage. NEE values were positive during the first days of the vegetative period, because of the scarce plant cover (GPP close to zero), and during chemical haulm (137 DPP). The NEE negative values decreased rapidly due to the progressive increase of GPP, starting in the vegetative stage when crop emergence occurred, and reaching the most negative values during the tuberization growth stage. As a result, the sink function was strong during the tuberization growth stage, with a daily NEE peak of - 8.35 g C m-2 d-1. At DI site, GPP was slightly higher than Reco throughout the growth stages. Compared to the FI site, the GPP values were lower and Reco, higher. They peaked at 10.34 g C m-2 d-1 and 9.86 g C m-2 d-1, respectively, in the tuberization growth stage. Again, NEE fluxes increased as a result of the progressive increase of GPP, however, since the SWC was below the WP level about 41% of the growth cycle, the sink function was weaker than the FI site, with NEE daily peak of - 4.02 g C m-2 d-1. In the RF site, the water deficit extended to the vegetative growth and transition phases, during 70% of the cycle. In consequence, Reco dominated the NEE, resulting in a strong daily release of carbon (positive values) during the initial stage of growth. In the tuber stage and most of the tuber bulking, GPP and Reco had similar values and NEE remained at values close to zero until day 120 DPP, where emissions were related to chemical dehaulming (Figure 2).
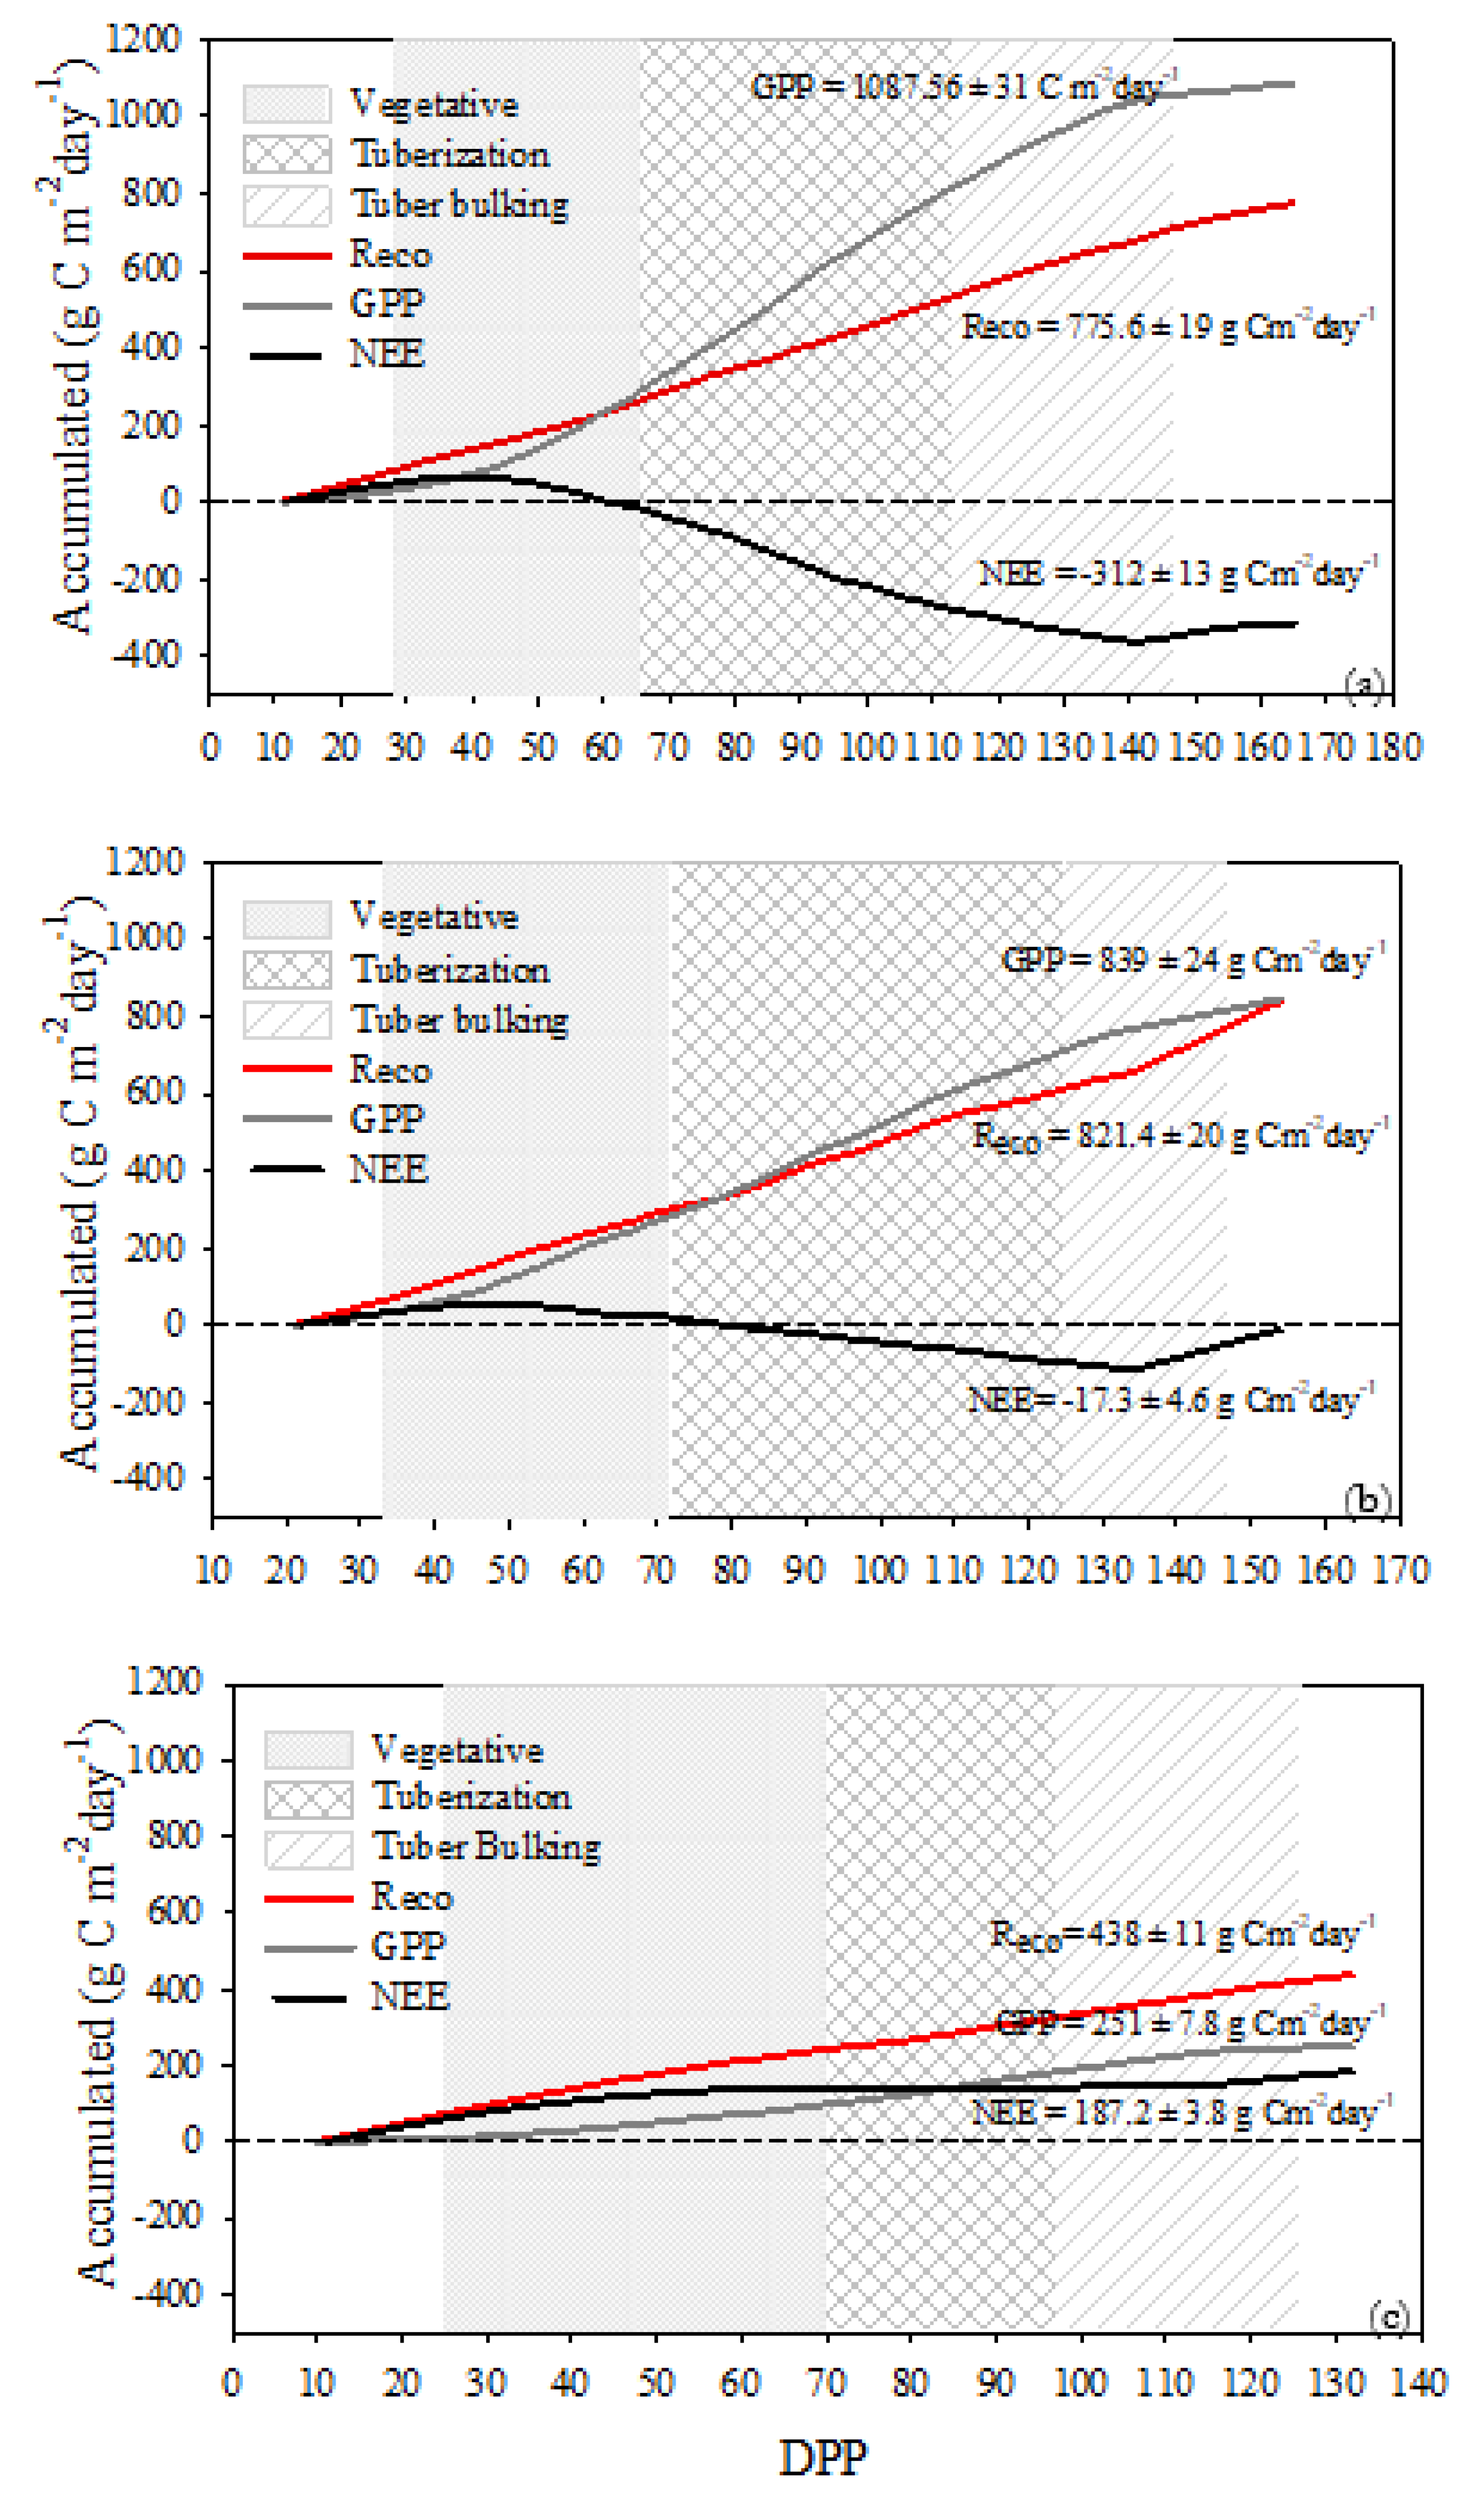
The differences in the carbon budgets between FI, DI, and RF can be observed in the accumulated NEE, GPP, and Reco (Figure 3). During the initial stages of growth positive values of accumulated NEE were observed in the three measurement sites. However, at the end of the vegetative stage, the FI site was a slight sink of CO2 with a cumulative NEE of −26 ± 3.47 g C m−2 while DI and RF sites were CO2 sources to the atmosphere (16.91 ± 2.14 g C m−2 and 143 ± 5.65 g C m−2, respectively). From the beginning of the tuberization phase, the FI and DI sites were carbon sinks. Nonetheless, the net carbon accumulation at the FI site was greater by -302 g C m−2 compared to DI during the tuberization until the end of the tuber bulking stage. The RF site was a CO2 source to the atmosphere during all growth stages because of its cumulative NEE of 175 ± 3.84 g C m−2 at the end of tuber bulking. The effect of chemical haulm is observed as a change in the evolution of the accumulated NEE curve, the daily positive values limit the final balance making it less negative, which is quite evident in the DI site. At the end of the cycle, including haulming emissions, the cumulative NEE at FI, DI and RF was −311.96 ± 12.82, −17.3 ± 4.6 and 187.21 ± 3.84 g C m−2, respectively.
The cumulative GPP was 1087.56 ± 31 g C m−2, 838.69 ± 24 g C m−2 and 250.70 ± 7.8 g C m−2 for FI, DI and RF, respectively, and the Reco sums were 775.6 ± 19 g C m−2, 821.39 ± 20 g C m−2 and 437.92 ± 11 g C m−2. In the FI site, differences in the accumulated values of GPP and Reco begin from the vegetative phase; the GPP values are substantially higher until the end of the evaluation period showing a sigmoidal behavior. Compared to Reco, the cumulative GPP at DI was slightly higher from the 90 ddp in the tuberization growth stage, but it became lower while under chemical haulm practice. In the RF site, the accumulated Reco was higher than GPP during all growth stages (Figure 3).

3.3. Crop Development, Surface Resistance and Carbon - Water Fluxes

In the FI site, the higher LAI (max LAI = 4.3 at 82 DPP) and the decrease of the SLA during the vegetative stage (specifically during accelerated growth, 30 – 50 DPP), imply a greater canopy expansion and a greater assignment of biomass for thicker leaves. At the DI site, the maximum LAI (3.15 at 92 DPP) was similar to that observed at the RF site (3.14 at 78 DPP). For both sites, after reaching max LAI, a strong drop in LAI was observed compared to FI site. The increasing behavior of the SLA during the vegetative growth in the RF site and tuberization in the DI site indicates that the canopy had less thick leaves compared to FI (Figure 4).
An average of 80 ± 14.6% of the net radiation was partitioned to latent heat flux, and its variation was associated with LAI evolution at the FI site. The highest percentage of energy destined for latent heat flux (average of 85.3 ± 16.3%) was observed during the tuberization stage when canopy reached the maximum LAI. In the tuber bulking, the expressive reduction in the latent heat partitioning follows the course of LAI during leaves senescence (Figure 4a). At the DI site, the energy distribution for LE does not clearly follow the LAI variation and was slightly lower (mean 74 ± 8.89%) compared to FI. During the tuberization stage, at maximum LAI, a slightly lower allocation to latent heat from Rn (76.6 ± 8%) was also observed (Figure 4b). At the RF site, the Rn distribution for LE during the growth cycle averaged 52 ±16.19%. Likewise, at maximum LAI, the LE allocation only reached 47.3 ± 15.8%, being unclear the association between the energy consumption by the latent heat and the variation of LAI (Figure 4c).
The GPP/Reco relationship allows determining what fraction of the assimilation (GPP) is consumed by the plant or by the heterotrophic activity from soil. Values below 1 take place when the system behaves as a source of CO2 and there is a predominance of heterotrophic respiration. When GPP/ Reco > 1, the GPP is greater than Reco and the system is storing carbon. At the FI site, Reco was equal to or greater than GPP (GPP/Reco ratio < 1) during the initial crop growth (0 – 38 DPP, low crop cover) and at the end of tuber bulking. From 39 DPP, the GPP/Reco ratio was greater than 1, and their values increased following the LAI pattern until reaching values around 2 Maximum GPP/Reco values (between 2.6 and 2.8), were reached during the maximum LAI in the tuberization stage. At the DI site, GPP/Reco ratio behaves like the FI site. GPP/Reco ratio was less than one, during the initial phases (0 – 50 DPP) and at the end of tuber filling GPP/Reco < 1. However, during tuberization and tuber bulking, the GPP/Reco ratio ranged from 1 to 1.5. In the RF site, during most of the cycle, the GPP/Reco ratio was below 1, and only in the tuberization growth stage the GPP/Reco was > 1 (Figure 4).
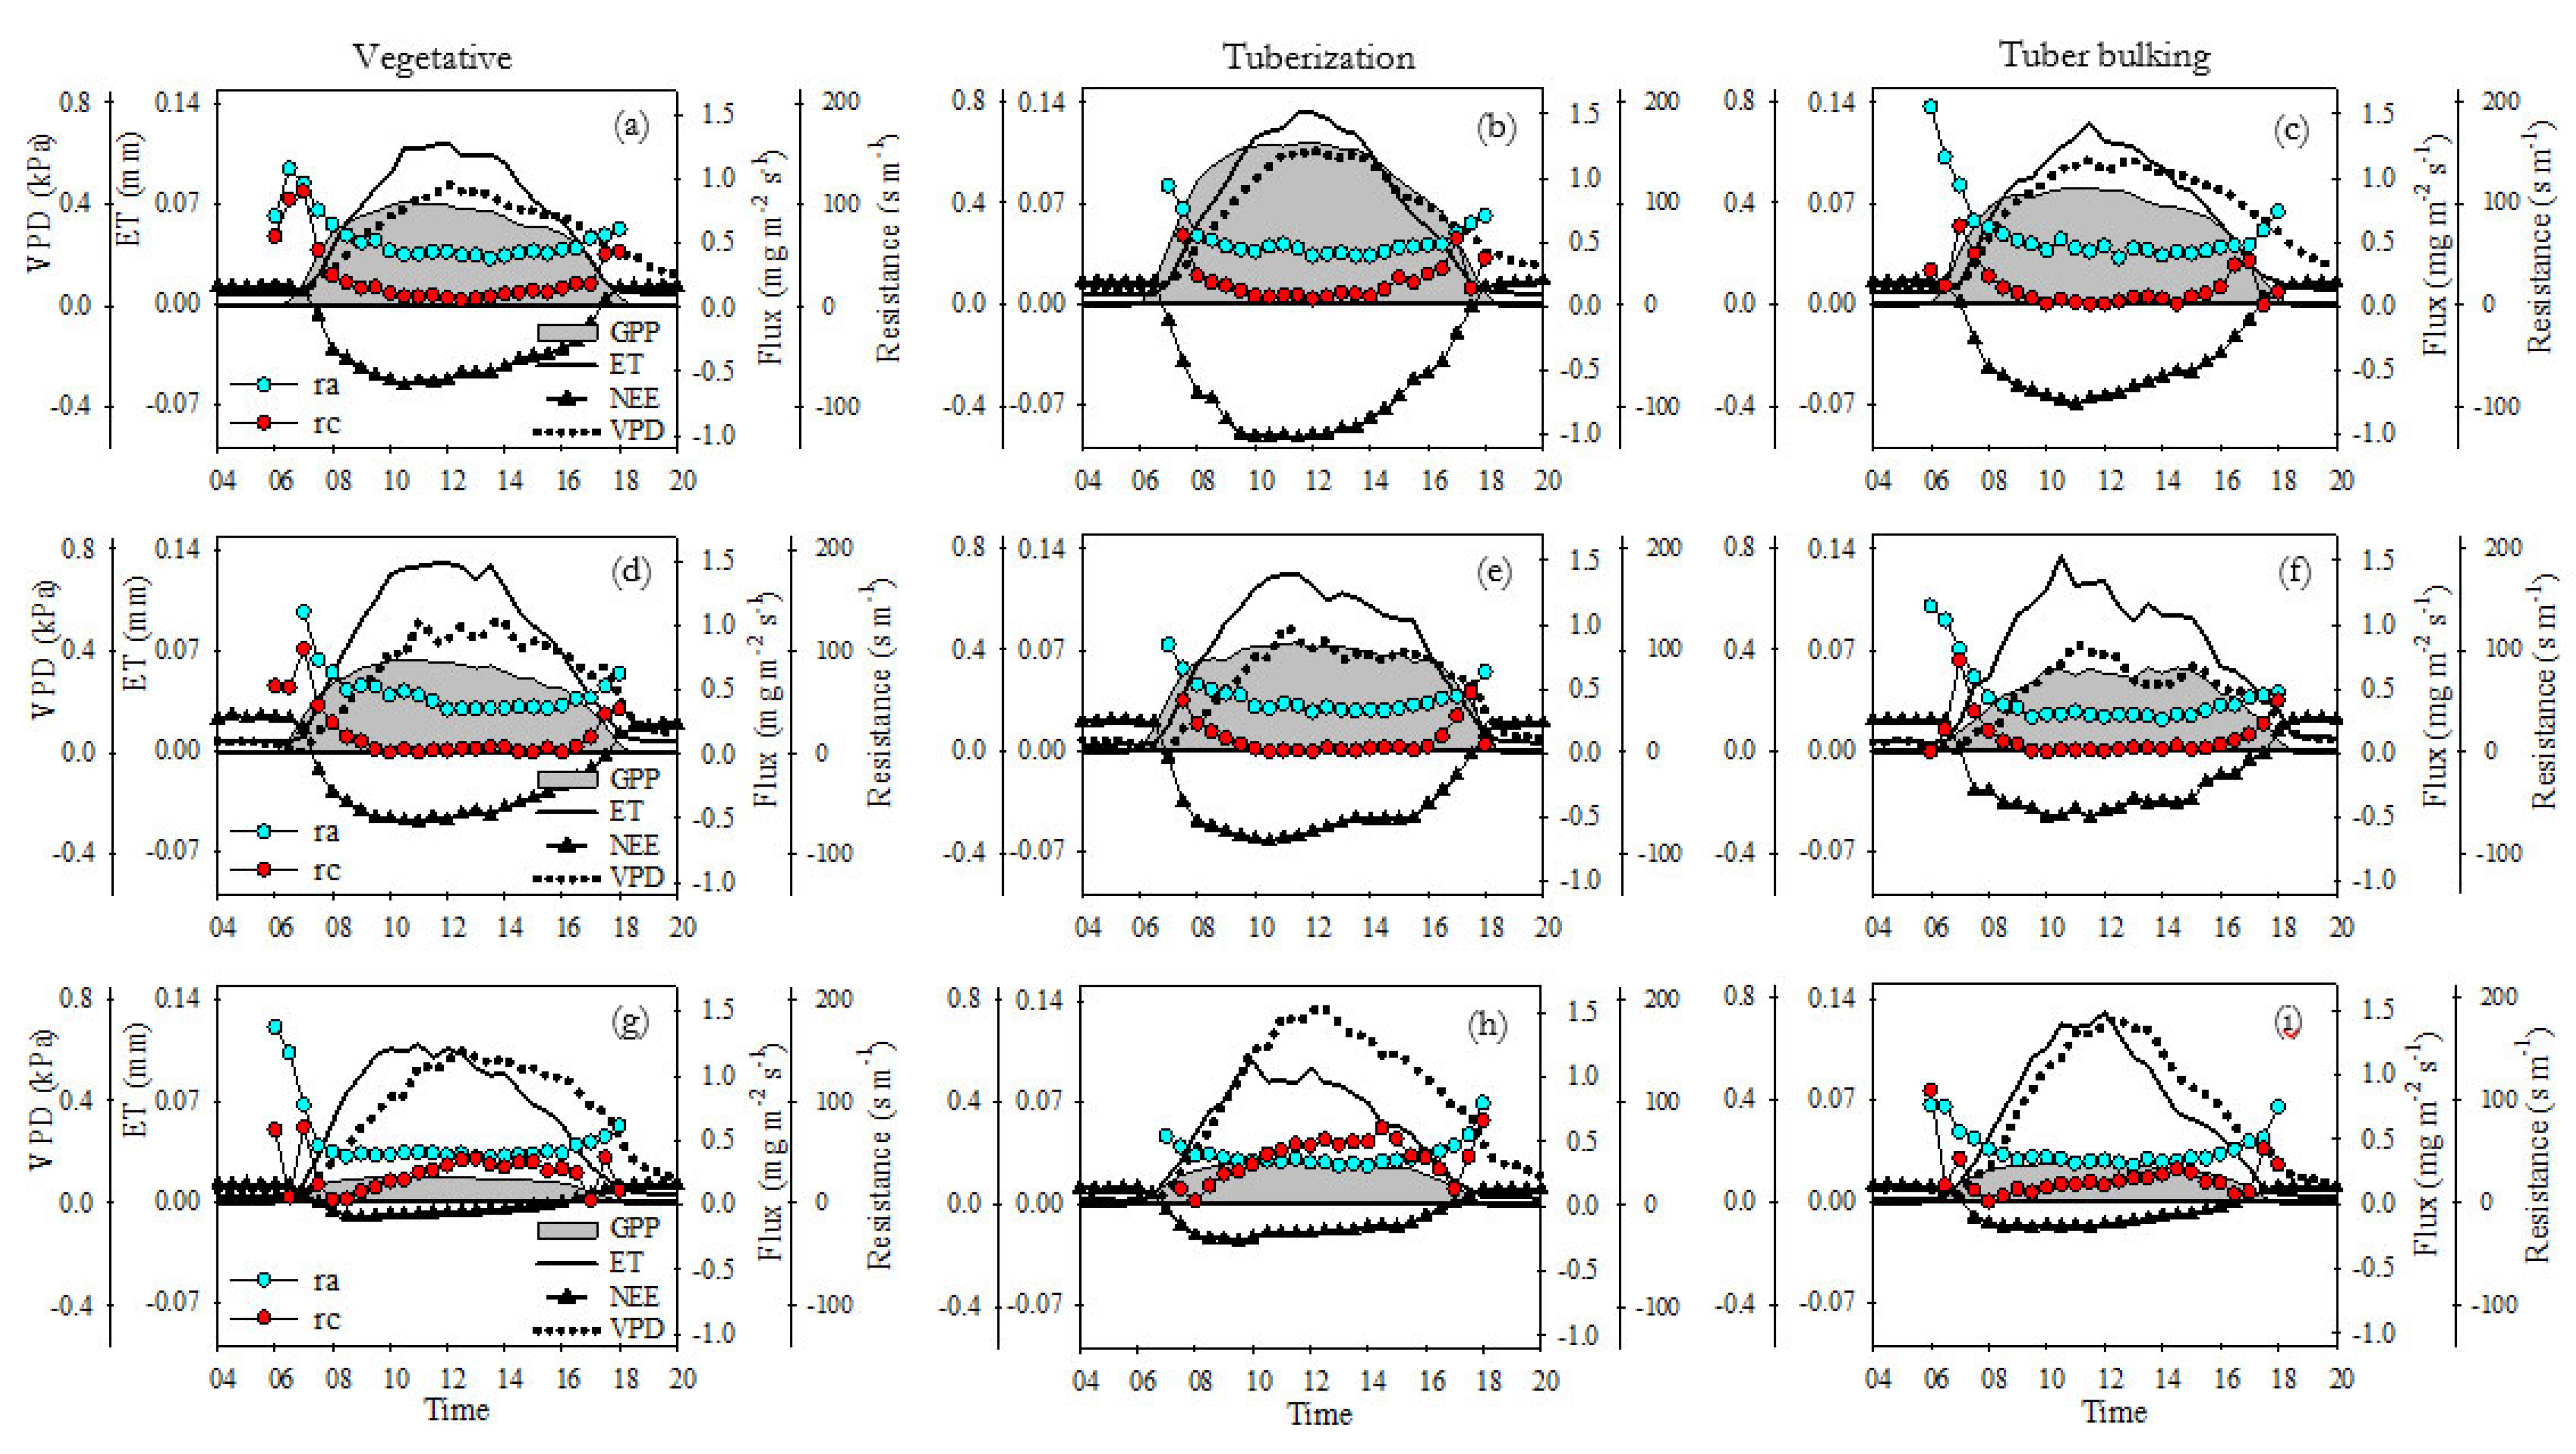
The diurnal pattern of canopy resistance (Rc) was quite different from that of aerodynamic resistance (Ra). In the FI site, Rc ranged from 17.01 to 75.06 s m−1, with an average of 38.27 (± 12.63) s m−1 during the entire growth period. Minimum and maximum Ra were 44.15 s m− 1 and 146.04 s m− 1, respectively, with an average of 90.2 (± 23.13) s m− 1 (Figure 5a) The diurnal patterns of Rc and Ra at DI were similar to those in the FI site, varying from 11.15 to 80.42 s m− 1 and from 37.32 to 112.38 s m− 1, respectively and with averages of 32.67 (± 14.86) s m− 1 and 74.22 (± 18.11) s m− 1, respectively (Figure 5b). However, in the RF site, Rc values strongly increased, and its daily variation was much higher than FI and DI sites, ranging from around 10.36 to 133 s m− 1, with an average of 56.07 (± 28.75) s m-1. The daily values and variation of Ra are lower than the other sites, ranging from 36.5 to 114 s m−1, with an average of 64.52 (± 14.66) s m-1. Furthermore, it can be observed that in the RF site Rc was generally higher than Ra reaching values over 100 s m-1 during both, vegetative and tuberization stages (Figure 5c).
The total ET was 297.69 mm for the FI site, 265.05 mm for DI, and 191.38 mm for the RF site. The average daily ET was lower (1.5 mm day-1) for the RF site compared with the DI (2 mm day-1) and FI (1.93 mm day-1). At the FI site in the vegetative stage, the daily sums of ET ranged from 1.05 to 2.8 mm day-1 and accumulated ET was and 71 mm, but those values increased during tuberization to an accumulated of 95 mm, and daily sums ranging from 0.97 to 3.2 mm day-1. During Tuber bulking accumulated ET was 50.1 mm while daily ET sums ranged from 1.3 to 3 mm day-1. At the DI site, daily sums of ET ranged from 1.14 to 4 mm, with an accumulated of 87 mm during vegetative growth. The values of daily sums of ET in the tuberization stage were 1.3 to 3.4 mm day-1, and the ET accumulated was 98 mm. The lower values were measured for tuber bulking, when daily sums of ET varied from 1.45 to 2.5 mm day-1, with an accumulated of 46 mm. The RF site had daily sums of ET fluctuating from 0.89 to 3 mm, with an accumulated of 78 mm during vegetative growth. Compared to FI and DI, lower values of daily sums and accumulated ET were measured during the tuberization stage; from 0.78 to 2.3 mm day-1, and 36 mm (almost 60 mm difference to FI and DI), respectively. At the tuber bulking stage, although daily sums (0.6 – 3.3 mm day-1) were similar to FI and DI, lower values were found for accumulated ET (30 mm) (Figure 5).

3.4. Diurnal ET-GPP Trends, Synchrony and IWUE

Results of the diurnal pattern of vapor pressure deficit (VPD), aerodynamic resistance (Ra), canopy resistance (Rc), ET, and GPP fluxes for FI, DI, and RF sites are presented in Figure 6. The highest daytime carbon and ET fluxes were observed for the FI site, mainly during the tuberization stage (Figure 6b). The GPP showed an increasing trend throughout the day, reaching the highest values around 10:00 – 12:00 (0.83 mg m-2 s-1, 1.27 mg m-2 s-1, 0.77 mg m-2 s-1 for vegetative, tuberization, and tuber bulking respectively) after that, it remained constant until 14:00 and then it dropped. The ET had a similar pattern, but peaked at midday (0.11 mm, 0.13 mm, and 0.12 mm for vegetative, tuberization, and tuber bulking respectively) and dropped immediately after. Under FI conditions, the highest sink activity was observed around 10:00 – 12:00, reaching min NEE values of -0.6 mg m-2 s-1, -1.025 mg m-2 s-1, and -0.59 mg m-2 s-1 for vegetative, tuberization and tuber bulking respectively. At the DI site, the diurnal patterns of ET and GPP were like FI, but they peaked earlier (around 9:00). Compared to the FI site, daytime ET was similar, but GPP was lower mainly during tuberization (-0.68 mg m-2 s-1) and tuber bulking (-0.23 mg m-2 s-1) stages (Figure 6e,f). In consequence, the daytime sink activity had a reduction of 34% and 61% for tuberization and tuber bulking respectively, compared to FI NEE values. The RF site had the lowest daytime carbon and ET fluxes. ET peaked values reached at 9:00 during vegetative and tuberization stages were 11% and 31% lower compared to the same stages in the FI site (Figure 6g,h). However, the largest reductions were observed for GPP and NEE fluxes, where the sink activity was reduced by 85%, 73%, and 83% during vegetative, tuberization, and tuber bulking stages, respectively, compared to the same stages in the FI site.
At FI and DI, the VPD increases progressively from 7:00, reaching the highest values around 11:00 – 12:00; max VPD values were near 0.5 kPa, between 0.5 – 0.6 kPa, and 0.4 – 0.6 kPa, for vegetative, tuberization and tuber bulking respectively. In the RF site, an increase of VPD during daytime was observed, reaching maximum values around 12:30 of 0.6 kPa, 0.8 kPa, and 0.72 kPa for vegetative, tuberization, and tuber bulking respectively.
We observed a typical theoretically expected parabolic variation in the diurnal trend of Rc and Ra during all growth stages in both sites (Alves et al., 1998; Irmak and Mutiibwa, 2010; Lin et al., 2020; Monteith and Unsworth, 2013; Perez et al., 2006; Rana et al., 1994). At the FI and DI sites, Rc had high values (> 30 m s-1) in the early morning (5:00 – 8:00), then tend to decrease toless than 15 m s-1, remaining relatively constant from 10:00 to 15:00 After this, Rc increases gradually in the afternoon. The Ra had a diurnal pattern similar to that of Rc and almost does not change among growth stages. However, in both FI and DI sites, values of Ra were higher than Rc, ranging from 40 to 80 m s-1. In the RF site, the diurnal pattern of Rc was different, showing an increasing trend throughout the day and higher values than FI and DI sites. From early morning, Rc increased linearly to its highest values (45 m s-1, 74 m s-1, 32 m s-1 for vegetative, tuberization, and tuber bulking respectively) around 13:00 – 14:00 and then dropped. From midday to noon, during the vegetative and tuberization stages, the Ra values were less than or equal to Rc, due to the changes in the diurnal pattern of Rc and a lower Ra (ranging from 30 to 60 m s-1) under RF conditions (Figure 6).
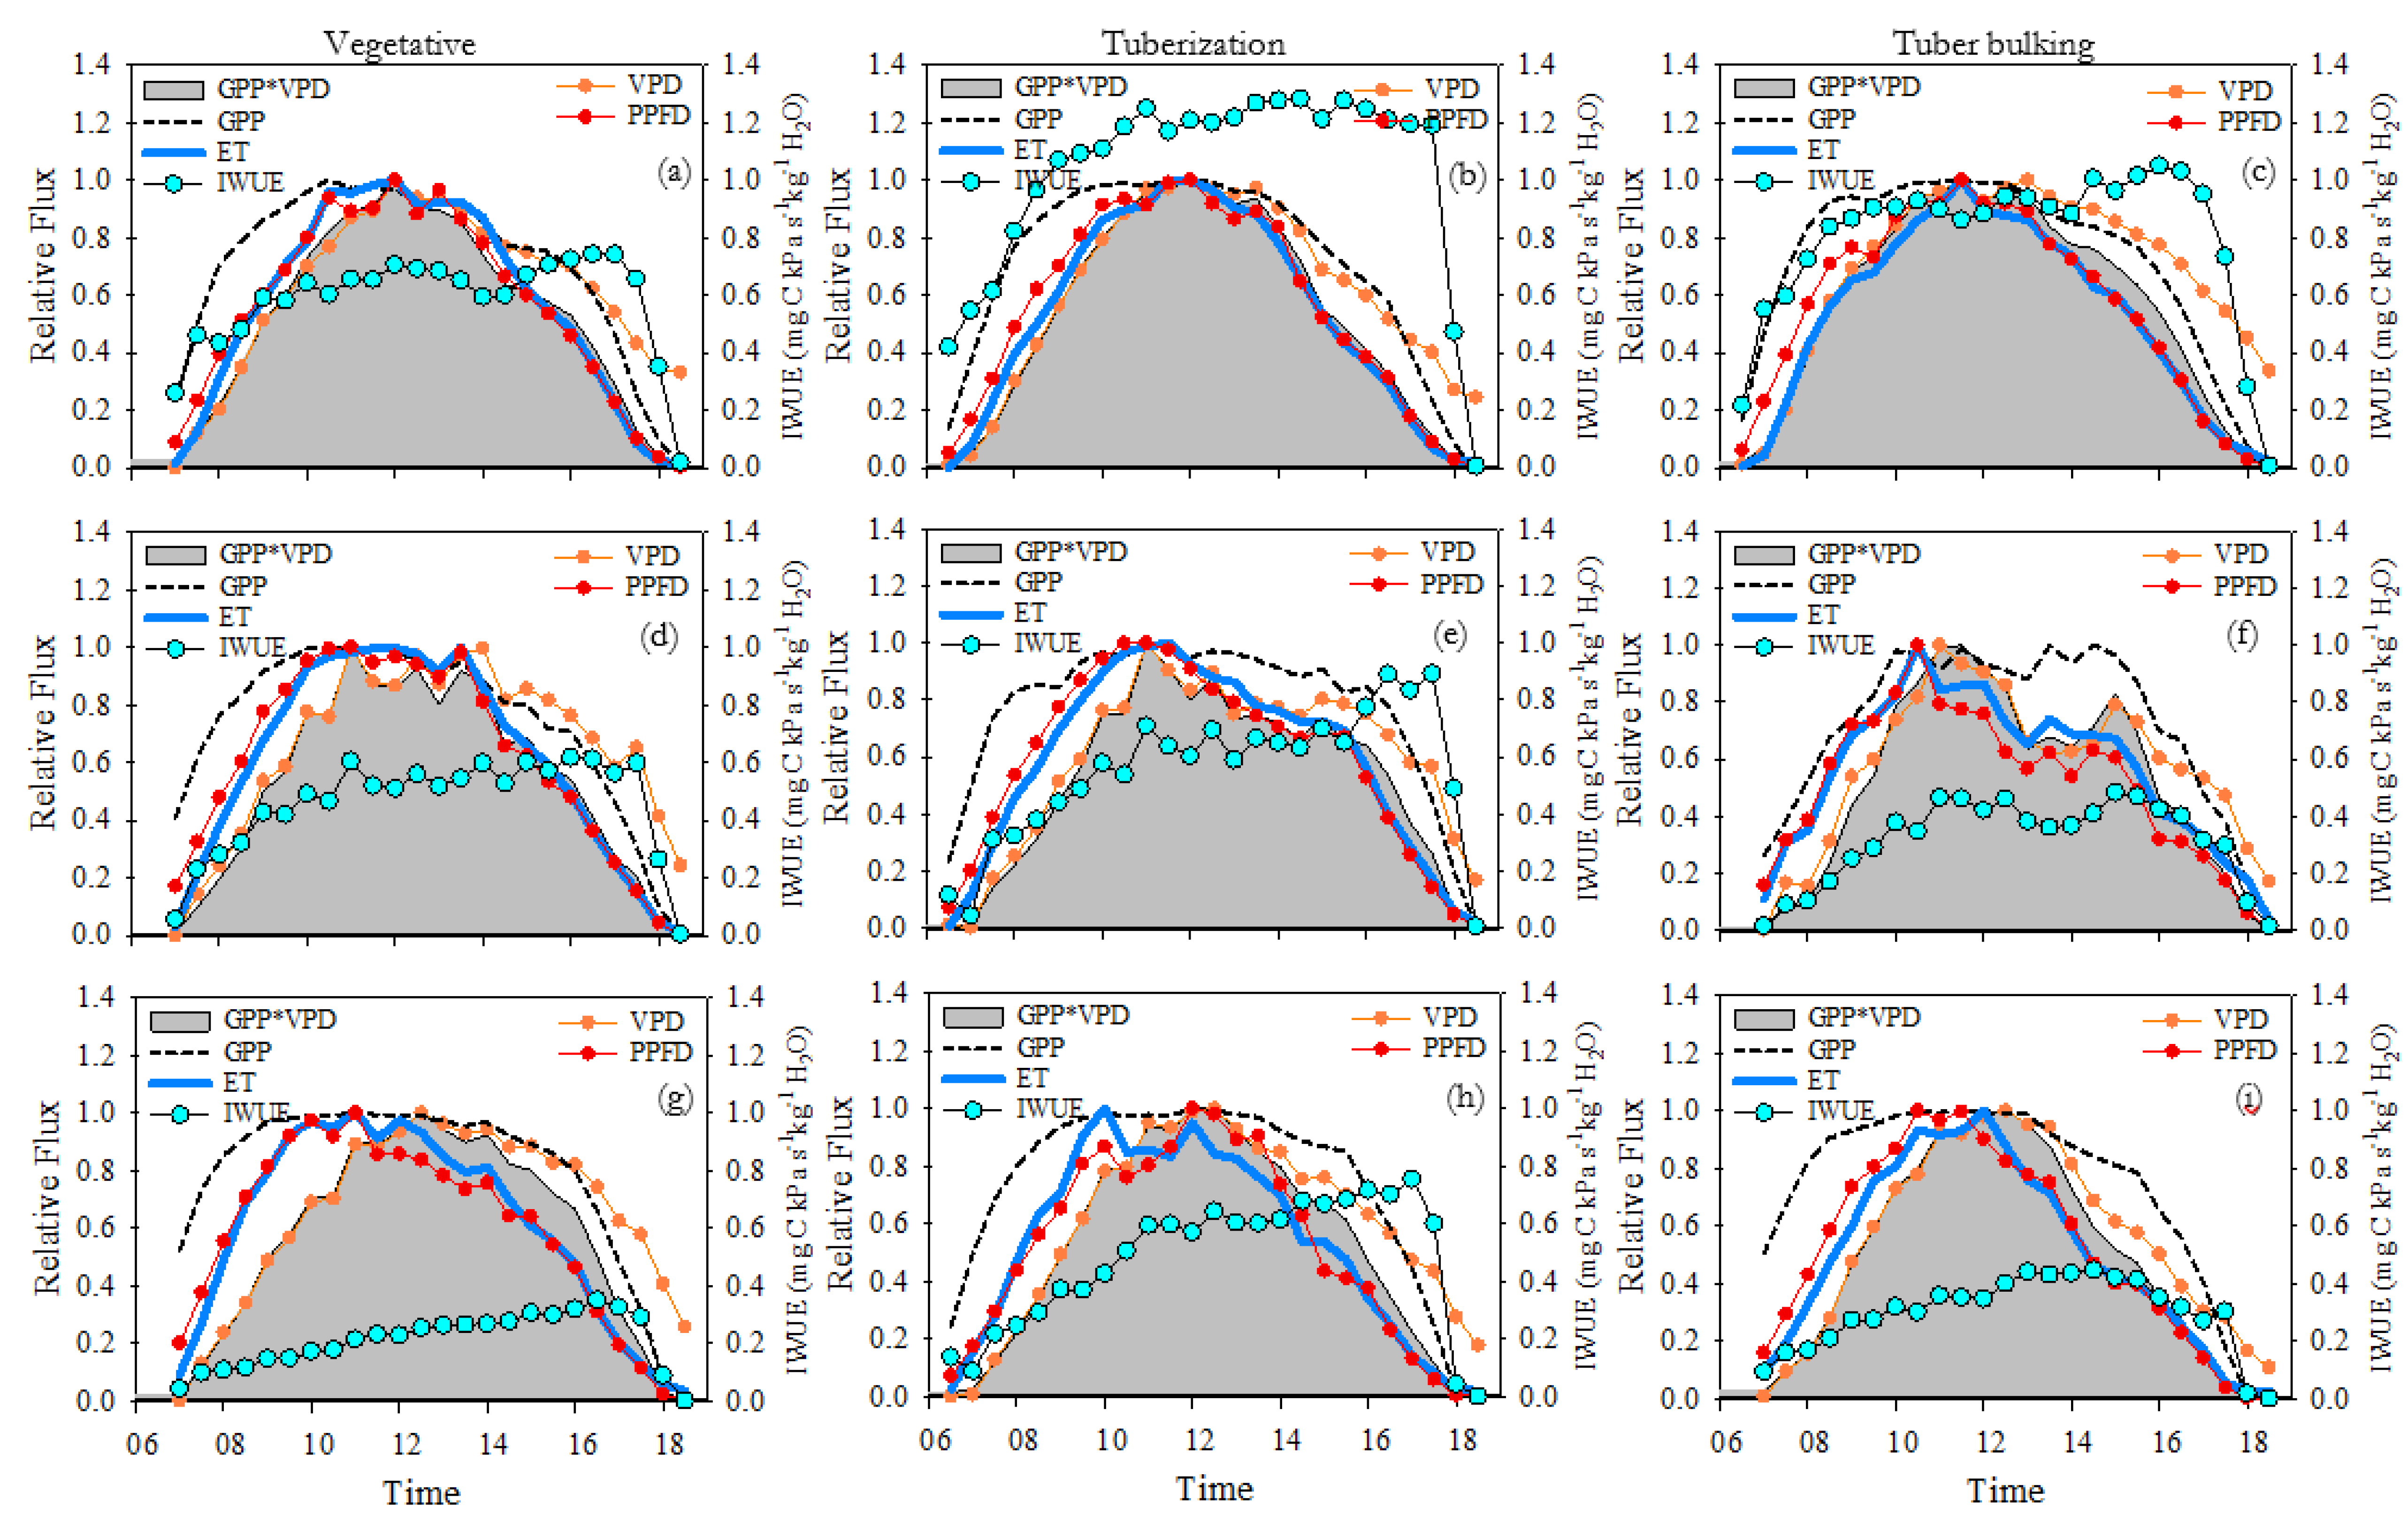
Figure 7, show a comparison between the daily cycles (normalized half-hourly intervals) from sunrise to sunset. At the FI site, the relative fluxes of ET and GPP*VPD were proportional and followed a very close, coupled and synchronized dynamic, thus generating the highest IWUE values. Both ET and GPP*VPD reach their peaks at the same time, around noon. In the morning ET and GPP*VPD closely track the relative changes of both VPD and PPFD. In the afternoon, both fluxes seem to be more in sync with the normalized dynamics of PPFD than with VPD (Figure 7a–c). At the DI site, the relative fluxes of ET and GPP*VPD are less proportional and synchronized, because the relative flux of GPP*VPD is smaller than ET in the morning. The peaks of both fluxes occurred simultaneously around 10-11 am and dropped earlier in the day. The GPP*VPD signal loses synchrony with the normalized values of PPFD and its variation is more coupled with changes in VPD. The normalized flow of ET remains highly synchronized with PPFD during morning and afternoon (Figure 7d–f). Under RF conditions, the relative fluxes of ET and GPP*VPD were not proportional, decoupled, and poorly synchronized. In the morning hours, the relative flux of GPP*VPD was smaller than ET, however, in the afternoon the dynamic is reversed, and the magnitude of ET relative flux was more restricted than GPP*VPD. The peaks of both fluxes do not coincide since the relative flux of ET reaches its peak earlier than GPP. This time lags between these variables and the differences in the magnitude over day results in high asynchrony and lowest IWUE, compared to FI and DI sites. The relative flux of GPP was exactly coupled to the VPD from morning to 14:00. On the other hand, although the relative flux of ET is highly synchronized with PPFD, discrepancies or less synchrony between ET and PPFD are observed in the afternoon (compared to FI and DI), mainly during vegetative growth and tuberization (Figure 7g–i).
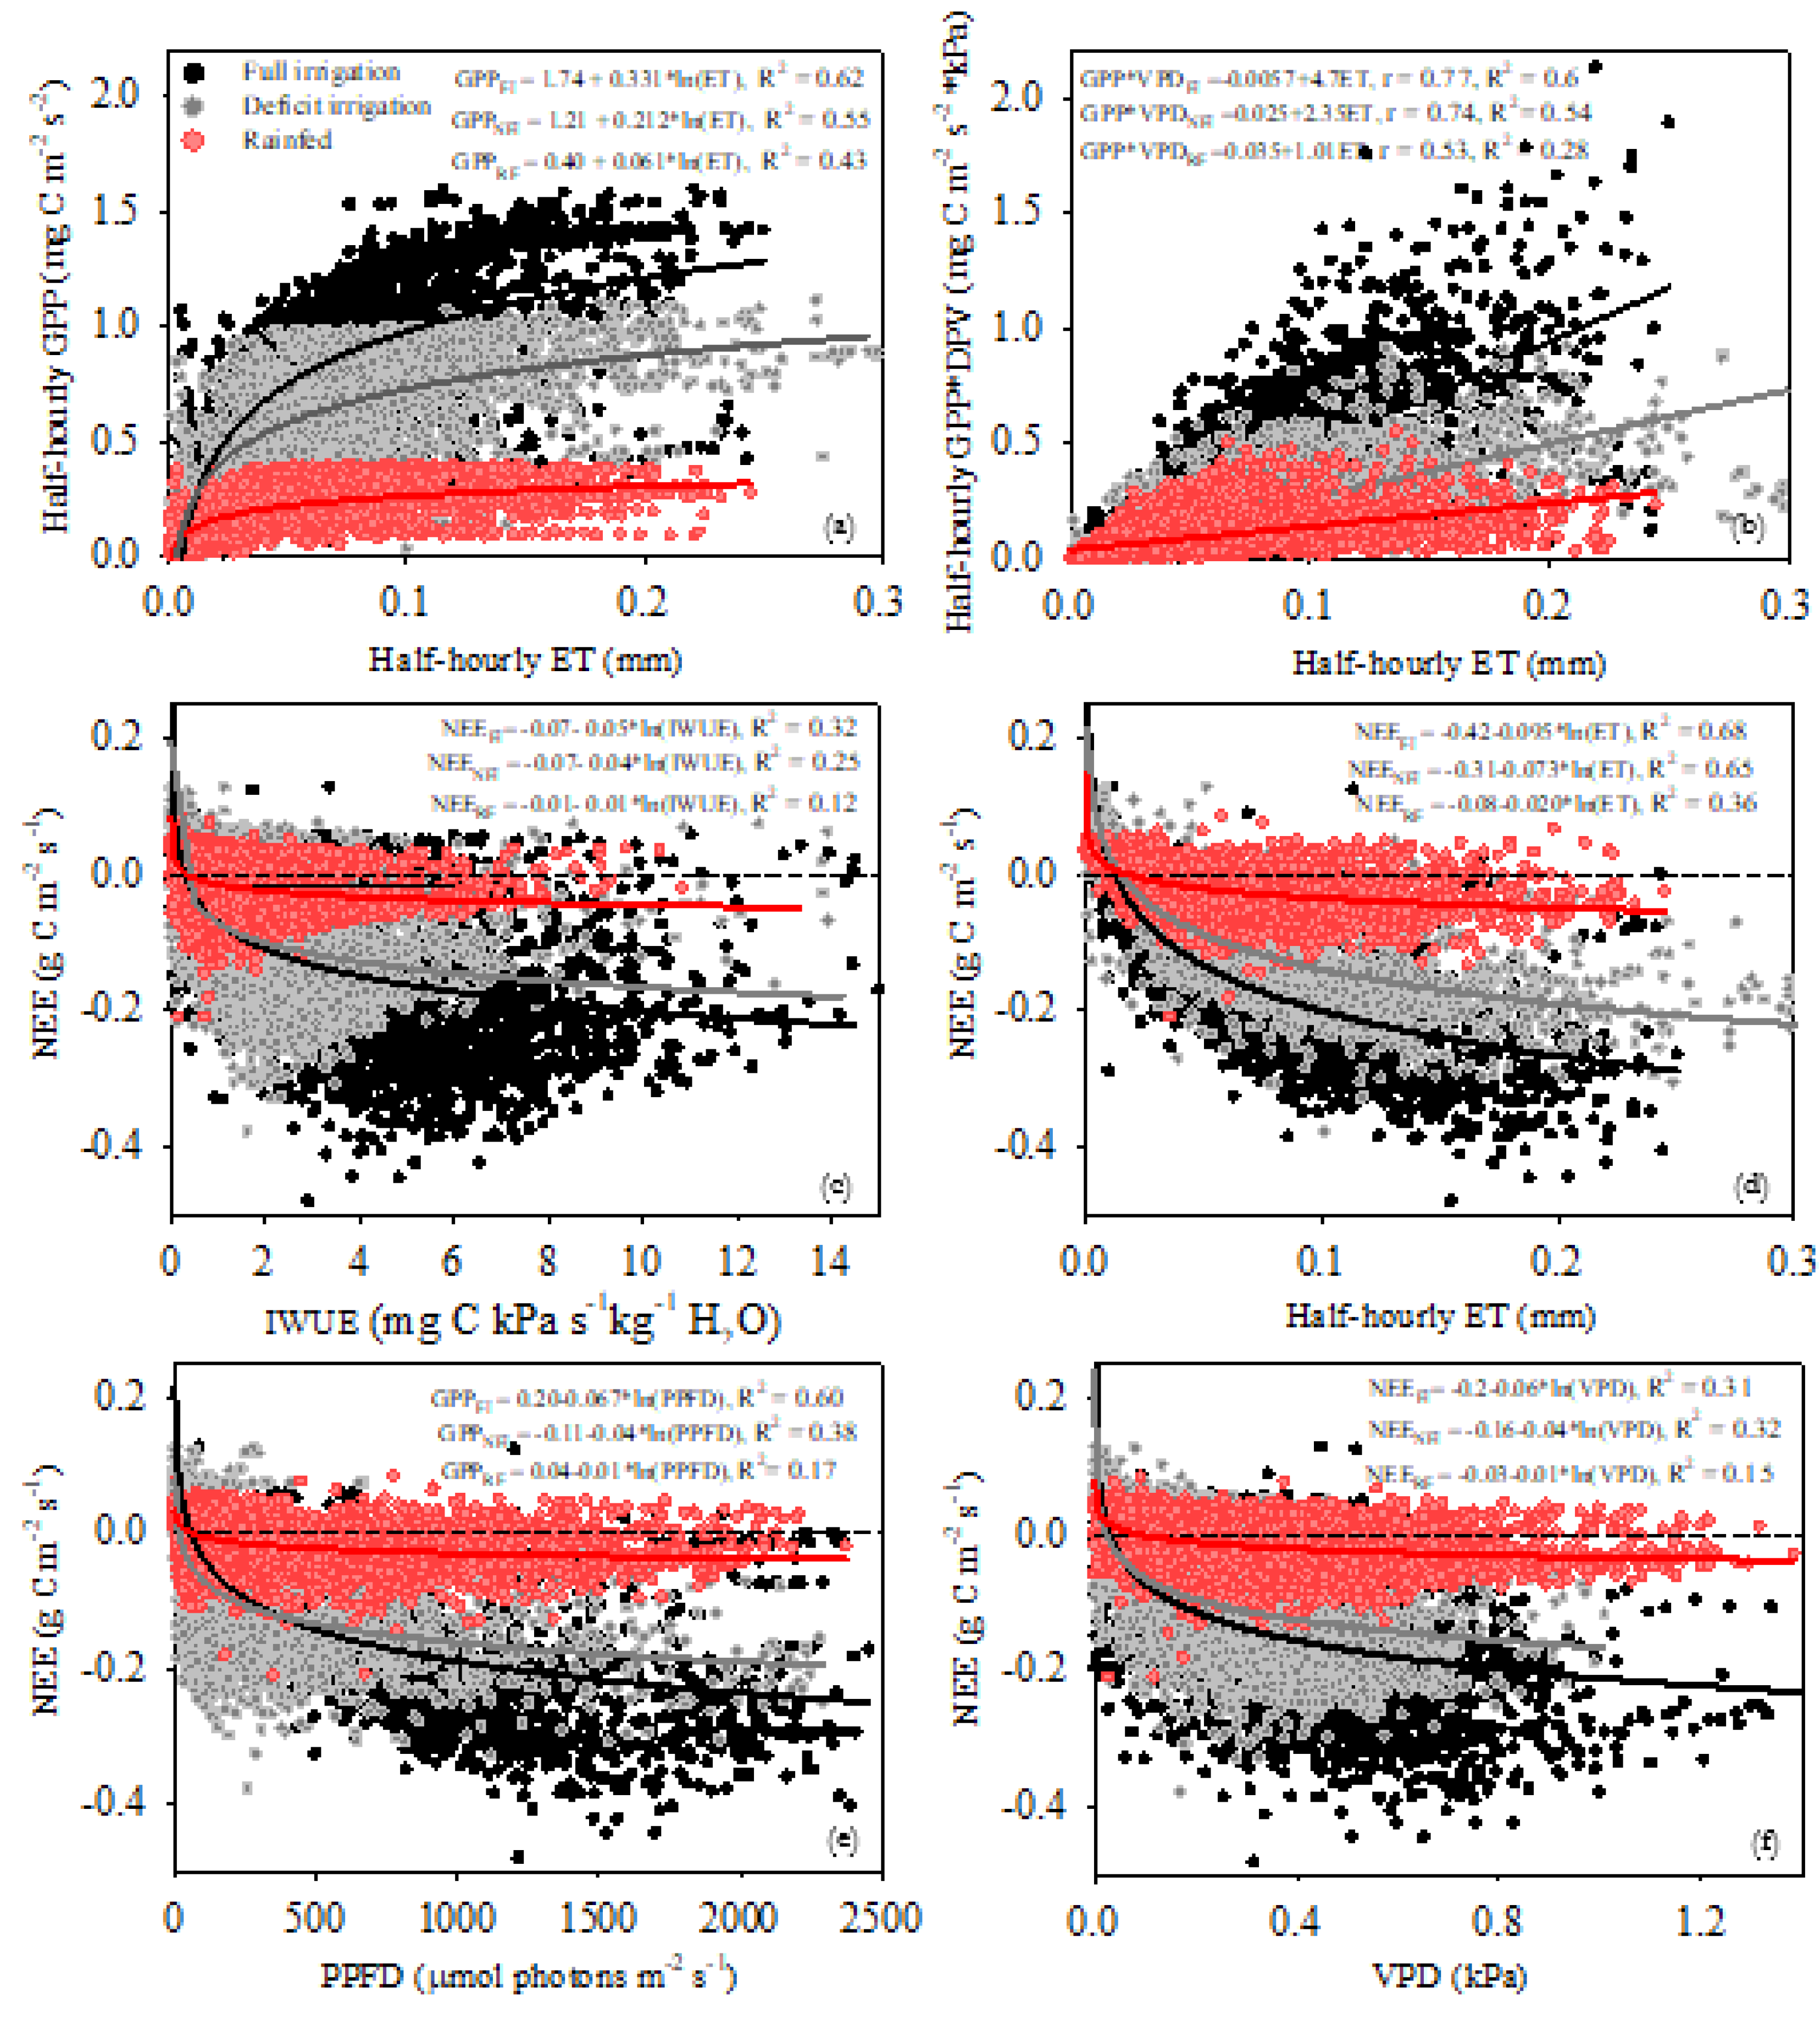
Figure 8 shows the correlations between GPP and ET fluxes with the climatic variables PPFD and VPD, as well as between NEE and IWUE. In the FI site there is a high correlation between GPP*VPD – PPFD and GPP*VPD – VPD, where more than 90% of the GPP*VPD changes are explained by PPFD and VPD (Figure 8). In the DI and RF sites there is a broader response and correlation between GPP*VPD - VPD (Figure 8g–i) than that observed for GPP*VPD – PPFD (Figure 8a–c). The lower correlation and determination coefficients indicate less control of PPFD over GPP*VPD.
The ET and PPFD variables remain highly correlated (Figure 8d–f), while the ET – VPD relationship is lower in all water management conditions (FI, DI, and RF). Compared to the FI and DI sites, the RF site showed an increase in VPD, which results in lower values of ET. While the ET response to PPFD is direct, the ET response to VPD depends on the effect of VPD on canopy conductance. Therefore, a hysteresis effect occurs due to the time lags between these variables, causing lower r and R2 values. A greater hysteresis effect is observed under RF conditions, indicating a larger delay in the ET response to changes in VPD (Figure 8–l).
In the FI site, the variables NEE and IWUE are highly linearly correlated and more than 80% of the changes in NEE are explained by IWUE in the three growth stages. In other words, the larger diurnal sink activity was due to the greater ET-GPP coupling represented by higher values of IWUE. It was observed that the highest capture activity (NEE more negative) occurs in high IWUE. At the DI site, there was a lower NEE response to IWUE, mainly at tuberization and tuber bulking, where the main sink activity (more negative NEE) occurs at lower IWUE values compared to FI. At the RF site, we observed the lowest NEE response to IWUE, as well as the lowest r and R2 at all growth stages (Figure 8m–o). This indicates that in both DI and RF, the lower sink activity was due to the lower ratio between ET and GPP fluxes, represented in a lower IWUE (Figure 8).
Logarithmic functions described well the scatter plot between daily means of half-hour GPP versus half-hour ET (Figure 9) in all sites. The average GPP increases were 0.33, 0.21 and 0.06 mg C m-2 s-1 per unit of ET mm increase in FI, DI and RF, respectively. On the other hand, the GPP – ET relation increased logarithmically without any clear threshold at the FI site. At the DI and RF sites, the increase of half-hourly GPP shows asymptotic values from 1 and 0.5 mg C m-2 s-1, respectively, when half-hourly ET reach values around 0.1 mm and 0.05 mm respectively, indicating no increases of GPP that beyond those ET values. Over the whole crop growth, the individual half-hourly GPP*VPD and ET tend to be well correlated and well coupled (r = 0.77, R2 = 0.6) at the FI site. GPP*VPD - ET coupling was slightly lower at the DI site (r = 0.74, R2 = 0.54) and the lowest for the RF site (r = 0.53, R2 = 0.28). Likewise, the instantaneous IWUE (the slopes of the linear regressions) was greater for the FI site than DI and RF sites, being 4.7, 2.3 and 1.01 mg C kPa s-1 kg-1 H2O, indicating an improvement in water use under FI conditions.
The individual half-hourly NEE values were plotted against PPFD, VPD and ET in Figure 9. At the FI site, although all the climatic variables had positive effects on NEE, the carbon sequestration activity had a higher response to both ET and PPFD, compared to VPD. From logarithmic functions, both variables explain around 60% of the NEE variance, and a decrease of - 0.09 and - 0.06 mg C m-2 s-1 per unit of ET mm and PPFD mmol photons m-2 s-1. In the DI site, NEE had a lower response to PPFD; the average decrease of NEE was -0.04 mg C m-2 s-2 per unit of PPFD mmol photons m-2 s-1. While in the FI site, NEE decreased until approximately 1500 mmol photons m-2 s-1, in the DI site, NEE decreased linearly to 750 mmol photons m-2 s-1, and the main sink activity occurs when PPFD is below 1000 mmol photons m-2 s-1. Under RF conditions the response of NEE to environmental conditions was quite reduced. Regarding PPFD, there was no decrease in NEE or sink activity beyond 300 mmol photons m-2 s-1. While at the FI and DI sites, the NEE decreased with increasing VPD (until 0.8 kPa approximately) at the RF site, the NEE decreased to around VPD = 0.3 kPa and then, a reduction in sink capacity and positive NEE values accompanied the increase in VPD. The responses of NEE to IWUE differed among sites (Figure 8). At the FI site, the average NEE became more negative (i.e., larger C sinks) with increasing IWUE, until the maximum carbon sequestration activity near to IWUE = 6 mg C kPa s-1 kg-1 H2O. In the DI and RF sites the maximum carbon sequestration activity was near ~2 mg C KPa s-1 kg-1 H2O, and ~1 mg C KPa s-1 kg-1 H2O respectively. Beyond those IWUE values, there was a substantial reduction in the carbon sequestration activity (Figure 9).

3.5. ET-GPP Coupling and Omega

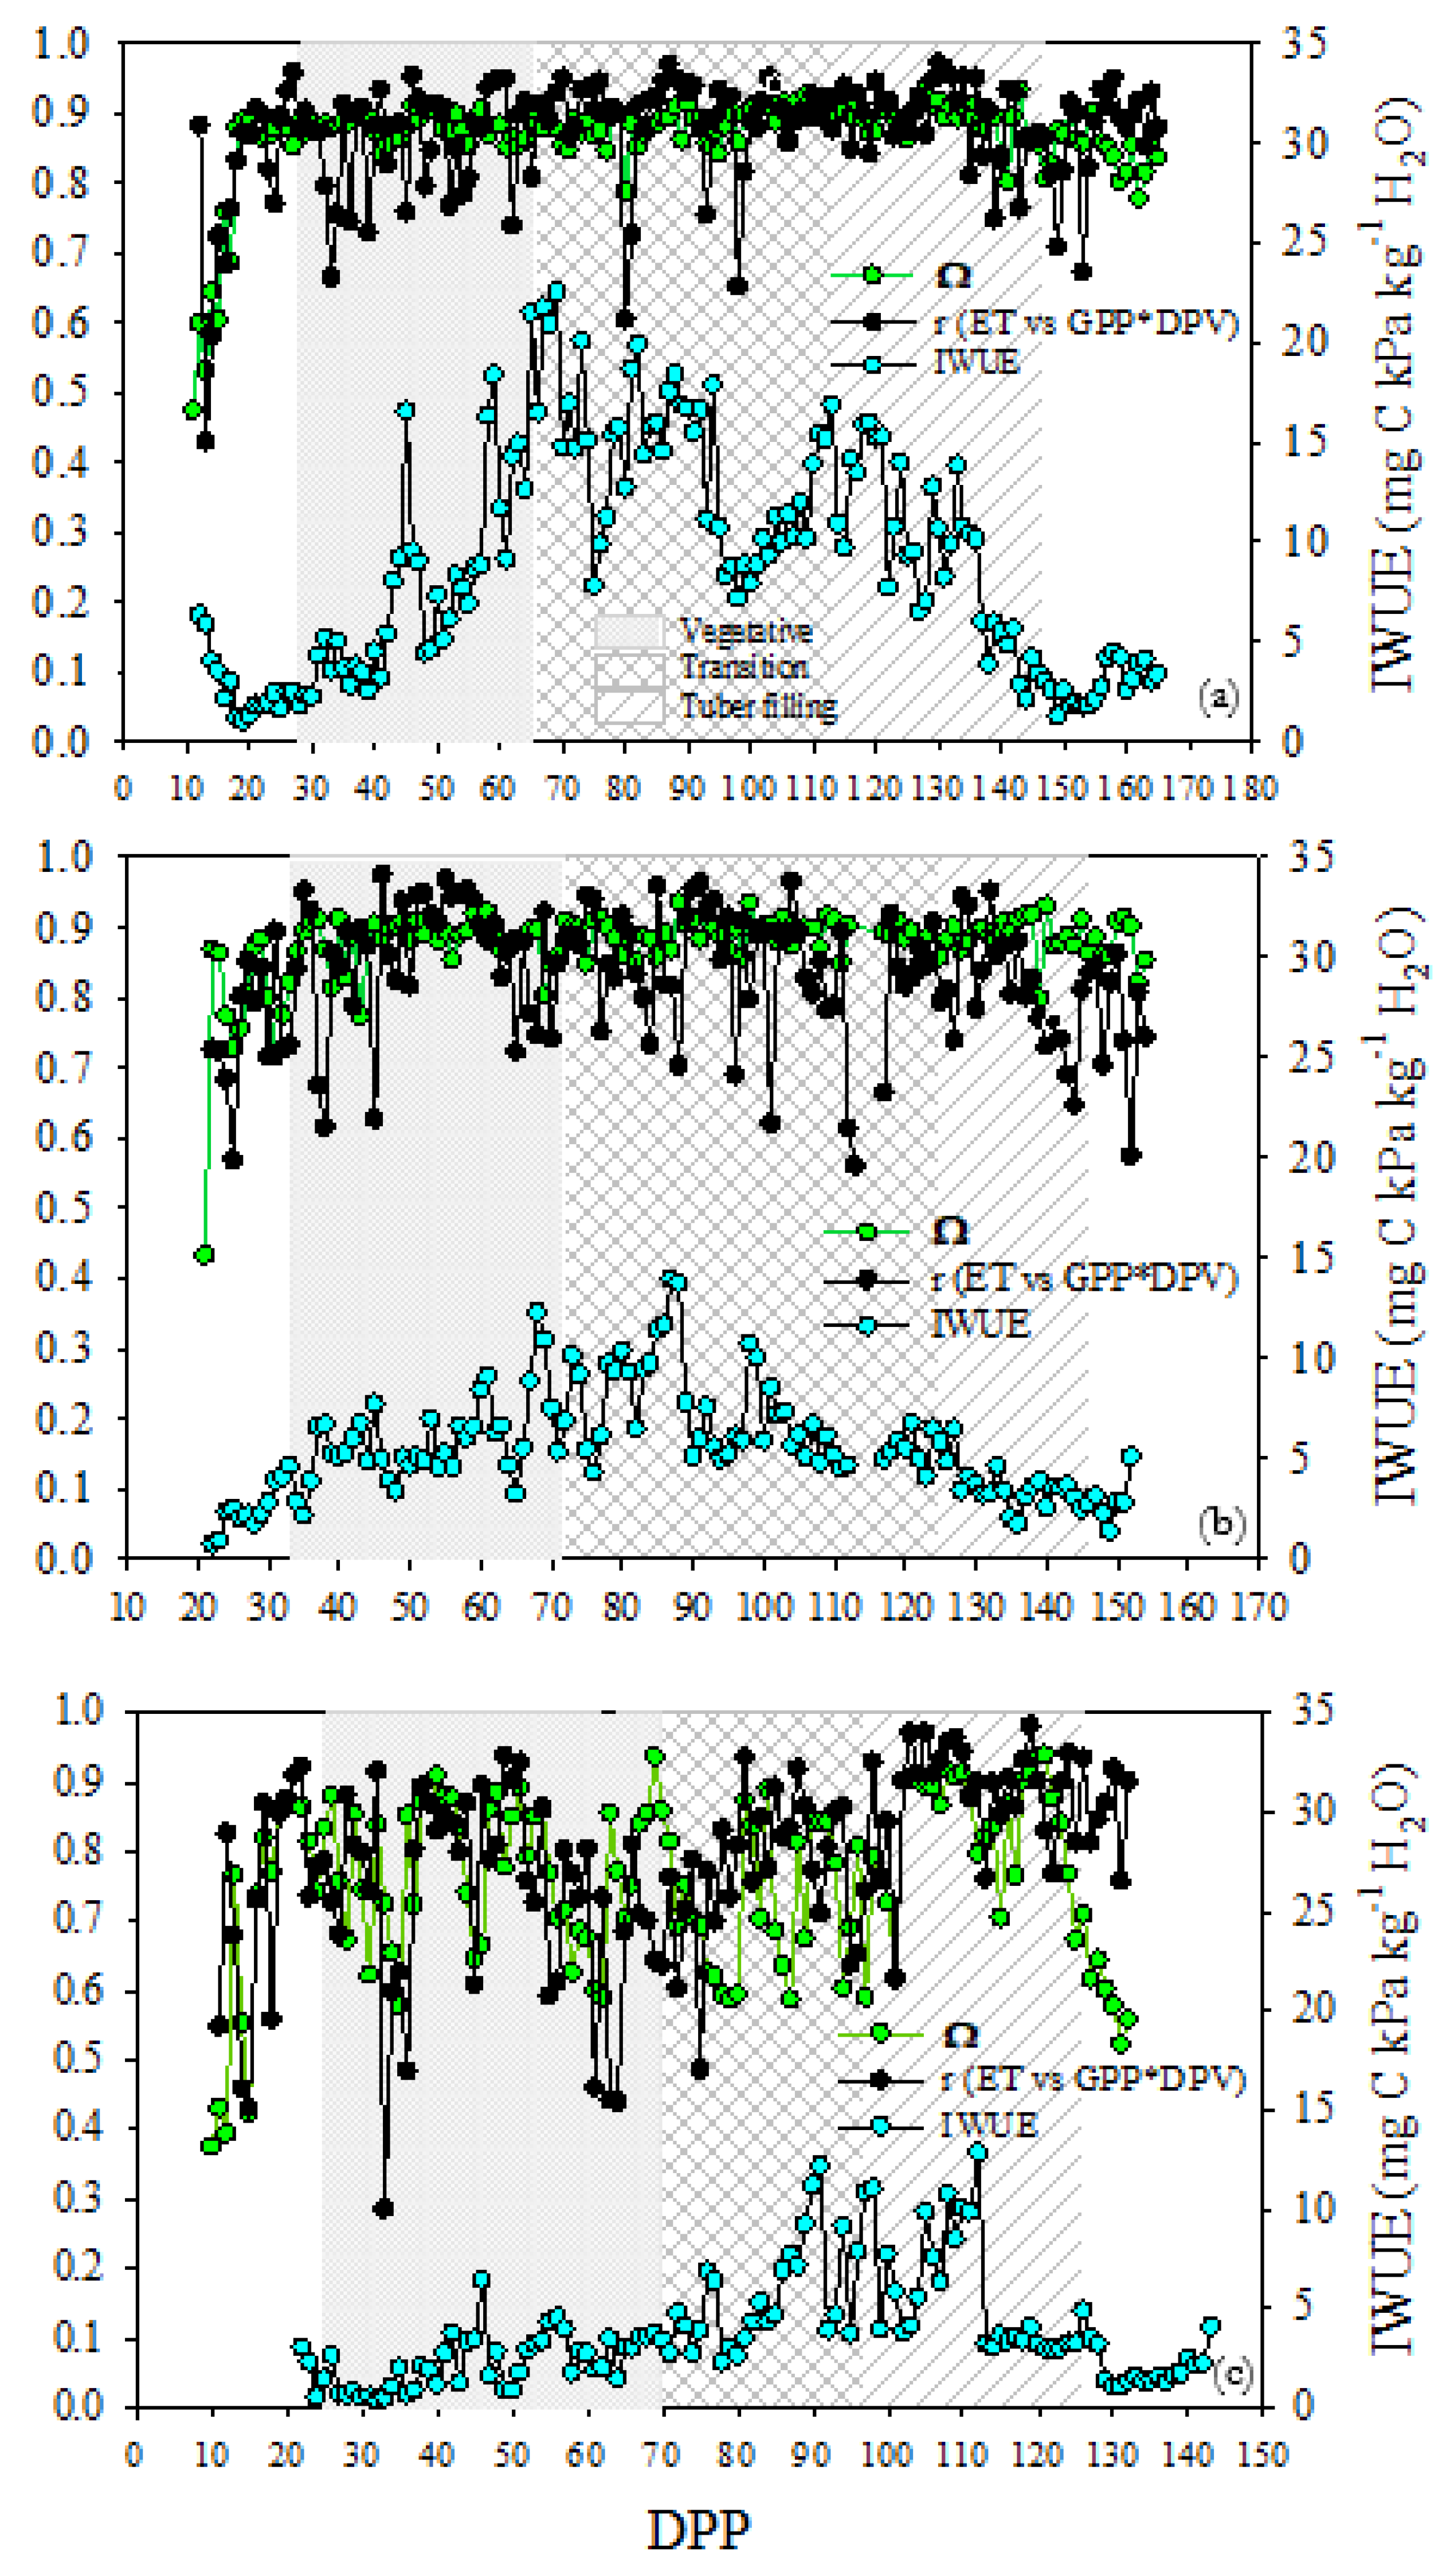
At the FI site, the correlation coefficients were greater than 0.85 for 78% of the 154 crop days, and 14% were between 0.75 and 0.84, indicating that in most of the individual days GPP*VPD and ET fluxes were tightly coupled, proportional, and sync. This constant strong linear relationship among daily GPP, ET, and VPD implies the highest IWUE values found at the FI site. Average high-correlation coefficient of 0.9, and maximum values of IWUE of 22 and 17 mg C kPa day-1 kg-1 H2O were found to concur during the tuberization and tuber bulking stages, respectively. Likewise, about 30% of the vegetative stage were slightly GPP*VPD - ET decoupled days (r ~ 0.66 – 0.84) coinciding with low (but progressively increasing) IWUE values (Figure 10a). At the DI and RF sites, only 52% and 41% of the respective correlation coefficients are larger than 0.85 during crop days. Likewise, the IWUE was lower at both sites, compared to the FI site. At the DI site, the highest percentage of uncoupled days (r ~ 0.55 – 0.84) were found during the tuberization and tuber bulking stages (48% and 74%, respectively). Correspondingly, the greatest changes of IWUE, with respect to FI, were observed mainly during tuberization and tuber bulking, where the maximum values reached were 14 and 6.5 mg C kPa day-1 kg-1 H2O (Figure 10b). The largest variability in the correlation coefficient was observed at the RF site. Around 74% of vegetative, tuberization stages correlation coefficient for the relation GPP*VPD - ET ranging from 0.3 to 0.84, and 0.48 to 0.84, respectively. The r averages were the lowest (r= 0.73 and 0.77 for vegetative, and tuberization, respectively) compared to the FI site. As a result, the RF site had the lowest values of IWUE and occurred during vegetative growth (IWUE < 5 mg C kPa day-1 kg-1 H2O ) and tuberization (max IWUE = 12 mg C kPa day-1 kg-1 H2O) (Figure 10c).
The degree of coupling between the plant canopy and the atmosphere grounded in omega characterizes the extent to which canopy conductance may control water vapor and CO2 exchange. The omega values closest to one (Ω ~ 0.8 – 0.9), indicate that in both the FI site and the DI site, the net radiation is the main contributor to the evapotranspiration process therefore, vegetation is completely decoupled from the atmospheric conditions. In the RF site, lower omega values (Ω ~ 0.6) were observed mainly in the vegetative and tuber bulking stages, indicating an increase in coupling, and a greater control of ET by vegetation in terms of surface conductance and VPD (Figure 10).

4. Discussion

4.1. Carbon Fluxes of NEE, GPP, and Reco

Under FI conditions, SWC was close to field capacity. Under this well-watered condition potato crop was a carbon sink at the end of the canopy cycle ( −362.3 ± 13.15 g C m−2) and after chemical haulm treatment ( −312 ± 13 g C m−2). During tuberization occurs 75% of carbon sequestration (-257.287± 261 g C m−2) which is expected, since developing tubers are the largest sinks (Oliveira et al., 2021; Viola et al., 2001) and higher carbon fluxes have been observed in this stage (Martínez-Maldonado et al., 2021). At the DI site the carbon sink capacity was reduced by 69% and 95% at the end of the canopy cycle (-113.43 ± 4.89 g C m−2) and after chemical haulm treatment (-17.3 ± 4.61 g C m−2) respectively, compared to the FI site. The tuberization stage lost its carbon sink potential by almost 50% and the tuber bulking stage behaves as a CO2 source. Under the dry conditions of the RF site the crop behaved as a net carbon source to the atmosphere during all growth stages until the end of the canopy (+150.3 ± 4 g C m−2), emitting even more after the chemical haulm treatment (+187.21 ± 3.8 g C m−2).

4.2. Crop Development, Surface Resistance and Carbon - Water Fluxes

Daily GPP, Reco fluxes, and GPP/Reco ratio indicate a large GPP exceeding Reco during all crop growth in the FI site. The observed GPP/Reco ratio > 2 suggests that autotrophic respiration dominates the carbon fluxes, reflecting an increased physiological activity of the leaves, higher rates of photosynthesis (GPP), and CO2 sequestration (Cabral et al., 2013; Falge et al., 2002, 2001; Rana et al., 2016). The scarce difference between GPP and Reco, and the low values of the GPP/Reco ratio at DI site reflect a lower autotrophic activity, and low rates of photosynthesis which are found in drought-stressed ecosystems (Falge et al., 2002). The observed GPP/Reco ratio <1 in almost all growth seasons in the RF site, confirming that the system behaved as a source of CO2 and carbon fluxes were dominated by heterotrophic respiration due to a very low photosynthetic activity and autotrophic respiration. This means that carbon was mainly consumed by the soil respiration process and less used for the growth and maintenance of plant biomass (Cabral et al., 2013; Falge et al., 2002, 2001; Goulden et al., 1998; Rana et al., 2016).
Our results indicate a strong influence of growth and canopy development over the energy partitioning and carbon fluxes (Guo et al., 2010; Jia et al., 2014; Kang et al., 2015; Shao et al., 2015; van Dijke et al., 2020b). In the FI site, the LAI was higher than DI and RF sites. The course of the GPP/Reco ratio was in line with the LAI pattern, as well as the increase of the Rn/LE ratio following LAI during tuberization, reaching its highest value at max LAI and falling at almost the same rate. Several authors have reported that LAI is one of the main causes of daily GPP, and ET variations (Gondim et al., 2015; Jongen et al., 2011; Martínez-Maldonado et al., 2021b; Souza et al., 2012). For potato, under well-watered conditions, we reported previously (Martínez-Maldonado et al., 2021b) a synergistic growth of a high LAI and GPP which works as efficient feedback that guarantees canopy growth and high carbon fluxes. Although the highest LAI could be responsible for higher GPP and ET (van Dijke et al., 2020a), the canopy growth affecting carbon and water fluxes also depends on leaf thickness or SLA. Leaf thickening implies longer palisade cells or a higher number of cell layers and therefore higher transpiration efficiency, and increased capacity for area-based photosynthesis (Evans and Poorter, 2001; Vadez et al., 2014; Weraduwage et al., 2015; Wright et al., 1994), and greater photosynthetic rates (Gonzalez-Paleo and Ravetta, 2018; Goorman et al., 2011; Wright et al., 1994). In the FI site, we found a decreasing behavior of the SLA during the first 60 DPP indicating that during the initial canopy growth, there was a reallocation of biomass to thicker leaves, increasing leaf mass more than leaf area (Weraduwage et al., 2015). Decreasing SLA may imply increasing plant demand for C since more fixed C is required to expand the area of thick leaves than of thin leaves (Gonzalez-Paleo and Ravetta, 2018; Jullien et al., 2009; Weraduwage et al., 2015). In the DI site, the water deficit events during early crop growth changed the morphological characteristics of the canopy, which impacted the course of the GPP/Reco ratio. The significant and faster drop in LAI (from 100 DPP) was accompanied by GPP/Reco < 1, which explains tuber bulking as a weaker carbon sink. The increasing SLA during tuberization indicates less carbon requirement for mass increase and lower area-based for photosynthesis, which could partly explain the depression of the GPP/Reco ratio between 80 and 115 DDP.
In the RF site, water deficits occurred beyond 70% of the crop growing season. Reductions in daily GPP and low GPP/Reco ratio during all crop growth may be related to fewer carbon requirements to canopy growth, since lowest LAI values and the increasing behavior of the SLA suggested that the crop had a poorly expanded canopy with thin leaves during all growth stages (Gonzalez-Paleo and Ravetta, 2018; Jullien et al., 2009; Weraduwage et al., 2015; Wright et al., 1994). In potato, water deficit causes a reduction in the expansion of leaves, leading to reduced foliage, reduced canopy, and reduced leaf area index (George et al., 2017; Gervais et al., 2021a, 2021b; Hill et al., 2021b; Howlader & Hoque, 2018; Martínez-Maldonado et al., 2021; Michel et al., 2019; Muthoni & Kabira, 2016; Nasir & Toth, 2022a, 2022b; Obidiegwu et al., 2015; Rodríguez P. et al., 2016). Unlike FI and DI, there was a strong reduction of the LE/Rn ratio at the RF site, indicating that the water vapor flux from the canopy had additional restrictions to those provided by changes in vegetative growth and canopy morphology.
Water and carbon fluxes in plants are linked by stomata (Brunsell and Wilson, 2013; Díaz et al., 2022; Gonzalez-Paleo and Ravetta, 2018; Huxman et al., 2004; Scott et al., 2006b; van Dijke et al., 2020a) which is characterized by the canopy resistance (Ra) and represents the bulk resistance to water vapor or mass transfer from leaves (Amer and Hatfield, 2004; Wehr and Saleska, 2021). In our results, at the FI site, higher values of daily ET occurred in lower Rc during all crop growth stages. This expected low canopy resistance under well-watered conditions has been reported by other researchers (Aires et al., 2008; Kumagai et al., 2008; Paulino Junior and Silva von Randow, 2017; Souza et al., 2012). Unlike with López-Olivari et al. (2022), we observed a larger aerodynamic resistance (generally higher than Rc) indicating more importance of Ra in total resistance to water vapor transport. Regarding diurnal patterns, the tendency of the estimated half-hourly Rc had a similar magnitude, along the growth stages. Averaged midday Rc values around 15 s m−1 were similar to those reported for potato by Amer & Hatfield (2004) and López-Olivari et al. (2022) and lower than values reported by Kjelgaard & Stockle (2001) (midday Rc values close equal to 40 s m−1). As seen for daily data, diurnal aerodynamic resistance generally was higher than canopy resistance. This large Ra impedes heat transfer as well as water vapor transfer and, therefore, supports the greater evapotranspiration flux (Smith, 1980) observed at the FI site. The highest diurnal ET and GPP fluxes evidenced an intense exchange of carbon and water and consequently a high sink activity (more negative NEE) mainly during tuberization and tuber bulking stages between 07:00 am and noon when the lowest Rc occurred.
At the DI site, Rc and Ra were similar to those found in the FI site. Despite water deficit events, Ra>Rc indicating that ET remains controlled by Ra and less by Rc and water content in the soil (Sutherlin et al., 2019a). Consequently, canopy was less capable to reduce evapotranspiration and avoid water losses (Spinelli et al., 2018a; Fereres and Soriano, 2007; Spinelli et al., 2018b), and ET continues at a high rate while there was a high restriction in the GPP and NEE fluxes. Such decrease in GPP in a low canopy resistance for surface fluxes may have been explained by intra-leaf factors or non-stomatal limitations of photosynthesis (NSL), that could decline the photosynthetic activity during drought (de La Motte et al., 2020; Nadal-Sala et al., 2021; Nelson et al., 2018b; Obidiegwu et al., 2015; Xu and Baldocchi, 2004; Yang et al., 2019). NSL has been observed at the ecosystem scale (Jarvis, 1985; Migliavacca et al., 2009; Reichstein et al., 2002) and could include environmental limitations on the photosynthetic pathways (Nelson et al., 2018b), increased mesophyll resistance (de La Motte et al., 2020; Evans, 2021; Flexas et al., 2012), drought-related enzymatic down-regulation (Flexas et al., 2013, 2004; Flexas and Medrano, 2002; Galmés et al., 2007; Niinemets et al., 2006; Sugiura et al., 2020; Varone et al., 2012), less total leaf mass, and/or decreasing carbon demand (Fatichi et al., 2014; Nadal-Sala et al., 2021). In our results, the radiation deficit, and the poorly developed canopy, with less photosynthetic activity and lower autotrophic respiration, constitute the NSL which in turn decreased the GPP.
At FI and DI sites, the diurnal VPD < 0.6 kPa had no effect on canopy resistance because of the irrigated conditions. At the RF site, the VPD > 0.6 kPa indicates that the potato canopy experienced a larger saturation deficit and, as soon as VPD increased, Ra decreased, and Rc increased as the day progressed. The increase of midday Rc was up to 13 times larger than Rc at the FI site when the VPD increased around 0.8 kPa, revealing that under drought conditions, the plants increased the canopy resistance in response to high VPD (Aires et al., 2008; J D N Alves et al., 2022; Silva et al., 2017; Sutherlin et al., 2019b). Diurnal ET and GPP fluxes were highly restricted in all growth stages suggesting that in potatoes VPD could play a strong role in controlling GPP and ET by means of Rc (Aires et al., 2008). Furthermore, the lower values of ET occurring at higher Rc could be related to the lower partition of energy into LE in the RF site, since the surface energy partitioning into sensible and latent heat depends on surface resistance (Baldocchi et al., 2000; Chen et al., 2009; Kang et al., 2015; Li et al., 2005) and a low LE is necessarily associated to high Rc (Spinelli et al., 2018b). According to Teixeira et al. (2008) VPD exerts negative physiological feedback on ET; while high VPD values increased the gradient of water vapor transport, decreasing LE, at the same time it created an extra barrier on the vapor flow path by closing the stomata, increasing Rc. It should be noted that with the increase of the Rc diurnal GPP was more severely restricted than diurnal ET. This phenomenon, reported by other authors (de La Motte et al., 2020; Nelson et al., 2018b; Spinelli et al., 2018b, 2016; Yang et al., 2019) is explained because while ET is mainly limited by the available energy and secondarily by canopy resistance to vapor transfer, carbon assimilation is primarily limited by canopy resistance, mesophyll conductance, and the rate at which chloroplasts fix carbon (Spinelli et al., 2018b, 2016; Steduto and Hsiao, 1998). On the other hand, the additional non-stomatal limitations of photosynthesis (NSL) under high soil water restriction play a major role in limiting GPP.

4.3. Environmental Controls on ET-GPP Synchrony and NEE-IWUE Relations

At the well-watered conditions of the FI site, the diurnal cycles of ET and GPP were proportional and largely synchronized, which is consistent with other studies (Aguilos et al., 2021; Beer et al., 2009; Nelson et al., 2018b). The higher coupling indicates that the amount of carbon that enters the canopy is proportional to water that leaves, and at noon, when the stomata begin to close, carbon and water fluxes decrease by a similar percentage (Gentine et al., 2019; Mallick et al., 2016; Nelson et al., 2018b; van Dijke et al., 2020a). Environmental factors, solar radiation, and vapor pressure deficit (VPD) were highly synchrony and correlated with ET and GPP, suggesting that were important drivers in the short-term diurnal variation of carbon and water fluxes. According to (Grossiord et al., 2014), during periods of optimum soil water supply and non-limiting low VPD, stomata are fully open, and ET increases linearly with VPD. However, in well-watered conditions light is the main driver for photosynthesis and transpiration (Eamus et al., 2016a, 2016b; S. Liu et al., 2021; X. Liu et al., 2021) since carbon and water exchange increase as more light is intercepted by the canopy (Arkebauer et al., 2009; Samanta et al., 2020; Wilson et al., 2001). The Ra >Rc condition (at daily and average half-hourly scales) observed at FI site, indicates that evapotranspiration is more strongly controlled by Ra and incoming radiation (Alves et al., 2022b; Irmak & Mutiibwa, 2010; Jarvis, 1985; Jarvis & Mcnaughton, 1986b; Magnani et al., 1998; McNaughton & Jarvis, 1991; Nassif et al., 2019; Spinelli et al., 2016, 2018b). Likewise, we previously demonstrated that GPP had a large response to PPFD due to the high carbon flux at light saturation (95% of asymptote) (Martínez-Maldonado, et al., 2021).
At the DI site, The ET and GPP fluxes become uncoupled, losing synchronization and proportionality mainly in the morning, due to the magnitude of the relative GPP flux being smaller and less synchronized, and correlated with the incoming PPFD. The maximum peaks reached earlier, indicate that the time for intense transpiration activity and water-carbon exchange in the early morning was restricted (almost 2 hours), which constrains the sink activity and IWUE. In this less ET - GPP coupling, stomata are transpiring water but intra-leaf factors and other non-stomatal limitations to photosynthesis are slowing carbon fixation, changing the inherent water use efficiency directly (Beer et al., 2009; Nelson et al., 2018b).
The largest discrepancies between the diurnal relative fluxes of ET and GPP were observed at the RF site. Fluxes were uneven with the advancement of the day, and there was a time lag between their maximum peaks. The course of the GPP was in synchrony and correlated with VPD and unresponsive and less correlated to PPFD, while the diurnal trend of ET was high sync and correlated to PPFD and less sync and correlated to VPD. In our analysis, the high asynchrony and pour coupling are due to the unbalanced constrain for ET and GPP fluxes (affecting GPP > ET) imposed by increases in Rc (in response to higher VPD) and non-stomatal photosynthesis limitations that primarily affect the GPP flux. Therefore, because there was a great restriction in both fluxes (ET and GPP), the IWUE values were the lowest compared to the other measurement sites. A decrease in WUE in response to drought was also found by Migliavacca et al. (2009) and Reichstein et al. (2002).
At the FI site, the synchrony and proportionality of half-hourly ET and GPP fluxes during the growth stages are also reflected in the high correlation between overall half-hour GPP and ET and GPP*VPD and ET. There is a high response of the GPP to ET where more carbon molecules were fixed per water molecule. The carbon assimilation process continues in response to water loss, even at the highest ET, indicating that the crop sustains photosynthetic activity in response to the highest water vapor fluxes, which agrees with Katul et al. (2010b) hypothesis. In the DI and RF sites, the low correlation between half-hour GPP and ET and GPP*VPD and ET indicated an overall decoupling between carbon fluxes. In these sites, a large amount of water vapor was lost for limited CO2 assimilation, lowering the water use efficiency until behaves asymptotically, meaning that the increases in ET no longer bring additional increases in GPP. In other words, the water cost is increased for the same carbon gain. In this way, after GPP values of 0.5 mg C m-2 s-2, respectively at the DI and RF sites, the increases in ET could be considered water losses from the system without productive purposes. This indicates that under water-limiting conditions the crop cannot restrict water losses or maximize its carbon gains.
The influence of IWUE on the NEE can be noted by analyzing Figure 8 along with Figure 9. Under the well-watered conditions of the FI site, the high linear correlations between the variation of WUE and NEE (Half-hour diurnal averages of growth phases and overall half-hourly values) indicate that the larger diurnal sink activity was due to the greater ET-GPP coupling represented by higher values of IWUE. This result does support our hypothesis of during well-watered conditions a tight coupling between GPP and ET fluxes due to a PPFD drive - high photosynthesis and evapotranspiration rates, generating the highest IWUE and therefore a larger diurnal sink activity (NEE more negative). In the DI and RF sites, the lower correlation and response of NEE to IWUE is not only attributed to restrictions and low decoupling of the ET – GPP fluxes, but also to the increases in the Reco flux either by more low autotrophic activity from plants or increased heterotrophic activity from the soil. In other words, the lower number of negative NEE values and the persistent positive values are due to both the low IWUE values and the greater role of Reco in the carbon balance and its impact on NEE. The relationship proposed in the IWUE would only explain the variability of the negative values of the NEE since they are associated with the activity of the GPP.
As a consequence of radiation driving both ET and GPP fluxes, PPFD was the primary driver controlling daytime NEE, accounting for 60% of the variations in overall half-hourly NEE during the growing period. The carbon sequestration increased (NEE gets more negative) at PPFD values beyond 1500 mmol photons m-2 s-1. Likewise, the high response of GPP to ET caused NEE to also have a relevant response to ET. At the DI site, the NEE had a lower response to PPFD (NEE decreased linearly around 750 mmol photons m-2 s-1) indicating that the lower values of PAR radiation could be the main limiting factor for sink activity. Although lower than in FI, the response of sink activity to ET was high, confirming that despite the deficit events there were no restrictions on ET and the persistent flux of water vapor was the driver of carbon sequestration. In RF, sink activity stalls or saturates at low ET, PPFD, and VPD. The low response to these environmental determinants is due both to the lower GPP and to the fact that the carbon balance is mainly dominated by the high respiration of the ecosystem, due to physiological and biophysical changes previously discussed.

4.4. ET-GPP Coupling and the Omega Role

To know whether effectively water and carbon signals were coupled or decoupled under the water availability conditions of the measurement sites, we quantified ET-GPP coupling through the daily correlation coefficients for GPP*VPD vs ET using half-hourly data, and by computing daily I W U E = G P P * D P V E T from the total daily sums of GP and ET, and average VPD. IWUE has been widely used in numerous studies as a measure of carbon and water coupling (Battipaglia et al., 2013b; Beer et al., 2009; Grossiord et al., 2014; Leonardi et al., 2012; Loader et al., 2011; Zhou et al., 2015, 2014), and since it shows an improved linear relationship among GPP, ET, and VPD the daily correlation coefficient (r) of GPP*VPD vs ET has been used as an indicator for quantify the coupling/decoupling degree between water and carbon fluxes (Aguilos et al., 2021; Beer et al., 2009; Nelson et al., 2018b; Zhou et al., 2015, 2014). However, numerous environmental factors and non-stomatal limitations to carbon assimilation control the photosynthesis/transpiration balance and could affect carbon and water fluxes, causing a carbon–water decoupling (Nelson et al., 2018b; Zhou et al., 2015). For this reason, the decoupling factor omega (Ω) was calculated on a daily scale to know if the ET-GPP decoupling is due to or not to a greater degree of canopy control over carbon and water fluxes and, in this way, understand the source of the associated changes in the IWUE.
In our results, the most of growth days at the FI site had a high daily correlation coefficient for GPP*VPD vs ET > 0.85, indicating that carbon and water fluxes were tightly coupled, and synchronized. High correlations between the two fluxes under well-watered days have been previously reported (Beer et al., 2009; Nelson et al., 2018a). However, we found a greater number of days less coupled during vegetative and ending tuber bulking stage which is explained due to fluxes are less related to the canopy. During the low crop cover and senescence, latent heat flux is supplied mainly by the evaporation from the soil, and carbon fluxes were dominated by heterotrophic respiration where Reco > GPP (Cabral et al., 2013; Falge et al., 2002; Goulden et al., 1998; Rana et al., 2016). The daily omega ranged from ~0.8 to 0.9 and was close to 0.7 as reported by Brown (1976) for potato, and it is within the range of 0.8 to 0.9 commonly reported in the literature for horticultural crops under no stress (Ferreira, 2017; Jarvis and Mcnaughton, 1986; McNaughton and Jarvis, 1991). The Ω near to 1 implies that ET was more strongly controlled by incoming radiation and less dependent on stomatal conductance and canopy resistance (Jarvis, 1985; P G Jarvis and Mcnaughton, 1986; McNaughton and Jarvis, 1991; Steduto and Hsiao, 1998; Sutherlin et al., 2019b). The less dependence of ET on stomatal conductance is due to the smaller water vapor gradient between the intercellular air space and the epidermal surface of leaves (Steduto and Hsiao, 1998). The leaf surface VPD is different from the air outside of the leaf in its boundary layer (Jarvis, 1985; P G Jarvis and Mcnaughton, 1986), a condition based on Ra > Rc as we found previously in the FI site. The high Ra between leaf surfaces and the air above the canopy indicates a lower diffusivity of water vapor from the leaves that makes ET more coupled with radiation forcing and less dependent on canopy resistance (Jarvis, 1985; P G Jarvis and Mcnaughton, 1986; Zhang et al., 2016). The IWUE increased rapidly at the start of vegetative growth and reaches the maximum values during the tuberization with the maximum LAI. This behavior corroborated with Beer et al. (2009) in herbaceous ecosystems, where LAI and crop growth influence IWUE. The pattern of IWUE suggests that the potato ecosystem became more efficient in its carbon acquisition as the crop growth progressed. In terms of Katul et al. (2010b) increases its capacity to optimize carbon gains to water losses. The lowest cost in water per carbon gain at the FI site can be observed in Figure 9 where there was a high GPP response to ET changes, even when the effect of VPD was included. This enhanced IWUE may imply an increase in plant transpiration efficiency, and a positive effect on plant carbon balance (Leonardi et al., 2012). As previously discussed in this paper, under favorable water availability conditions, the exchange of water vapor and CO2 was intense because of the increasing autotrophic activity, larger portions of LE and low canopy resistance to fluxes, and consequently high GPP and evapotranspiration rates (Lambers et al., 2008).
At the DI site, about 50% of the growth period was decoupled and desynchronized (r< 0.84). We observed the greatest number of decoupled days during tuberization and tuber bulking, as well as the greatest reductions in IWUE with respect to FI. The daily omega coefficient varies between ~0.8 – 0.9 indicating ET was controlled by the aerodynamic resistance and incoming radiation and less by canopy resistance and VPD (Jarvis, 1985; P G Jarvis and Mcnaughton, 1986). By analyzing together omega, r Pearson and IWUE it can be inferred that the ET - GPP desynchronization and decoupling and the lower efficiency of GPP-ET tradeoff are not due to limitations in ET, nor to a greater canopy control over fluxes. Therefore, the origin of the decoupling and low IWUE could be attributed to non-stomatal limitations in the GPP. This inference is evidenced by the fact that all the results presented in this work point to a great restriction of GPP since during tuberization and tuber bulking there were thinner leaves, a drop in autotrophic respiration, low response, and correlations of GPP to PPFD, and the largest reductions in diurnal and daily carbon fluxes GPP and NEE with respect to FI. We point to the fact that there are no stomatal/surface resistance limitations based on the high omega indicating no changes in Rc and Ra.
At the RF site, on almost all crop days (more than 80%), the ET and GPP fluxes were uncoupled and desynchronized, mainly during vegetative growth and tuberization. However, unlike the DI site, we observed very low values of the correlation coefficient (r~ 0.4) revealing large discrepancies between carbon and water diurnal trends. As a result, the RF site had the lowest reductions in daily IWUE during all crop growth. Omega coefficient (Ω) was lower, and like the correlation coefficient, the lowest values (omega ~ 0.6) were observed mainly in the vegetative and tuber bulking stages. The lower Ω values are indicative that ET is strongly controlled by VPD and Rc (Aires et al., 2008; P G Jarvis and Mcnaughton, 1986; Nassif et al., 2014). However, the higher Rc reducing evapotranspiration, may restrict photosynthesis more than it restricts ET (Jarvis, 1985; Spinelli et al., 2018b, 2016; Steduto and Hsiao, 1998) as discussed previously. Other researchers have reported a decreasing trend of omega under water deficit caused by an increase in the canopy resistance and a decrease in aerodynamic resistance (de Kauwe et al., 2017; Ferreira, 2017; Paulino Junior and Silva von Randow, 2017; Silva et al., 2017; Spinelli et al., 2016; Sutherlin et al., 2019b) which agrees with the results presented in this work. Unlike FI and DI sites omega and r, have a similar trend of variation along crop growth. On days where omega and r fall together, the high ET-GPP decoupling is due to a greater extent of canopy control over fluxes in response to higher VPD, causing an unbalance constraint over ET and GPP fluxes, and therefore a very low IWUE. However, as discussed, the restriction on both flows has greater restrictions on GPP due to stomatal and non-stomatal limitations to photosynthesis.

5. Conclusions

We investigated the interactions between carbon and water fluxes to understand the response of NEE of three crop systems of Andean potato (Solanum tuberosum L. andigenum), growing under contrasting water management conditions. To explore the temporal scales of water and carbon fluxes interactions, we used the inherent water use efficiency (IWUE) approach, which allows study the intrinsic link between carbon and water fluxes through stomatal conductance by means of the eddy covariance technique at the ecosystem level. We quantified water and carbon fluxes, morphological parameters LAI and SLA, canopy and aerodynamic resistances, omega decoupling factor, measures GPP–ET coupling, and IWUE on different time scales to identify differences in the trade-off between carbon uptake and water loss across potato sites and its relation to NEE differences.
Our results indicated that rainfed potato was a net carbon source, while both irrigated systems were a net carbon sink. However, the FI condition showed a carbon sequestration capacity almost 5 times greater than that observed in the DI site
We have shown that a greater sink activity or more negative NEE is due both to the high fluxes of GPP (where the GPP> Reco condition is fulfilled) and ET, as well as to the high efficiency, synchrony, and coupling in the exchange of carbon and water. That is, the higher photosynthetic CO2 gain per unit of evapotranspired water is related to a high magnitude, proportionality, and synchrony of its diurnal fluxes, which in turn are controlled by the radiative environment and by a canopy with a larger base area for exchange of water and carbon (high LAI and thick leaves), physiologically active (high photosynthetic and respiratory activities), with low internal resistance and highly decoupled from the atmosphere (high omega). This study further shows evidence of how along with canopy growth, the energy consumption for ET (LE), autotrophic respiration, and photosynthetic activity increases, as well as the ability to optimize carbon gains against water losses. The tuberization phase is the most relevant in the carbon sink activity since the completely formed canopy, together with developing tubers, constitute the greatest carbon demand of the crop cycle and thus the highest fluxes of GPP.
Under soil water deficit conditions, the lower sink capacity or carbon source activity is due to limitations in the magnitude of the GPP and ET fluxes and their trade-off efficiency (IWUE). Lower IWUE is a consequence of decoupled and desynchronized carbon and water exchange caused by unbalanced restrictions on ET and GPP fluxes from the stressed canopy. An overall restriction for fluxes is a smaller base area for water and carbon exchange due to limited canopy growth and early senescence. The first unbalanced constraint causing ET-GPP decoupling occurs because ET remained at a high magnitude despite the strong reduction in GPP. GPP decreases by means of non-stomatal effects on canopy assimilation attributed to changes in physiological capacities of photosynthesis reflected in lower GPP/Reco ratio and a lower response of PPFD. In the longest and most sustained limitation in the SWC, both ET and GPP fluxes decrease together, however, GPP decreases more than ET. On one hand, evapotranspiration was limited by a means of higher Rc in response to high VPD, which greatly impacts carbon assimilation and GPP through stomatal limitations of photosynthesis. On the other hand, GPP reduction is also controlled by non-stomatal limitations reflected in its minimal autotrophic respiration and photosynthetic activity, and high photoinhibition (Martínez-Maldonado et al., 2021) induced by the higher soil water deficit conditions.
The high omega coefficient at the FI site showed that without great limitations or fluctuations of water in the soil, the potato canopy has a greater advantage because of its low surface control on ET and GPP. Water and carbon can freely move in and out, and fluxes are not affected by the stomatal conductance and the water content in the soil. However, this high omega is also disadvantageous under water deficit conditions. Under water deficit conditions of the DI site, the canopy had less capacity to reduce evapotranspiration and avoid water losses. Apparently, the control mechanisms like higher surface resistance to minimize excessive water loss works only in high atmospheric evaporative demand and very low SWC, and although it reduces ET, it has great consequences on GPP.
Through the analysis of both omega and correlation coefficients we distinguished the possible causes of lower IWUE and the dominance of environmental VPD and PPFD controls of ET and GPP fluxes under the contrasting soil water availability from water management. These variables and their underlying theory could give new information about carbon–water interactions and it can be used as a tool to further understand the impact of drought on potato agroecosystems.

References

  1. Abbate, P.E.; Dardanelli, J.L., Cantarero. Climatic and Water Availability Effects on Water-Use Efficiency in Wheat. n.d.
  2. Aguilos, M.; Sun, G.; Noormets, A.; Domec, J.-C.; McNulty, S.; Gavazzi, M.; Prajapati, P.; Minick, K.J.; Mitra, B.; King, J. Ecosystem Productivity and Evapotranspiration Are Tightly Coupled in Loblolly Pine (Pinus taeda L.) Plantations along the Coastal Plain of the Southeastern U.S. Forests 2021, 12, 1123. [Google Scholar] [CrossRef]
  3. Aires, L.; Pio, C.; Pereira, J. The effect of drought on energy and water vapour exchange above a mediterranean C3/C4 grassland in Southern Portugal. Agric. For. Meteorol. 2008, 148, 565–579. [Google Scholar] [CrossRef]
  4. Ali, S.; Xu, Y.; Ma, X.; Ahmad, I.; Kamran, M.; Dong, Z.; Cai, T.; Jia, Q.; Ren, X.; Zhang, P.; et al. Planting Patterns and Deficit Irrigation Strategies to Improve Wheat Production and Water Use Efficiency under Simulated Rainfall Conditions. Front. Plant Sci. 2017, 8, 1408. [Google Scholar] [CrossRef]
  5. Alves, I.; Perrier, A.; Pereira, L.S. AERODYNAMIC AND SURFACE RESISTANCES OF COMPLETE COVER CROPS: HOW GOOD IS THE “BIG LEAF”? Trans. ASAE 1998, 41, 345–351. [Google Scholar] [CrossRef]
  6. Alves, J.D.N.; Ribeiro, A.; Rody, Y.P.; Loos, R.A. Energy balance and surface decoupling factor of a pasture in the Brazilian Cerrado. Agric. For. Meteorol. 2022, 319, 108912. [Google Scholar] [CrossRef]
  7. Alves, J.D.N.; Ribeiro, A.; Rody, Y.P.; Loos, R.A. Energy balance and surface decoupling factor of a pasture in the Brazilian Cerrado. Agric. For. Meteorol. 2022, 319, 108912. [Google Scholar] [CrossRef]
  8. Amer, K.H.; Hatfield, J.L. Canopy Resistance as Affected by Soil and Meteorological Factors in Potato. Agron. J. 2004, 96, 978–985. [Google Scholar] [CrossRef]
  9. Arkebauer, T.J.; Walter-Shea, E.A.; Mesarch, M.A.; Suyker, A.E.; Verma, S.B. Scaling up of CO2 fluxes from leaf to canopy in maize-based agroecosystems. Agric. For. Meteorol. 2009, 149, 2110–2119. [Google Scholar] [CrossRef]
  10. Aubinet, M.; Moureaux, C.; Bodson, B.; Dufranne, D.; Heinesch, B.; Suleau, M.; Vancutsem, F.; Vilret, A. Carbon sequestration by a crop over a 4-year sugar beet/winter wheat/seed potato/winter wheat rotation cycle. Agric. For. Meteorol. 2009, 149, 407–418. [Google Scholar] [CrossRef]
  11. Baldocchi, D.; Kelliher, F.M.; Black, T.A.; Jarvis, P. Climate and vegetation controls on boreal zone energy exchange. Glob. Chang. Biol. 2000, 6, 69–83. [Google Scholar] [CrossRef]
  12. Battipaglia, G.; Saurer, M.; Cherubini, P.; Calfapietra, C.; McCarthy, H.R.; Norby, R.J.; Cotrufo, M.F. Elevated CO2 increases tree-level intrinsic water use efficiency: insights from carbon and oxygen isotope analyses in tree rings across three forest FACE sites. New Phytol. 2012, 197, 544–554. [Google Scholar] [CrossRef] [PubMed]
  13. Battipaglia, G.; Saurer, M.; Cherubini, P.; Calfapietra, C.; McCarthy, H.R.; Norby, R.J.; Cotrufo, M.F. Elevated CO2 increases tree-level intrinsic water use efficiency: insights from carbon and oxygen isotope analyses in tree rings across three forest FACE sites. New Phytol. 2012, 197, 544–554. [Google Scholar] [CrossRef] [PubMed]
  14. Beer, C.; Ciais, P.; Reichstein, M.; Baldocchi, D.; Law, B.E.; Papale, D.; Soussana, J.; Ammann, C.; Buchmann, N.; Frank, D.; et al. Temporal and among-site variability of inherent water use efficiency at the ecosystem level. Glob. Biogeochem. Cycles 2009, 23. [Google Scholar] [CrossRef]
  15. Bierhuizen, J.F.; Slatyer, R.O. Agricultural Meteorology-Elsevier Publishing Company, Amsterdam-Printed in The Netherlands EFFECT OF ATMOSPHERIC CONCENTRATION OF WATER VAPOUR AND COs IN DETERMINING TRANSPIRATION-PHOTOSYNTHESIS RELATIONSHIPS OF COTTON LEAVES, Agr. Meteorol. 1965. [Google Scholar]
  16. Birch, P.R.J.; Bryan, G.J.; Fenton, B.; Gilroy, E.M.; Hein, I.; Jones, J.T.; Prashar, A.; Taylor, M.A.; Torrance, L.; Toth, I.K. Crops that feed the world 8: Potato: are the trends of increased global production sustainable? Food Secur. 2012, 4, 477–508. [Google Scholar] [CrossRef]
  17. Bouzalakos, S.; Mercedes, M. Overview of carbon dioxide (CO2) capture and storage technology. Developments and Innovation in Carbon Dioxide (CO2) Capture and Storage Technology 1–24. 2010. [Google Scholar] [CrossRef]
  18. Brown, K.W. Sugar beet and potatoes. In Vegetation and the Atmosphere; Monteith, J.L., Ed.; Academic Press: London, 1976; pp. 65–86. [Google Scholar]
  19. Brunsell, N.A.; Wilson, C.J. Multiscale Interactions betweenWater and Carbon Fluxes and Environmental Variables in A Central U.S. Grassland. Entropy 2013, 15, 1324–1341. [Google Scholar] [CrossRef]
  20. Buysse, P.; Bodson, B.; Debacq, A.; De Ligne, A.; Heinesch, B.; Manise, T.; Moureaux, C.; Aubinet, M. Carbon budget measurement over 12 years at a crop production site in the silty-loam region in Belgium. Agric. For. Meteorol. 2017, 246, 241–255. [Google Scholar] [CrossRef]
  21. Cabral, O.M.; Rocha, H.R.; Gash, J.H.; Ligo, M.A.; Ramos, N.P.; Packer, A.P.; Batista, E.R. Fluxes of CO2 above a sugarcane plantation in Brazil. Agric. For. Meteorol. 2013, 182-183, 54–66. [Google Scholar] [CrossRef]
  22. Campbell, G.S.; Norman, J.M. An Introduction to Environmental Biophysics, second ed.; Springer-Verlag: New York, 1998. [Google Scholar]
  23. Chen, S.; Chen, J.; Lin, G.; Zhang, W.; Miao, H.; Wei, L.; Huang, J.; Han, X. Energy balance and partition in Inner Mongolia steppe ecosystems with different land use types. Agric. For. Meteorol. 2009, 149, 1800–1809. [Google Scholar] [CrossRef]
  24. Chi, J.; Waldo, S.; Pressley, S.; O’keeffe, P.; Huggins, D.; Stöckle, C.; Pan, W.L.; Brooks, E.; Lamb, B. Assessing carbon and water dynamics of no-till and conventional tillage cropping systems in the inland Pacific Northwest US using the eddy covariance method. Agric. For. Meteorol. 2016, 218-219, 37–49. [Google Scholar] [CrossRef]
  25. Ciais, P.; Reichstein, M.; Viovy, N.; Granier, A.; Ogée, J.; Allard, V.; Aubinet, M.; Buchmann, N.; Bernhofer, C.; Carrara, A.; et al. Europe-wide reduction in primary productivity caused by the heat and drought in 2003. Nature 2005, 437, 529–533. [Google Scholar] [CrossRef]
  26. CIP, 2022. Hechos y Cifras sobre la Papa [WWW Document]. URL. Available online: www.cipotato.
  27. Clune, S.; Crossin, E.; Verghese, K. Systematic review of greenhouse gas emissions for different fresh food categories. J. Clean. Prod. 2017, 140, 766–783. [Google Scholar] [CrossRef]
  28. De Kauwe, M.G.; Medlyn, B.E.; Knauer, J.; Williams, C.A. Ideas and perspectives: how coupled is the vegetation to the boundary layer? Biogeosciences 2017, 14, 4435–4453. [Google Scholar] [CrossRef]
  29. de la Motte, L.G.; Beauclaire, Q.; Heinesch, B.; Cuntz, M.; Foltýnová, L.; Šigut, L.; Kowalska, N.; Manca, G.; Ballarin, I.G.; Vincke, C.; et al. Non-stomatal processes reduce gross primary productivity in temperate forest ecosystems during severe edaphic drought. Philos. Trans. R. Soc. B: Biol. Sci. 2020, 375, 20190527. [Google Scholar] [CrossRef]
  30. Devaux, A.; Kromann, P.; Ortiz, O. Potatoes for Sustainable Global Food Security. Potato Res. 2014, 57, 185–199. [Google Scholar] [CrossRef]
  31. Díaz, E.; Adsuara, J.E.; Martínez, M.; Piles, M.; Camps-Valls, G. Inferring causal relations from observational long-term carbon and water fluxes records. Sci. Rep. 2022, 12, 1–12. [Google Scholar] [CrossRef]
  32. Eamus, D.; Huete, A.; Yu, Q. Modelling Leaf and Canopy Photosynthesis. In Vegetation Dynamics: A Synthesis of Plant Ecophysiology, Remote Sensing and Modelling; Cambridge University Press.: Cambridge, 2016a; pp. 260–280. [Google Scholar] [CrossRef]
  33. Eamus, D.; Huete, A.; Yu, Q. Modelling Radiation Exchange and Energy Balances of Leaves and Canopies, in: Vegetation Dynamics: A Synthesis of Plant Ecophysiology, Remote Sensing and Modelling. Cambridge University Press., Cambridge, pp. 244–259. In Vegetation Dynamics: A Synthesis of Plant Ecophysiology, Remote Sensing and Modelling; Cambridge University Press.: Cambridge, 2016b; pp. 244–259. [Google Scholar] [CrossRef]
  34. Evans, J.R. Mesophyll conductance: walls, membranes and spatial complexity. New Phytol. 2020, 229, 1864–1876. [Google Scholar] [CrossRef] [PubMed]
  35. Evans, J.R.; Poorter, H. Photosynthetic acclimation of plants to growth irradiance: the relative importance of specific leaf area and nitrogen partitioning in maximizing carbon gain. Plant, Cell Environ. 2001, 24, 755–767. [Google Scholar] [CrossRef]
  36. Kjelgaard, J.F.; Stockle, C.O. EVALUATI NG SURFACE RESISTANCE FOR ESTIMATING CORN AND POTATO EVAPOTRANSPIRATION WITH THE PENMAN–MONTEITH MODEL. Trans. ASAE 2001, 44. [Google Scholar] [CrossRef]
  37. Falge, E.; Baldocchi, D.; Olson, R.; Anthoni, P.; Aubinet, M.; Bernhofer, C.; Burba, G.; Ceulemans, R.; Clement, R.; Dolman, H.; et al. Gap filling strategies for defensible annual sums of net ecosystem exchange. Agric. For. Meteorol. 2001, 107, 43–69. [Google Scholar] [CrossRef]
  38. Falge, E.; Baldocchi, D.; Tenhunen, J.; Aubinet, M.; Bakwin, P.; Berbigier, P.; Bernhofer, C.; Burba, G.; Clement, R.; Davis, K.J.; et al. Seasonality of ecosystem respiration and gross primary production as derived from FLUXNET measurements. Agric. For. Meteorol. 2002, 113, 53–74. [Google Scholar] [CrossRef]
  39. Fatichi, S.; Leuzinger, S.; Körner, C. Moving beyond photosynthesis: from carbon source to sink-driven vegetation modeling. New Phytol. 2013, 201, 1086–1095. [Google Scholar] [CrossRef] [PubMed]
  40. Fei, X.; Jin, Y.; Zhang, Y.; Sha, L.; Liu, Y.; Song, Q.; Zhou, W.; Liang, N.; Yu, G.; Zhang, L.; et al. Eddy covariance and biometric measurements show that a savanna ecosystem in Southwest China is a carbon sink. Sci. Rep. 2017, 7, srep41025. [Google Scholar] [CrossRef] [PubMed]
  41. Ferreira, M.I. Stress Coefficients for Soil Water Balance Combined with Water Stress Indicators for Irrigation Scheduling of Woody Crops. Horticulturae 2017, 3, 38. [Google Scholar] [CrossRef]
  42. Field, C.B.; Jackson, R.B.; Mooney, H.A. Stomatal responses to increased CO2: implications from the plant to the global scale. Plant, Cell Environ. 1995, 18, 1214–1225. [Google Scholar] [CrossRef]
  43. Flexas, J.; Barbour, M.M.; Brendel, O.; Cabrera, H.M.; Carriquí, M.; Díaz-Espejo, A.; Douthe, C.; Dreyer, E.; Ferrio, J.P.; Gago, J.; et al. Mesophyll diffusion conductance to CO2: An unappreciated central player in photosynthesis. Plant Sci. 2012, 193-194, 70–84. [Google Scholar] [CrossRef] [PubMed]
  44. Flexas, J.; Bota, J.; Loreto, F.; Cornic, G.; Sharkey, T.D. Diffusive and Metabolic Limitations to Photosynthesis under Drought and Salinity in C3 Plants. Plant Biol. 2004, 6, 269–279. [Google Scholar] [CrossRef]
  45. Flexas, J.; Medrano, H. Drought-inhibition of photosynthesis in C3 plants: Stomatal and non-stomatal limitations revisited. Ann. Bot. 2002, 89, 183–189. [Google Scholar] [CrossRef] [PubMed]
  46. Flexas, J.; Niinemets; Gallé, A.; Barbour, M.M.; Centritto, M.; Diaz-Espejo, A.; Douthe, C.; Galmés, J.; Ribas-Carbo, M.; Rodriguez, P.L.; et al. Diffusional conductances to CO2 as a target for increasing photosynthesis and photosynthetic water-use efficiency. Photosynth. Res. 2013, 117, 45–59. [Google Scholar] [CrossRef]
  47. Galmés, J.; Medrano, H.; Flexas, J. Photosynthetic limitations in response to water stress and recovery in Mediterranean plants with different growth forms. New Phytol. 2007, 175, 81–93. [Google Scholar] [CrossRef]
  48. Gentilesca, T.; Battipaglia, G.; Borghetti, M.; Colangelo, M.; Altieri, S.; Ferrara, A.M.S.; Lapolla, A.; Rita, A.; Ripullone, F. Evaluating growth and intrinsic water-use efficiency in hardwood and conifer mixed plantations. Trees 2021, 35, 1329–1340. [Google Scholar] [CrossRef]
  49. Gentine, P.; Green, J.K.; Guérin, M.; Humphrey, V.; I Seneviratne, S.; Zhang, Y.; Zhou, S. Coupling between the terrestrial carbon and water cycles—a review. Environ. Res. Lett. 2019, 14, 083003. [Google Scholar] [CrossRef]
  50. George, T.S.; Taylor, M.A.; Dodd, I.C.; White, P.J. Climate Change and Consequences for Potato Production: a Review of Tolerance to Emerging Abiotic Stress. Potato Res. 2017, 60, 239–268. [Google Scholar] [CrossRef]
  51. Gervais, T.; Creelman, A.; Li, X.-Q.; Bizimungu, B.; De Koeyer, D.; Dahal, K. Potato Response to Drought Stress Physiological and Growth Basis. Front. Plant Sci. 2021, 12. [Google Scholar] [CrossRef] [PubMed]
  52. Gervais, T.; Creelman, A.; Li, X.-Q.; Bizimungu, B.; De Koeyer, D.; Dahal, K. Potato Response to Drought Stress Physiological and Growth Basis. Front. Plant Sci. 2021, 12. [Google Scholar] [CrossRef] [PubMed]
  53. Ghislain, M.; Núñez, J.; Herrera, M.d.R.; Spooner, D.M. The single Andigenum origin of Neo-Tuberosum potato materials is not supported by microsatellite and plastid marker analyses. Theor. Appl. Genet. 2009, 118, 963–969. [Google Scholar] [CrossRef] [PubMed]
  54. Gondim, P.S.D.S.; Lima, J.R.D.S.; Antonino, A.C.D.; Hammecker, C.; Da Silva, R.A.B.; Gomes, C.A. Environmental control on water vapour and energy exchanges over grasslands in semiarid region of Brazil. Revista Brasileira de Engenharia Agricola e Ambiental, 19, 3–8. [CrossRef]
  55. Gonzalez-Paleo, L.; Ravetta, D. Relationship between photosynthetic rate, water use and leaf structure in desert annual and perennial forbs differing in their growth. Photosynthetica 2018, 56, 1177–1187. [Google Scholar] [CrossRef]
  56. Goorman, R.; Bartual, A.; Paula, S.; Ojeda, F. Enhancement of photosynthesis in post-disturbance resprouts of two co-occurring Mediterranean Erica species. Plant Ecol. 2011, 212, 2023–2033. [Google Scholar] [CrossRef]
  57. Goulden, M.L.; Wofsy, S.C.; Harden, J.W.; Trumbore, S.E.; Crill, P.M.; Gower, S.T.; Fries, T.; Daube, B.C.; Fan, S.-M.; Sutton, D.J.; et al. Sensitivity of Boreal Forest Carbon Balance to Soil Thaw. Science 1998, 279, 214–217. [Google Scholar] [CrossRef] [PubMed]
  58. Grossiord, C.; Gessler, A.; Granier, A.; Pollastrini, M.; Bussotti, F.; Bonal, D. Interspecific competition influences the response of oak transpiration to increasing drought stress in a mixed Mediterranean forest. For. Ecol. Manag. 2014, 318, 54–61. [Google Scholar] [CrossRef]
  59. Guo, H.; Zhao, B.; Chen, J.; Yan, Y.; Li, B.; Chen, J. Seasonal changes of energy fluxes in an estuarine wetland of Shanghai, China. Chin. Geogr. Sci. 2010, 20, 23–29. [Google Scholar] [CrossRef]
  60. Guo, R.; Zhao, Y.; Shi, Y.; Li, F.; Hu, J.; Yang, H. Low carbon development and local sustainability from a carbon balance perspective. Resour. Conserv. Recycl. 2017, 122, 270–279. [Google Scholar] [CrossRef]
  61. Haile-Mariam, S.; Collins, H.P.; Higgins, S.S. Greenhouse Gas Fluxes from an Irrigated Sweet Corn ( Zea mays L.)–Potato ( Solanum tuberosum L.) Rotation. J. Environ. Qual. 2008, 37, 759–771. [Google Scholar] [CrossRef] [PubMed]
  62. Herbst, M.; Kutsch, W.L.; Hummelshøj, P.; Jensen, N.O.; Kappen, L. Canopy physiology: interpreting the variations in eddy fluxes of water vapour and carbon dioxide observed over a beech forest Basic and Applied Ecology. Basic Appl. Ecol 2002. [Google Scholar] [CrossRef]
  63. Hill, D.; Nelson, D.; Hammond, J.; Bell, L. Morphophysiology of Potato (Solanum tuberosum) in Response to Drought Stress: Paving the Way Forward. Front. Plant Sci. 2021, 11. [Google Scholar] [CrossRef] [PubMed]
  64. Hill, D.; Nelson, D.; Hammond, J.; Bell, L. Morphophysiology of Potato (Solanum tuberosum) in Response to Drought Stress: Paving the Way Forward. Front. Plant Sci. 2021, 11. [Google Scholar] [CrossRef] [PubMed]
  65. Howlader, O.; Hoque, M. Growth analysis and yield performance of four potato (Solanum tuberosum L.) Varieties. Bangladesh J. Agric. Res. 2018, 43, 267–280. [Google Scholar] [CrossRef]
  66. Hu, Z.; Yu, G.; Fu, Y.; Sun, X.; Li, Y.; Shi, P.; Wang, Y.; Zheng, Z. Effects of vegetation control on ecosystem water use efficiency within and among four grassland ecosystems in China. Glob. Chang. Biol. 2008, 14, 1609–1619. [Google Scholar] [CrossRef]
  67. Hunt, R. Basic Growth Analysis; Springer Science and Business Media LLC: Dordrecht, GX, Netherlands, 1990. [Google Scholar]
  68. Huxman, T.E.; Snyder, K.A.; Tissue, D.; Leffler, A.J.; Ogle, K.; Pockman, W.T.; Sandquist, D.R.; Potts, D.L.; Schwinning, S. Precipitation pulses and carbon fluxes in semiarid and arid ecosystems. Oecologia 2004, 141, 254–268. [Google Scholar] [CrossRef]
  69. Irmak, S.; Mutiibwa, D. On the dynamics of canopy resistance: Generalized linear estimation and relationships with primary micrometeorological variables. Water Resour. Res. 2010, 46. [Google Scholar] [CrossRef]
  70. Jarvis, P.P. COUPLING OF TRANSPIRATION TO THE ATMOSPHERE IN HORTICULTURAL CROPS: THE OMEGA FACTOR. Acta Hortic. 1985, 187–206. [Google Scholar] [CrossRef]
  71. Jarvis, P.G.; McNaughton, K.G. Stomatal Control of Transpiration: Scaling Up from Leaf to Region. Adv. Ecol. Res. 1986, 15, 1–49. [Google Scholar] [CrossRef]
  72. Jarvis, P.G.; McNaughton, K.G. Stomatal Control of Transpiration: Scaling Up from Leaf to Region. Adv. Ecol. Res. 1986, 15, 1–49. [Google Scholar] [CrossRef]
  73. Jennings, S.A.; Koehler, A.-K.; Nicklin, K.J.; Deva, C.; Sait, S.M.; Challinor, A.J. Global Potato Yields Increase Under Climate Change With Adaptation and CO2 Fertilisation. Front. Sustain. Food Syst. 2020, 4. [Google Scholar] [CrossRef]
  74. Jia, X.; Zha, T.S.; Wu, B.; Zhang, Y.Q.; Gong, J.N.; Qin, S.G.; Chen, G.P.; Qian, D.; Kellomäki, S.; Peltola, H. Biophysical controls on net ecosystem CO2 exchange over a semiarid shrubland in northwest China. Biogeosciences 2014, 11, 4679–4693. [Google Scholar] [CrossRef]
  75. Jongen, M.; Pereira, J.S.; Aires, L.M.I.; Pio, C.A. The effects of drought and timing of precipitation on the inter-annual variation in ecosystem-atmosphere exchange in a Mediterranean grassland. Agric. For. Meteorol. 2011, 151, 595–606. [Google Scholar] [CrossRef]
  76. Jullien, A.; Allirand, J.-M.; Mathieu, A.; Andrieu, B.; Ney, B. Variations in leaf mass per area according to N nutrition, plant age, and leaf position reflect ontogenetic plasticity in winter oilseed rape (Brassica napus L.). Field Crop. Res. 2009, 114, 188–197. [Google Scholar] [CrossRef]
  77. Kang, M.; Zhang, Z.; Noormets, A.; Fang, X.; Zha, T.; Zhou, J.; Sun, G.; McNulty, S.G.; Chen, J. Energy partitioning and surface resistance of a poplar plantation in northern China. Biogeosciences 2015, 12, 4245–4259. [Google Scholar] [CrossRef]
  78. Katul, G.; Manzoni, S.; Palmroth, S.; Oren, R. A stomatal optimization theory to describe the effects of atmospheric CO2 on leaf photosynthesis and transpiration. Ann. Bot. 2009, 105, 431–442. [Google Scholar] [CrossRef]
  79. Katul, G.; Manzoni, S.; Palmroth, S.; Oren, R. A stomatal optimization theory to describe the effects of atmospheric CO2 on leaf photosynthesis and transpiration. Ann. Bot. 2009, 105, 431–442. [Google Scholar] [CrossRef]
  80. Katul, G.G.; Palmroth, S.; Oren, R. Leaf stomatal responses to vapour pressure deficit under current and CO2-enriched atmosphere explained by the economics of gas exchange. Plant, Cell Environ. 2009, 32, 968–979. [Google Scholar] [CrossRef]
  81. Keenan, T.F.; Hollinger, D.Y.; Bohrer, G.; Dragoni, D.; Munger, J.W.; Schmid, H.P.; Richardson, A.D. Increase in forest water-use efficiency as atmospheric carbon dioxide concentrations rise. Nature 2013, 499, 324–327. [Google Scholar] [CrossRef] [PubMed]
  82. Keenan, T.F.; Hollinger, D.Y.; Bohrer, G.; Dragoni, D.; Munger, J.W.; Schmid, H.P.; Richardson, A.D. Increase in forest water-use efficiency as atmospheric carbon dioxide concentrations rise. Nature 2013, 499, 324–327. [Google Scholar] [CrossRef]
  83. Krich, C.; Mahecha, M.D.; Migliavacca, M.; De Kauwe, M.G.; Griebel, A.; Runge, J.; Miralles, D.G. Decoupling between ecosystem photosynthesis and transpiration: a last resort against overheating. Environ. Res. Lett. 2022, 17, 044013. [Google Scholar] [CrossRef]
  84. Kumagai, T.; Tateishi, M.; Shimizu, T.; Otsuki, K. Transpiration and canopy conductance at two slope positions in a Japanese cedar forest watershed. Agric. For. Meteorol. 2008, 148, 1444–1455. [Google Scholar] [CrossRef]
  85. Launiainen, S.; Katul, G.G.; Kolari, P.; Vesala, T.; Hari, P. Empirical and optimal stomatal controls on leaf and ecosystem level CO2 and H2O exchange rates. Agric. For. Meteorol. 2011, 151, 1672–1689. [Google Scholar] [CrossRef]
  86. Law, B.; Falge, E.; Gu, L.; Baldocchi, D.; Bakwin, P.; Berbigier, P.; Davis, K.; Dolman, A.; Falk, M.; Fuentes, J.; et al. Environmental controls over carbon dioxide and water vapor exchange of terrestrial vegetation. Agric. For. Meteorol. 2002, 113, 97–120. [Google Scholar] [CrossRef]
  87. Law, B.E.; Williams, M.; Anthoni, P.M.; Baldocchi, D.D.; Unsworth, M.H. Measuring and modelling seasonal variation of carbon dioxide and water vapour exchange of a Pinus ponderosa forest subject to soil water deficit. Glob. Chang. Biol. 2000, 6, 613–630. [Google Scholar] [CrossRef]
  88. Leonardi, S.; Gentilesca, T.; Guerrieri, R.; Ripullone, F.; Magnani, F.; Mencuccini, M.; Noije, T.V.; Borghetti, M. Assessing the effects of nitrogen deposition and climate on carbon isotope discrimination and intrinsic water-use efficiency of angiosperm and conifer trees under rising CO2 conditions. Glob. Chang. Biol. 2012, 18, 2925–2944. [Google Scholar] [CrossRef]
  89. Leuning, R. A critical appraisal of a combined stomatal-photosynthesis model for C3 plants. Plant, Cell Environ. 1995, 18, 339–355. [Google Scholar] [CrossRef]
  90. Li, D.; Fang, K.; Li, Y.; Chen, D.; Liu, X.; Dong, Z.; Zhou, F.; Guo, G.; Shi, F.; Xu, C.; et al. Climate, intrinsic water-use efficiency and tree growth over the past 150 years in humid subtropical China. PLOS ONE 2017, 12, e0172045. [Google Scholar] [CrossRef]
  91. Li, S.; Lai, C.; Lee, G.; Shimoda, S.; Yokoyama, T.; Higuchi, A.; Oikawa, T. Evapotranspiration from a wet temperate grassland and its sensitivity to microenvironmental variables. Hydrol. Process. 2004, 19, 517–532. [Google Scholar] [CrossRef]
  92. Li, Y.; Zhang, X.; Shao, Q.; Fan, J.; Chen, Z.; Dong, J.; Hu, Z.; Zhan, Y. Community Composition and Structure Affect Ecosystem and Canopy Water Use Efficiency Across Three Typical Alpine Ecosystems. Front. Plant Sci. 2022, 12, 771424. [Google Scholar] [CrossRef] [PubMed]
  93. Lin, B.-S.; Lei, H.; Hu, M.-C.; Visessri, S.; Hsieh, C.-I. Canopy Resistance and Estimation of Evapotranspiration above a Humid Cypress Forest. Adv. Meteorol. 2020, 2020, 1–16. [Google Scholar] [CrossRef]
  94. Lin, Y.-S.; Medlyn, B.E.; Duursma, R.A.; Prentice, I.C.; Wang, H.; Baig, S.; Eamus, D.; de Dios, V.R.; Mitchell, P.; Ellsworth, D.S.; et al. Optimal stomatal behaviour around the world. Nat. Clim. Chang. 2015, 5, 459–464. [Google Scholar] [CrossRef]
  95. Linderson, M.-L.; Mikkelsen, T.; Ibrom, A.; Lindroth, A.; Ro-Poulsen, H.; Pilegaard, K. Up-scaling of water use efficiency from leaf to canopy as based on leaf gas exchange relationships and the modeled in-canopy light distribution. Agric. For. Meteorol. 2012, 152, 201–211. [Google Scholar] [CrossRef]
  96. Lipper, L.; Thornton, P.; Campbell, B.M.; Baedeker, T.; Braimoh, A.; Bwalya, M.; Caron, P.; Cattaneo, A.; Garrity, D.; Henry, K.; et al. Climate-smart agriculture for food security. Nat. Clim. Chang. 2014, 4, 1068–1072. [Google Scholar] [CrossRef]
  97. Liu, S.; Baret, F.; Abichou, M.; Manceau, L.; Andrieu, B.; Weiss, M.; Martre, P. Importance of the description of light interception in crop growth models. Plant Physiol. 2021, 186, 977–997. [Google Scholar] [CrossRef] [PubMed]
  98. Liu, X.; Wang, P.; Song, H.; Zeng, X. Determinants of net primary productivity: Low-carbon development from the perspective of carbon sequestration. Technol. Forecast. Soc. Chang. 2021, 172, 121006. [Google Scholar] [CrossRef]
  99. Loader, N.J.; Walsh, R.P.D.; Robertson, I.; Bidin, K.; Ong, R.C.; Reynolds, G.; McCarroll, D.; Gagen, M.; Young, G.H.F. Recent trends in the intrinsic water-use efficiency of ringless rainforest trees in Borneo. Philos. Trans. R. Soc. B: Biol. Sci. 2011, 366, 3330–3339. [Google Scholar] [CrossRef]
  100. Lombardozzi, D.; Levis, S.; Bonan, G.; Sparks, J.P. Predicting photosynthesis and transpiration responses to ozone: decoupling modeled photosynthesis and stomatal conductance. Biogeosciences 2012, 9, 3113–3130. [Google Scholar] [CrossRef]
  101. López-Olivari, R.; Fuentes, S.; Poblete-Echeverría, C.; Quintulen-Ancapi, V.; Medina, L. Site-Specific Evaluation of Canopy Resistance Models for Estimating Evapotranspiration over a Drip-Irrigated Potato Crop in Southern Chile under Water-Limited Conditions. Water 2022, 14, 2041. [Google Scholar] [CrossRef]
  102. Mackay, G.R. New Light on a Hidden Treasure. Rome: FAO (2009), pp. 136, US$45.00. ISBN 978-92-5-106142-8. Exp. Agric. 2009, 45, 376–376. [Google Scholar] [CrossRef]
  103. Magnani, F.; Leonardi, S.; Tognetti, R.; Grace, J.; Borghetti, M. Modelling the surface conductance of a broad-leaf canopy: effects of partial decoupling from the atmosphere. Plant, Cell Environ. 1998, 21, 867–879. [Google Scholar] [CrossRef]
  104. Mallick, K.; Trebs, I.; Boegh, E.; Giustarini, L.; Schlerf, M.; Drewry, D.T.; Hoffmann, L.; von Randow, C.; Kruijt, B.; Araùjo, A.; et al. Canopy-scale biophysical controls of transpiration and evaporation in the Amazon Basin. Hydrol. Earth Syst. Sci. 2016, 20, 4237–4264. [Google Scholar] [CrossRef]
  105. Martínez-Maldonado, F.E.; Castaño-Marín, A.M.; Goez-Vinasco, G.A.; Marin, F.R. Gross Primary Production of Rainfed and Irrigated Potato ( Solanum tuberosum L.) in the Colombian Andean Region Using Eddy Covariance Technique. Water (Switzerland) 2021a, 13. [Google Scholar] [CrossRef]
  106. Martínez-Maldonado, F.E.; Castaño-Marín, A.M.; Góez-Vinasco, G.A.; Marin, F.R. Gross Primary Production of Rainfed and Irrigated Potato (Solanum tuberosum L.) in the Colombian Andean Region Using Eddy Covariance Technique. Water 2021, 13, 3223. [Google Scholar] [CrossRef]
  107. McNaughton, K.; Jarvis, P. Effects of spatial scale on stomatal control of transpiration. Agric. For. Meteorol. 1991, 54, 279–302. [Google Scholar] [CrossRef]
  108. Meshalkina, J.; Yaroslavtsev, A.; Vassenev, I. Carbon balance of the typical grain crop rotation in Moscow region assessed by eddy covariance method. 2017, 19, 12212. [Google Scholar]
  109. Meshalkina, J.L.; Yaroslavtsev, A.M.; I Vasenev, I.; Andreeva, I.V.; Tihonova, M.V. Carbon balance assessment by eddy covariance method for agroecosystems with potato plants and oats & vetch mixture on sod-podzolic soils of Russia. IOP Conf. Series: Earth Environ. Sci. 2018, 107, 012119. [Google Scholar] [CrossRef]
  110. Michel, A.J.; Teixeira, E.I.; Brown, H.E.; Dellow, S.J.; Maley, S.; Gillespie, R.N.; Richards, K.K. Water stress responses of three potato cultivars. Agronomy New Zealand 2019, 49, 25–37. [Google Scholar]
  111. Migliavacca, M.; Meroni, M.; Manca, G.; Matteucci, G.; Montagnani, L.; Grassi, G.; Zenone, T.; Teobaldelli, M.; Goded, I.; Colombo, R.; et al. Seasonal and interannual patterns of carbon and water fluxes of a poplar plantation under peculiar eco-climatic conditions. Agric. For. Meteorol. 2009, 149, 1460–1476. [Google Scholar] [CrossRef]
  112. Katz, A. The determination of rubidium and strontium in silicates by flameless atomic-absorption spectroscopy. Chem. Geol. 1975, 16, 15–25. [Google Scholar] [CrossRef]
  113. Monteith, J.L. How Do Crops Manipulate Water Supply and Demand? Philos Trans R Soc Lond 1986, 316, 245–259. [Google Scholar]
  114. Moors, E.J.; Jacobs, C.; Jans, W.; Supit, I.; Kutsch, W.L.; Bernhofer, C.; Béziat, P.; Buchmann, N.; Carrara, A.; Ceschia, E.; et al. Variability in carbon exchange of European croplands. Agric. Ecosyst. Environ. 2010, 139, 325–335. [Google Scholar] [CrossRef]
  115. Morén, A.-S.; Lindroth, A.; Grelle, A. Water-use efficiency as a means of modelling net assimilation in boreal forests. Trees 2000, 15, 67–74. [Google Scholar] [CrossRef]
  116. Vásquez, T.M.; Del Castillo, S.; Gálvez, D.C.; Rodríguez, L.E. Breeding Differently: Participatory Selection and Scaling Up Innovations in Colombia. Potato Res. 2017, 60, 361–381. [Google Scholar] [CrossRef]
  117. Muthoni, J.; Kabira, J. Potato Production under Drought Conditions: Identification of Adaptive Traits. Int. J. Hortic. 2016, 6. [Google Scholar] [CrossRef]
  118. Nadal-Sala, D.; Grote, R.; Birami, B.; Knüver, T.; Rehschuh, R.; Schwarz, S.; Ruehr, N.K. Leaf Shedding and Non-Stomatal Limitations of Photosynthesis Mitigate Hydraulic Conductance Losses in Scots Pine Saplings During Severe Drought Stress. Front. Plant Sci. 2021, 12. [Google Scholar] [CrossRef] [PubMed]
  119. Nasir, M.W.; Toth, Z. Effect of Drought Stress on Potato Production: A Review. Agronomy 2022, 12, 635. [Google Scholar] [CrossRef]
  120. Nasir, M.W.; Toth, Z. Effect of Drought Stress on Potato Production: A Review. Agronomy 2022, 12, 635. [Google Scholar] [CrossRef]
  121. Nassif, D.S.P.; da Costa, L.G.; Vianna, M.d.S.; Carvalho, K.d.S.; Marin, F.R. The role of decoupling factor on sugarcane crop water use under tropical conditions. Exp. Agric. 2019, 55, 913–923. [Google Scholar] [CrossRef]
  122. Nassif, D.S.P.; Marin, F.R.; Costa, L.G. Evapotranspiration and Transpiration Coupling to the Atmosphere of Sugarcane in Southern Brazil: Scaling Up from Leaf to Field. Sugar Tech 2013, 16, 250–254. [Google Scholar] [CrossRef]
  123. Nelson, J.A.; Carvalhais, N.; Migliavacca, M.; Reichstein, M.; Jung, M. Water-stress-induced breakdown of carbon–water relations: indicators from diurnal FLUXNET patterns. Biogeosciences 2018, 15, 2433–2447. [Google Scholar] [CrossRef]
  124. Nelson, J.A.; Carvalhais, N.; Migliavacca, M.; Reichstein, M.; Jung, M. Water-stress-induced breakdown of carbon–water relations: indicators from diurnal FLUXNET patterns. Biogeosciences 2018, 15, 2433–2447. [Google Scholar] [CrossRef]
  125. Nemecek, T.; Weiler, K.; Plassmann, K.; Schnetzer, J.; Gaillard, G.; Jefferies, D.; García–Suárez, T.; King, H.; i Canals, L.M. Estimation of the variability in global warming potential of worldwide crop production using a modular extrapolation approach. J. Clean. Prod. 2012, 31, 106–117. [Google Scholar] [CrossRef]
  126. Niinemets; Cescatti, A.; Rodeghiero, M.; Tosens, T. Complex adjustments of photosynthetic potentials and internal diffusion conductance to current and previous light availabilities and leaf age in Mediterranean evergreen species Quercus ilex. Plant, Cell Environ. 2006, 29, 1159–1178. [Google Scholar] [CrossRef] [PubMed]
  127. Niu, S.; Xing, X.; Zhang, Z.; Xia, J.; Zhou, X.; Song, B.; Li, L.; Wan, S. Water-use efficiency in response to climate change: from leaf to ecosystem in a temperate steppe. Glob. Chang. Biol. 2011, 17, 1073–1082. [Google Scholar] [CrossRef]
  128. Obidiegwu, J.E.; Bryan, G.J.; Jones, H.G.; Prashar, A. Coping with drought: stress and adaptive responses in potato and perspectives for improvement. Front. Plant Sci. 2015, 6, 542. [Google Scholar] [CrossRef] [PubMed]
  129. Oliveira, J.S.; Brown, H.E.; Moot, D.J. Assessing potato canopy growth and development at the individual leaf level to improve the understanding of the plant source–sink relations. New Zealand J. Crop. Hortic. Sci. 2021, 49, 1–22. [Google Scholar] [CrossRef]
  130. Oo, A.Z.; Yamamoto, A.; Ono, K.; Umamageswari, C.; Mano, M.; Vanitha, K.; Elayakumar, P.; Matsuura, S.; Bama, K.S.; Raju, M.; et al. Ecosystem carbon dioxide exchange and water use efficiency in a triple-cropping rice paddy in Southern India: A two-year field observation. Sci. Total. Environ. 2023, 854, 158541. [Google Scholar] [CrossRef]
  131. Maroneze, M. M.; Zepka, L. Q.; Vieira, J. G.; Queiroz, M. I.; Jacob-Lopes, E. A Tecnologia de Remoção de Fósforo: Gerenciamento Do Elemento Em Resíduos Industriais. Rev. Ambient. e Agua 2014, 9, 445–458. [Google Scholar] [CrossRef]
  132. Pereira, J.S.; Mateus, J.A.; Aires, L.M.; Pita, G.; Pio, C.; David, J.S.; Andrade, V.; Banza, J.; David, T.S.; Paço, T.A.; et al. Net ecosystem carbon exchange in three contrasting Mediterranean ecosystems – the effect of drought. Biogeosciences 2007, 4, 791–802. [Google Scholar] [CrossRef]
  133. Perez, P.J.; Lecina, S.; Castellvi, F.; Martínez-Cob, A.; Villalobos, F.J. A simple parameterization of bulk canopy resistance from climatic variables for estimating hourly evapotranspiration. Hydrol. Process. 2005, 20, 515–532. [Google Scholar] [CrossRef]
  134. Raker, C.M.; Spooner, D.M. Chilean Tetraploid Cultivated Potato, Solanum tuberosum, is Distinct from the Andean Populations. Crop. Sci. 2002, 42, 1451–1458. [Google Scholar] [CrossRef]
  135. Rana, G.; Ferrara, R.; Vitale, D.; D’andrea, L.; Palumbo, A. Carbon assimilation and water use efficiency of a perennial bioenergy crop ( Cynara cardunculus L.) in Mediterranean environment. Agric. For. Meteorol. 2016, 217, 137–150. [Google Scholar] [CrossRef]
  136. Rana, G.; Katerji, N.; Mastrorilli, M.; Moujabber, M.E. Theoretical and Applied Climatology Evapotranspiration and Canopy Resistance of Grass in a Mediterranean Region. Theor. Appl. Climatol. 1994. [Google Scholar] [CrossRef]
  137. Reichstein, M.; Tenhunen, J.D.; Roupsard, O.; Ourcival, J.-M.; Rambal, S.; Miglietta, F.; Peressotti, A.; Pecchiari, M.; Tirone, G.; Valentini, R. Severe drought effects on ecosystem CO2 and H2O fluxes at three Mediterranean evergreen sites: Revision of current hypotheses? Glob. Chang. Biol. 2002, 8, 999–1017. [Google Scholar] [CrossRef]
  138. Rodríguez P., L.; Sanjuanelo C., D.; Ñústez, L.C.E.; Moreno-Fonseca, L.P. Growth and phenology of three Andean potato varieties (Solanum tuberosum L.) under water stress. Agron. Colomb. 2016, 34, 141. [Google Scholar] [CrossRef]
  139. Samanta, S.; Banerjee, S.; Mukherjee, A.; Patra, P.K.; Chakraborty, P.K. Determining the radiation use efficiency of potato using sunshine hour data: a simple and costless approach. Span. J. Agric. Res. 2020, 18, e0801. [Google Scholar] [CrossRef]
  140. Schwalm, C.R.; Williams, C.A.; Schaefer, K.; Arneth, A.; Bonal, D.; Buchmann, N.; Chen, J.; Law, B.E.; Lindroth, A.; Luyssaert, S.; et al. Assimilation exceeds respiration sensitivity to drought: A FLUXNET synthesis. Glob. Chang. Biol. 2010, 16, 657–670. [Google Scholar] [CrossRef]
  141. Scott, R.L.; Huxman, T.E.; Cable, W.L.; Emmerich, W.E. Partitioning of evapotranspiration and its relation to carbon dioxide exchange in a Chihuahuan Desert shrubland. Hydrol. Process. 2006, 20, 3227–3243. [Google Scholar] [CrossRef]
  142. Scott, R.L.; Huxman, T.E.; Cable, W.L.; Emmerich, W.E. Partitioning of evapotranspiration and its relation to carbon dioxide exchange in a Chihuahuan Desert shrubland. Hydrol. Process. 2006, 20, 3227–3243. [Google Scholar] [CrossRef]
  143. Service-USDA, U.S.D. of A.N.R.C., 2014. Claves para la Taxonomía de Suelos. Mdp.Edu.Ar 339.
  144. Shao, J.; Zhou, X.; Luo, Y.; Li, B.; Aurela, M.; Billesbach, D.; Blanken, P.D.; Bracho, R.; Chen, J.; Fischer, M.; et al. Biotic and climatic controls on interannual variability in carbon fluxes across terrestrial ecosystems. Agric. For. Meteorol. 2015, 205, 11–22. [Google Scholar] [CrossRef]
  145. da Silva, P.F.; Lima, J.R.d.S.; Antonino, A.C.D.; Souza, R.; de Souza, E.S.; Silva, J.R.I.; Alves, E.M. Seasonal patterns of carbon dioxide, water and energy fluxes over the Caatinga and grassland in the semi-arid region of Brazil. J. Arid. Environ. 2017, 147, 71–82. [Google Scholar] [CrossRef]
  146. Smith, W.K. Importance of Aerodynamic Resistance to Water Use Efficiency in Three Conifers under Field Conditions. Plant Physiol. 1980, 65, 132–135. [Google Scholar] [CrossRef]
  147. Souza, P.J.d.O.P.d.; Ribeiro, A.; da Rocha, E.J.P.; Farias, J.R.B.; de Souza, E.B. Sazonalidade no balanço de energia em áreas de cultivo de soja na Amazônia. Bragantia 2012, 71, 548–557. [Google Scholar] [CrossRef]
  148. Spinelli, G.M.; Snyder, R.L.; Sanden, B.L.; Gilbert, M.; Shackel, K.A. Low and variable atmospheric coupling in irrigated Almond (Prunus dulcis) canopies indicates a limited influence of stomata on orchard evapotranspiration. Agric. Water Manag. 2018, 196, 57–65. [Google Scholar] [CrossRef]
  149. Spinelli, G.M.; Snyder, R.L.; Sanden, B.L.; Gilbert, M.; Shackel, K.A. Low and variable atmospheric coupling in irrigated Almond (Prunus dulcis) canopies indicates a limited influence of stomata on orchard evapotranspiration. Agric. Water Manag. 2018, 196, 57–65. [Google Scholar] [CrossRef]
  150. Spinelli, G.M.; Snyder, R.L.; Sanden, B.L.; Shackel, K.A. Water stress causes stomatal closure but does not reduce canopy evapotranspiration in almond. Agric. Water Manag. 2016, 168, 11–22. [Google Scholar] [CrossRef]
  151. Steduto, P.; Hsiao, T.C. Maize canopies under two soil water regimes: III. Variation in coupling with the atmosphere and the role of leaf area index. Agric. For. Meteorol. 1998, 89, 201–213. [Google Scholar] [CrossRef]
  152. Sugiura, D.; Terashima, I.; Evans, J.R. A Decrease in Mesophyll Conductance by Cell-Wall Thickening Contributes to Photosynthetic Downregulation1. Plant Physiol. 2020, 183, 1600–1611. [Google Scholar] [CrossRef]
  153. Sutherlin, C.E.; Brunsell, N.A.; de Oliveira, G.; Crews, T.E.; DeHaan, L.R.; Vico, G. Contrasting Physiological and Environmental Controls of Evapotranspiration over Kernza Perennial Crop, Annual Crops, and C4 and Mixed C3/C4 Grasslands. Sustainability 2019, 11, 1640. [Google Scholar] [CrossRef]
  154. Sutherlin, C.E.; Brunsell, N.A.; de Oliveira, G.; Crews, T.E.; DeHaan, L.R.; Vico, G. Contrasting Physiological and Environmental Controls of Evapotranspiration over Kernza Perennial Crop, Annual Crops, and C4 and Mixed C3/C4 Grasslands. Sustainability 2019, 11, 1640. [Google Scholar] [CrossRef]
  155. Tagesson, T.; Fensholt, R.; Cropley, F.; Guiro, I.; Horion, S.; Ehammer, A.; Ardö, J. Dynamics in carbon exchange fluxes for a grazed semi-arid savanna ecosystem in West Africa. Agric. Ecosyst. Environ. 2015, 205, 15–24. [Google Scholar] [CrossRef]
  156. Tang, J.; Bolstad, P.V.; Ewers, B.E.; Desai, A.R.; Davis, K.J.; Carey, E.V. Sap flux-upscaled canopy transpiration, stomatal conductance, and water use efficiency in an old growth forest in the Great Lakes region of the United States. J. Geophys. Res. Biogeosci. 2006, 111. [Google Scholar] [CrossRef]
  157. Tang, X.; Ding, Z.; Li, H.; Li, X.; Luo, J.; Xie, J.; Chen, D. Characterizing ecosystem water-use efficiency of croplands with eddy covariance measurements and MODIS products. Ecol. Eng. 2015, 85, 212–217. [Google Scholar] [CrossRef]
  158. Teixeira, A.d.C.; Bastiaanssen, W.; Ahmad; Moura, M.; Bos, M. Analysis of energy fluxes and vegetation-atmosphere parameters in irrigated and natural ecosystems of semi-arid Brazil. J. Hydrol. 2008, 362, 110–127. [Google Scholar] [CrossRef]
  159. Vadez, V.; Kholova, J.; Medina, S.; Kakkera, A.; Anderberg, H. Transpiration efficiency: new insights into an old story. J. Exp. Bot. 2014, 65, 6141–6153. [Google Scholar] [CrossRef]
  160. van Dijke, A.J.H.; Mallick, K.; Schlerf, M.; Machwitz, M.; Herold, M.; Teuling, A.J. Examining the link between vegetation leaf area and land-atmosphere exchange of water, energy, and carbon fluxes using FLUXNET data. Biogeosciences 2020, 17, 4443–4457. [Google Scholar] [CrossRef]
  161. van Dijke, A.J.H.; Mallick, K.; Schlerf, M.; Machwitz, M.; Herold, M.; Teuling, A.J. Examining the link between vegetation leaf area and land-atmosphere exchange of water, energy, and carbon fluxes using FLUXNET data. Biogeosciences 2020, 17, 4443–4457. [Google Scholar] [CrossRef]
  162. Varone, L.; Ribas-Carbo, M.; Cardona, C.; Gallé, A.; Medrano, H.; Gratani, L.; Flexas, J. Stomatal and non-stomatal limitations to photosynthesis in seedlings and saplings of Mediterranean species pre-conditioned and aged in nurseries: Different response to water stress. Environ. Exp. Bot. 2012, 75, 235–247. [Google Scholar] [CrossRef]
  163. Viola, R.; Roberts, A.G., Haupt. Tuberization in Potato Involves a Switch from Apoplastic to Symplastic Phloem Unloading, The Plant Cell. 2001.
  164. Wagle, P.; Xiao, X.; Kolb, T.E.; Law, B.E.; Wharton, S.; Monson, R.K.; Chen, J.; Blanken, P.D.; Novick, K.A.; Dore, S.; et al. Differential responses of carbon and water vapor fluxes to climate among evergreen needleleaf forests in the USA. Ecol. Process. 2016, 5, 1–17. [Google Scholar] [CrossRef]
  165. Wehr, R.; Saleska, S.R. Calculating canopy stomatal conductance from eddy covariance measurements, in light of the energy budget closure problem. Biogeosciences 2021, 18, 13–24. [Google Scholar] [CrossRef]
  166. Weraduwage, S.M.; Chen, J.; Anozie, F.C.; Morales, A.; Weise, S.E.; Sharkey, T.D. The relationship between leaf area growth and biomass accumulation in Arabidopsis thaliana. Front. Plant Sci. 2015, 6, 167–167. [Google Scholar] [CrossRef] [PubMed]
  167. Wilson, K.B.; Baldocchi, D.D.; Hanson, P.J. Leaf age affects the seasonal pattern of photosynthetic capacityand net ecosystem exchange of carbon in a deciduous forest. Plant, Cell Environ. 2001, 24, 571–583. [Google Scholar] [CrossRef]
  168. Wood, D.A. Net ecosystem carbon exchange prediction and insightful data mining with an optimized data-matching algorithm. Ecol. Indic. 2021, 124, 107426. [Google Scholar] [CrossRef]
  169. Wright, G.C.; Rao, R.C.N.; Farquhar, G.D. Water-Use Efficiency and Carbon Isotope Discrimination in Peanut under Water Deficit Conditions. Crop. Sci. 1994, 34, 92–97. [Google Scholar] [CrossRef]
  170. Xie, J.; Chen, J.; Sun, G.; Zha, T.; Yang, B.; Chu, H.; Liu, J.; Wan, S.; Zhou, C.; Ma, H.; et al. Ten-year variability in ecosystem water use efficiency in an oak-dominated temperate forest under a warming climate. Agric. For. Meteorol. 2016, 218-219, 209–217. [Google Scholar] [CrossRef]
  171. Xu, L.; Baldocchi, D.D. Seasonal variation in carbon dioxide exchange over a Mediterranean annual grassland in California. Agric. For. Meteorol. 2004, 123, 79–96. [Google Scholar] [CrossRef]
  172. Yang, J.; A Duursma, R.; De Kauwe, M.G.; Kumarathunge, D.; Jiang, M.; Mahmud, K.; E Gimeno, T.; Crous, K.Y.; Ellsworth, D.S.; Peters, J.; et al. Incorporating non-stomatal limitation improves the performance of leaf and canopy models at high vapour pressure deficit. Tree Physiol. 2019, 39, 1961–1974. [Google Scholar] [CrossRef]
  173. Zhang, Z.Z.; Zhao, P.; McCarthy, H.R.; Zhao, X.H.; Niu, J.F.; Zhu, L.W.; Ni, G.Y.; Ouyang, L.; Huang, Y.Q. Influence of the decoupling degree on the estimation of canopy stomatal conductance for two broadleaf tree species. Agric. For. Meteorol. 2016, 221, 230–241. [Google Scholar] [CrossRef]
  174. Zhou, J.; Zhang, Z.; Sun, G.; Fang, X.; Zha, T.; McNulty, S.; Chen, J.; Jin, Y.; Noormets, A. Response of ecosystem carbon fluxes to drought events in a poplar plantation in Northern China. For. Ecol. Manag. 2013, 300, 33–42. [Google Scholar] [CrossRef]
  175. Zhou, S.; Yu, B.; Huang, Y.; Wang, G. Daily underlying water use efficiency for AmeriFlux sites. J. Geophys. Res. Biogeosciences 2015, 120, 887–902. [Google Scholar] [CrossRef]
  176. Zhou, S.; Yu, B.; Huang, Y.; Wang, G. The effect of vapor pressure deficit on water use efficiency at the subdaily time scale. Geophys. Res. Lett. 2014, 41, 5005–5013. [Google Scholar] [CrossRef]
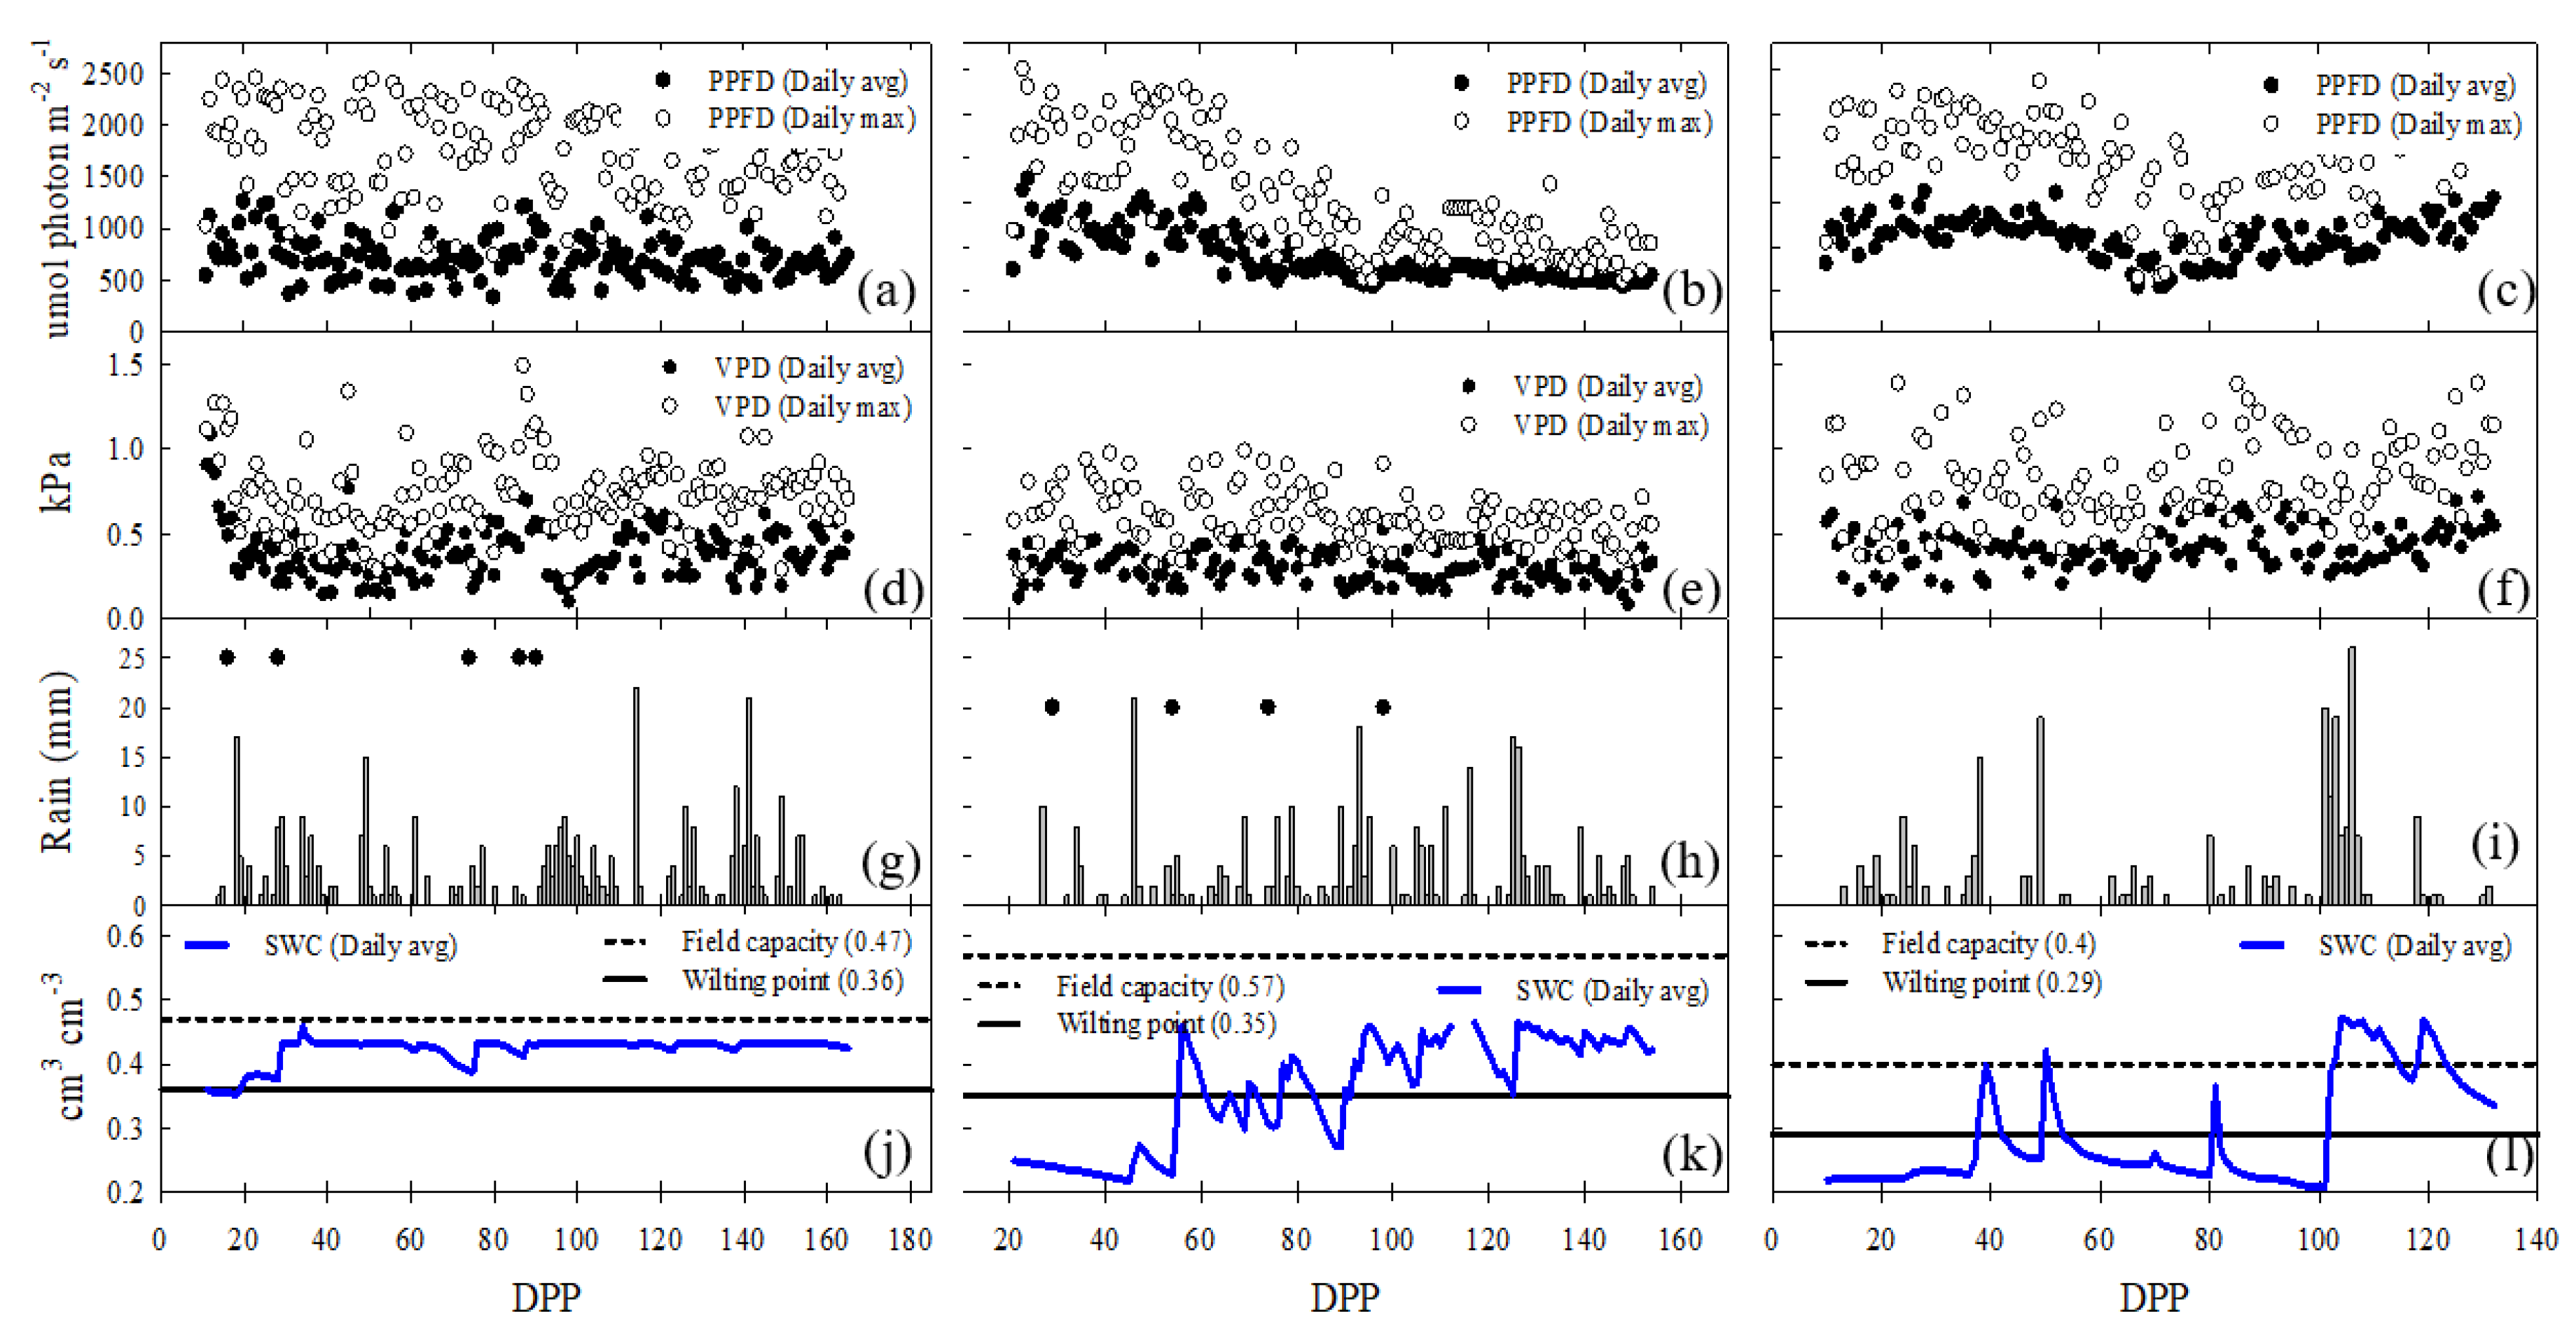
Figure 1. Meteorological measurements for potato crop systems grown under different water management regimes [(a,d,g,j) full irrigation (FI); (b,e,h,k) deficit irrigation (DI); (c,f,i,l) rainfed conditions (RF)]. (a,b,c) photosynthetic active radiation, µmol photons m−2 s−1 (PPFD); (d,e,f) air vapor pressure deficit, kPa (VPD); (g,h,i) rainfall and irrigation times (black dots), mm; (j,kl) soil water content, cm3 cm−3 (SWC), measured at 0–20 cm depth is shown as daily mean values.
Preprints 67538 g001
Figure 2. Daily gross primary productivity (GPP), Ecosystem respiration (Reco), and net carbon ecosystem exchange (NEE) during different potato growth stages (vegetative, tuberization, tuber bulking) in three different water regimes (a) full irrigation (FI), (b) deficit irrigation (DI), and (c) Rainfed (RF) conditions.
Preprints 67538 g002
Figure 3. Cumulative gross primary productivity (GPP), Ecosystem respiration (Reco), and Net Carbon Ecosystem Exchange (NEE) during different potato growth stages (vegetative, tuberization, tuber bulking) in three different water regimes (a) full irrigation (FI), (b) deficit irrigation (DI), and (c) Rainfed (RF). Values inside figures correspond to NEE reached at the end of cycle (165 DPP, 152 DPP and 132 DPP for FI, DI and RF, respectively).
Preprints 67538 g003
Figure 4. Daily latent heat partitioning (LE/Rn), GPP/Reco ratio, leaf area index (LAI) and specific leaf area, during different potato growth stages (vegetative, tuberization, tuber bulking) in three different water regimes (a) full irrigation (FI), (b) deficit irrigation (DI), and (c) Rainfed (RF) conditions. Dotted perpendicular line indicates maximum LAI.
Preprints 67538 g004
Figure 5. Daily crop evapotranspiration (ETc) and canopy (Rc) and aerodynamic (Ra) resistances, during different potato growth stages (vegetative, tuberization, tuber bulking) in three different water regimes (a) full irrigation (FI), (b) deficit irrigation (DI), and (c) Rainfed (RF) conditions.
Preprints 67538 g005
Figure 6. Diurnal half-hourly ET, GPP, VPD, NEE, Ra and Rc, during different potato growth stages (vegetative, tuberization, tuber bulking) in three different water regimes (a,b,c) full irrigation (FI), (d,e,f) deficit irrigation (DI), and (g,h,i) Rainfed (RF) conditions. The diurnal cycle begins at 4:00 h and ends at 20:00 h.
Preprints 67538 g006
Figure 7. Normalized diurnal variations in half-hourly PPFD, ET, GPP, VPD, GPP*VPD, IWUE during three different potato growth stages (vegetative, tuberization, tuber bulking) in three different water regimes (a,b,c) full irrigation (FI), (d,e,f) deficit irrigation (DI), and (g,h,i) Rainfed (RF) conditions. The diurnal cycle begins at 5:00 h and ends at 19:00 h. Environmental controls on NEE, GPP, ET, and IWUE-NEE relations.
Preprints 67538 g007
Figure 8. Relationship between GPP*VPD and PPFD, GPP*VPD and VPD, ET and PPFD, ET and VPD, and NEE and IWUE on a diurnal half-hourly basis, during different potato growth stages (vegetative, tuberization, tuber bulking) in three water regimes [full irrigation (FI) deficit irrigation (DI) rainfed conditions (RF)]. Also shown is the correlation coefficient and determination coefficient, and the linear fit between these variables. The p values of all regressions are below the 0.1% significance level.
Preprints 67538 g008
Figure 9. Overall half-hourly relationship between GPP and ET, GPP*VPD and ET, NEE and IWUE, PPFD, ET and VPD in three potato water regimes cropping systems [full irrigation (FI) deficit irrigation (DI) rainfed conditions (RF)]. Also shown is the correlation coefficient, determination coefficient, linear GPP*VPD and ET, and logarithmic functions. The p values of all regressions are below the 0.1% significance level.
Preprints 67538 g009
Figure 10. Daily correlation coefficients (r) between GPP*VPD and E, omega coefficient, and IWUE during different potato growth stages (vegetative, tuberization, tuber bulking) in three different water regimes (a) full irrigation (FI), (b) deficit irrigation (DI), and (c) Rainfed (RF) conditions.
Preprints 67538 g010
Disclaimer/Publisher’s Note: The statements, opinions and data contained in all publications are solely those of the individual author(s) and contributor(s) and not of MDPI and/or the editor(s). MDPI and/or the editor(s) disclaim responsibility for any injury to people or property resulting from any ideas, methods, instructions or products referred to in the content.
Copyright: This open access article is published under a Creative Commons CC BY 4.0 license, which permit the free download, distribution, and reuse, provided that the author and preprint are cited in any reuse.
Prerpints.org logo

Preprints.org is a free preprint server supported by MDPI in Basel, Switzerland.

Subscribe

© 2024 MDPI (Basel, Switzerland) unless otherwise stated