1. Introduction
The cell stress response is an intrinsic system to all cells responding and adapting to environmental stimulations. One of the representative stress response systems is the heat shock factor (HSF)–heat shock protein (HSP) program that maintains proteostasis in cells [
1,
2,
3,
4] and promotes cancer progression [
5,
6,
7]. The HSF-HSP system was originally found to be activated in response to heat shock stress (HSS) while subsequently shown to be induced by oxidative stress, heavy metals, toxins and bacterial infections [
1]. Such proteotoxic stresses cause protein misfolding and thus activate the HSF-HSP system. The HSF-HSP system is often activated in cancer [
8,
9,
10].
Heat shock protein 90 (HSP90) is a stress-inducible protein chaperone that assists protein folding and re-folding to give the clients functionality in the intracellular space. As HSP90 has several hundred protein substrates (called ‘clients’), it is involved in many cellular processes beyond protein folding, which include DNA repair, development, the immune response and neurodegeneration [
11,
12,
13,
14,
15]. Elevated expression of HSP90 has been observed in many cancer types and correlates with poor prognosis, increased metastatic potential and resistance to therapy [
16,
17,
18,
19]. Moreover, the HSP90 alpha and beta isoforms are often released with extracellular vesicles (EV), including exosomes, by cancer cells and can thus trigger cancer initiation and progression, as well as the polarization of tumor-associated macrophages to an immunosuppressive M2 subtype [
6,
17,
20,
21,
22]. In addition, HSP90 is produced and released by immunocytes, such as macrophages, and plays a key role in antigen cross-presentation [
14,
15,
23,
24]. HSF1 is the master regulator of the protein quality control machinery in response to proteotoxic stress conditions [
2,
3,
25] and enhances cancer progression [
5,
7]. Upon proteotoxic stress, HSF1 binds to heat shock elements (HSEs) in the promoter regions of HSP genes and other stress-inducible genes [
2,
3,
25]. HSF1 drives oncogenesis in many ways beyond inducing the gene expression of chaperones [
7,
26,
27,
28], co-chaperones [
6], and non-chaperone target genes [
9]. However, less is known about how HSP90 genes are attenuated by alternative transcription factors.
The SCAN domain-containing transcription factors (SCAN-TF) contain the
SREZBP-
CTfin51-
AW1-
Number 18 cDNA (SCAN) domain, a leucine-rich oligomerization domain highly conserved among the SCAN-TF family (
Figure S1). This family contains more than 50 members, most of which contain a zinc finger (ZF) domain: hence SCAN-ZF factors [
29,
30,
31,
32,
33]. Myeloid zinc finger 1 (MZF1), also known as ZSCAN6 or ZNF42, is a prototypical SCAN-ZF that contains an N-terminal SCAN domain, a linker region, and a C-terminal DNA binding domain [
34,
35,
36]. Many studies have identified MZF1 as an oncogenic transcription factor [
34,
37,
38,
39,
40] and cancer stemness factor [
41,
42]. However, depending on the context, MZF1 can also function as a tumor suppressor [
43,
44,
45]. While there are more than 50 types of SCAN-TFs, six zinc-fingerless SCAN domain-only proteins also exist [
30,
31]. SCAND1 and SCAND2 (also known as SCAND2P) are SCAN domain-only proteins and can hetero-oligomerize with other SCAN-ZFs, including MZF1, through inter-SCAN domain interactions to repress transcription [
32,
33,
37,
43,
46]. Thus, hetero-oligomerization between SCAN domain-only molecules and SCAN-ZF molecules can transform their roles, forming a transcriptional repressor complex [
32,
33,
37,
43,
46]. Indeed, SCAND1 represses the co-chaperone
CDC37 gene (encoding cell division control 37) by interacting with MZF1 and suppressing prostate cancer progression [
37]. Moreover, SCAND1 and MZF1 are mutually inducible and form oligomers that can reverse epithelial-to-mesenchymal transition (EMT), tumor growth and migration by repressing EMT driver genes and mitogenic protein kinase (MAPK) genes [
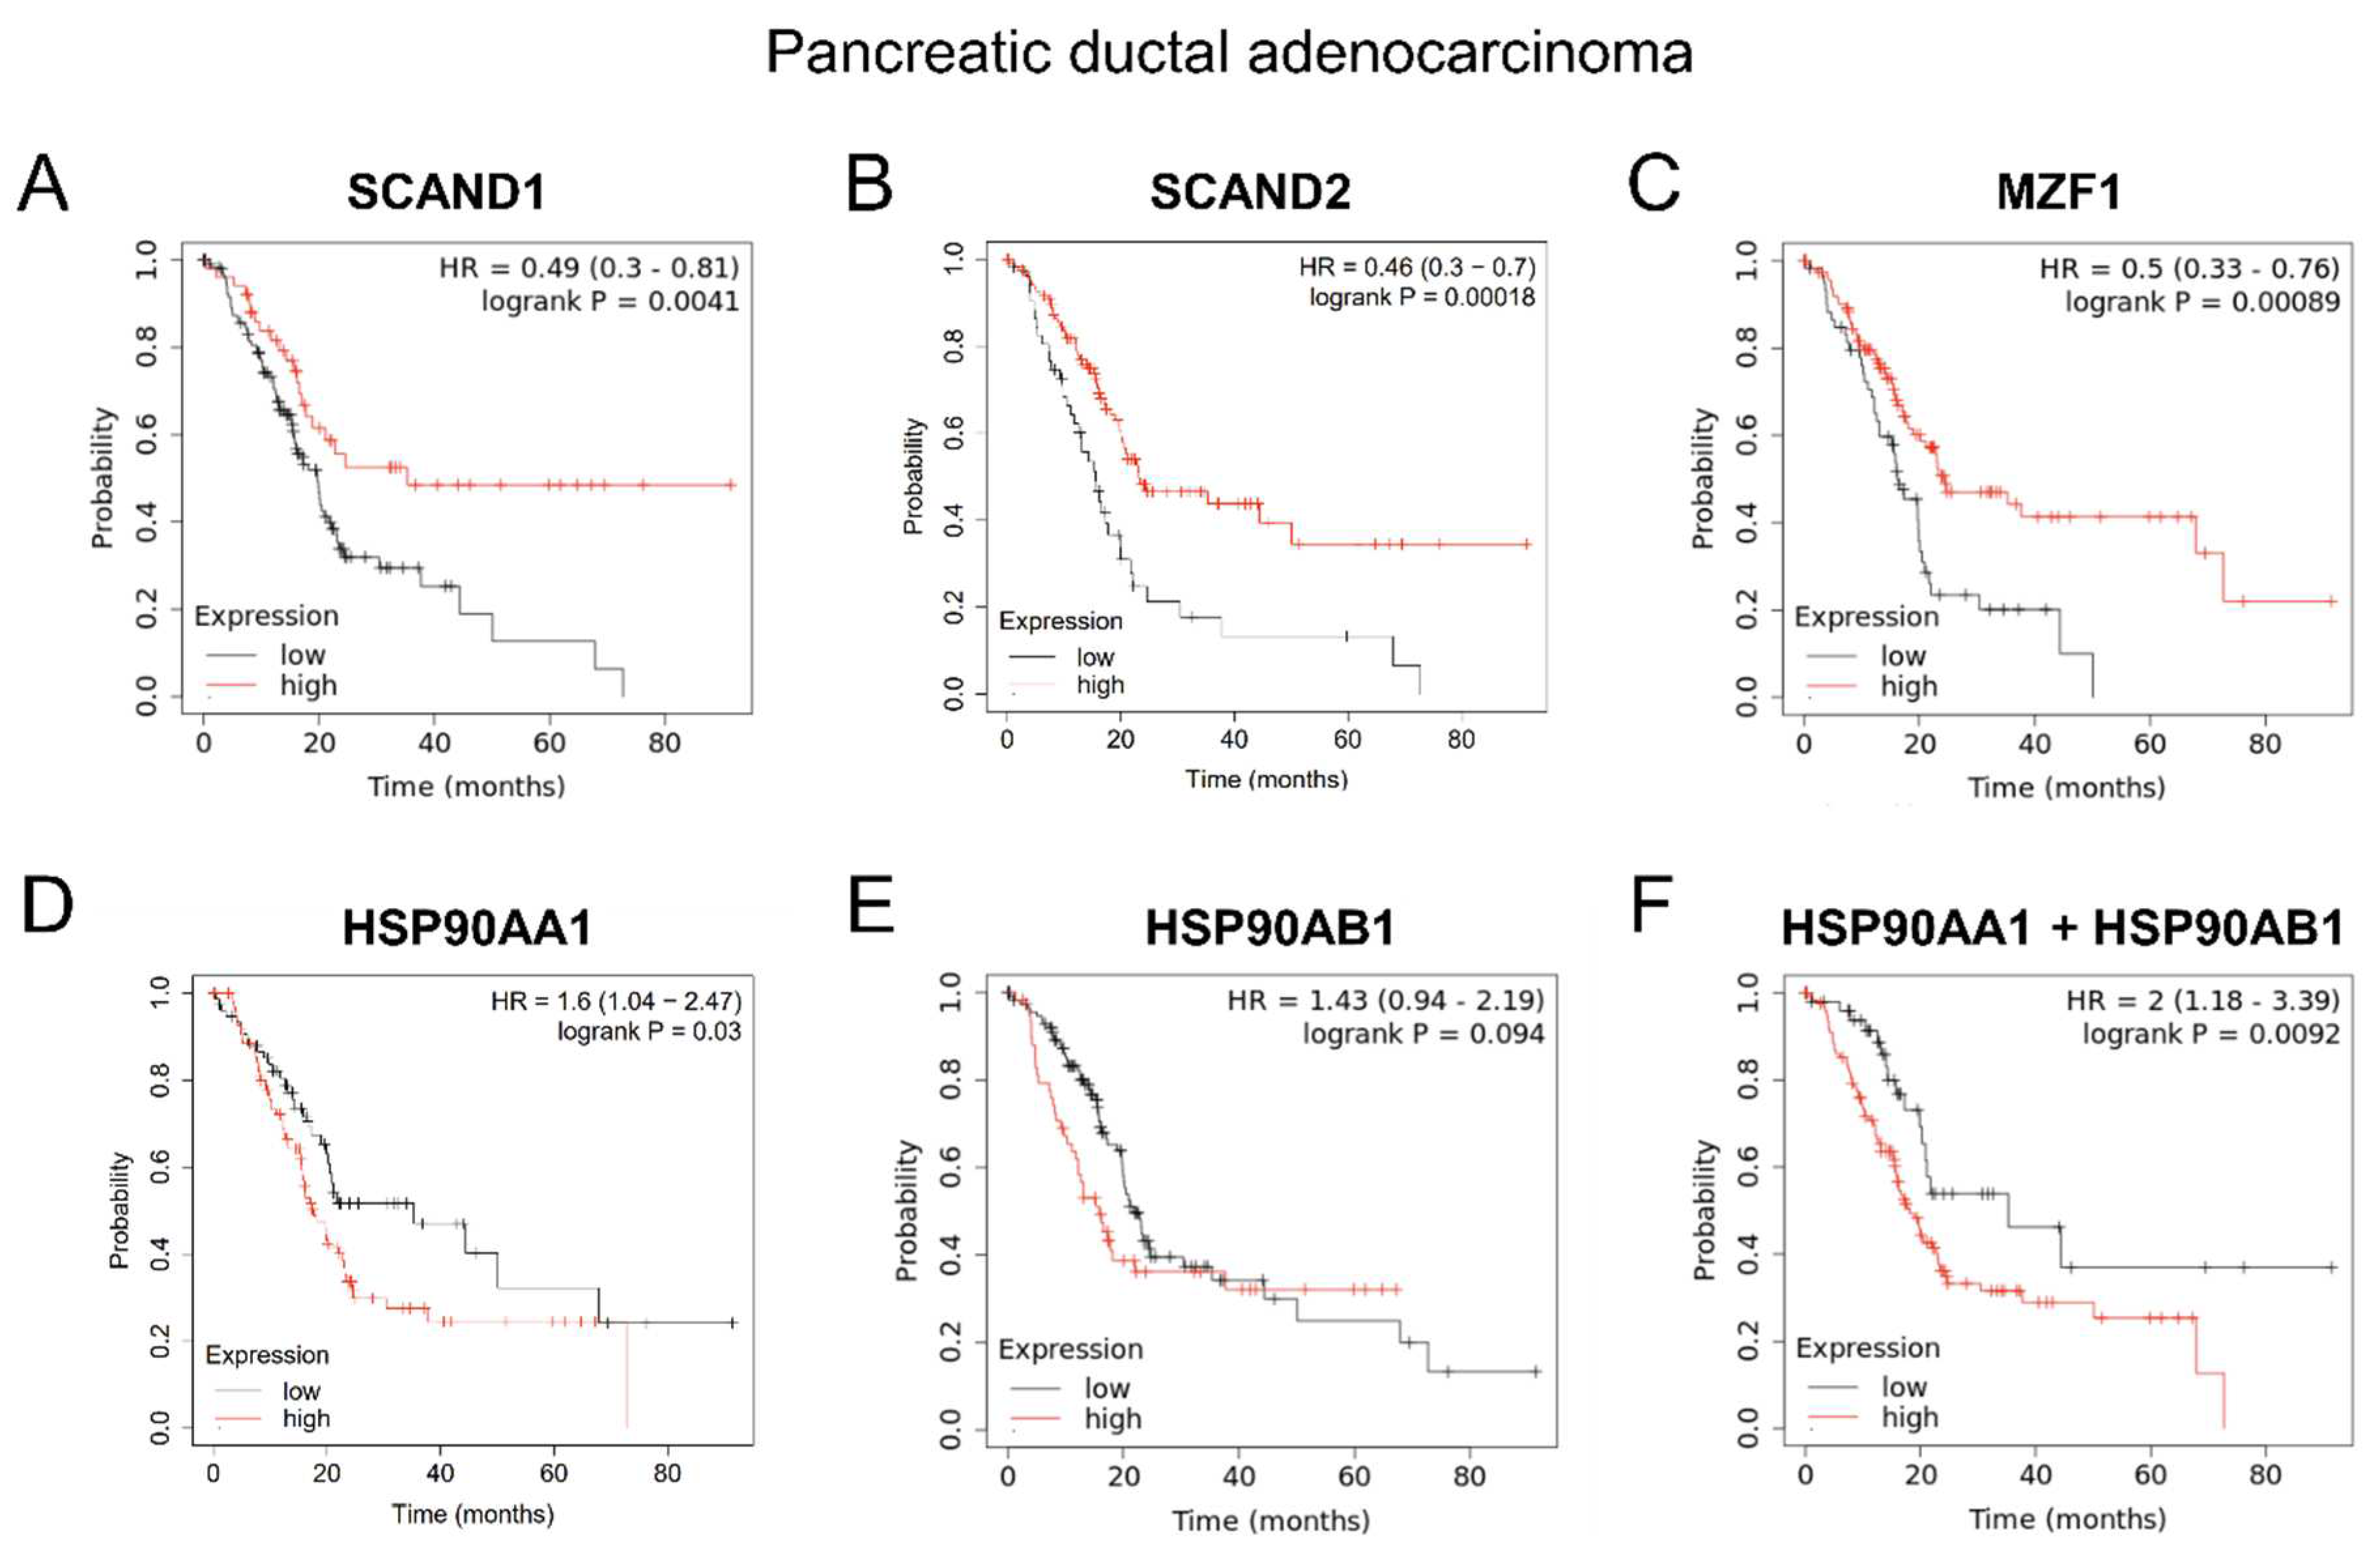
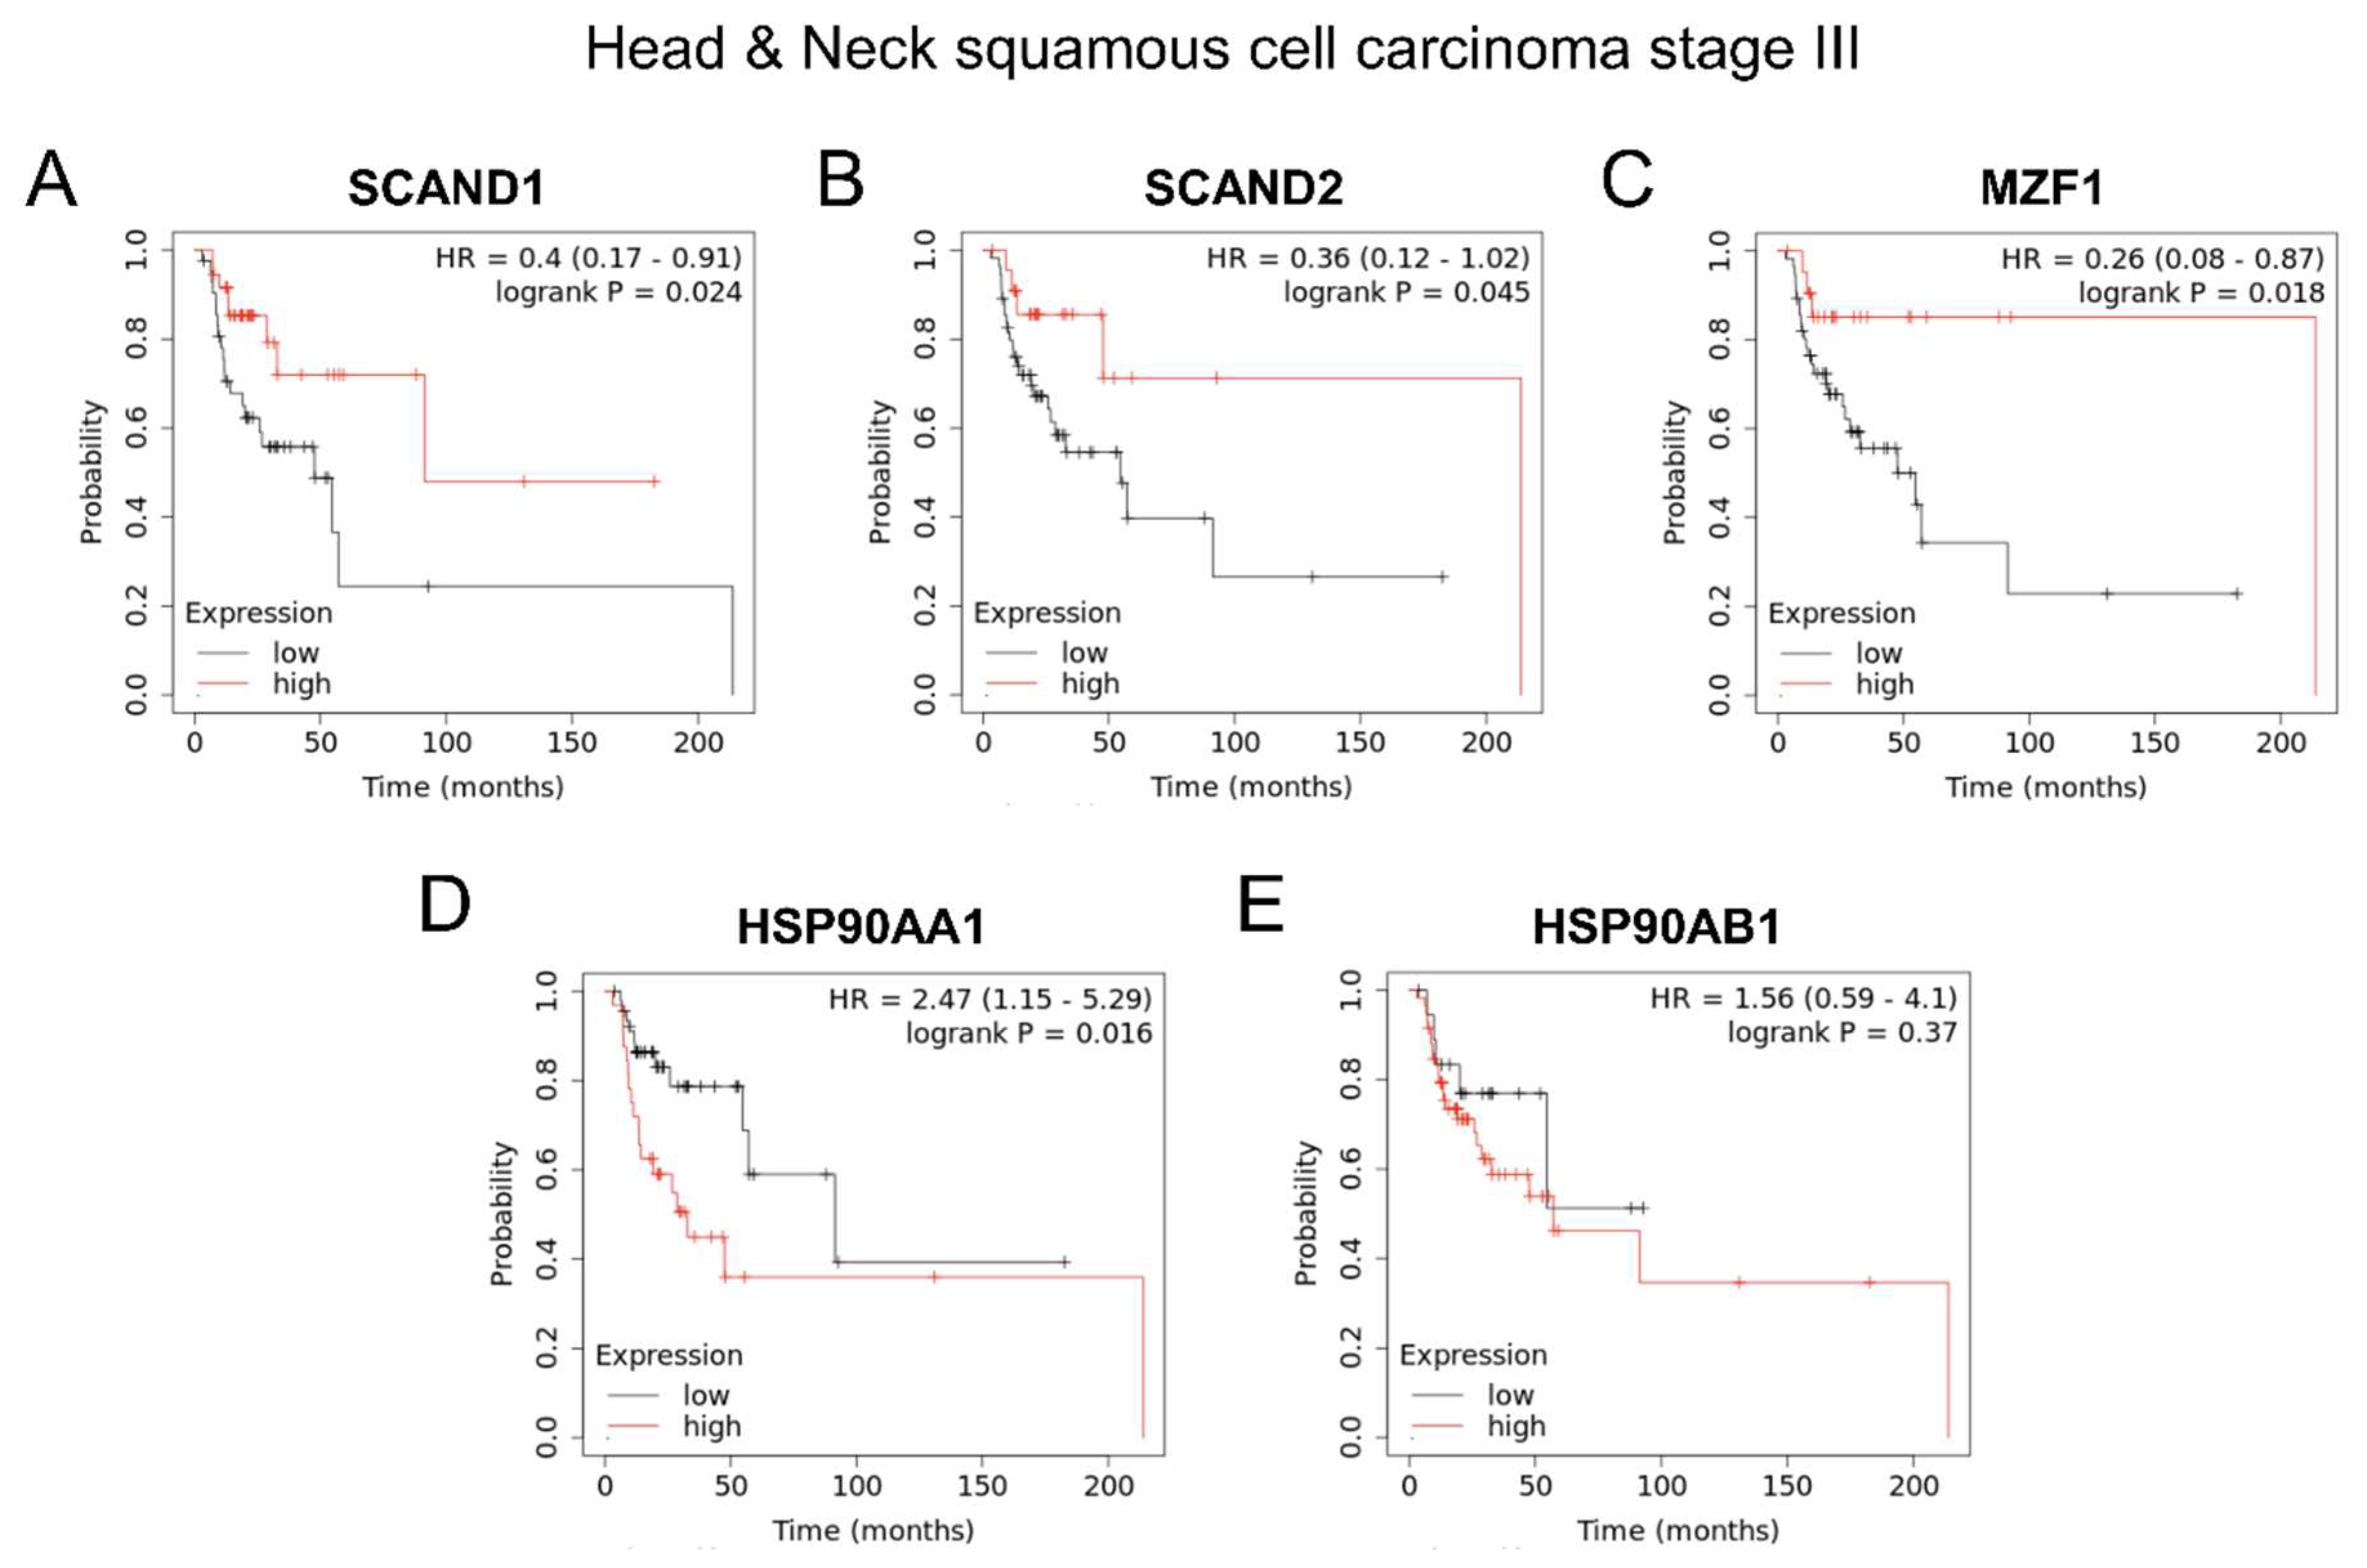
43]. High expression of MZF1 was correlated with poor prognoses in prostate cancer and kidney cancer, whereas SCAND1 and MZF1 expression correlate with better prognosis in pancreatic cancer and head and neck cancers stage III [
43]. These suggest that MZF1 alone is oncogenic, whereas repressing complexes of SCAND1 and MZF1 is tumor suppressor, depending on the gene expression in cancer cases.
However, it has been unclear whether the SCAND factors and MZF1 are involved in proteotoxic stress response in cancer. Here, we show that the SCANDs and MZF1 are stress-inducible factors and can attenuate HSP90 gene expression in prostate cancer cells. We also show that high expression levels of these SCAN-TFs can be predictive biomarkers of better prognoses in several cancer types, indicating potential tumor suppressor roles.
3. Discussion
We have shown that the cell stress-inducible SCAND1 and MZF1 genes repress the stress response of the HSF-HSP system (
Figure 1,
Figure 2,
Figure 3 and
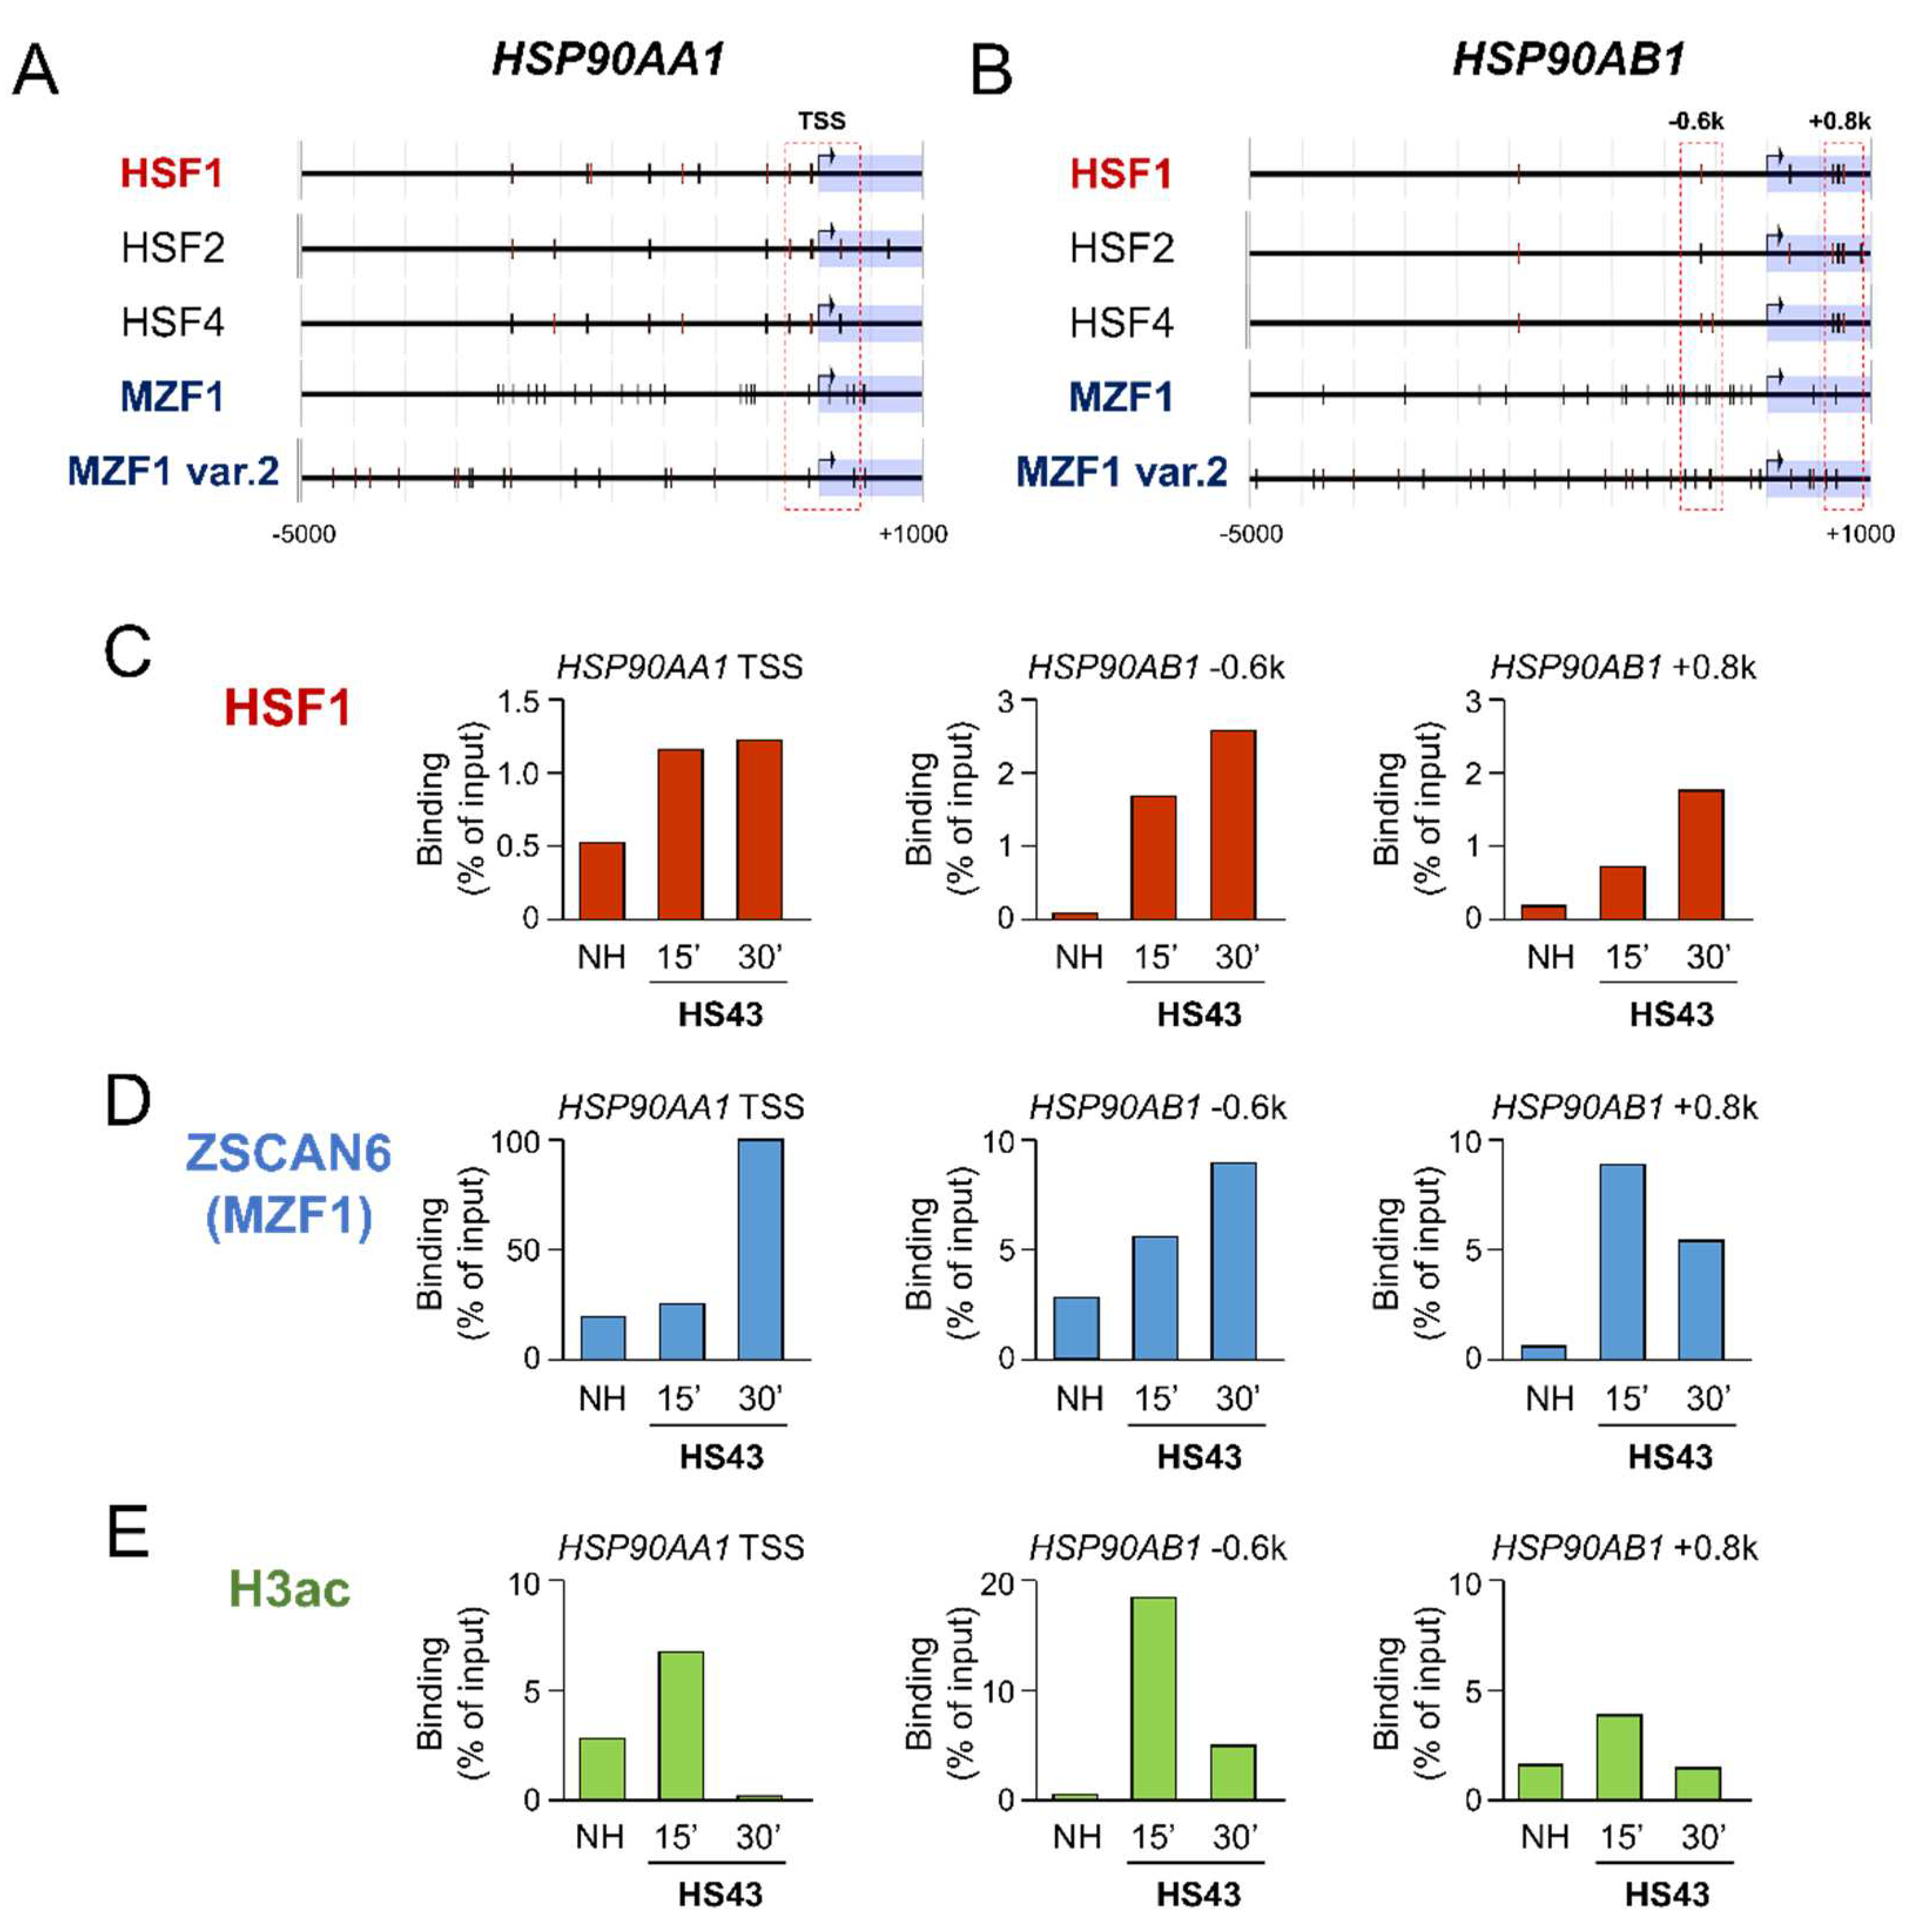
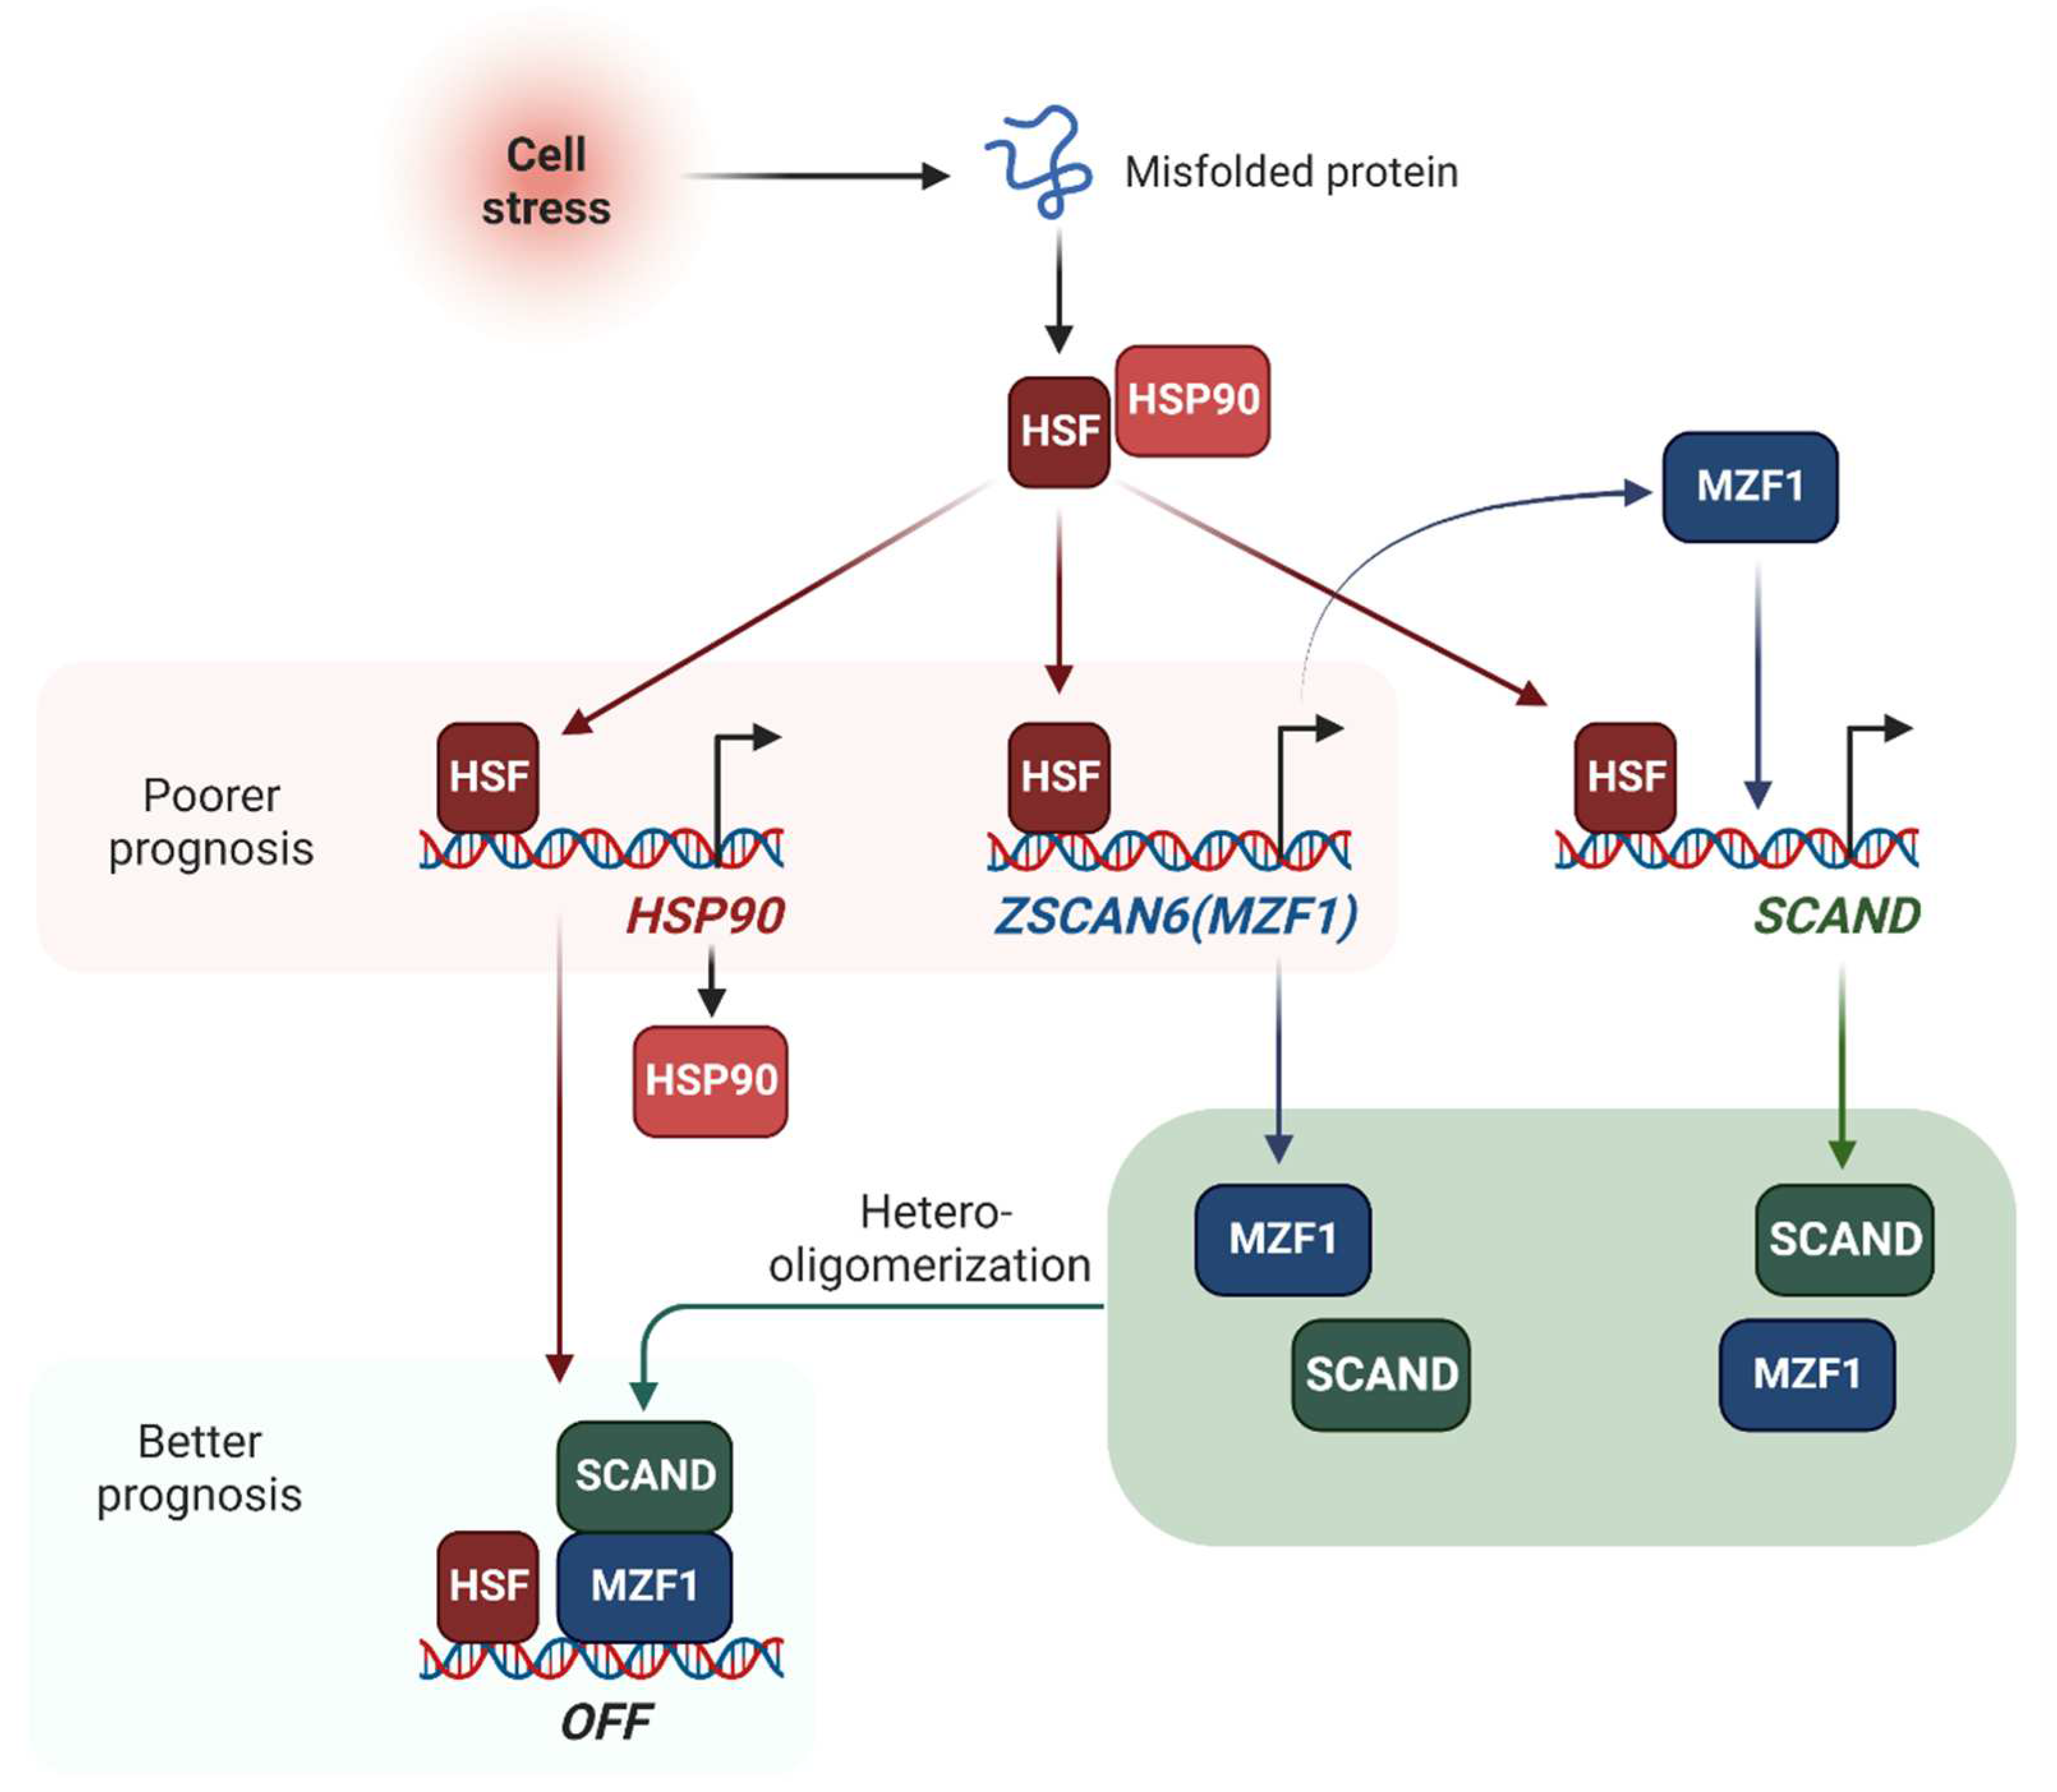
Figure 4). SCAND1 and MZF1/ZSCAN6 are heat-inducible and could form repressing complexes on HSP90 genes (
Figure 8) [
37,
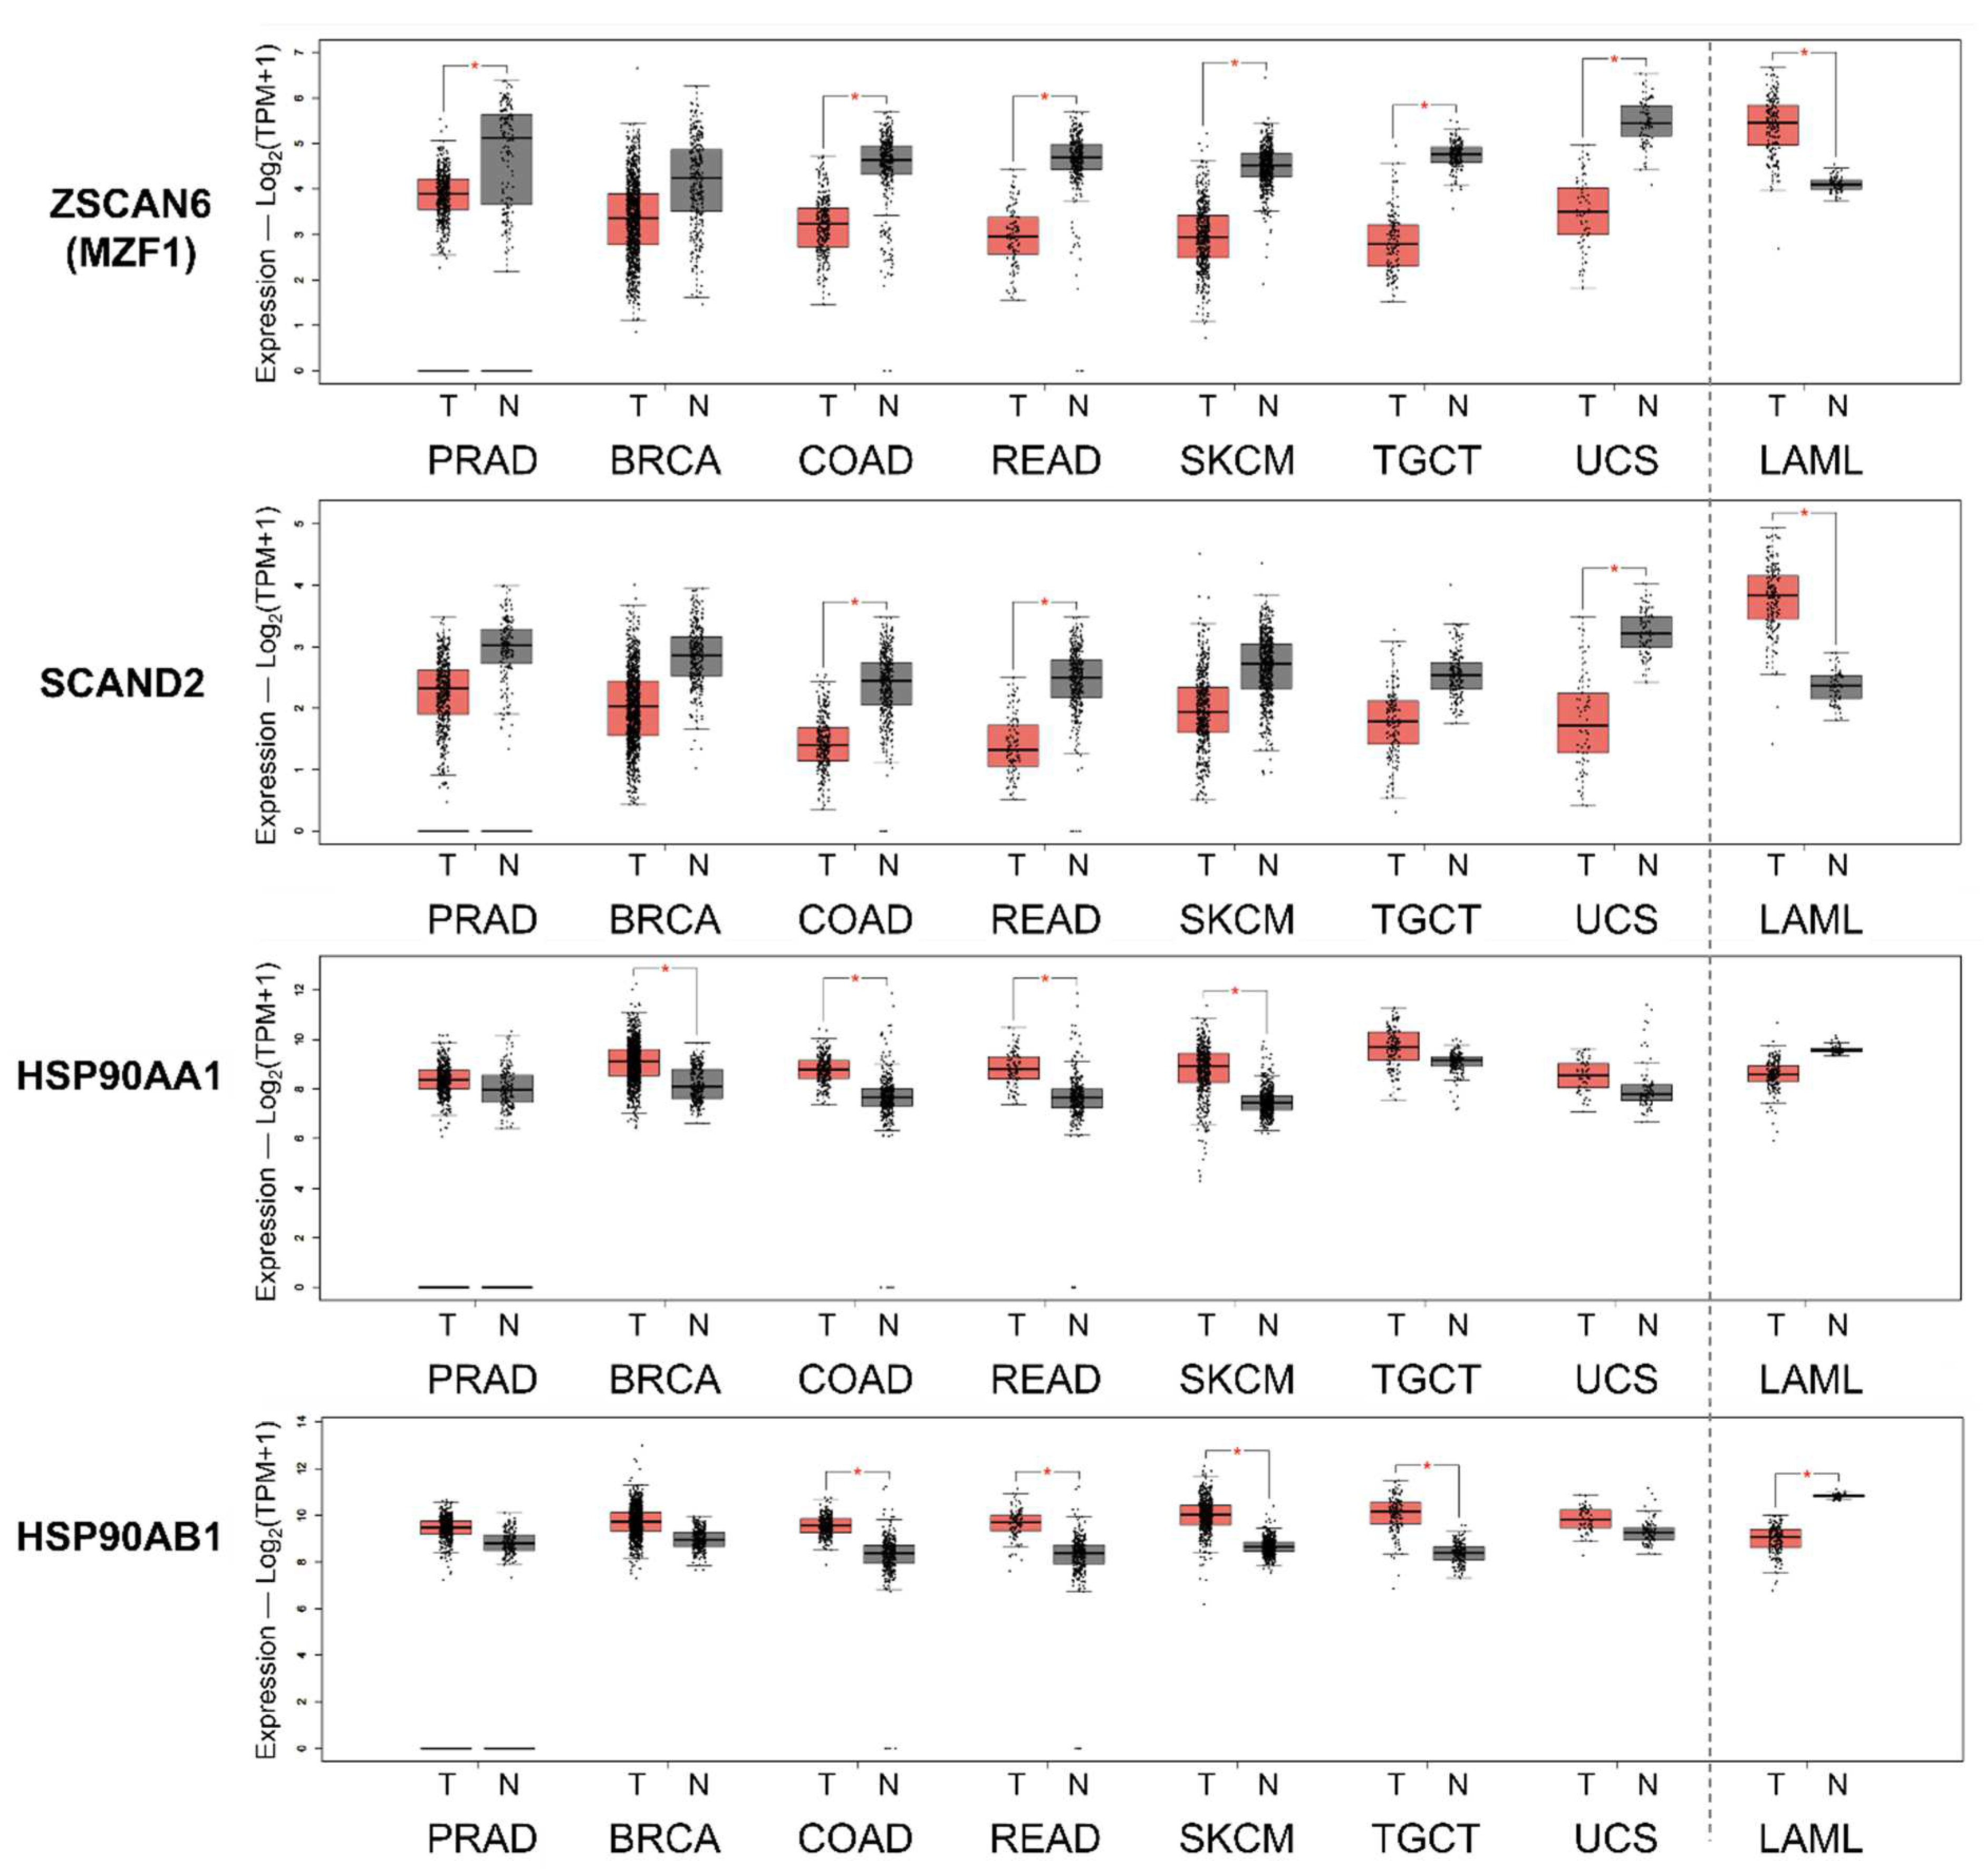
43]. These findings were consistent with the data from clinical tumor specimens. SCAND2 and MZF1 were expressed at higher levels in normal tissues than in paired tumor tissues (
Figure 5). In contrast, HSP90 was expressed at higher levels in tumor tissues than paired normal tissues in many cancer types (
Figure 5), suggesting that SCAND2/MZF1 hetero-oligomers could inhibit excess stress response of HSP90 expression in normal tissues, whereas loss of these SCAN-TF expressions could result in the gain of HSP90 in tumor tissues. We showed that high expressions of SCAN-TFs (SCAND1, SCAND2, and MZF1) were predictive biomarkers of enhanced prognoses for patients suffering from pancreatic cancer and head and neck cancers (
Figure 6 and
Figure 7). Moreover, high expression of SCAND2 was a predictive biomarker of enhanced prognoses for patients suffering from lung adenocarcinoma, sarcoma, and cervical cancer (
Table 7). These data indicate that SCAND/MZF1 repressing complexes are potentially tumor suppressing, contributing to better prognoses of patients suffering from several cancer types.
Our data, for the first time, indicate that SCAND2 is a novel biomarker of better prognoses in patients suffering from cancers (
Table 6). Only one group has previously reported the existence of the
SCAND2 gene [
47]. Moreover, SCAND2 has been registered as
SCAND2P, a pseudogene. However, gene expression data of SCAND2 (or SCAND2P) were found in many databases. Of note, the protein structure of SCAND2 found in Phosphosite plus is more conserved with the N-terminal region of MZF1(ZSCAN6) than SCAND1 (
Figure S1). Consistently, SCAND2 and MZF1 mRNA were each expressed in normal tissue at higher levels than tumor tissues (
Figure 5), whereas SCAND1 expression did not show this pattern. Therefore, SCAND2 may form stabler hetero-oligomers with MZF1(ZSCAN6) than SCAND1 to repress oncogenic gene expression in tumors. However, further functional analysis of SCAND2 is required for this novel gene.
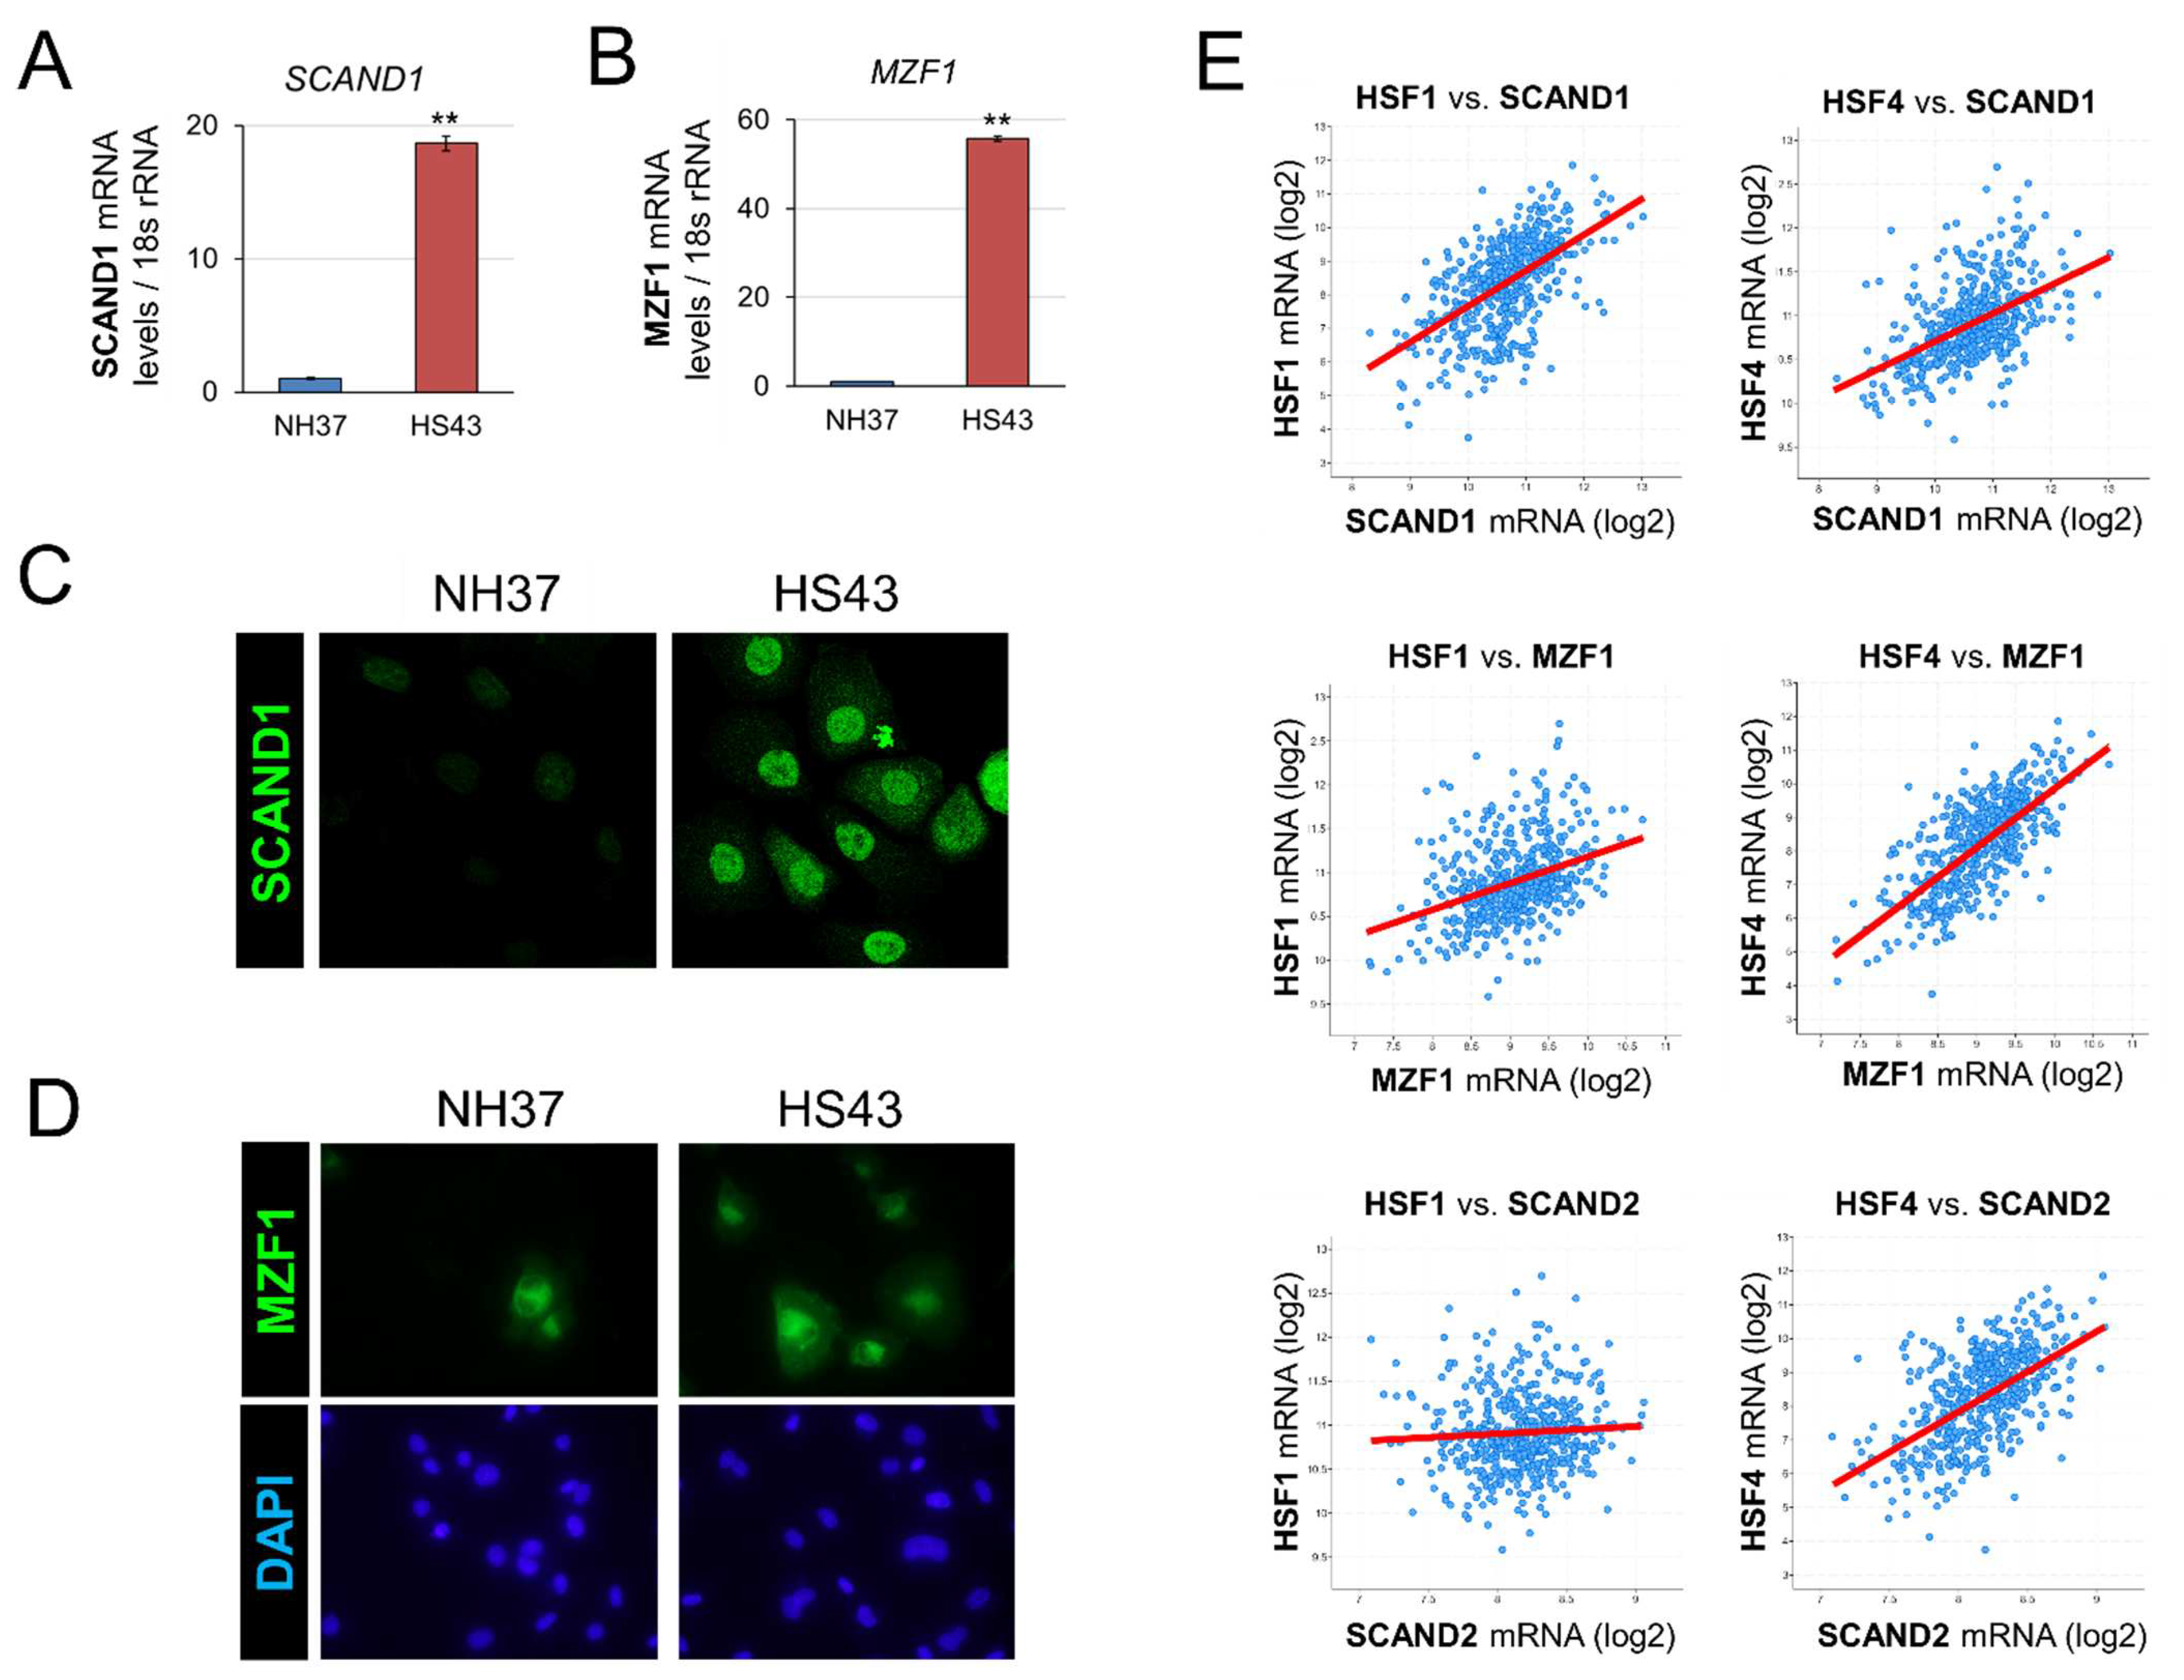
Our data also suggest that SCAND2 can be a novel potent tumor suppressor. SCAND1 and MZF1 expression were positively correlated with HSF1 expression, whereas SCAND2 expression was not correlated with HSF1 expression, suggesting that SCAND2 is not heat stress-inducible (
Figure 1). However, HSF4 expression was positively correlated with the expression of SCAND1, SCAND2 and MZF1, suggesting that HSF4 could induce these SCAN-TF gene expressions. HSF4 lacks a leucine zipper 4 (LZ4) domain, resulting in its constitutive trimerization and DNA-binding activity [
48]. Several HSF4-BSs were found in the promoter regions of SCAND1 and MZF1 genes (
Table 1). Thus, the expression of HSF4 could result in the constitutive expression of SCAND2, SCAND1, and MZF1 without cell stress. HSF4 is oncogenic in colorectal cancer, hepatocellular carcinoma, and lymphoma [
49,
50,
51]. However, HSF-dependent expression of SCAN-TFs may reduce oncogenic gene expression in tumors.
Our data also suggested that the stress-inducible SCAND-MZF1 complex represses the HSP90AA1 gene while repressing other HSPs and many more stress-responsive genes (
Table S1,
Table 6). We have recently shown SCAND1 and MZF1 expression to be negatively correlated with EMT driver genes, including ZEB1, CTNNB1 and TGFBR1/2/3, and mitogenic genes encoding kinases in the MEKK-MEK-ERK signaling pathway [
43]. Moreover, SCAN-only family genes and MZF1 expression were negatively correlated with the expression of NF-κB signaling molecules and PI3K-AKT signaling molecules (Data not shown). Thus, we have shown that EMT, some oncogenic signaling pathways and the HSF-HSP gene expression system are all key targets of the repression complex SCAND-MZF1.
Our data also suggested that tumors’ stress levels differed among clinical cases (
Figure 4 and
Figure 5). Tumor cells are characteristically exposed to various stresses from the microenvironment, such as immune/inflammatory stress [
19], therapeutics [
18], hypoxia [
22,
52,
53,
54,
55], acidification [
56,
57], hyperthermia [
58,
59] or heat stress [
4,
6,
19,
25,
28], endoplasmic reticulum stress [
60], nuclear envelope stress [
61,
62], replication stress [
63], oxidative stress [
64], mechanical stress, osmotic stress, genotoxic (DNA damage) [
65,
66] and proteotoxic stress [
1,
2,
4,
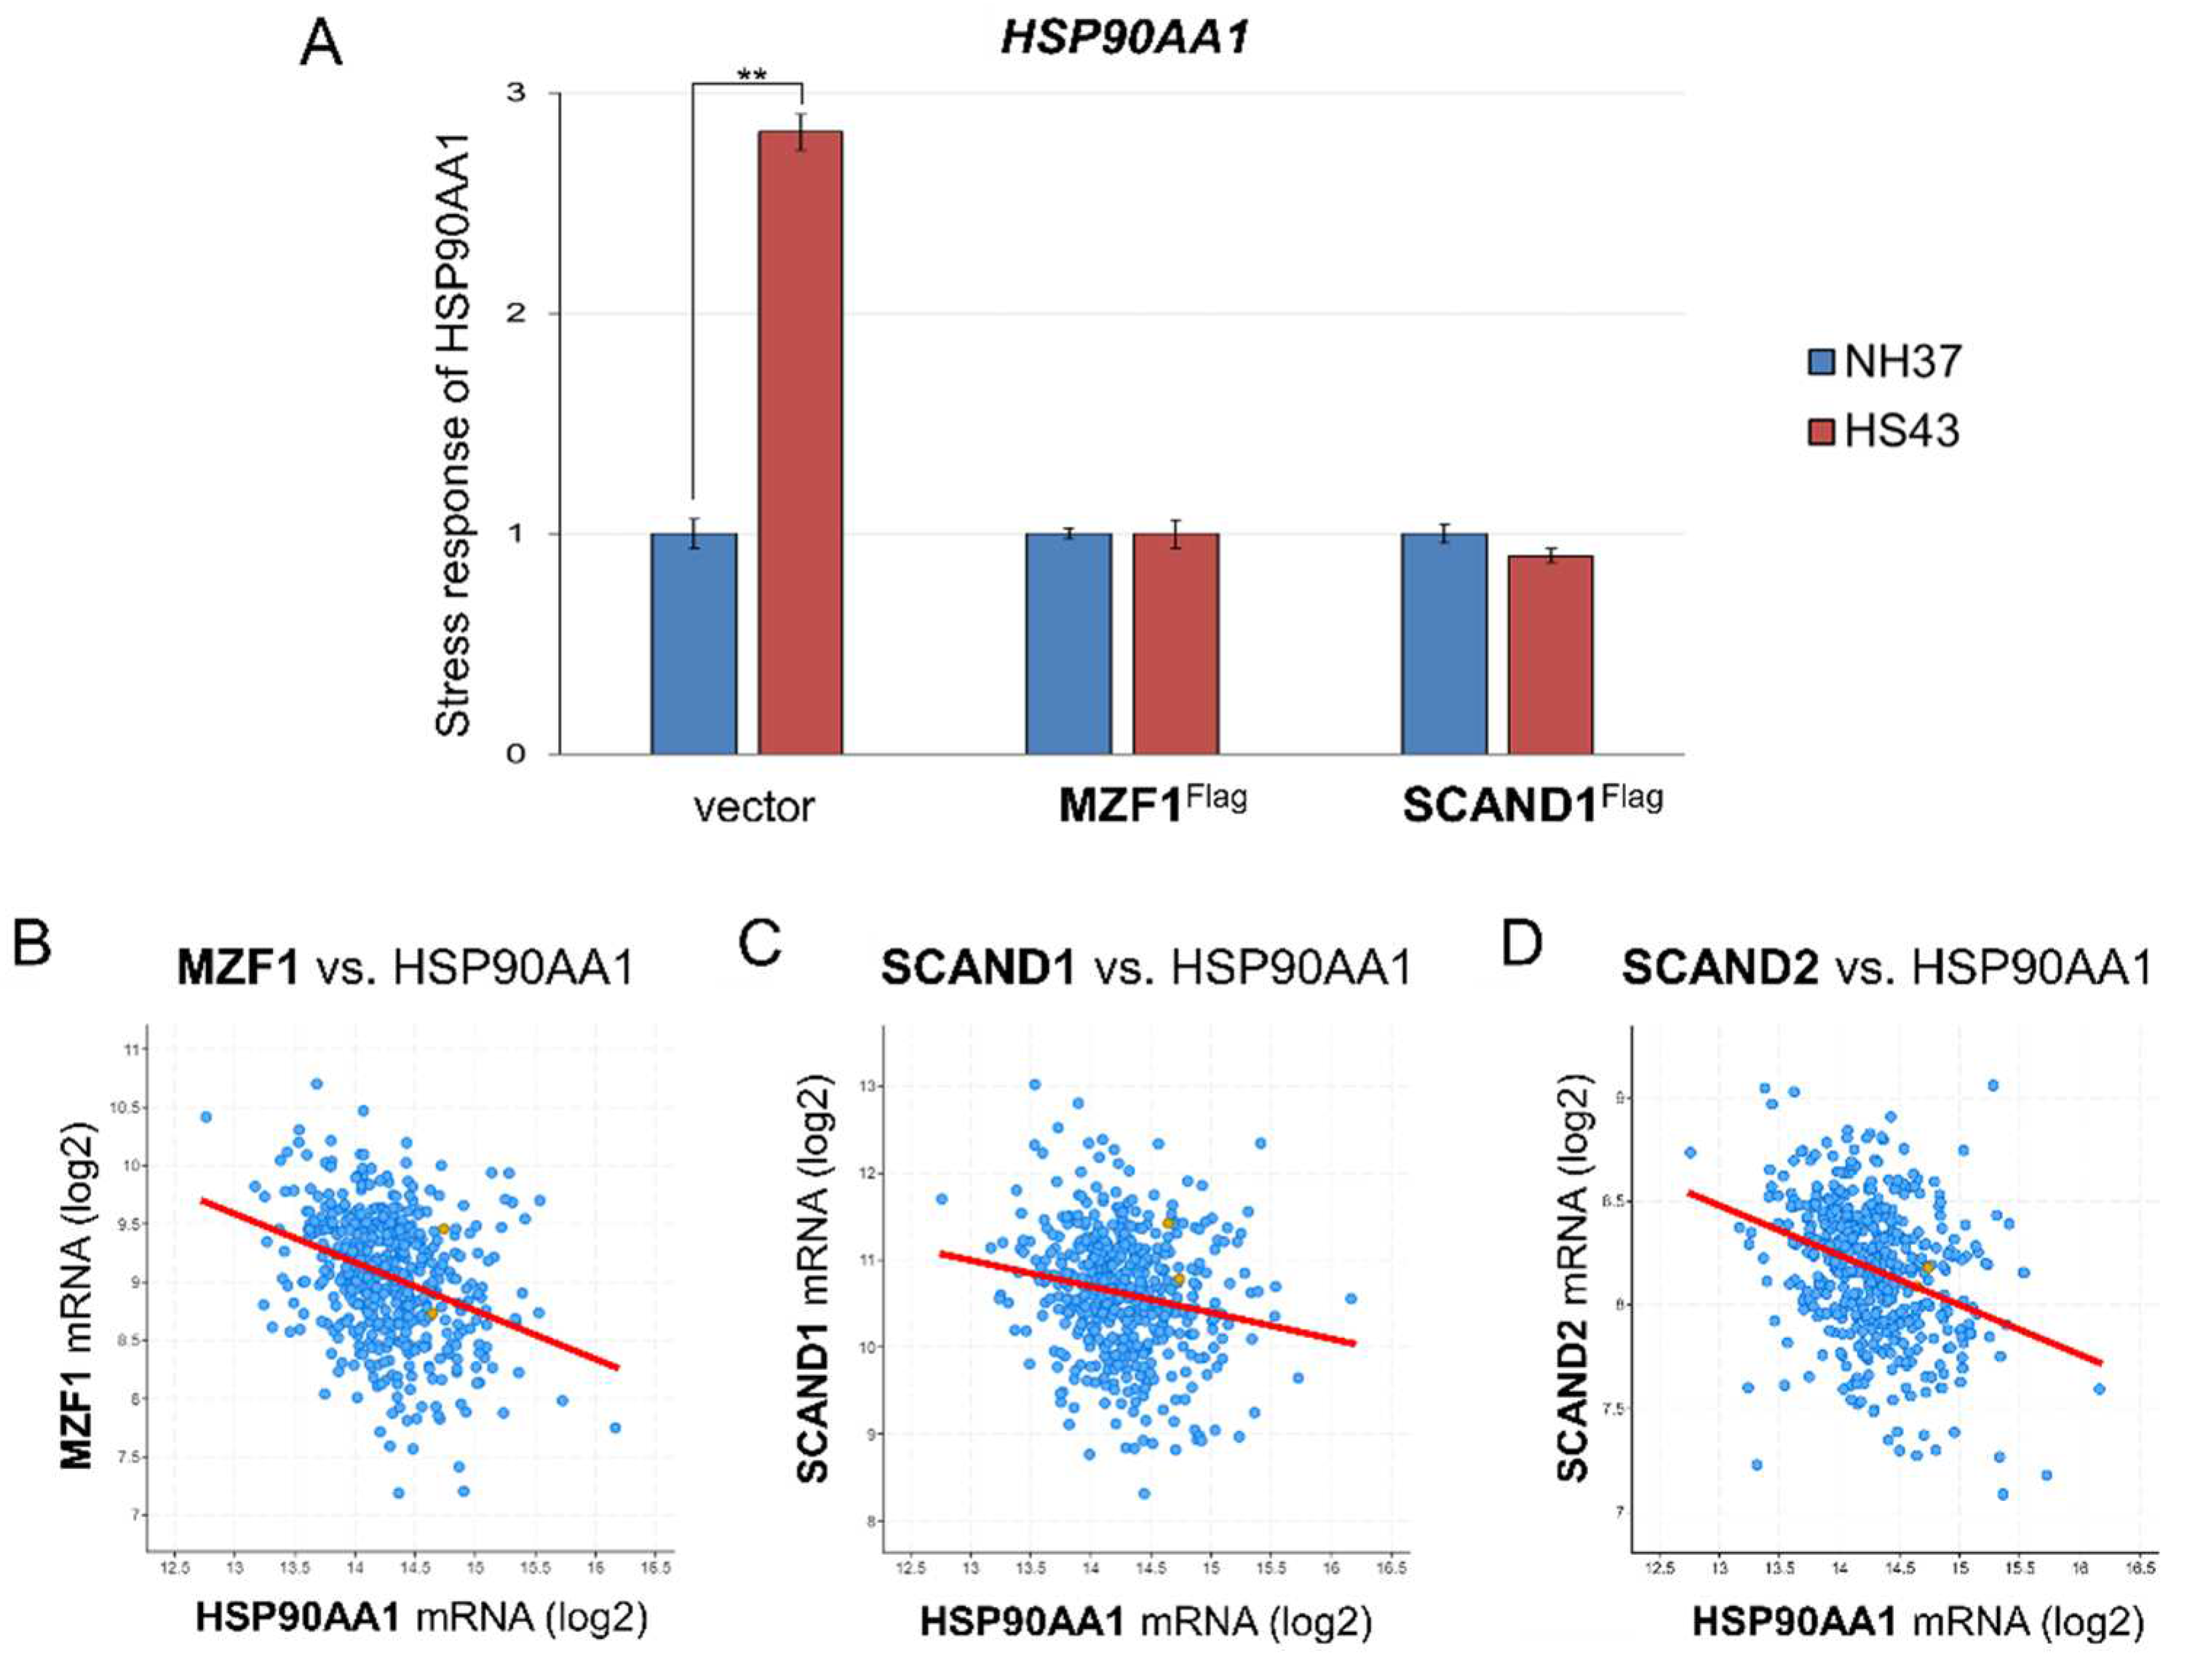
67]. Therefore, it might be difficult to determine the types and levels of stresses in each tumor. However, there were strong correlations between the expression of SCAN-TFs and HSP90AA1 in clinical tumor specimens (
Figure 4,
Figure 5,
Figure 6 and
Figure 7). These clinical data support that the SCAN-TFs complex represses excessive expression of HSP genes and suppresses tumors.
In conclusion, we have demonstrated that the cell stress-inducible SCAND and MZF1 repress the stress response in cancer. MZF1 and SCAND1 are mutually inducible and can form a repressive complex on the HSP90 gene promoters. Moreover, elevated levels of SCAND are novel potential markers of better prognoses in several cancer types, including pancreatic cancer, head and neck cancers, lung adenocarcinoma, sarcoma, and cervical cancer. This effect may ensue from the findings that the SCAND-MZF1 repressive system is important for preventing cancer-related gene expression physiologically while playing a key role in tumor suppression.
Figure 1.
Heat shock stress induces SCAND1 and MZF1(ZSCAN6) in prostate cancer cells. (A,B) qRT-PCR analysis of SCAND1 (A) and MZF1 (B) mRNA expression upon HSS in DU-145 cells. NH37, non-heated at 37 ℃. HS43, heat-shocked at 43℃ for 30 min. **p < 0.01, n = 3 (C,D) immunocytochemistry of SCAND1 (C) and MZF1 (D) expressed with or witout heat shock. (E) Co-expression correlation between HSF1 or HSF4 vs. SCAND1, SCAND2, or MZF1 in patients-derived prostate adenocarcinoma.
Figure 2.
Co-expression correlation between MZF1, SCAND1, and SCAND2 in prostate cancer. (A) SCAND1 vs. MZF1, (B) SCAND2 vs. MZF1, (C) SCAND1 vs. SCAND2 in prostate adenocarcinoma specimens derived from patients.
Figure 2.
Co-expression correlation between MZF1, SCAND1, and SCAND2 in prostate cancer. (A) SCAND1 vs. MZF1, (B) SCAND2 vs. MZF1, (C) SCAND1 vs. SCAND2 in prostate adenocarcinoma specimens derived from patients.
Figure 3.
Heat shock stress induces HSF1 and MZF1(ZSCAN6) binding to HSP90 genes. (A, B) Promoter regions (–5000 to +1000) of HSP90AA1 gene (A) and HSP90AB1 gene mapped with binding sites of HSFs and MZF1(ZSCAN6). Black vertical bars indicate binding sites. Hatched boxes indicate regions analyzed by ChIP-qPCR. (C–) ChIP-qPCR assay. PC-3 cells were treated with heat shock at 43℃ (HS43) for 15 or 30 min or non-heated (NH), and chromatin was fixed. ChIP was performed using antibodies against HSF1 (C), MZF1/ZSCAN6 (D) and acetylated histone H3 (H3ac) (E) for qPCR of HSP90 genes.
Figure 4.
MZF1 and SCAND1 blocked the heat shock response of the HSP90AA1 gene. (A) qRT-PCR for HSP90AA1 gene. Stable DU-145 cells transfected with pcDNA3.1 vector, pcDNA/MZF1-Flag and pCMV/SCAND1-Flag were treated with or without HSS for 30 min. **p<0.01, n=3. (B–E) Co-expression correlation between HSP90AA1 vs. MZF1(ZSCAN6) (B), SCAND1 (C) and SCAND2 (D) in prostate adenocarcinoma.
Figure 5.
Gene expression levels of ZSCAN6(MZF1), SCAND2, and HSP90 in various tumor types vs. paired normal tissues. Red box, tumor tissues (T). Gray box, normal tissues (N). Prostate adenocarcinoma (PRAD), breast invasive carcinoma (BRCA), colon adenocarcinoma (COAD), rectum adenocarcinoma (READ), skin cutaneous melanoma (SKCM), testicular germ cell tumors (TGCT), uterine carcinosarcoma (UCS), and acute myelo1id leukemia (LAML).
Figure 6.
Kaplan-Meier plots showing prognostic values of SCANDs, MZF1, and HSP90 gene expression in pancreatic cancer. SCANDs and MZF1 expression are correlated with better prognoses whereas HSP90 expression is correlated with poor prognosis of pancreatic DAC.
Figure 6.
Kaplan-Meier plots showing prognostic values of SCANDs, MZF1, and HSP90 gene expression in pancreatic cancer. SCANDs and MZF1 expression are correlated with better prognoses whereas HSP90 expression is correlated with poor prognosis of pancreatic DAC.
Figure 7.
Kaplan-Meier plots showing prognostic values of SCANDs, MZF1, and HSP90 gene expression in head and neck cancers. SCANDs and MZF1 expression are correlated with better prognosis, whereas HSP90 expression is correlated with poor prognosis of head and neck SCC.
Figure 7.
Kaplan-Meier plots showing prognostic values of SCANDs, MZF1, and HSP90 gene expression in head and neck cancers. SCANDs and MZF1 expression are correlated with better prognosis, whereas HSP90 expression is correlated with poor prognosis of head and neck SCC.
Figure 8.
Stress-inducible SCAN transcription factors SCAND and MZF1 repress HSP90 gene expression. Cell stress activates HSF1 leading to binding to HSEs in the promoter regions of HSP90 genes (HSP90AA1 and HSP90AB1), ZSCAN6(MZF1) gene and SCAND genes (SCAND1 and SCAND2). MZF1 induces SCAND1 expression. Hetero-oligomers of MZF1 and SCAND bind to and repress HSP90 genes.
Table 1.
The numbers of binding sites for HSF1, HSF4 and MZF1 in the promoter regions of SCAND1 and MZF1 genes.
Table 1.
The numbers of binding sites for HSF1, HSF4 and MZF1 in the promoter regions of SCAND1 and MZF1 genes.
| Gene promoter 1
|
HSF1-BS |
HSF4-BS |
MZF1-BS |
MZF1-BS var.2 |
| SCAND1 |
7 |
9 |
5 |
15 |
| MZF1 |
4 |
4 |
27 |
30 |
Table 2.
Co-expression correlation between HSFs, MZF1 and SCANDs in prostate adenocarcinomas.
Table 2.
Co-expression correlation between HSFs, MZF1 and SCANDs in prostate adenocarcinomas.
| Gene |
Correlated Gene |
Spearman’s Correlation 1
|
p-Value |
q-Value |
| HSF1 vs. |
MZF1 |
0.375 |
9.52E-18 |
7.37E-17 |
| HSF1 vs. |
SCAND1 |
0.518 |
6.73E-35 |
2.92E-33 |
| HSF1 vs. |
SCAND2 |
0.0925 |
0.0412 |
0.0642 |
| HSF4 vs. |
MZF1 |
0.705 |
1.97E-74 |
3.03E-72 |
| HSF4 vs. |
SCAND1 |
0.585 |
3.99E-46 |
1.86E-44 |
| HSF4 vs. |
SCAND2 |
0.55 |
5.55E-40 |
1.89E-38 |
Table 3.
Co-expression correlation between HSFs, MZF1 and SCANDs in prostate adenocarcinomas.
Table 3.
Co-expression correlation between HSFs, MZF1 and SCANDs in prostate adenocarcinomas.
| Gene |
Correlated Gene |
Spearman’s Correlation 1
|
p-Value |
q-Value |
| MZF1 vs. |
SCAND1 |
0.548 |
1.27E-39 |
6.16E-38 |
| MZF1 vs. |
SCAND2 |
0.524 |
1.01E-35 |
3.95E-34 |
| SCAND1 vs. |
SCAND2 |
0.17 |
2.201E-4 |
4.160E-4 |
Table 4.
The numbers of binding sites for HSF1, HSF4 and MZF1 in the promoter regions of HSP90AA1 and HSP90AB1 genes.
Table 4.
The numbers of binding sites for HSF1, HSF4 and MZF1 in the promoter regions of HSP90AA1 and HSP90AB1 genes.
| Promoter |
HSF1-BS |
HSF4-BS |
MZF1-BS |
MZF1-BS var.2 |
| HSP90AA1 |
9 |
12 |
22 |
18 |
| HSP90AB1 |
8 |
8 |
22 |
28 |
Table 5.
The negative correlation of HSP90AA1 vs. MZF1, SCANDs and HSFs gene expression in prostate adenocarcinoma specimens.
Table 5.
The negative correlation of HSP90AA1 vs. MZF1, SCANDs and HSFs gene expression in prostate adenocarcinoma specimens.
| Gene |
Correlated Gene |
Spearman’s Correlation 1
|
p-Value |
q-Value |
| HSP90AA1 vs. |
MZF1 |
-0.321 |
3.63E-13 |
3.35E-11 |
| HSP90AA1 vs. |
SCAND2 |
-0.32 |
4.34E-13 |
3.88E-11 |
| HSP90AA1 vs. |
SCAND1 |
-0.188 |
2.86E-05 |
1.71E-04 |
| HSP90AA1 vs. |
HSF4 |
-0.241 |
6.97E-08 |
9.73E-07 |
| HSP90AA1 vs. |
HSF1 |
-0.045 |
3.21E-01 |
4.38E-01 |
| HSP90AA1 vs. |
HSF2 |
-0.0164 |
7.17E-01 |
7.94E-01 |
| HSP90AA1 vs. |
HSF5 |
-0.00297 |
0.948 |
0.963 |
Table 6.
The negative correlation of HSPs vs. MZF1, SCAND1, and SCAND2 gene expression in prostate adenocarcinoma specimens.
Table 6.
The negative correlation of HSPs vs. MZF1, SCAND1, and SCAND2 gene expression in prostate adenocarcinoma specimens.
| |
vs. MZF1 |
vs. SCAND1 |
vs. SCAND2 |
| Correlated Gene |
Spearman’s Correlation1 |
p-Value2 |
Spearman’s Correlation |
p-Value |
Spearman’s Correlation |
p-Value |
| HSPA13 |
-0.448 |
1.75E-25 |
-0.572 |
7.79E-44 |
-0.357 |
4.18E-16 |
| HSPA4 |
-0.358 |
3.41E-16 |
-0.303 |
7.97E-12 |
-0.394 |
1.52E-19 |
| HSPA4L |
-0.326 |
1.58E-13 |
-0.411 |
2.66E-21 |
-0.0341 |
0.452 |
| HSP90AA1 |
-0.321 |
3.63E-13 |
-0.188 |
2.86E-05 |
-0.32 |
4.34E-13 |
| HSPH1 |
-0.300 |
1.42E-11 |
-0.191 |
2.20E-05 |
-0.312 |
1.67E-12 |
Table 7.
SCAND1, SCAND2 and MZF1 expression correlate with enhanced prognoses in cancer.
Table 7.
SCAND1, SCAND2 and MZF1 expression correlate with enhanced prognoses in cancer.
| Cancer type |
Log-rank P |
| SCAND2 |
SCAND1 |
MZF1 |
| Pancreatic cancer |
0.00018*** |
0.0041** |
0.0009** |
| Head & Neck SCC stage III |
0.045* |
0.024* |
0.018* |
| Lung adenocarcinoma |
0.00032*** |
0.32 |
0.21 |
| Sarcoma |
0.0096** |
0.11 |
0.14 |
| Cervical SCC |
0.015* |
0.34 |
0.21 |
Table 6.
Primer sequences for qRT-PCR.
Table 6.
Primer sequences for qRT-PCR.
| Primer name |
Sequences (5′ to 3′) |
| SCAND1 h F#1 |
CGC AGA GAA GCC AGA GAC TT |
| SCAND1 h R#10 |
TCA GCA CTG CGT CTG CAC C |
| MZF1 h F785 |
TGC AGG TGA AAG AGG AGT CA |
| MZF1 h R939 |
AGT CTT GCT GTG GGG AAA GA |
| HSP90AA1 h F1227 |
GAG CAG TAC GCT TGG GAG TC |
| HSP90AA1 h R1227 |
TCC ACG ACC CAT AGG TTC AC |
| 18s rRNA h F1245 |
GAC TCA ACA CGG GAA ACC TC |
| 18s rRNA h R1364 |
AGA CAA ATC GCT CCA CCA AC |
Table 7.
Primer sequences for ChIP-qPCR.
Table 7.
Primer sequences for ChIP-qPCR.
| Primer name |
Sequences (5′ to 3′) |
| HSP90AA1 h -100F |
GGCTGGGGAGGGTTCTTC |
| HSP90AA1 h +200R |
GAGGCCTCCGGAATAGAAAG |
| HSP90AB1 h -800F |
CCTGAGGATTGGGCTGGTA |
| HSP90AB1 h -430R |
CATCTGCCCTACACATCTCG |
| HSP90AB1 h +600F |
GTCTCCAGCACCCGATACTC |
| HSP90AB1 h +900R |
GAACAGGACCAAACCCAAGA |
