Submitted:
30 January 2023
Posted:
02 February 2023
You are already at the latest version
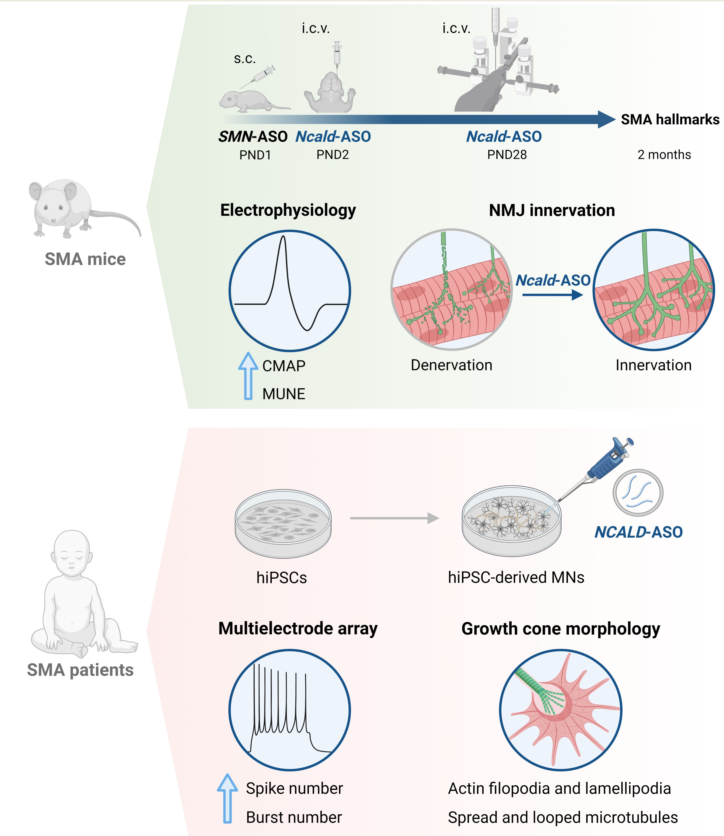
Abstract
Keywords:
1. Introduction
2. Results
2.1. Re-injection of Ncald-ASO significantly reduces NCALD in brain and spinal cord
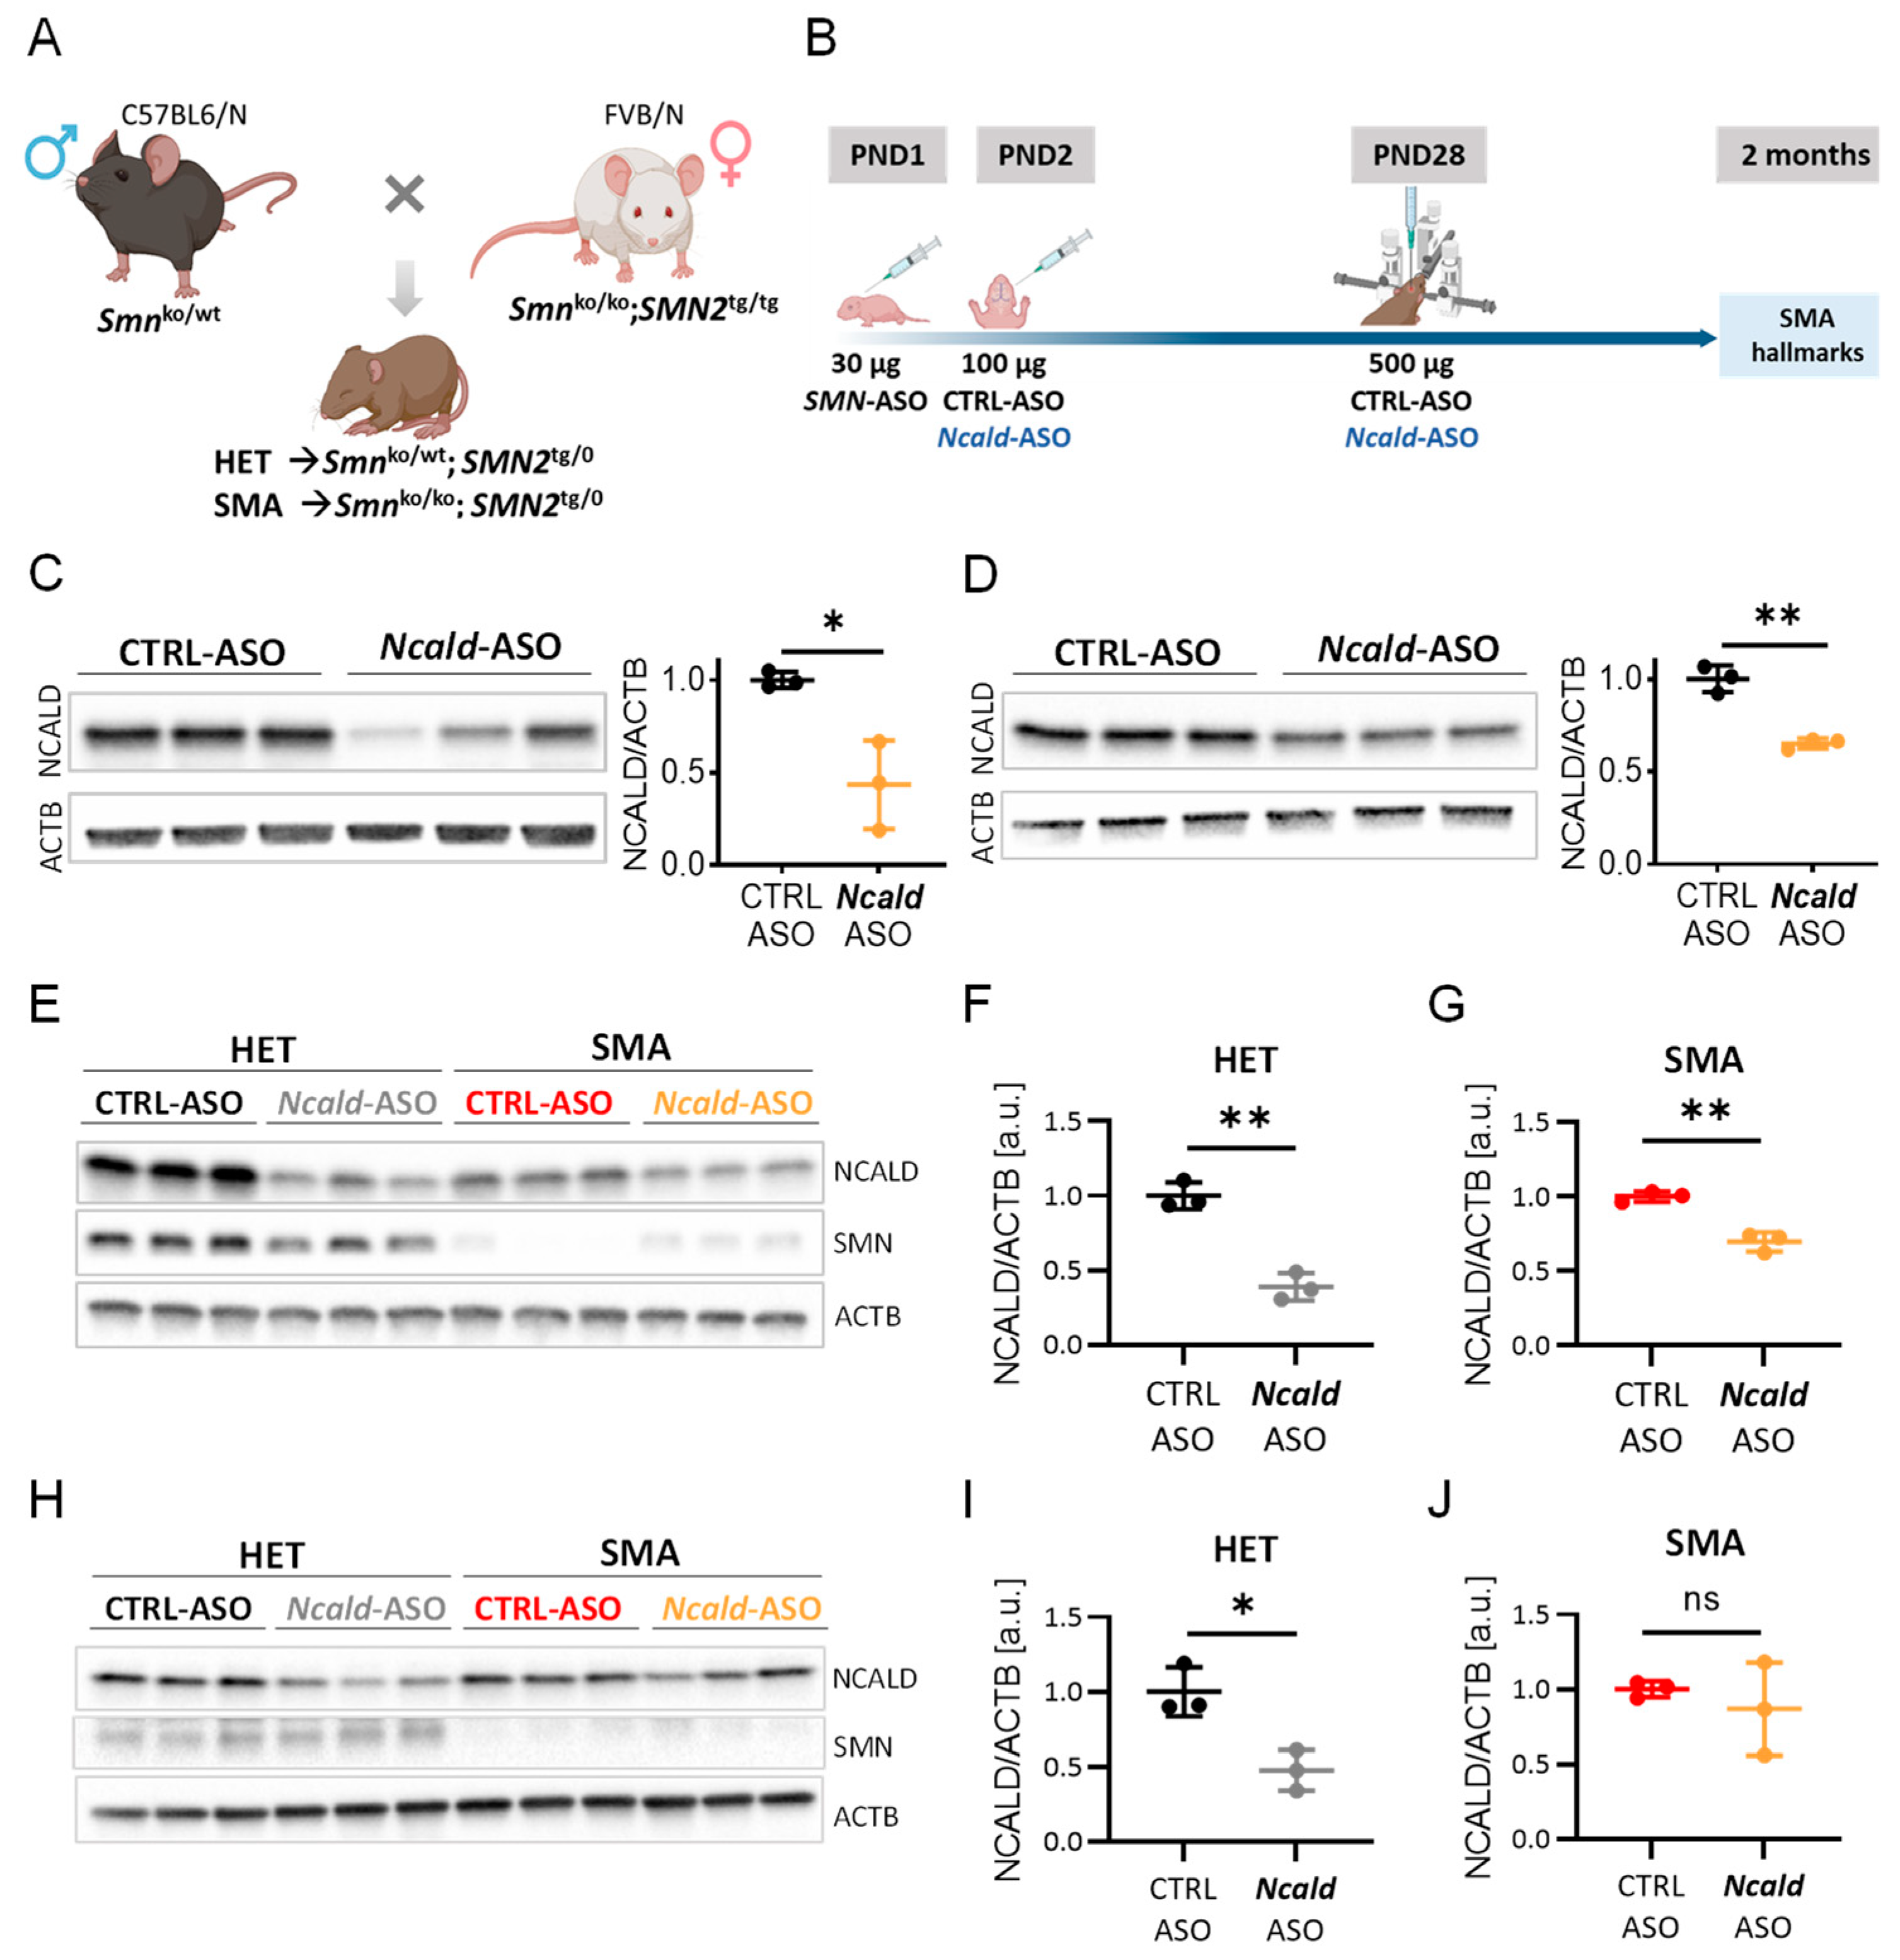
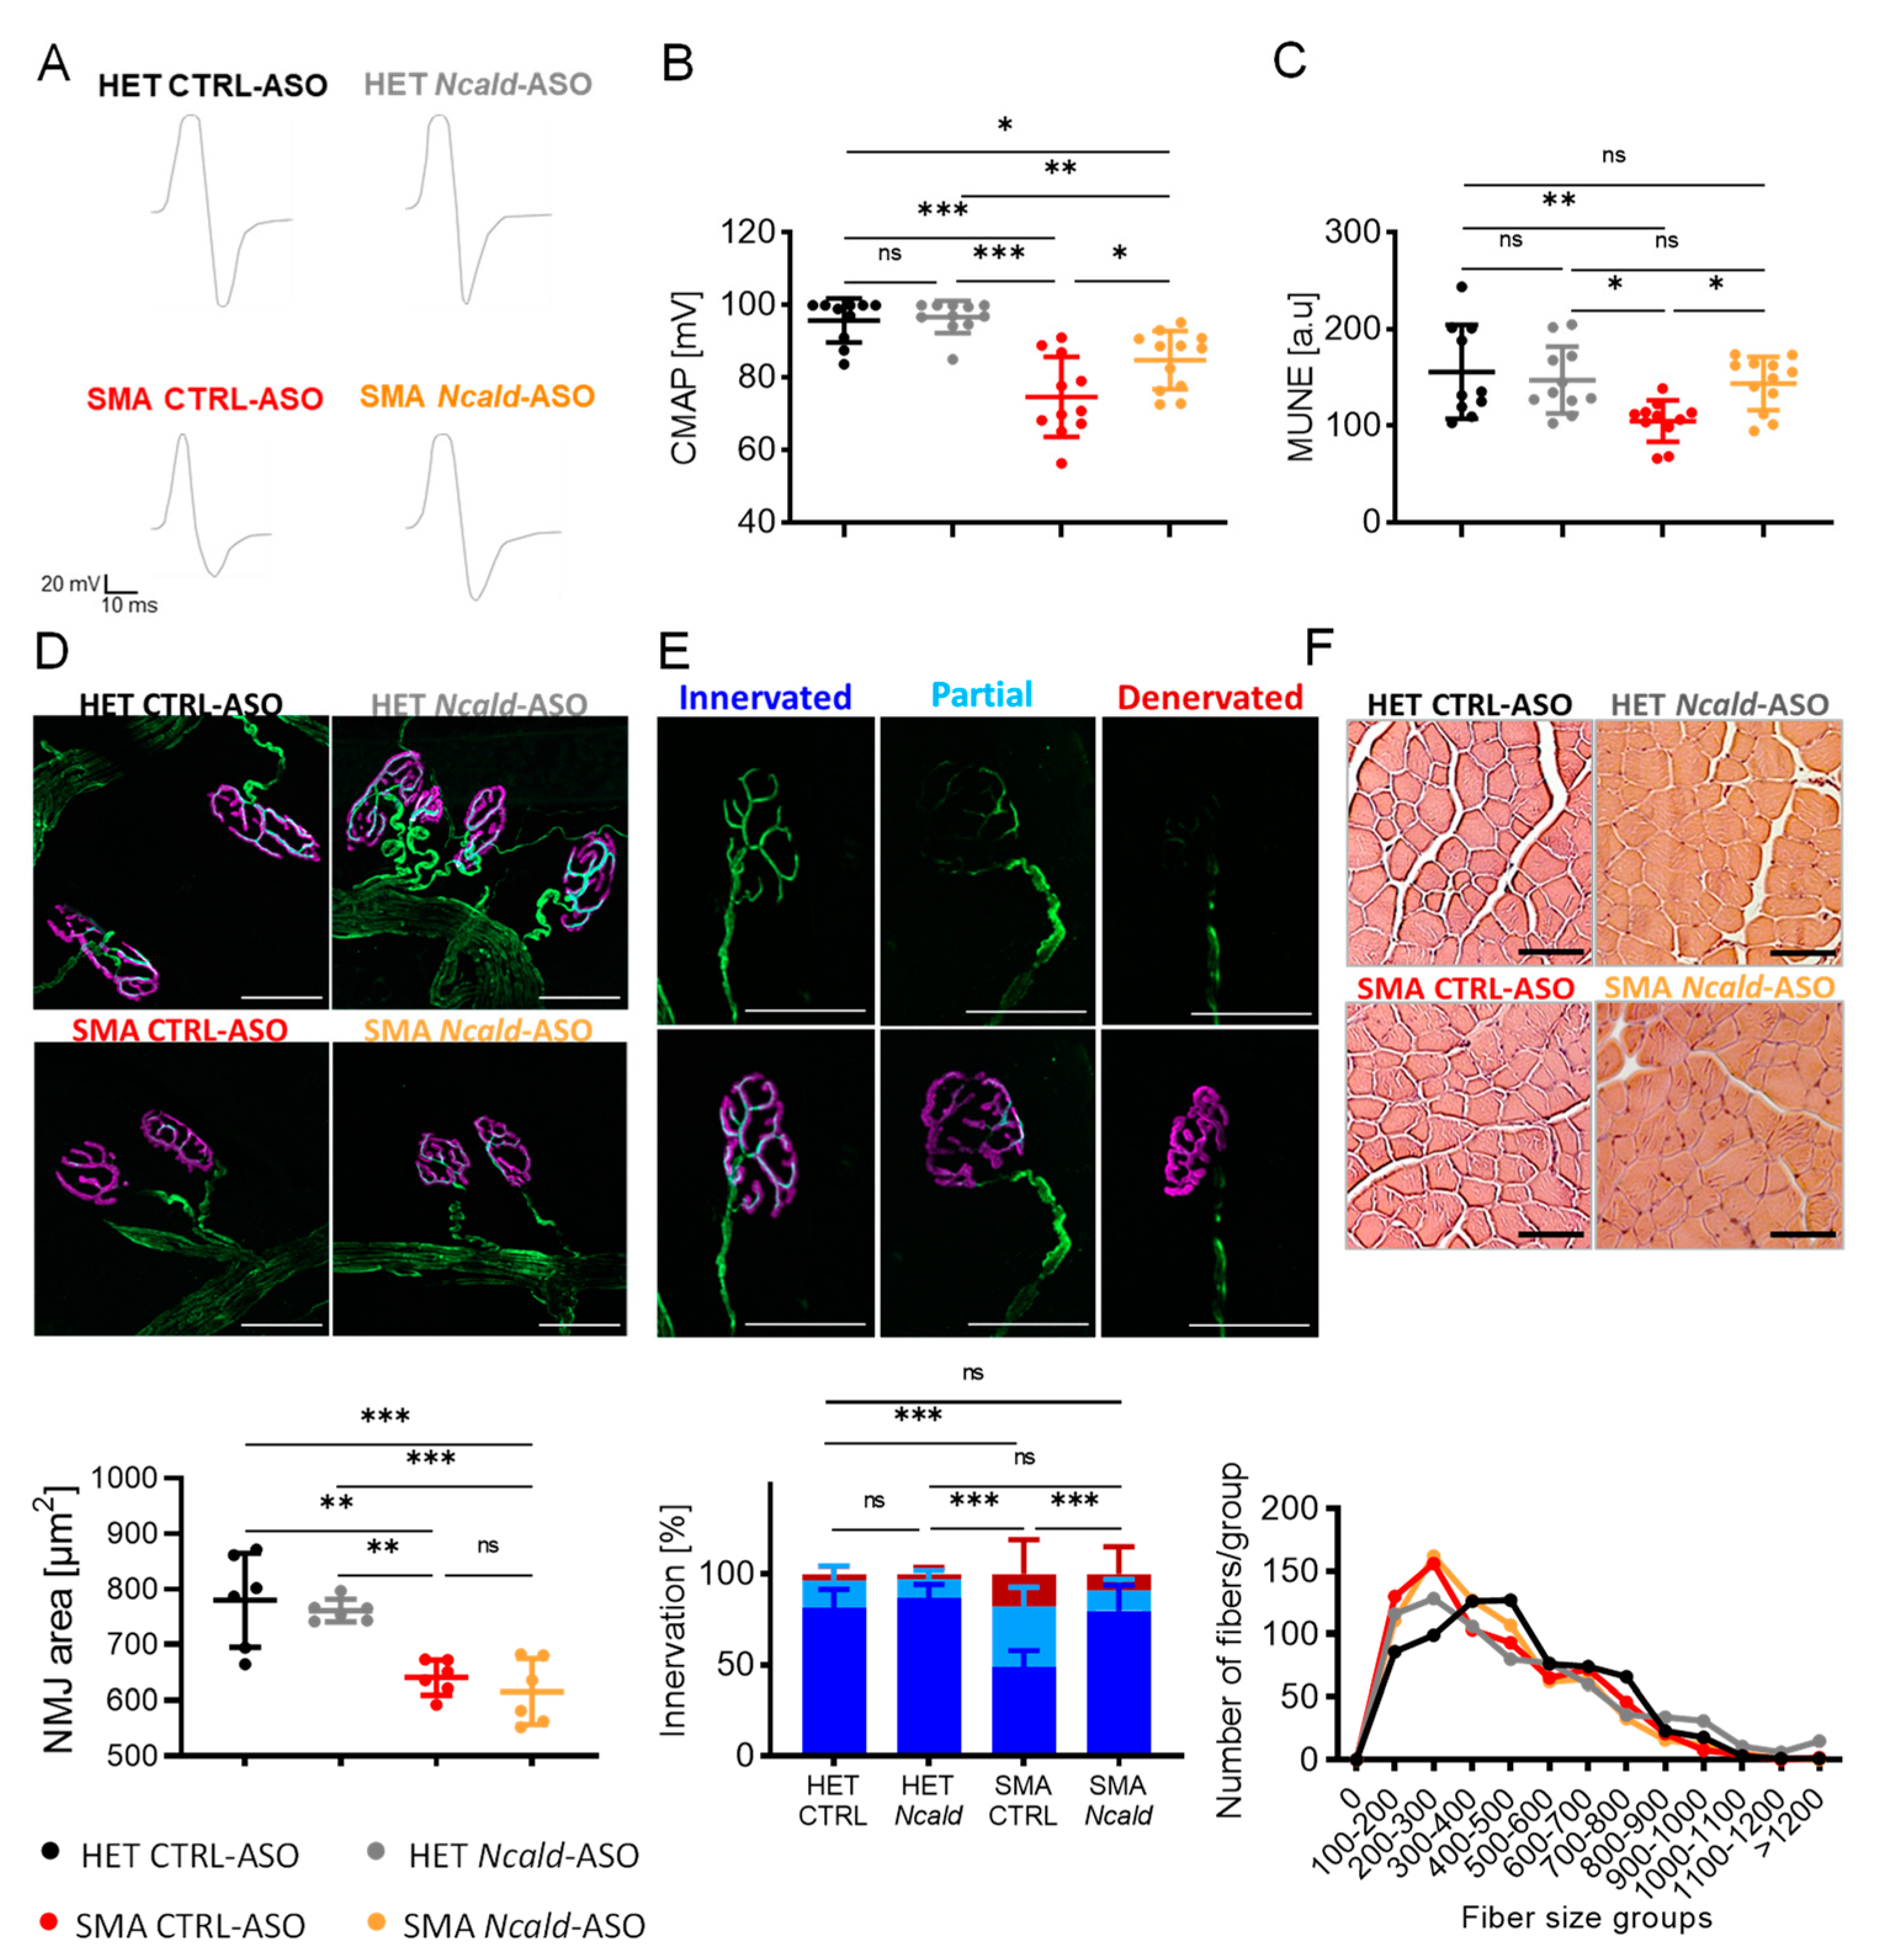
2.2. Long-term combinatorial treatment with Ncald-ASO and SMN ameliorates electrophysiological defects and NMJ denervation in SMA mice
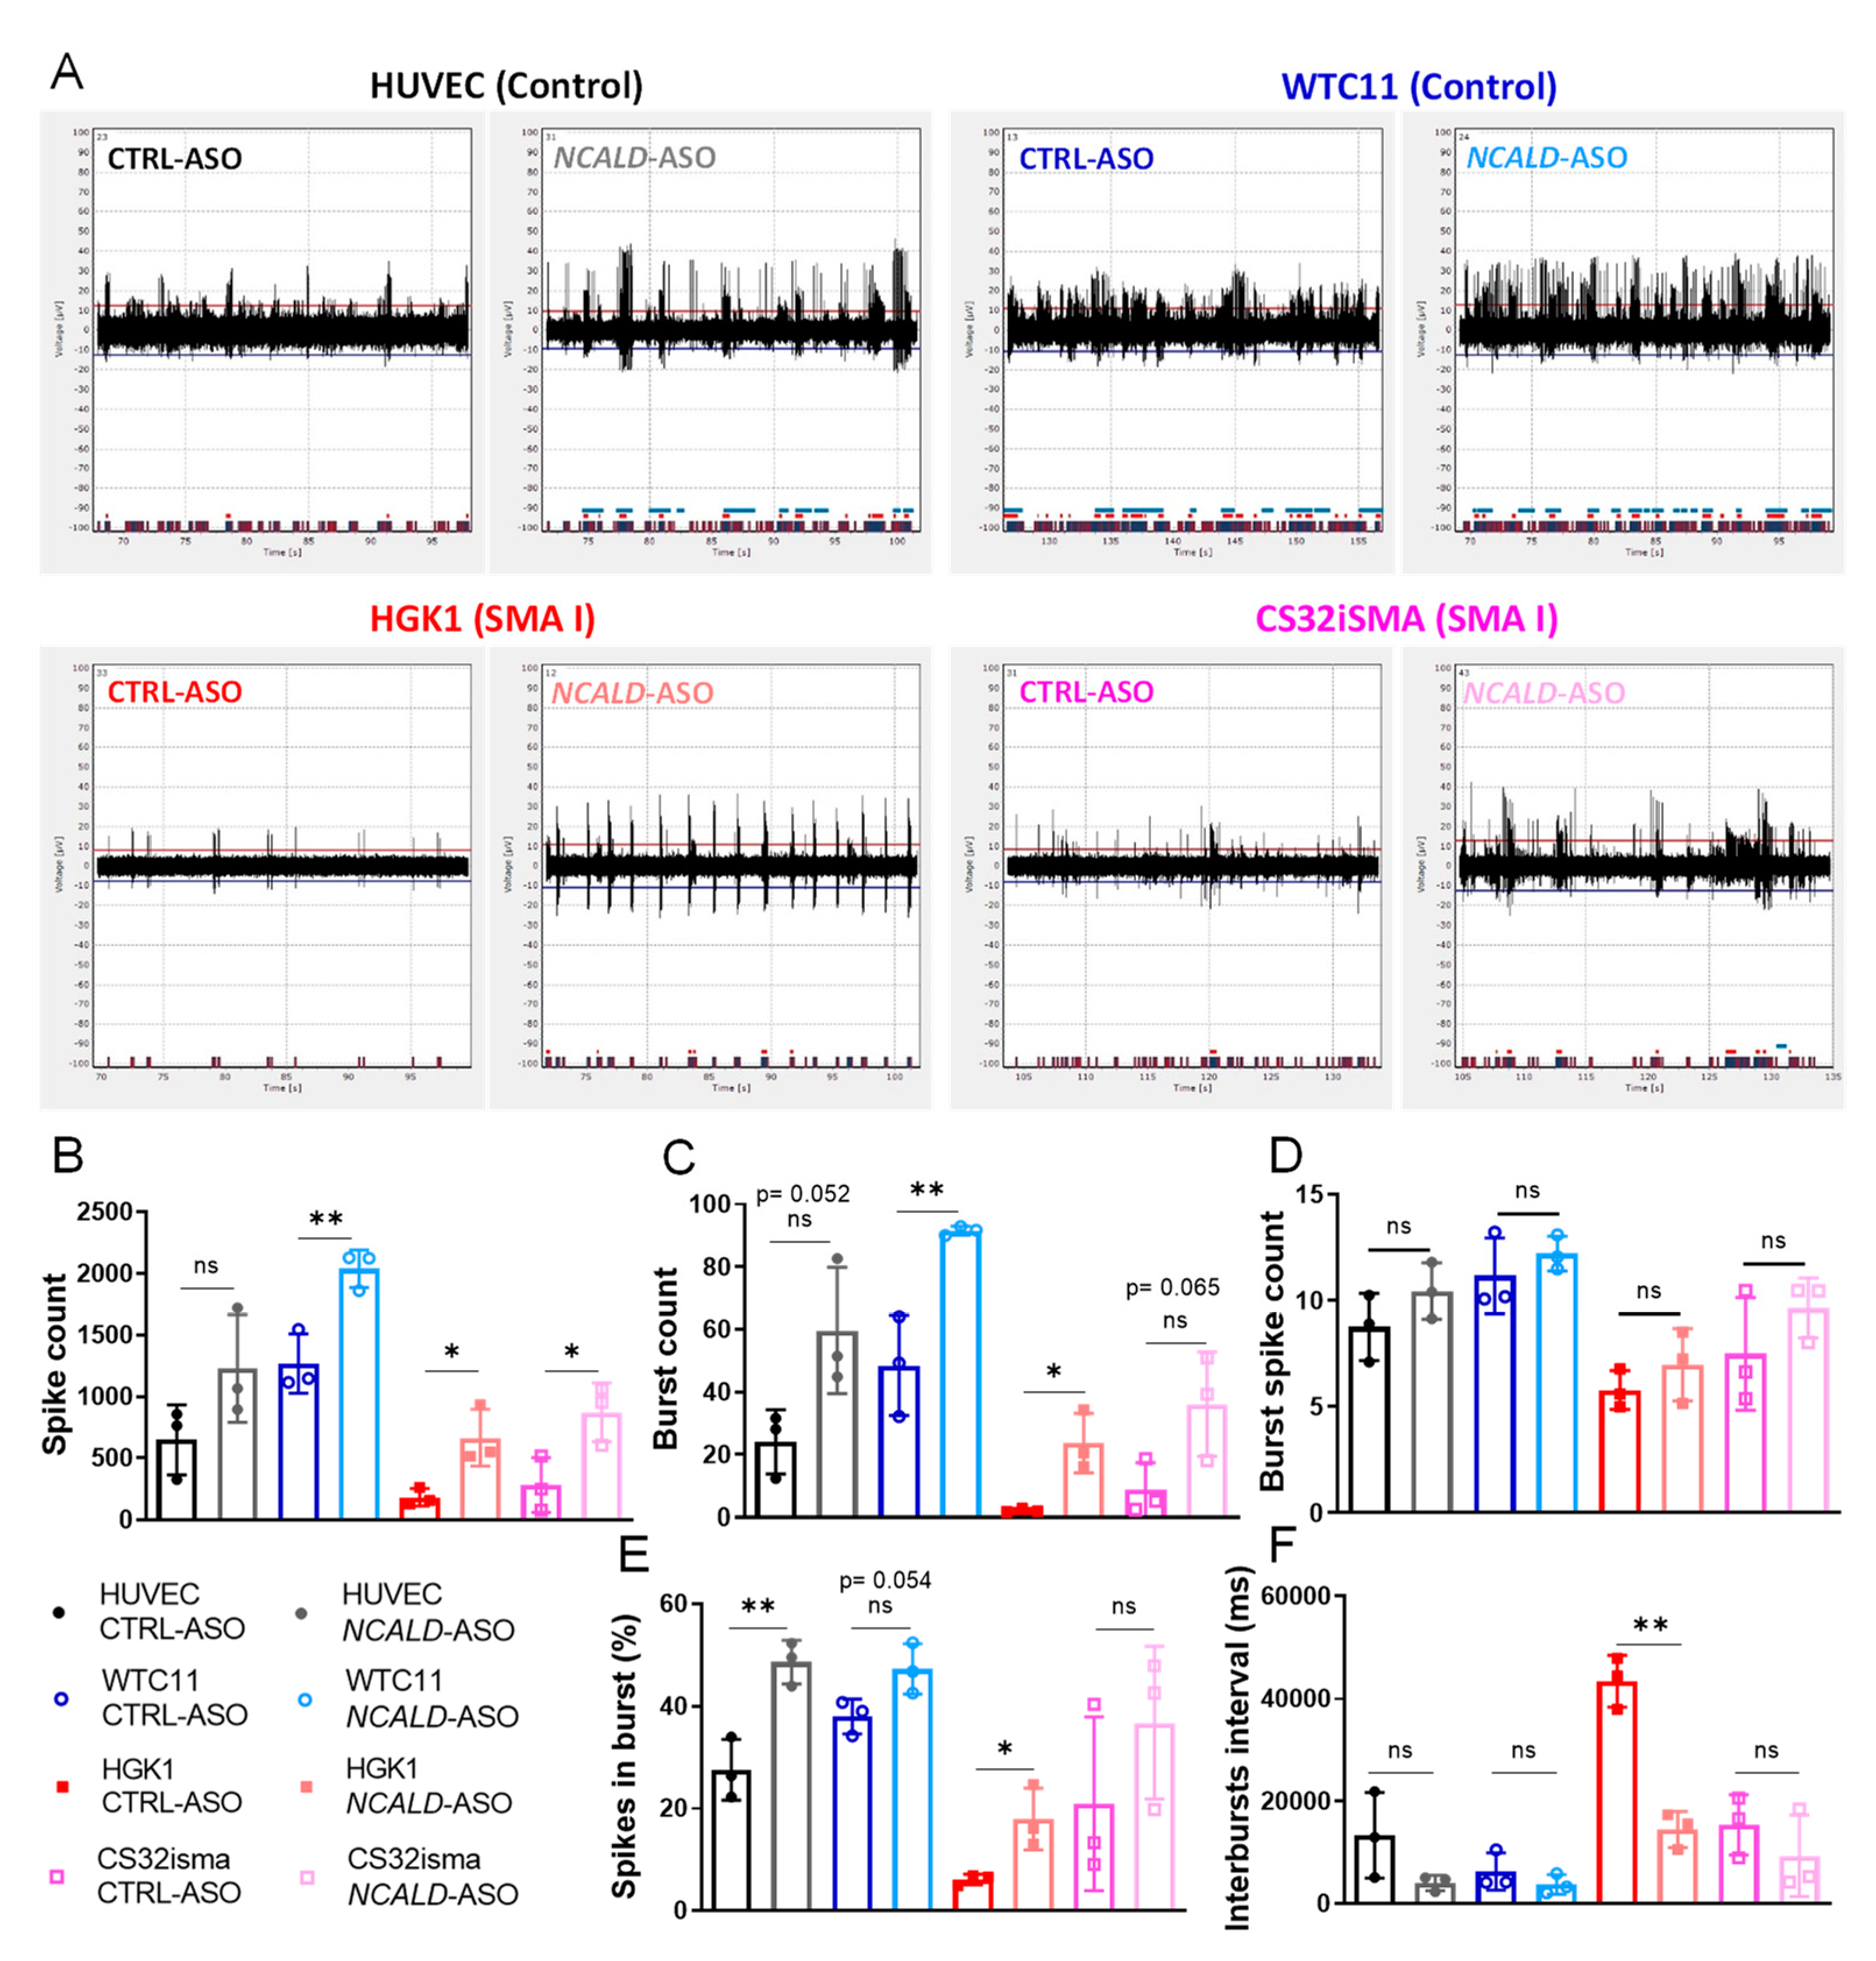
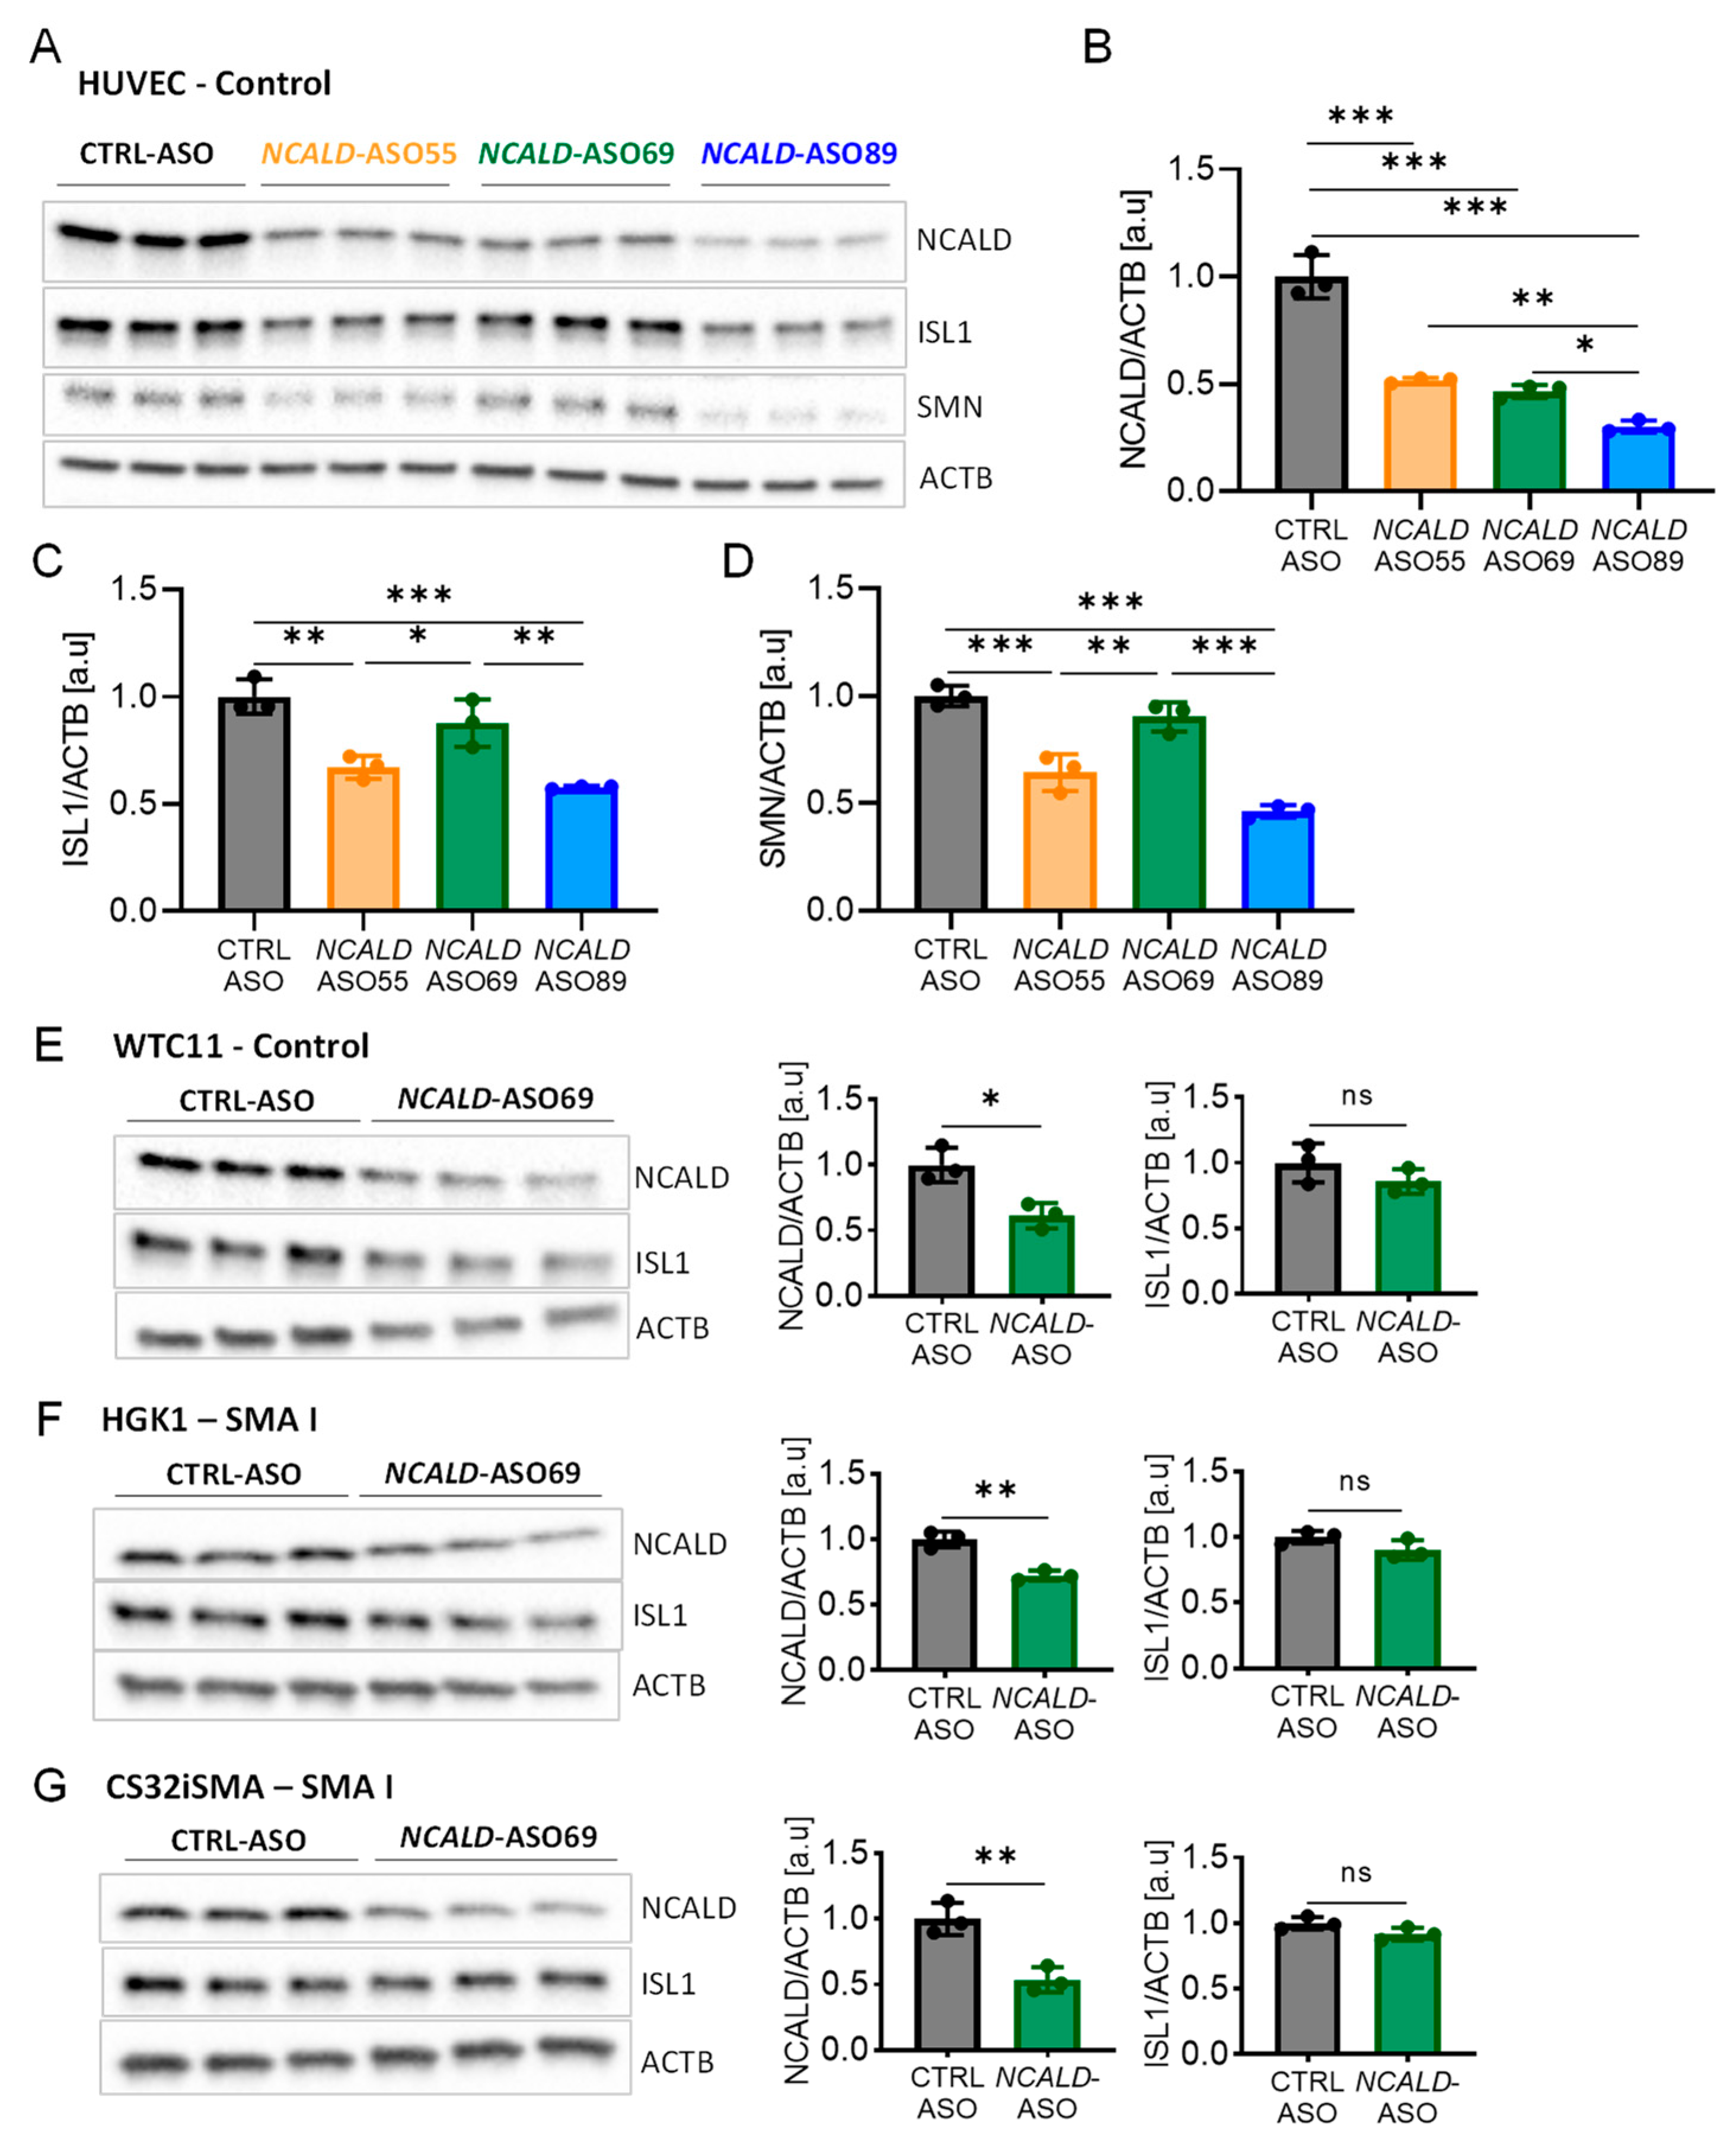
2.3. Testing of human NCALD-ASOs in MNs derived from SMA and control hiPSCs
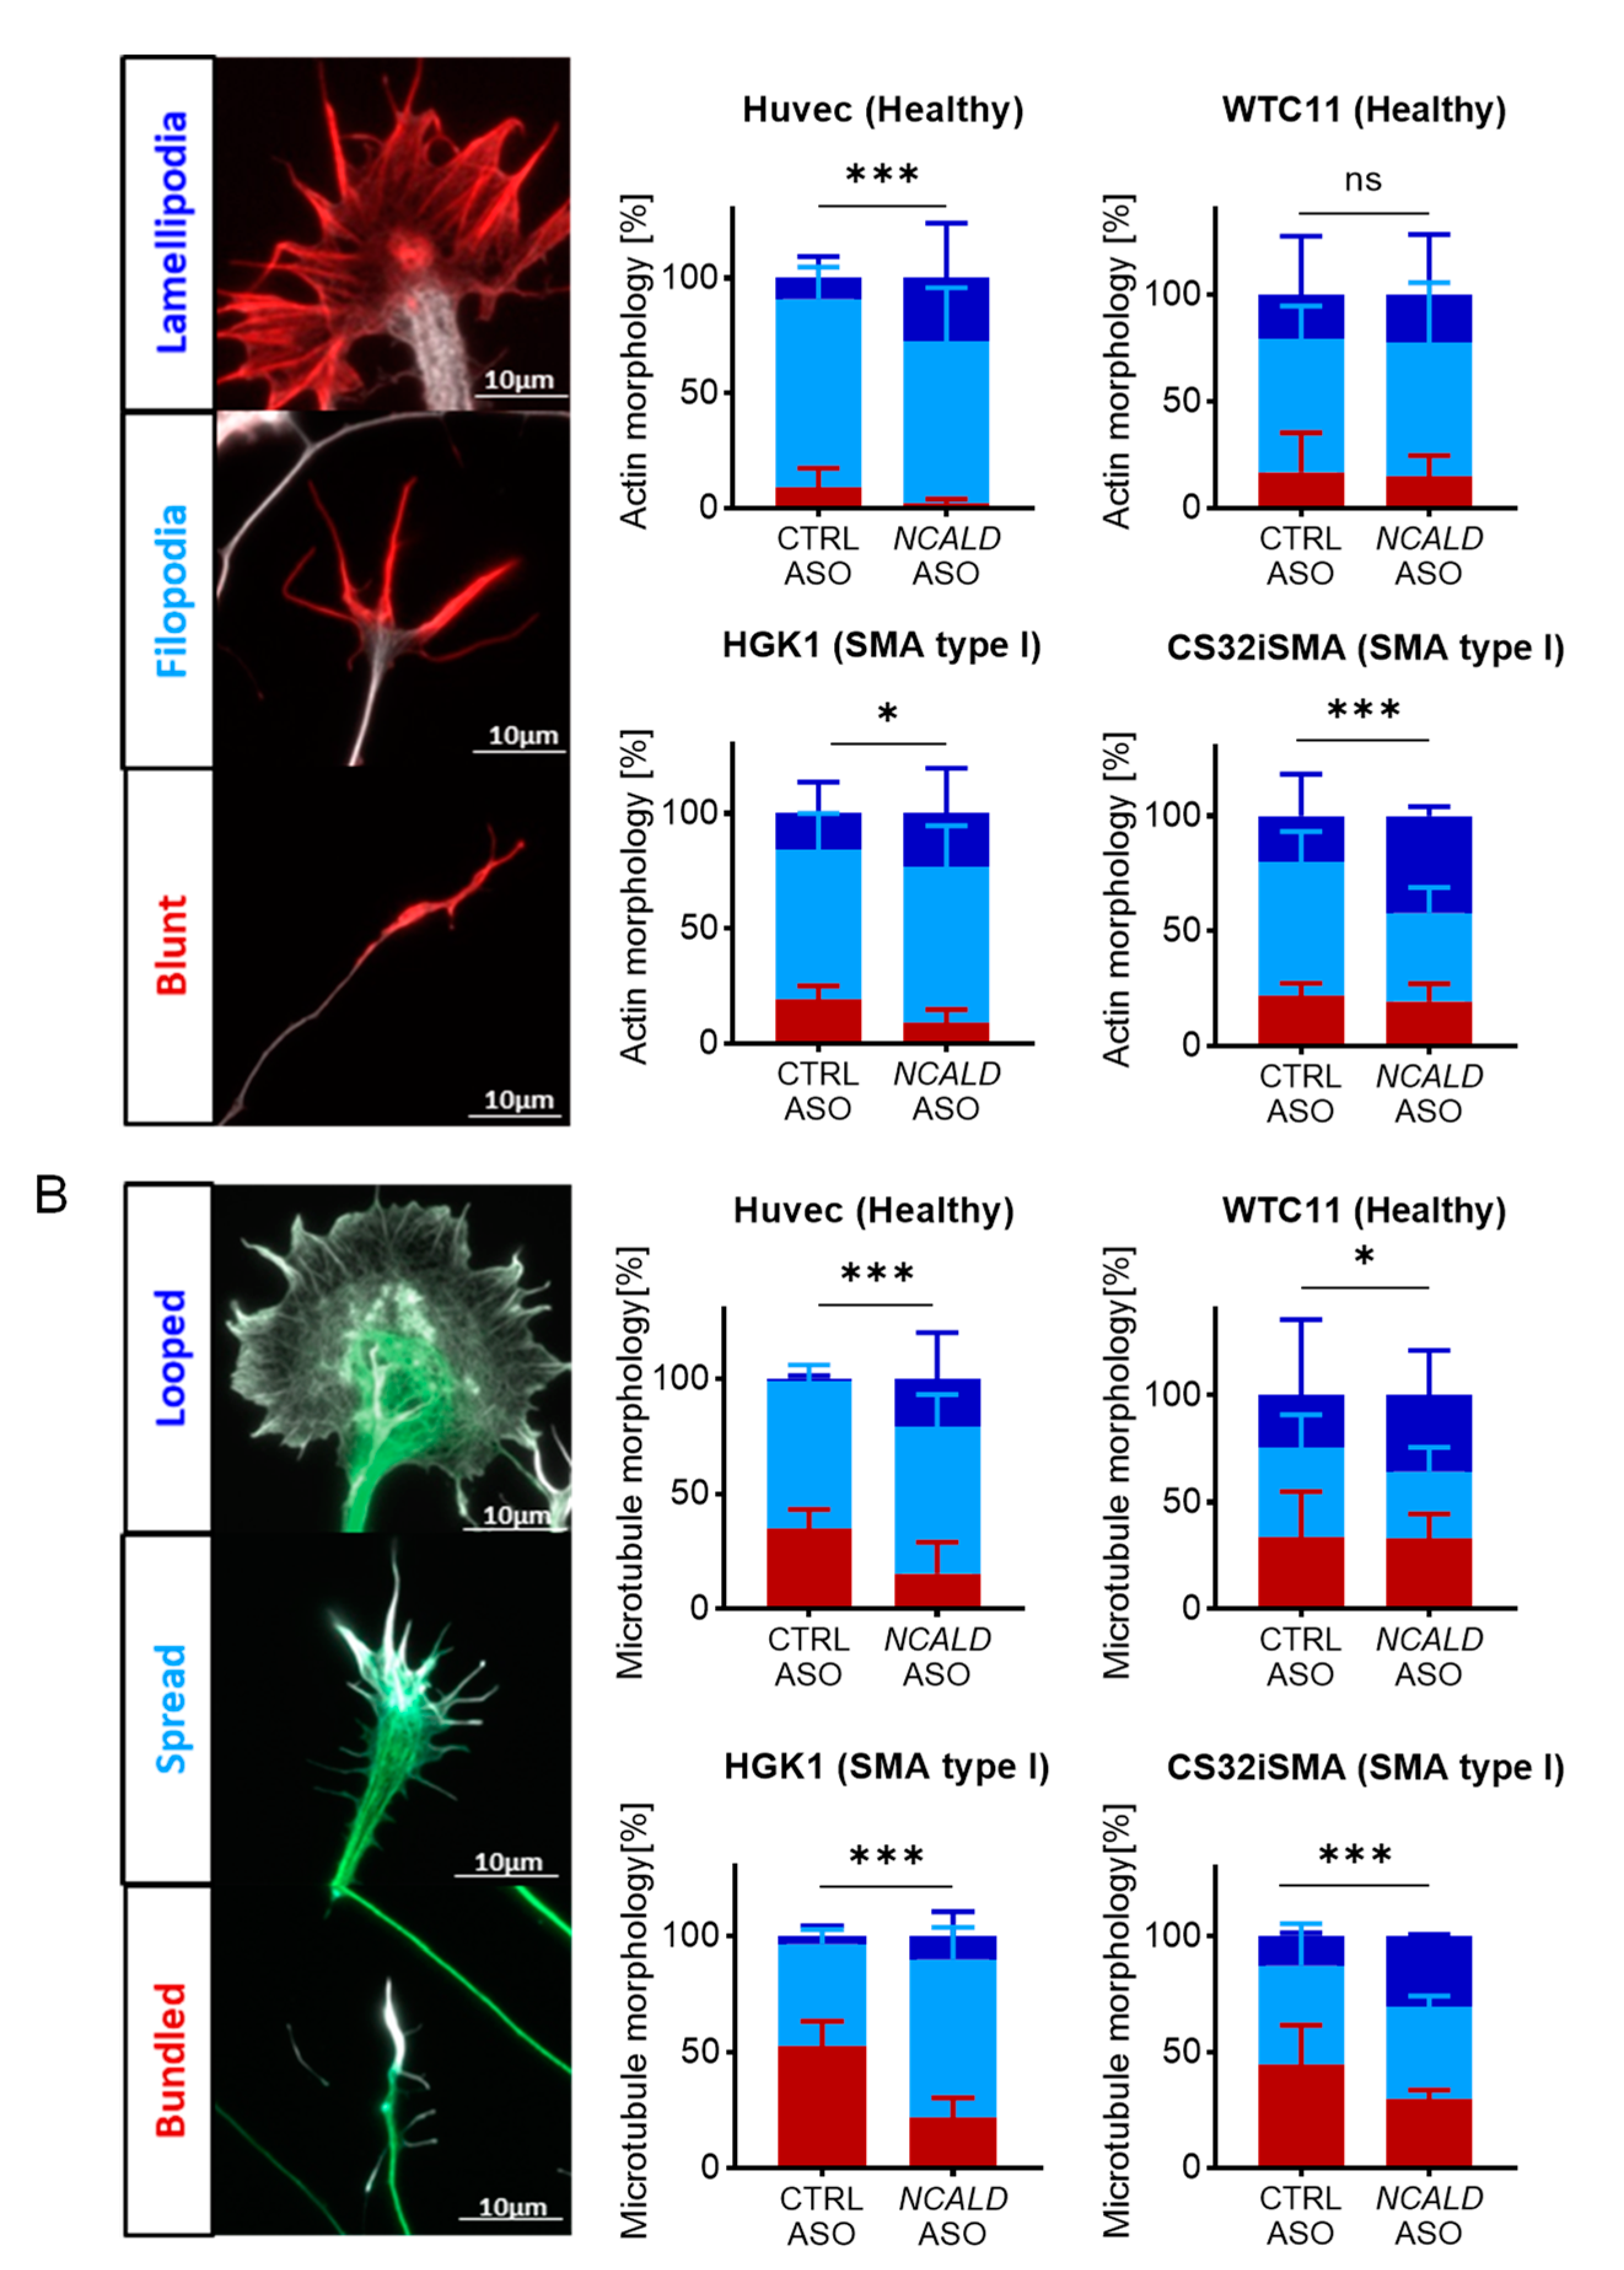
2.4. Treatment with NCALD-ASO69 Influences Growth Cone Morphology
2.5. Treatment with NCALD-ASO69 Increases Neuronal Activity
3. Discussion
3.1. Ncald-ASO re-injection prolongs amelioration of electrophysiological defects and NMJ pathology in SMA mice
3.2. NCALD-ASO69 treatment improves cytoskeleton dynamics and neuronal activity in hiPSC derived MNs
4. Materials and Methods
4.1. Mouse model and genotyping
4.2. Antisense oligonucleotides (ASOs)
4.3. ASOs injection in vivo
4.4. Experimental design
4.5. Western blot
4.6. Compound muscle action potential and motor unit number estimation
4.7. Analysis NMJ from the transversus abdominis (TVA)
4.8. Muscle fiber analysis
4.9. hiPSCs lines
| Cell line | Phenotype | SMN1/SMN2 copies | Sex | Age sampling | Reprogrammed |
| HUVEC | Healthy control | 2/2 | male | fetal | Retrovirus |
| WTC11 | Healthy control | 2/2 | male | 30 years | Episomal plasmid |
| HGK1 | SMA I | 0/2 | female | 6 months | Retrovirus |
| CS32iSMA | SMA I | 0/2 | male | 7 months | Episomal plasmid |
4.10. hiPSC maintenance and differentiation into MNs
4.11. NCALD-ASOs treatment in hiPSCs derived MNs
4.12. hiPSCs and MNs immunohistochemistry
4.13. Multielectrode array
4.14. Image acquisition and analysis
4.15. Image acquisition and analysis
4.16. Statistics
5. Conclusions
6. Patents
Supplementary Materials
Author Contributions
Funding
Institutional Review Board Statement
Informed Consent Statement
Data Availability Statement
Acknowledgments
Conflicts of Interest
References
- Finkel, R.S.; Mercuri, E.; Darras, B.T.; Connolly, A.M.; Kuntz, N.L.; Kirschner, J.; Chiriboga, C.A.; Saito, K.; Servais, L.; Tizzano, E.; et al. Nusinersen versus Sham Control in Infantile-Onset Spinal Muscular Atrophy. N Engl J Med 2017, 377, 1723–1732. [Google Scholar] [CrossRef]
- Baranello, G.; Darras, B.T.; Day, J.W.; Deconinck, N.; Klein, A.; Masson, R.; Mercuri, E.; Rose, K.; El-Khairi, M.; Gerber, M.; et al. Risdiplam in Type 1 Spinal Muscular Atrophy. N Engl J Med 2021, 384, 915–923. [Google Scholar] [CrossRef]
- Darras, B.T.; Masson, R.; Mazurkiewicz-Beldzinska, M.; Rose, K.; Xiong, H.; Zanoteli, E.; Baranello, G.; Bruno, C.; Vlodavets, D.; Wang, Y.; et al. Risdiplam-Treated Infants with Type 1 Spinal Muscular Atrophy versus Historical Controls. N Engl J Med 2021, 385, 427–435. [Google Scholar] [CrossRef]
- Mendell, J.R.; Al-Zaidy, S.; Shell, R.; Arnold, W.D.; Rodino-Klapac, L.R.; Prior, T.W.; Lowes, L.; Alfano, L.; Berry, K.; Church, K.; et al. Single-Dose Gene-Replacement Therapy for Spinal Muscular Atrophy. N Engl J Med 2017, 377, 1713–1722. [Google Scholar] [CrossRef] [PubMed]
- Mercuri, E.; Darras, B.T.; Chiriboga, C.A.; Day, J.W.; Campbell, C.; Connolly, A.M.; Iannaccone, S.T.; Kirschner, J.; Kuntz, N.L.; Saito, K.; et al. Nusinersen versus Sham Control in Later-Onset Spinal Muscular Atrophy. N Engl J Med 2018, 378, 625–635. [Google Scholar] [CrossRef] [PubMed]
- Lefebvre, S.; Burglen, L.; Reboullet, S.; Clermont, O.; Burlet, P.; Viollet, L.; Benichou, B.; Cruaud, C.; Millasseau, P.; Zeviani, M.; et al. Identification and characterization of a spinal muscular atrophy-determining gene. Cell 1995, 80, 155–165. [Google Scholar] [CrossRef]
- Wirth, B. Spinal Muscular Atrophy: In the Challenge Lies a Solution. Trends Neurosci 2021, 44, 306–322. [Google Scholar] [CrossRef] [PubMed]
- Wirth, B.; Karakaya, M.; Kye, M.J.; Mendoza-Ferreira, N. Twenty-Five Years of Spinal Muscular Atrophy Research: From Phenotype to Genotype to Therapy, and What Comes Next. Annu Rev Genomics Hum Genet 2020, 21, 231–261. [Google Scholar] [CrossRef] [PubMed]
- Lorson, C.L.; Hahnen, E.; Androphy, E.J.; Wirth, B. A single nucleotide in the SMN gene regulates splicing and is responsible for spinal muscular atrophy. Proc Natl Acad Sci U S A 1999, 96, 6307–6311. [Google Scholar] [CrossRef]
- Lefebvre, S.; Burlet, P.; Liu, Q.; Bertrandy, S.; Clermont, O.; Munnich, A.; Dreyfuss, G.; Melki, J. Correlation between severity and SMN protein level in spinal muscular atrophy. Nat Genet 1997, 16, 265–269. [Google Scholar] [CrossRef]
- Finkel, R.S.; Mercuri, E.; Meyer, O.H.; Simonds, A.K.; Schroth, M.K.; Graham, R.J.; Kirschner, J.; Iannaccone, S.T.; Crawford, T.O.; Woods, S.; et al. Diagnosis and management of spinal muscular atrophy: Part 2: Pulmonary and acute care; medications, supplements and immunizations; other organ systems; and ethics. Neuromuscul Disord 2018, 28, 197–207. [Google Scholar] [CrossRef]
- Mercuri, E.; Finkel, R.S.; Muntoni, F.; Wirth, B.; Montes, J.; Main, M.; Mazzone, E.S.; Vitale, M.; Snyder, B.; Quijano-Roy, S.; et al. Diagnosis and management of spinal muscular atrophy: Part 1: Recommendations for diagnosis, rehabilitation, orthopedic and nutritional care. Neuromuscul Disord 2018, 28, 103–115. [Google Scholar] [CrossRef]
- Battaglia, G.; Princivalle, A.; Forti, F.; Lizier, C.; Zeviani, M. Expression of the SMN gene, the spinal muscular atrophy determining gene, in the mammalian central nervous system. Hum Mol Genet 1997, 6, 1961–1971. [Google Scholar] [CrossRef] [PubMed]
- Coovert, D.D.; Le, T.T.; McAndrew, P.E.; Strasswimmer, J.; Crawford, T.O.; Mendell, J.R.; Coulson, S.E.; Androphy, E.J.; Prior, T.W.; Burghes, A.H. The survival motor neuron protein in spinal muscular atrophy. Hum Mol Genet 1997, 6, 1205–1214. [Google Scholar] [CrossRef] [PubMed]
- Singh, R.N.; Howell, M.D.; Ottesen, E.W.; Singh, N.N. Diverse role of survival motor neuron protein. Biochim Biophys Acta Gene Regul Mech 2017, 1860, 299–315. [Google Scholar] [CrossRef] [PubMed]
- Zilio, E.; Piano, V.; Wirth, B. Mitochondrial Dysfunction in Spinal Muscular Atrophy. Int J Mol Sci 2022, 23. [Google Scholar] [CrossRef] [PubMed]
- Cuartas, J.; Gangwani, L. R-loop Mediated DNA Damage and Impaired DNA Repair in Spinal Muscular Atrophy. Front Cell Neurosci 2022, 16, 826608. [Google Scholar] [CrossRef] [PubMed]
- Hamilton, G.; Gillingwater, T.H. Spinal muscular atrophy: going beyond the motor neuron. Trends Mol Med 2013, 19, 40–50. [Google Scholar] [CrossRef]
- Groen, E.J.N.; Perenthaler, E.; Courtney, N.L.; Jordan, C.Y.; Shorrock, H.K.; van der Hoorn, D.; Huang, Y.T.; Murray, L.M.; Viero, G.; Gillingwater, T.H. Temporal and tissue-specific variability of SMN protein levels in mouse models of spinal muscular atrophy. Hum Mol Genet 2018, 27, 2851–2862. [Google Scholar] [CrossRef]
- Kariya, S.; Obis, T.; Garone, C.; Akay, T.; Sera, F.; Iwata, S.; Homma, S.; Monani, U.R. Requirement of enhanced Survival Motoneuron protein imposed during neuromuscular junction maturation. J Clin Invest 2014, 124, 785–800. [Google Scholar] [CrossRef]
- Lauria, F.; Bernabo, P.; Tebaldi, T.; Groen, E.J.N.; Perenthaler, E.; Maniscalco, F.; Rossi, A.; Donzel, D.; Clamer, M.; Marchioretto, M.; et al. SMN-primed ribosomes modulate the translation of transcripts related to spinal muscular atrophy. Nat Cell Biol 2020, 22, 1239–1251. [Google Scholar] [CrossRef]
- Zhang, Z.; Lotti, F.; Dittmar, K.; Younis, I.; Wan, L.; Kasim, M.; Dreyfuss, G. SMN deficiency causes tissue-specific perturbations in the repertoire of snRNAs and widespread defects in splicing. Cell 2008, 133, 585–600. [Google Scholar] [CrossRef] [PubMed]
- De Vivo, D.C.; Bertini, E.; Swoboda, K.J.; Hwu, W.L.; Crawford, T.O.; Finkel, R.S.; Kirschner, J.; Kuntz, N.L.; Parsons, J.A.; Ryan, M.M.; et al. Nusinersen initiated in infants during the presymptomatic stage of spinal muscular atrophy: Interim efficacy and safety results from the Phase 2 NURTURE study. Neuromuscul Disord 2019, 29, 842–856. [Google Scholar] [CrossRef]
- Vill, K.; Schwartz, O.; Blaschek, A.; Glaser, D.; Nennstiel, U.; Wirth, B.; Burggraf, S.; Roschinger, W.; Becker, M.; Czibere, L.; et al. Newborn screening for spinal muscular atrophy in Germany: clinical results after 2 years. Orphanet J Rare Dis 2021, 16, 153. [Google Scholar] [CrossRef] [PubMed]
- Strauss, K.A.; Farrar, M.A.; Muntoni, F.; Saito, K.; Mendell, J.R.; Servais, L.; McMillan, H.J.; Finkel, R.S.; Swoboda, K.J.; Kwon, J.M.; et al. Onasemnogene abeparvovec for presymptomatic infants with two copies of SMN2 at risk for spinal muscular atrophy type 1: the Phase III SPR1NT trial. Nat Med 2022, 28, 1381–1389. [Google Scholar] [CrossRef] [PubMed]
- Strauss, K.A.; Farrar, M.A.; Muntoni, F.; Saito, K.; Mendell, J.R.; Servais, L.; McMillan, H.J.; Finkel, R.S.; Swoboda, K.J.; Kwon, J.M.; et al. Onasemnogene abeparvovec for presymptomatic infants with three copies of SMN2 at risk for spinal muscular atrophy: the Phase III SPR1NT trial. Nat Med 2022, 28, 1390–1397. [Google Scholar] [CrossRef]
- Oprea, G.E.; Krober, S.; McWhorter, M.L.; Rossoll, W.; Muller, S.; Krawczak, M.; Bassell, G.J.; Beattie, C.E.; Wirth, B. Plastin 3 is a protective modifier of autosomal recessive spinal muscular atrophy. Science 2008, 320, 524–527. [Google Scholar] [CrossRef]
- Riessland, M.; Kaczmarek, A.; Schneider, S.; Swoboda, K.J.; Lohr, H.; Bradler, C.; Grysko, V.; Dimitriadi, M.; Hosseinibarkooie, S.; Torres-Benito, L.; et al. Neurocalcin Delta Suppression Protects against Spinal Muscular Atrophy in Humans and across Species by Restoring Impaired Endocytosis. American journal of human genetics 2017, 100, 297–315. [Google Scholar] [CrossRef]
- Hosseinibarkooie, S.; Peters, M.; Torres-Benito, L.; Rastetter, R.H.; Hupperich, K.; Hoffmann, A.; Mendoza-Ferreira, N.; Kaczmarek, A.; Janzen, E.; Milbradt, J.; et al. The Power of Human Protective Modifiers: PLS3 and CORO1C Unravel Impaired Endocytosis in Spinal Muscular Atrophy and Rescue SMA Phenotype. American journal of human genetics 2016, 99, 647–665. [Google Scholar] [CrossRef]
- Torres-Benito, L.; Schneider, S.; Rombo, R.; Ling, K.K.; Grysko, V.; Upadhyay, A.; Kononenko, N.L.; Rigo, F.; Bennett, C.F.; Wirth, B. NCALD Antisense Oligonucleotide Therapy in Addition to Nusinersen further Ameliorates Spinal Muscular Atrophy in Mice. Am J Hum Genet 2019, 105, 221–230. [Google Scholar] [CrossRef]
- Wolff, L.; Strathmann, E.A.; Muller, I.; Mahlich, D.; Veltman, C.; Niehoff, A.; Wirth, B. Plastin 3 in health and disease: a matter of balance. Cell Mol Life Sci 2021, 78, 5275–5301. [Google Scholar] [CrossRef] [PubMed]
- Dimitriadi, M.; Derdowski, A.; Kalloo, G.; Maginnis, M.S.; O’Hern, P.; Bliska, B.; Sorkac, A.; Nguyen, K.C.; Cook, S.J.; Poulogiannis, G.; et al. Decreased function of survival motor neuron protein impairs endocytic pathways. Proc Natl Acad Sci U S A 2016, 113, E4377–E4386. [Google Scholar] [CrossRef]
- Hosseinibarkooie, S.; Peters, M.; Torres-Benito, L.; Rastetter, R.H.; Hupperich, K.; Hoffmann, A.; Mendoza-Ferreira, N.; Kaczmarek, A.; Janzen, E.; Milbradt, J.; et al. The Power of Human Protective Modifiers: PLS3 and CORO1C Unravel Impaired Endocytosis in Spinal Muscular Atrophy and Rescue SMA Phenotype. Am J Hum Genet 2016, 99, 647–665. [Google Scholar] [CrossRef]
- Kaifer, K.A.; Villalon, E.; Osman, E.Y.; Glascock, J.J.; Arnold, L.L.; Cornelison, D.D.W.; Lorson, C.L. Plastin-3 extends survival and reduces severity in mouse models of spinal muscular atrophy. JCI Insight 2017, 2, e89970. [Google Scholar] [CrossRef] [PubMed]
- Alrafiah, A.; Karyka, E.; Coldicott, I.; Iremonger, K.; Lewis, K.E.; Ning, K.; Azzouz, M. Plastin 3 Promotes Motor Neuron Axonal Growth and Extends Survival in a Mouse Model of Spinal Muscular Atrophy. Mol Ther Methods Clin Dev 2018, 9, 81–89. [Google Scholar] [CrossRef] [PubMed]
- Walsh, M.B.; Janzen, E.; Wingrove, E.; Hosseinibarkooie, S.; Muela, N.R.; Davidow, L.; Dimitriadi, M.; Norabuena, E.M.; Rubin, L.L.; Wirth, B.; et al. Genetic modifiers ameliorate endocytic and neuromuscular defects in a model of spinal muscular atrophy. BMC Biol 2020, 18, 127. [Google Scholar] [CrossRef] [PubMed]
- Muinos-Buhl, A.; Rombo, R.; Janzen, E.; Ling, K.K.; Hupperich, K.; Rigo, F.; Bennett, C.F.; Wirth, B. Combinatorial ASO-mediated therapy with low dose SMN and the protective modifier Chp1 is not sufficient to ameliorate SMA pathology hallmarks. Neurobiol Dis 2022, 171, 105795. [Google Scholar] [CrossRef]
- Janzen, E.; Mendoza-Ferreira, N.; Hosseinibarkooie, S.; Schneider, S.; Hupperich, K.; Tschanz, T.; Grysko, V.; Riessland, M.; Hammerschmidt, M.; Rigo, F.; et al. CHP1 reduction ameliorates spinal muscular atrophy pathology by restoring calcineurin activity and endocytosis. Brain 2018, 141, 2343–2361. [Google Scholar] [CrossRef]
- Lewelt, A.; Krosschell, K.J.; Scott, C.; Sakonju, A.; Kissel, J.T.; Crawford, T.O.; Acsadi, G.; D’Anjou, G.; Elsheikh, B.; Reyna, S.P.; et al. Compound muscle action potential and motor function in children with spinal muscular atrophy. Muscle Nerve 2010, 42, 703–708. [Google Scholar] [CrossRef]
- Arnold, W.D.; Porensky, P.N.; McGovern, V.L.; Iyer, C.C.; Duque, S.; Li, X.; Meyer, K.; Schmelzer, L.; Kaspar, B.K.; Kolb, S.J.; et al. Electrophysiological Biomarkers in Spinal Muscular Atrophy: Preclinical Proof of Concept. Ann Clin Transl Neurol 2014, 1, 34–44. [Google Scholar] [CrossRef]
- Rossoll, W.; Jablonka, S.; Andreassi, C.; Kroning, A.K.; Karle, K.; Monani, U.R.; Sendtner, M. Smn, the spinal muscular atrophy-determining gene product, modulates axon growth and localization of beta-actin mRNA in growth cones of motoneurons. J Cell Biol 2003, 163, 801–812. [Google Scholar] [CrossRef] [PubMed]
- Moradi, M.; Sivadasan, R.; Saal, L.; Luningschror, P.; Dombert, B.; Rathod, R.J.; Dieterich, D.C.; Blum, R.; Sendtner, M. Differential roles of alpha-, beta-, and gamma-actin in axon growth and collateral branch formation in motoneurons. J Cell Biol 2017, 216, 793–814. [Google Scholar] [CrossRef]
- Iino, S.; Kobayashi, S.; Hidaka, H. Neurocalcin-immunopositive nerve terminals in the muscle spindle, Golgi tendon organ and motor endplate. Brain Res 1998, 808, 294–299. [Google Scholar] [CrossRef]
- Ivings, L.; Pennington, S.R.; Jenkins, R.; Weiss, J.L.; Burgoyne, R.D. Identification of Ca2+-dependent binding partners for the neuronal calcium sensor protein neurocalcin delta: interaction with actin, clathrin and tubulin. Biochem J 2002, 363, 599–608. [Google Scholar] [CrossRef]
- Khazaei, M.R.; Girouard, M.P.; Alchini, R.; Ong Tone, S.; Shimada, T.; Bechstedt, S.; Cowan, M.; Guillet, D.; Wiseman, P.W.; Brouhard, G.; et al. Collapsin response mediator protein 4 regulates growth cone dynamics through the actin and microtubule cytoskeleton. J Biol Chem 2014, 289, 30133–30143. [Google Scholar] [CrossRef]
- Berghuis, P.; Rajnicek, A.M.; Morozov, Y.M.; Ross, R.A.; Mulder, J.; Urban, G.M.; Monory, K.; Marsicano, G.; Matteoli, M.; Canty, A.; et al. Hardwiring the brain: endocannabinoids shape neuronal connectivity. Science 2007, 316, 1212–1216. [Google Scholar] [CrossRef] [PubMed]
- Finkel, R.S.; Chiriboga, C.A.; Vajsar, J.; Day, J.W.; Montes, J.; De Vivo, D.C.; Yamashita, M.; Rigo, F.; Hung, G.; Schneider, E.; et al. Treatment of infantile-onset spinal muscular atrophy with nusinersen: a phase 2, open-label, dose-escalation study. Lancet 2016, 388, 3017–3026. [Google Scholar] [CrossRef]
- Van Alstyne, M.; Tattoli, I.; Delestree, N.; Recinos, Y.; Workman, E.; Shihabuddin, L.S.; Zhang, C.; Mentis, G.Z.; Pellizzoni, L. Gain of toxic function by long-term AAV9-mediated SMN overexpression in the sensorimotor circuit. Nat Neurosci 2021, 24, 930–940. [Google Scholar] [CrossRef]
- Arnold, W.D.; Sheth, K.A.; Wier, C.G.; Kissel, J.T.; Burghes, A.H.; Kolb, S.J. Electrophysiological Motor Unit Number Estimation (MUNE) Measuring Compound Muscle Action Potential (CMAP) in Mouse Hindlimb Muscles. J Vis Exp 2015. [Google Scholar] [CrossRef]
- Boyd, P.J.; Gillingwater, T.H. Axonal and Neuromuscular Junction Pathology in Spinal Muscular Atrophy. In Spinal Musculat Atrophy: Disease Mechanisms and Therapy; Sumner, C.J., Paushkin, S., Ko, C.P., Eds.; Academic Press: Cambridge, MA, USA, 2017; pp. 133–151. [Google Scholar]
- Woschitz, V.; Mei, I.; Hedlund, E.; Murray, L.M. Mouse models of SMA show divergent patterns of neuronal vulnerability and resilience. Skelet Muscle 2022, 12, 22. [Google Scholar] [CrossRef]
- Gromova, A.; La Spada, A.R. Harmony Lost: Cell-Cell Communication at the Neuromuscular Junction in Motor Neuron Disease. Trends Neurosci 2020, 43, 709–724. [Google Scholar] [CrossRef] [PubMed]
- Gilhus, N.E.; Tzartos, S.; Evoli, A.; Palace, J.; Burns, T.M.; Verschuuren, J. Myasthenia gravis. Nat Rev Dis Primers 2019, 5, 30. [Google Scholar] [CrossRef] [PubMed]
- Hua, Y.; Vickers, T.A.; Okunola, H.L.; Bennett, C.F.; Krainer, A.R. Antisense masking of an hnRNP A1/A2 intronic splicing silencer corrects SMN2 splicing in transgenic mice. Am J Hum Genet 2008, 82, 834–848. [Google Scholar] [CrossRef]
- Hua, Y.; Sahashi, K.; Rigo, F.; Hung, G.; Horev, G.; Bennett, C.F.; Krainer, A.R. Peripheral SMN restoration is essential for long-term rescue of a severe spinal muscular atrophy mouse model. Nature 2011, 478, 123–126. [Google Scholar] [CrossRef]
- Fan, L.; Simard, L.R. Survival motor neuron (SMN) protein: role in neurite outgrowth and neuromuscular maturation during neuronal differentiation and development. Hum Mol Genet 2002, 11, 1605–1614. [Google Scholar] [CrossRef]
- Nolle, A.; Zeug, A.; van Bergeijk, J.; Tonges, L.; Gerhard, R.; Brinkmann, H.; Al Rayes, S.; Hensel, N.; Schill, Y.; Apkhazava, D.; et al. The spinal muscular atrophy disease protein SMN is linked to the Rho-kinase pathway via profilin. Hum Mol Genet 2011, 20, 4865–4878. [Google Scholar] [CrossRef]
- Hensel, N.; Claus, P. The Actin Cytoskeleton in SMA and ALS: How Does It Contribute to Motoneuron Degeneration? Neuroscientist 2018, 24, 54–72. [Google Scholar] [CrossRef]
- Monani, U.R.; Coovert, D.D.; Burghes, A.H. Animal models of spinal muscular atrophy. Hum Mol Genet 2000, 9, 2451–2457. [Google Scholar] [CrossRef] [PubMed]
- Fletcher, E.V.; Simon, C.M.; Pagiazitis, J.G.; Chalif, J.I.; Vukojicic, A.; Drobac, E.; Wang, X.; Mentis, G.Z. Reduced sensory synaptic excitation impairs motor neuron function via Kv2.1 in spinal muscular atrophy. Nat Neurosci 2017, 20, 905–916. [Google Scholar] [CrossRef]
- Tharaneetharan, A.; Cole, M.; Norman, B.; Romero, N.C.; Wooltorton, J.R.A.; Harrington, M.A.; Sun, J. Functional Abnormalities of Cerebellum and Motor Cortex in Spinal Muscular Atrophy Mice. Neuroscience 2021, 452, 78–97. [Google Scholar] [CrossRef]
- Simon, C.M.; Blanco-Redondo, B.; Buettner, J.M.; Pagiazitis, J.G.; Fletcher, E.V.; Sime Longang, J.K.; Mentis, G.Z. Chronic Pharmacological Increase of Neuronal Activity Improves Sensory-Motor Dysfunction in Spinal Muscular Atrophy Mice. J Neurosci 2021, 41, 376–389. [Google Scholar] [CrossRef] [PubMed]
- Jablonka, S.; Beck, M.; Lechner, B.D.; Mayer, C.; Sendtner, M. Defective Ca2+ channel clustering in axon terminals disturbs excitability in motoneurons in spinal muscular atrophy. J Cell Biol 2007, 179, 139–149. [Google Scholar] [CrossRef]
- Hsieh-Li, H.M.; Chang, J.G.; Jong, Y.J.; Wu, M.H.; Wang, N.M.; Tsai, C.H.; Li, H. A mouse model for spinal muscular atrophy. Nat Genet 2000, 24, 66–70. [Google Scholar] [CrossRef]
- Ackermann, B.; Krober, S.; Torres-Benito, L.; Borgmann, A.; Peters, M.; Hosseini Barkooie, S.M.; Tejero, R.; Jakubik, M.; Schreml, J.; Milbradt, J.; et al. Plastin 3 ameliorates spinal muscular atrophy via delayed axon pruning and improves neuromuscular junction functionality. Hum Mol Genet 2013, 22, 1328–1347. [Google Scholar] [CrossRef] [PubMed]
- Glascock, J.J.; Osman, E.Y.; Coady, T.H.; Rose, F.F.; Shababi, M.; Lorson, C.L. Delivery of therapeutic agents through intracerebroventricular (ICV) and intravenous (IV) injection in mice. J Vis Exp 2011. [Google Scholar] [CrossRef] [PubMed]
- DeVos, S.L.; Miller, T.M. Direct intraventricular delivery of drugs to the rodent central nervous system. J Vis Exp 2013, e50326. [Google Scholar] [CrossRef]
- Panopoulos, A.D.; Ruiz, S.; Yi, F.; Herrerias, A.; Batchelder, E.M.; Izpisua Belmonte, J.C. Rapid and highly efficient generation of induced pluripotent stem cells from human umbilical vein endothelial cells. PLoS One 2011, 6, e19743. [Google Scholar] [CrossRef]
- Garbes, L.; Heesen, L.; Holker, I.; Bauer, T.; Schreml, J.; Zimmermann, K.; Thoenes, M.; Walter, M.; Dimos, J.; Peitz, M.; et al. VPA response in SMA is suppressed by the fatty acid translocase CD36. Hum Mol Genet 2013, 22, 398–407. [Google Scholar] [CrossRef] [PubMed]
- Guo, W.; Naujock, M.; Fumagalli, L.; Vandoorne, T.; Baatsen, P.; Boon, R.; Ordovas, L.; Patel, A.; Welters, M.; Vanwelden, T.; et al. HDAC6 inhibition reverses axonal transport defects in motor neurons derived from FUS-ALS patients. Nat Commun 2017, 8, 861. [Google Scholar] [CrossRef]
- Delle Vedove, A.; Natarajan, J.; Zanni, G.; Eckenweiler, M.; Muinos-Buhl, A.; Storbeck, M.; Guillen Boixet, J.; Barresi, S.; Pizzi, S.; Holker, I.; et al. CAPRIN1(P512L) causes aberrant protein aggregation and associates with early-onset ataxia. Cell Mol Life Sci 2022, 79, 526. [Google Scholar] [CrossRef]
Disclaimer/Publisher’s Note: The statements, opinions and data contained in all publications are solely those of the individual author(s) and contributor(s) and not of MDPI and/or the editor(s). MDPI and/or the editor(s) disclaim responsibility for any injury to people or property resulting from any ideas, methods, instructions or products referred to in the content. |
© 2023 by the authors. Licensee MDPI, Basel, Switzerland. This article is an open access article distributed under the terms and conditions of the Creative Commons Attribution (CC BY) license (http://creativecommons.org/licenses/by/4.0/).


