Submitted:
04 February 2023
Posted:
07 February 2023
You are already at the latest version
Abstract
Keywords:
1. Introduction
2. Materials and Methods
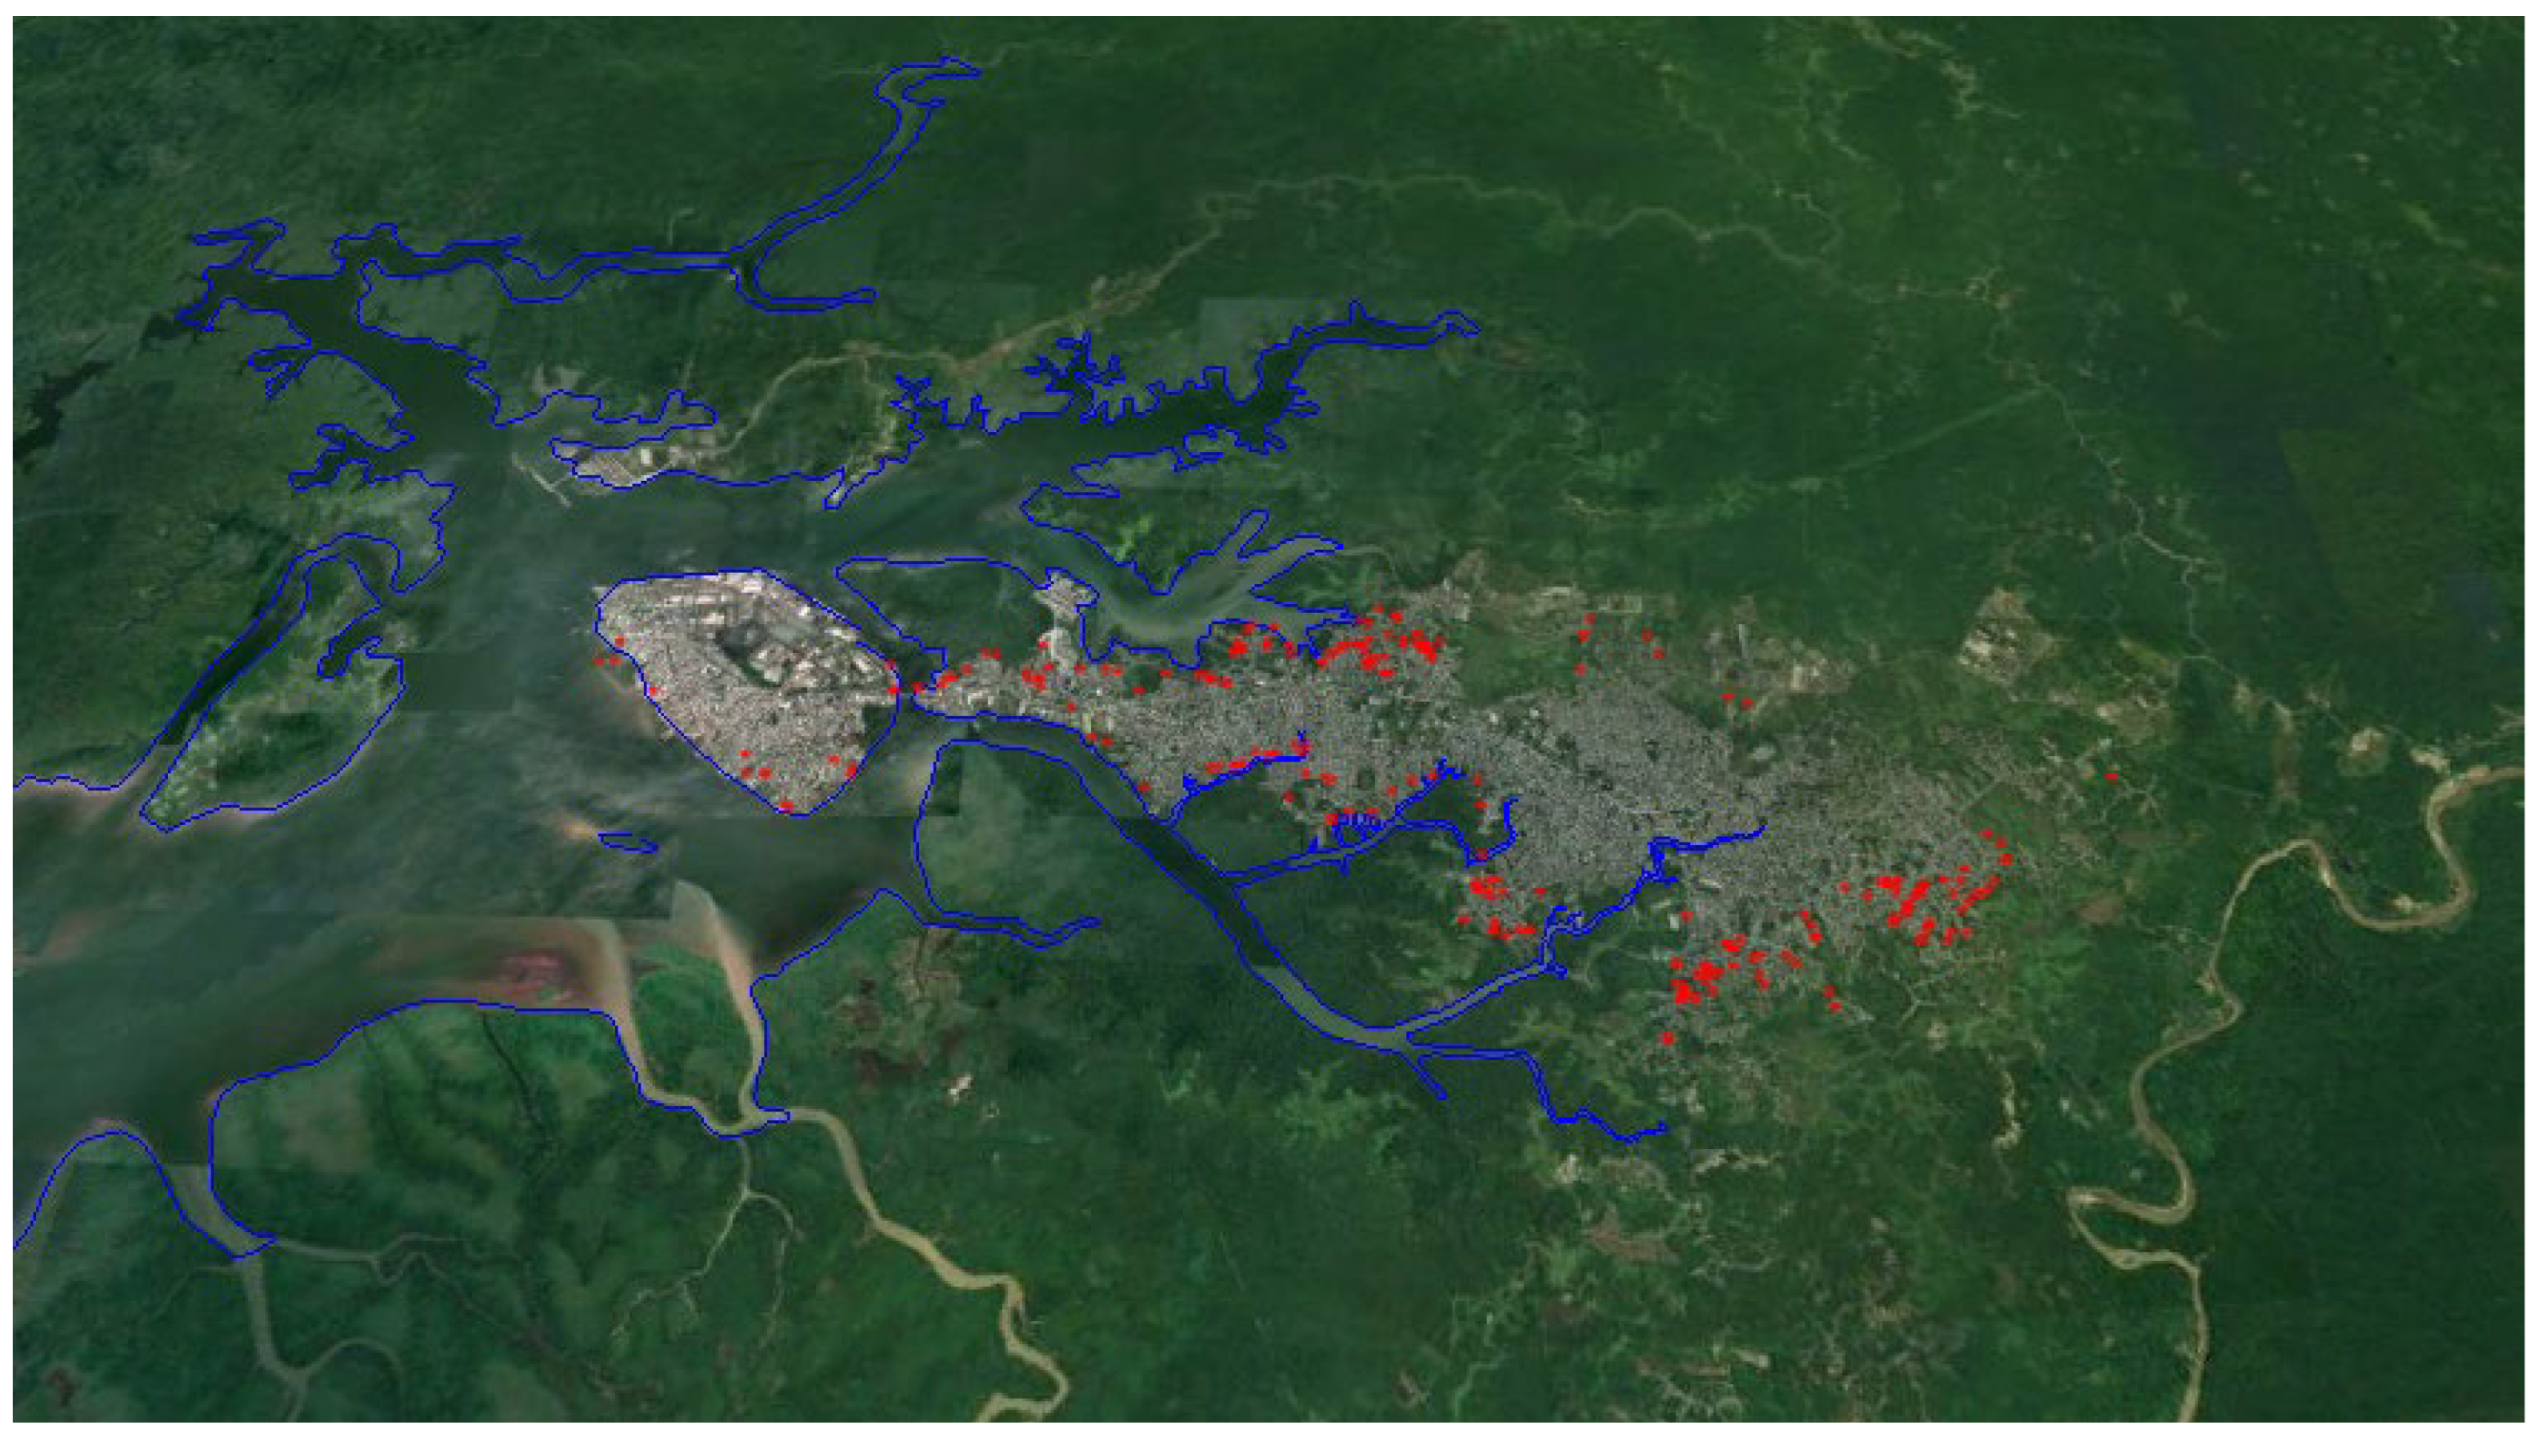
2.1. Study Area
2.2. Wastewater Characterization
| Discharge Type | Flow (L/S) | Amount Discharges | Total Flow (L/s) |
|---|---|---|---|
| Low | 0,74 | 316 | 233,84 |
| Medium | 1,01 | 252 | 254,52 |
| High | 1,62 | 127 | 205,74 |
2.2. Hydrodynamic and Water Quality Models Description
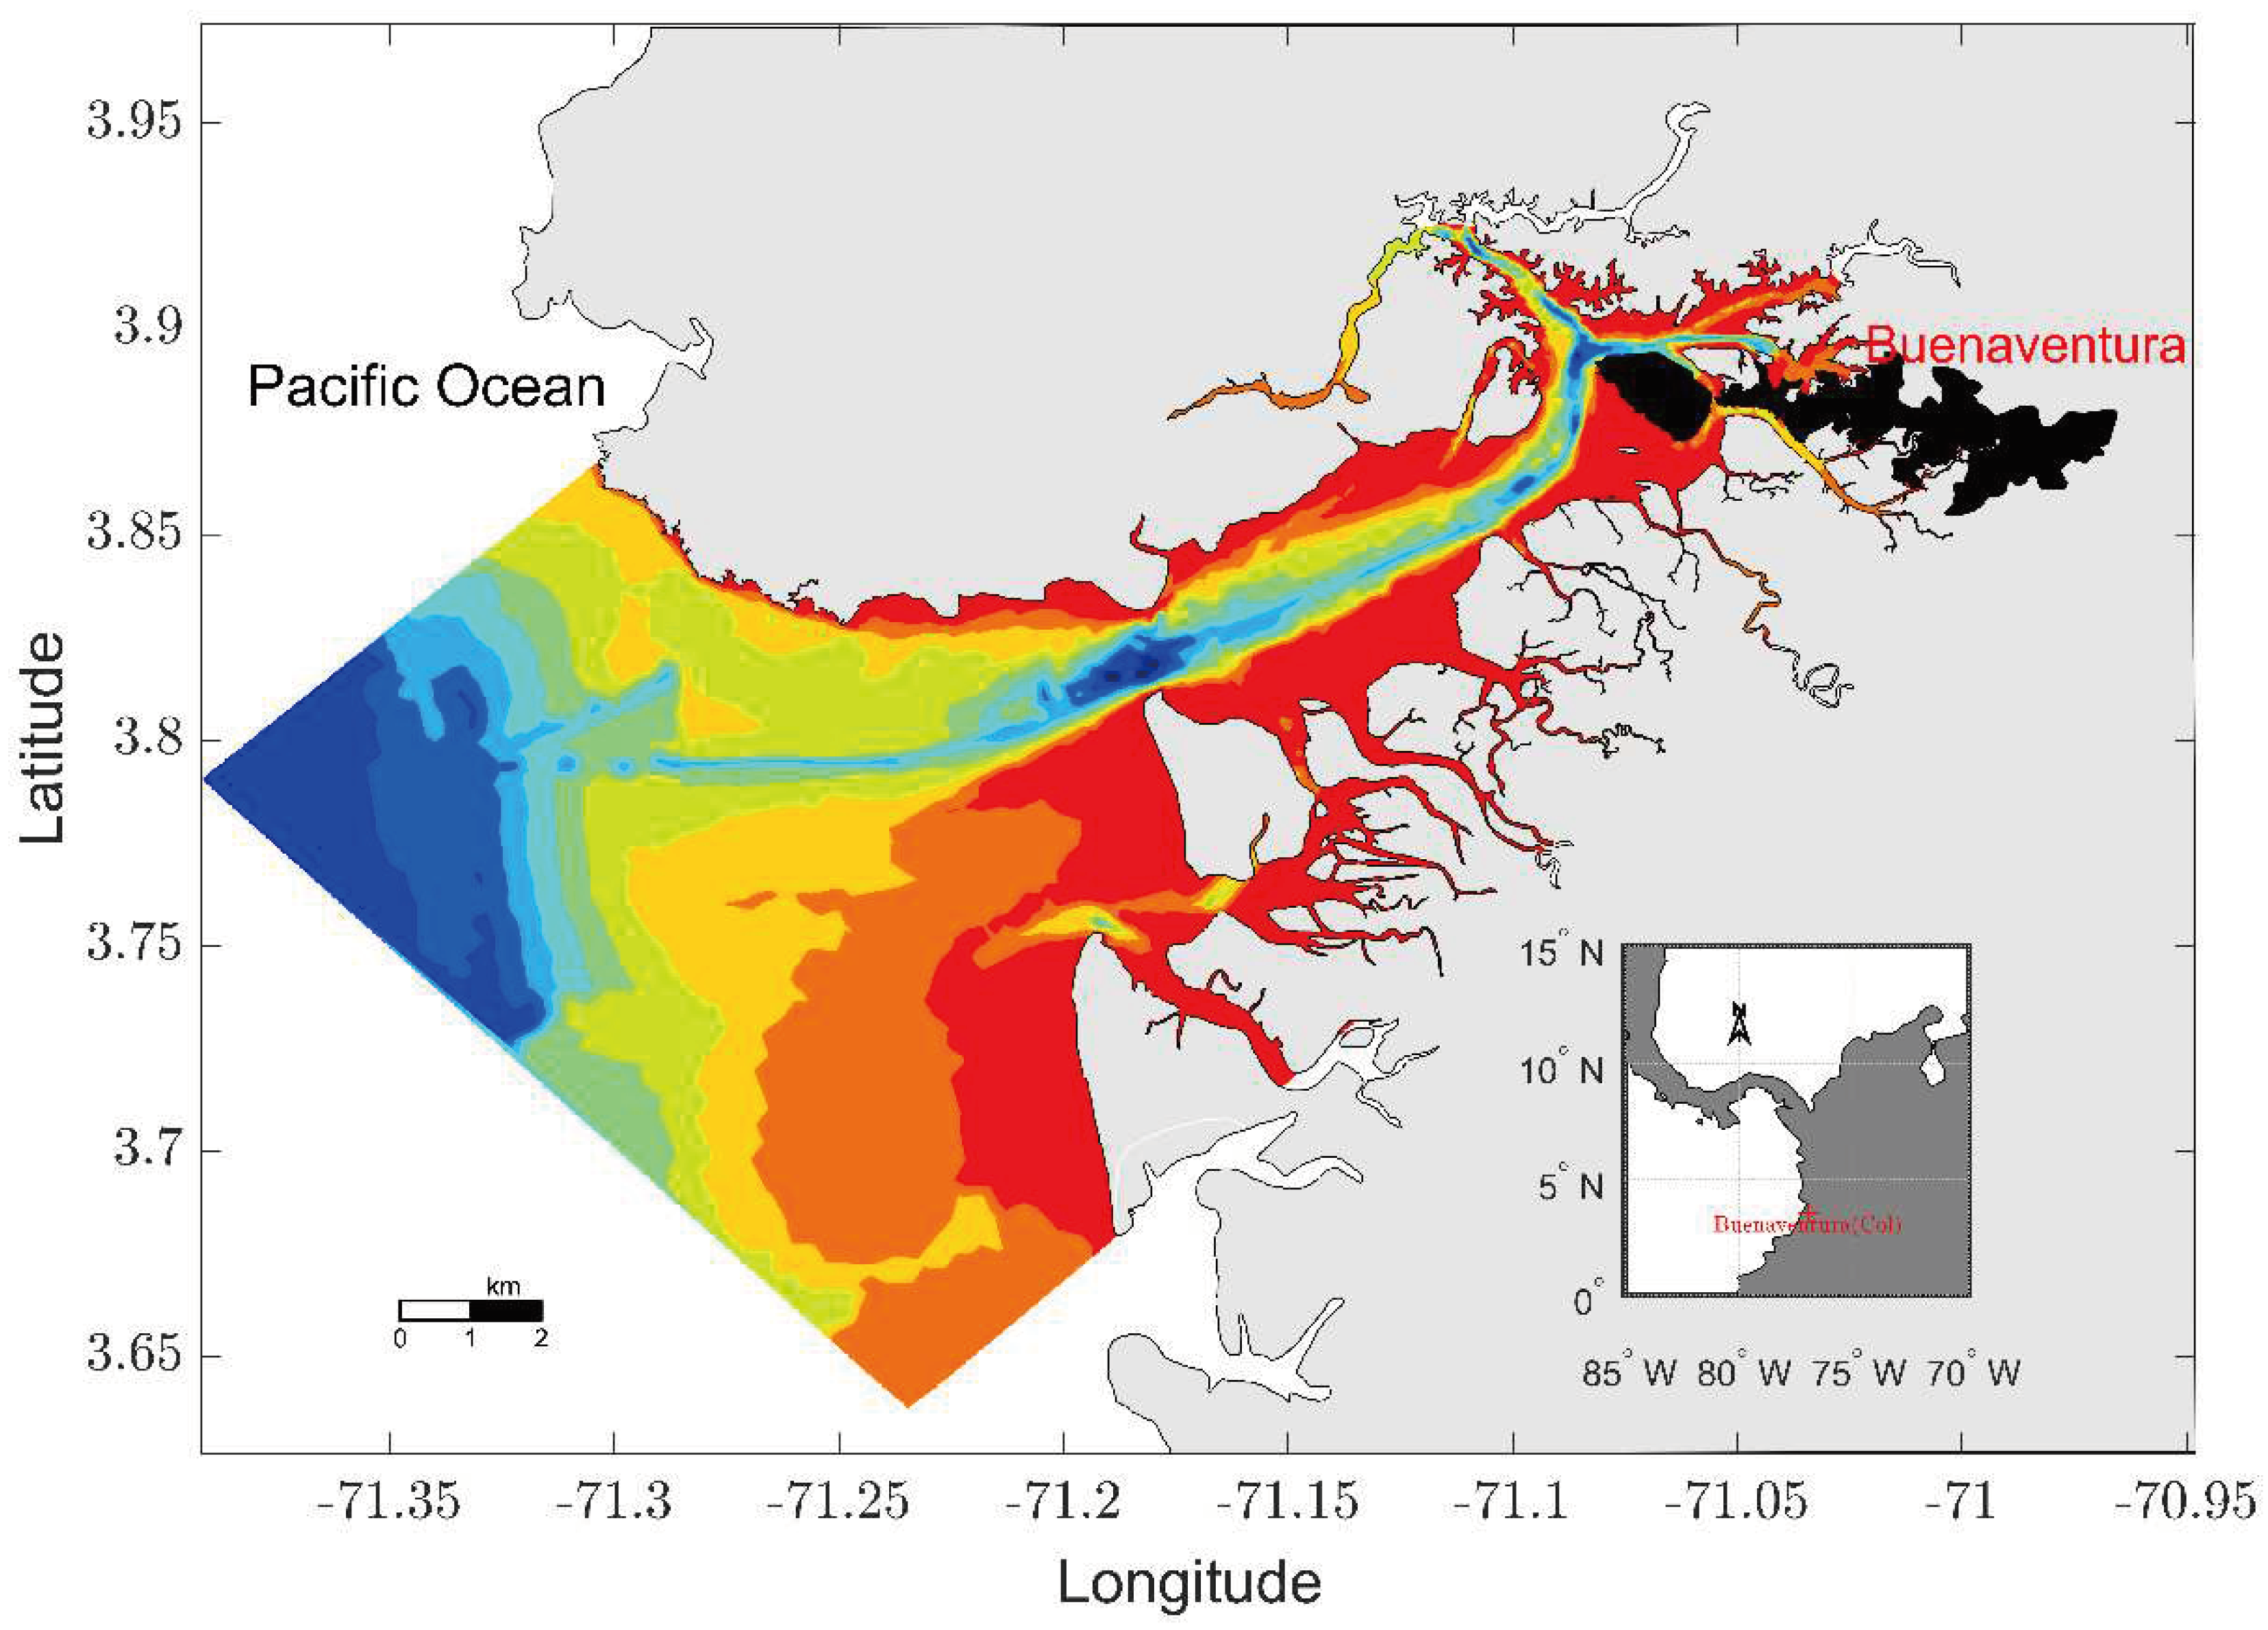
2.3. Model Set up for Buenaventura Bay
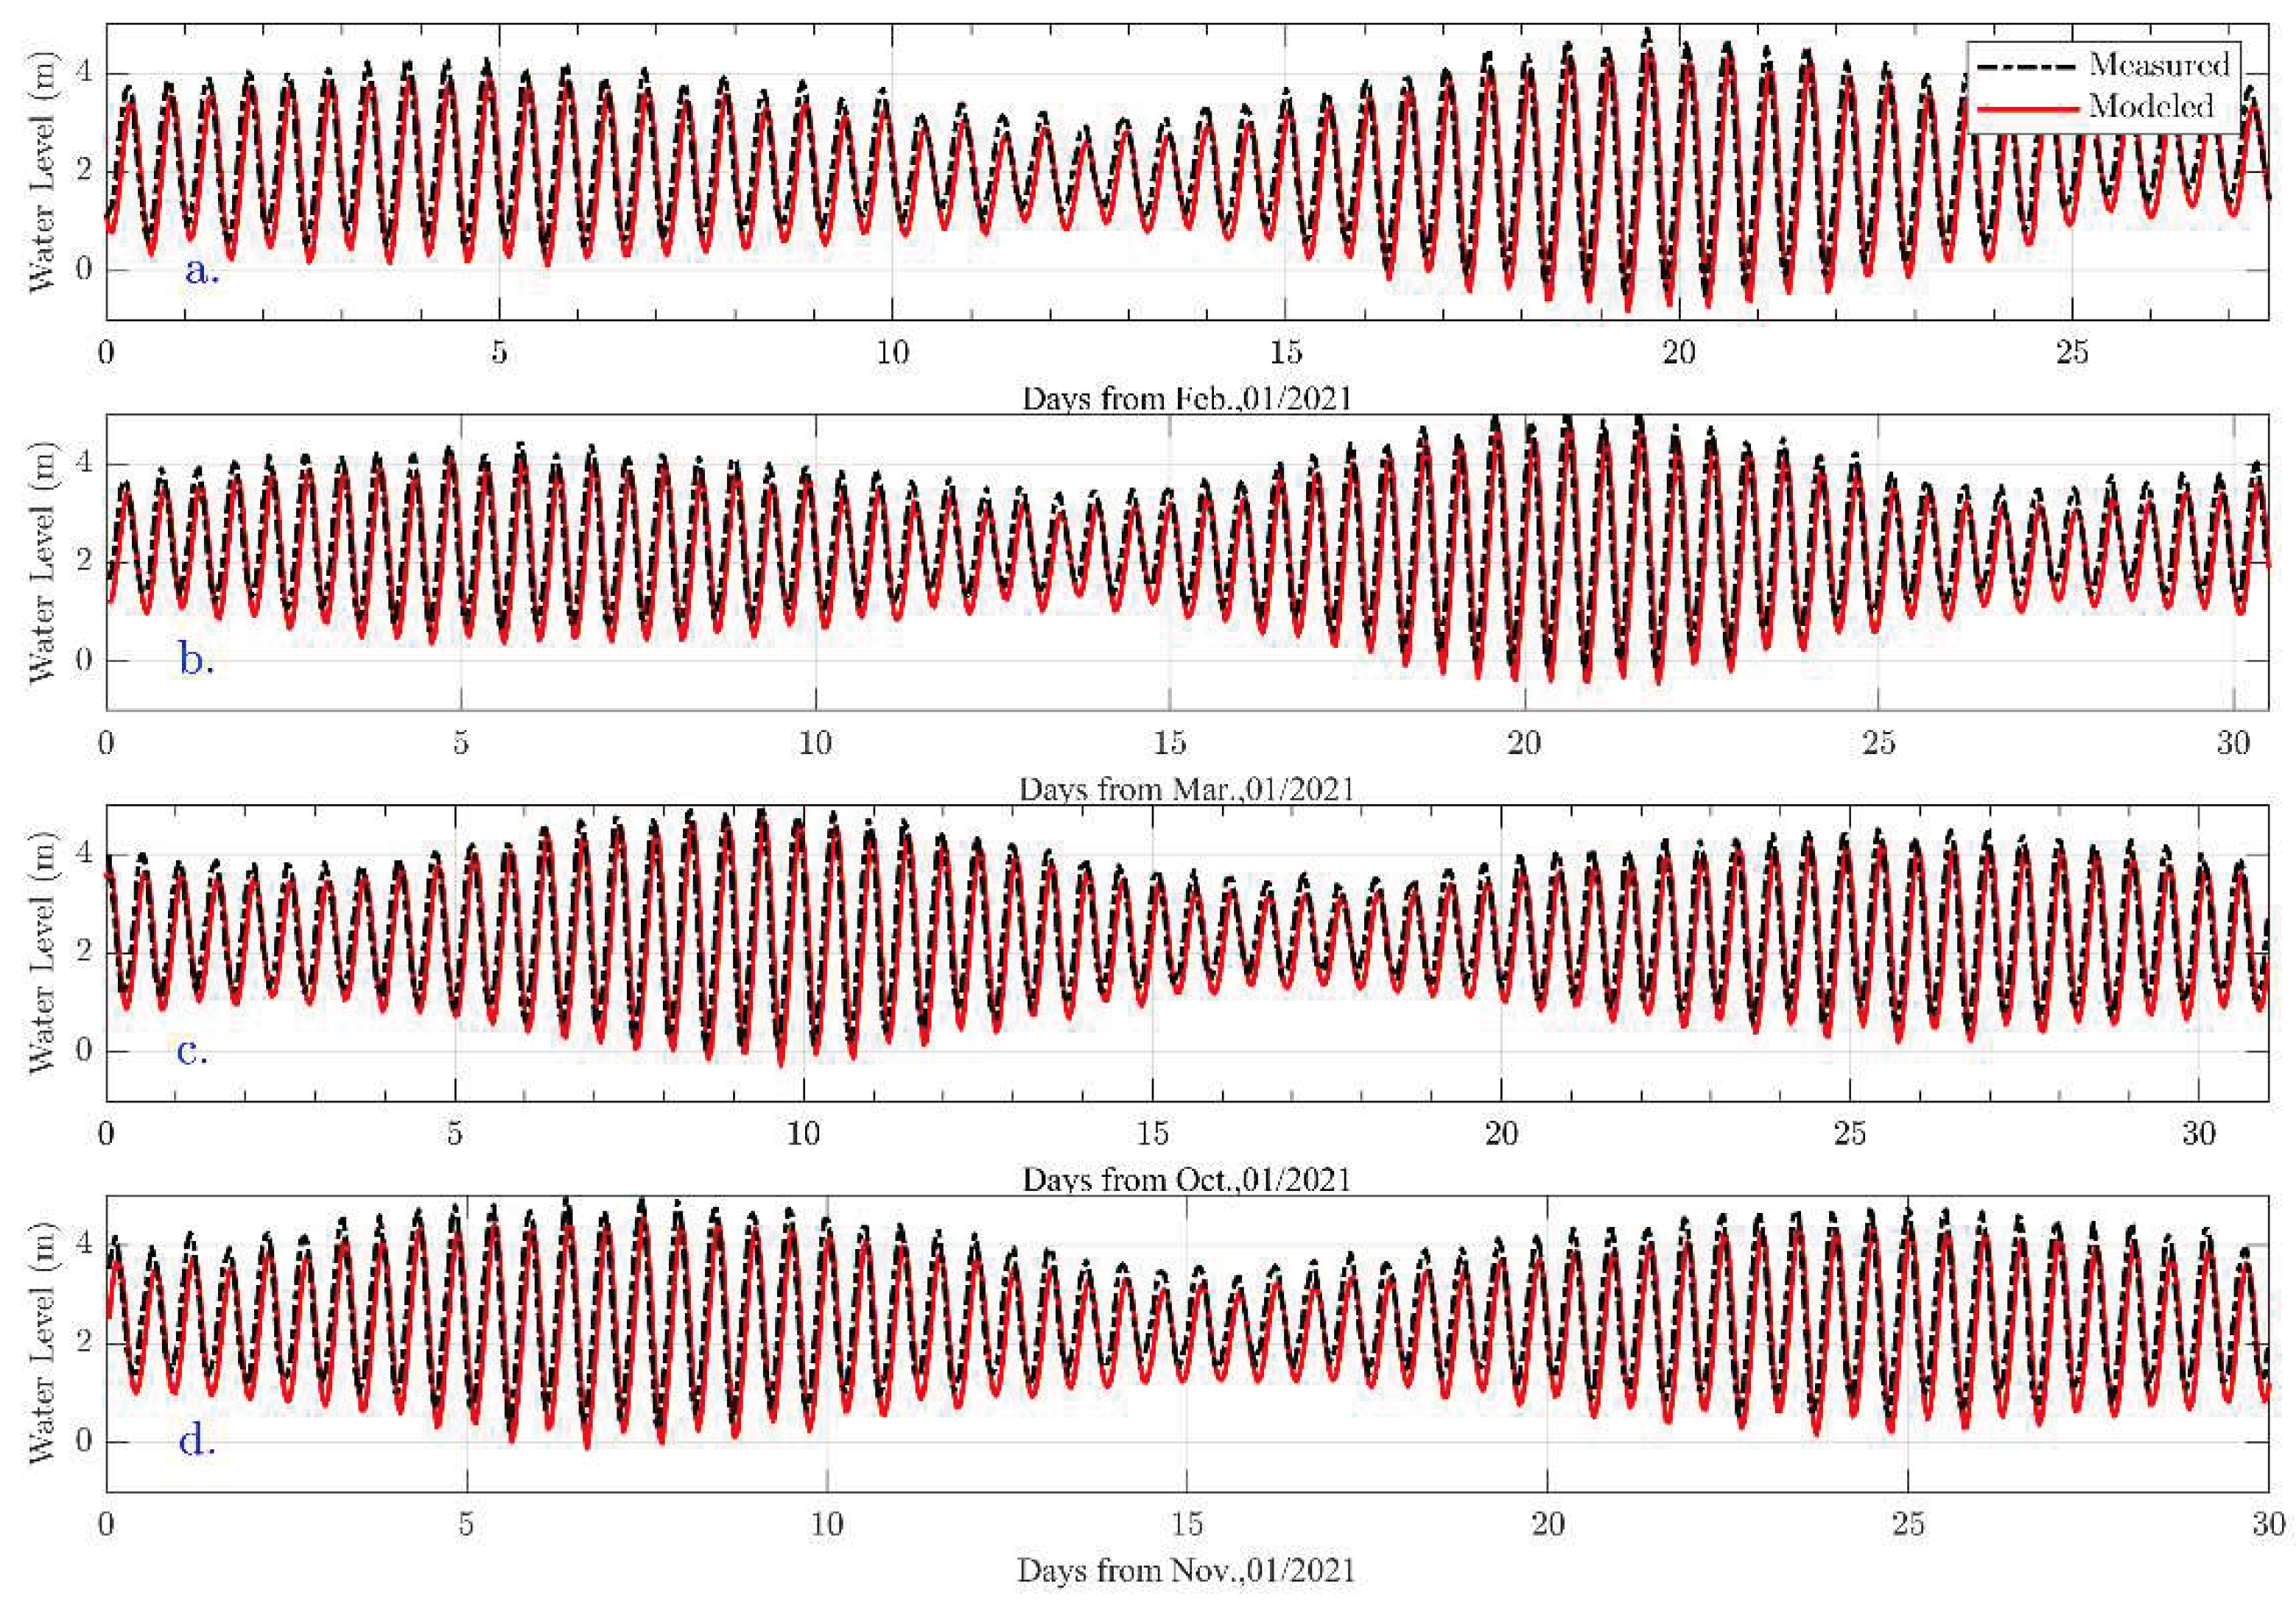
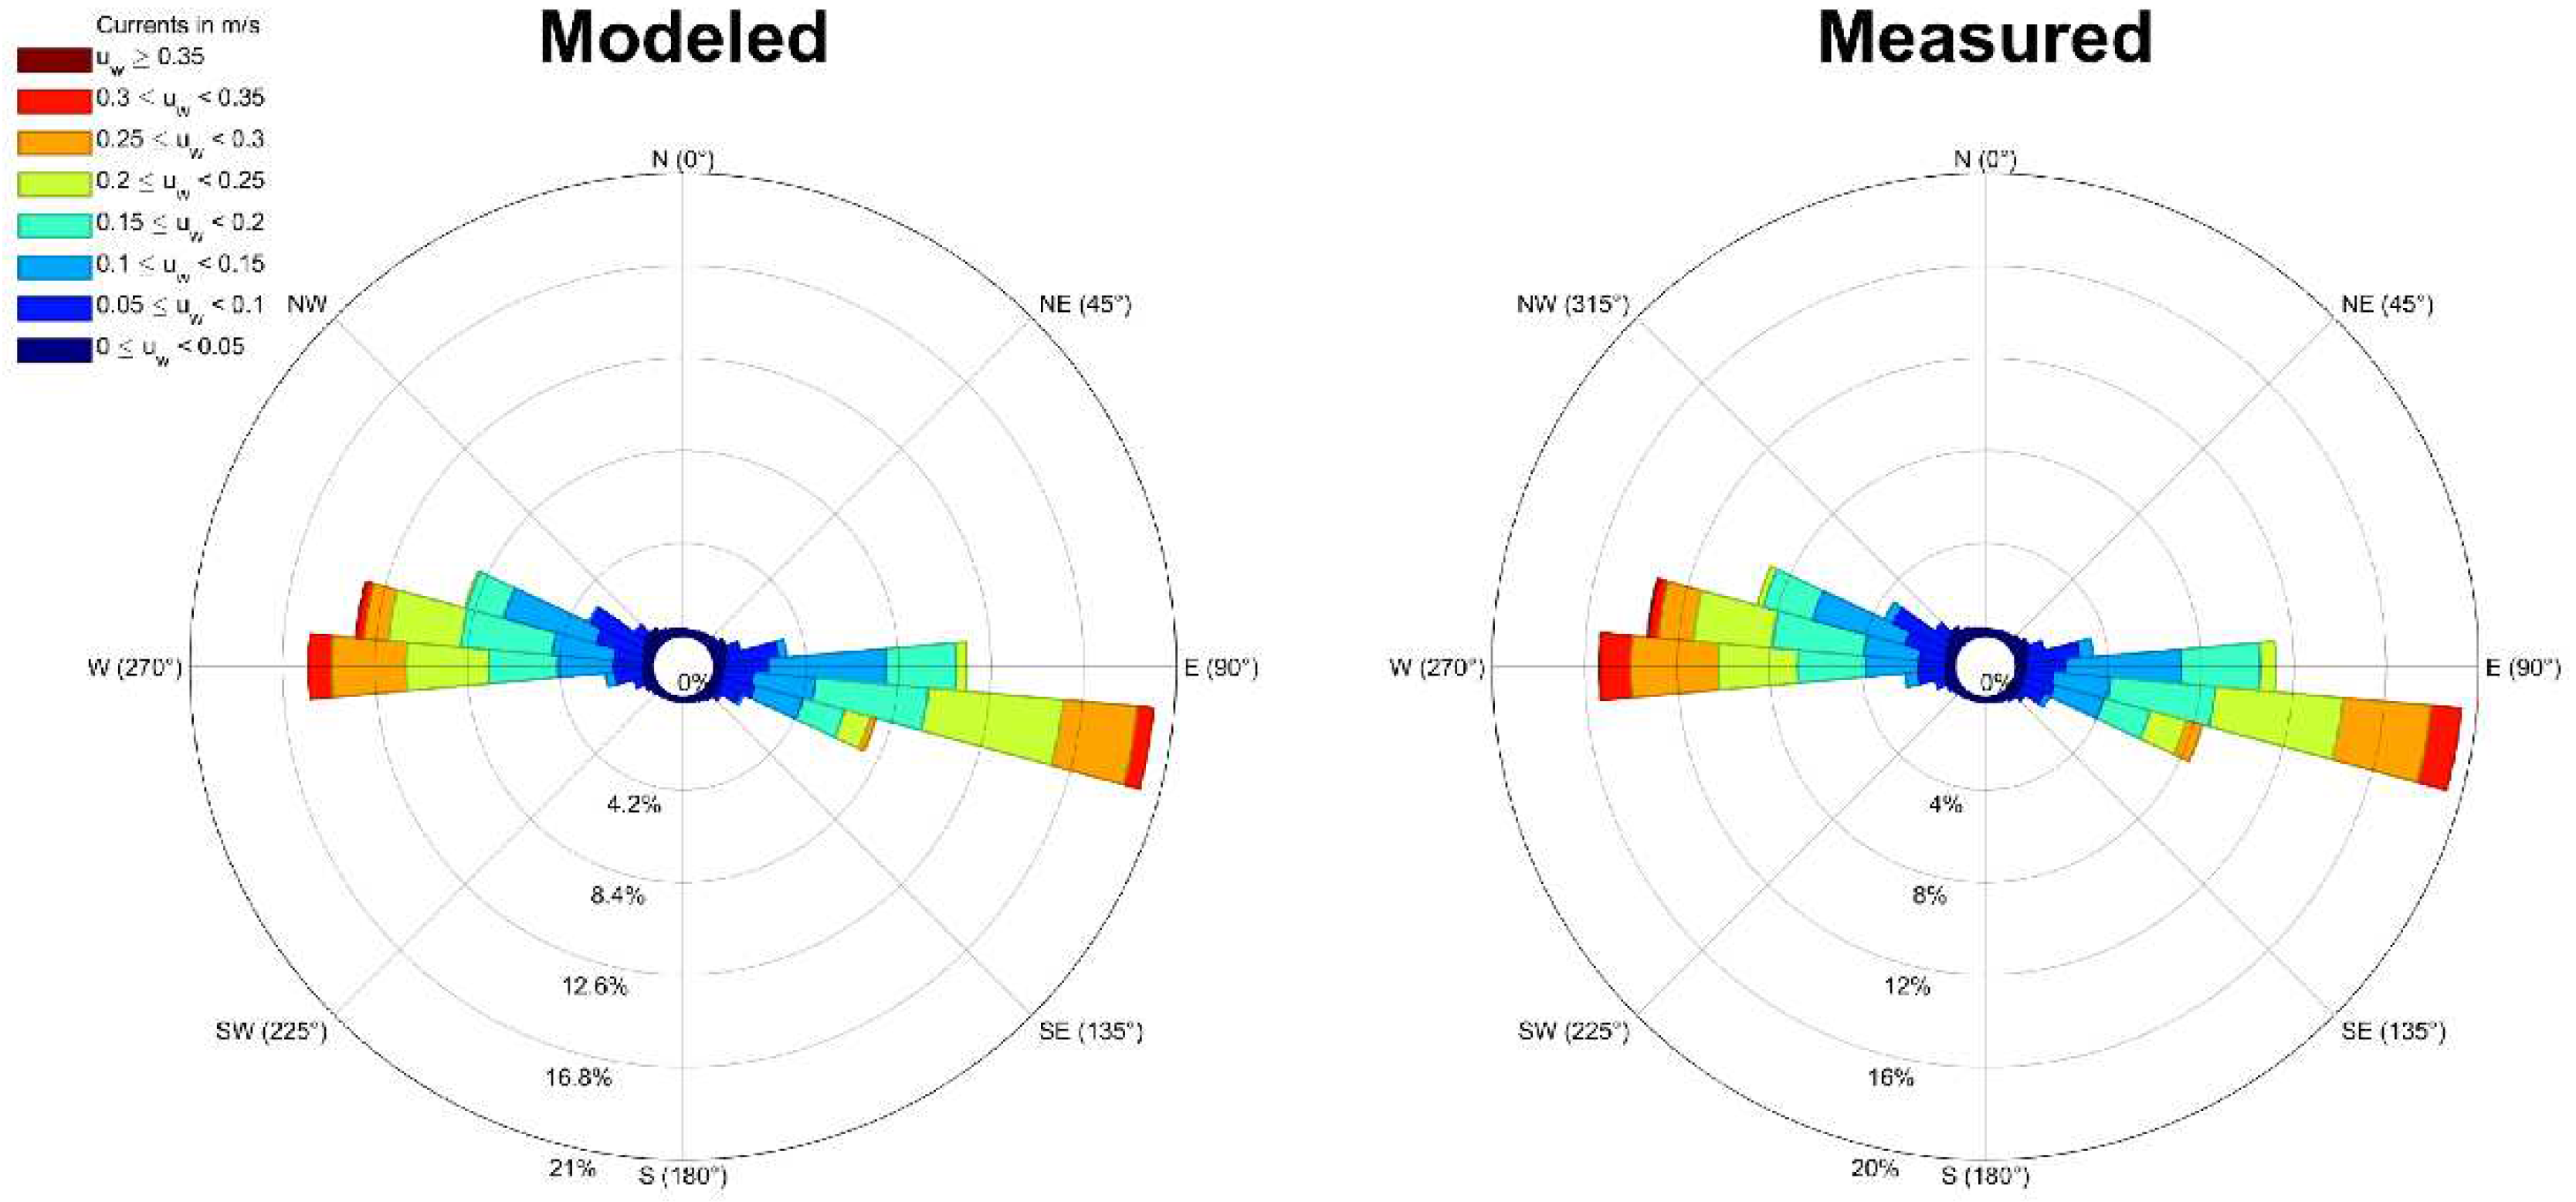
2.4. Calibration and Validation of Models
2.5. Wastewater Discharge Reduction Scenarios
3. Results
3.1. Characterization of Wastewater Discharges
| Parameter | Unit | Maximum | Mean | Minimum |
|---|---|---|---|---|
| Fecal Coliform | MPN/100mL | 2 × 10¹⁰ | 8 × 10⁸ | 7 × 10³ |
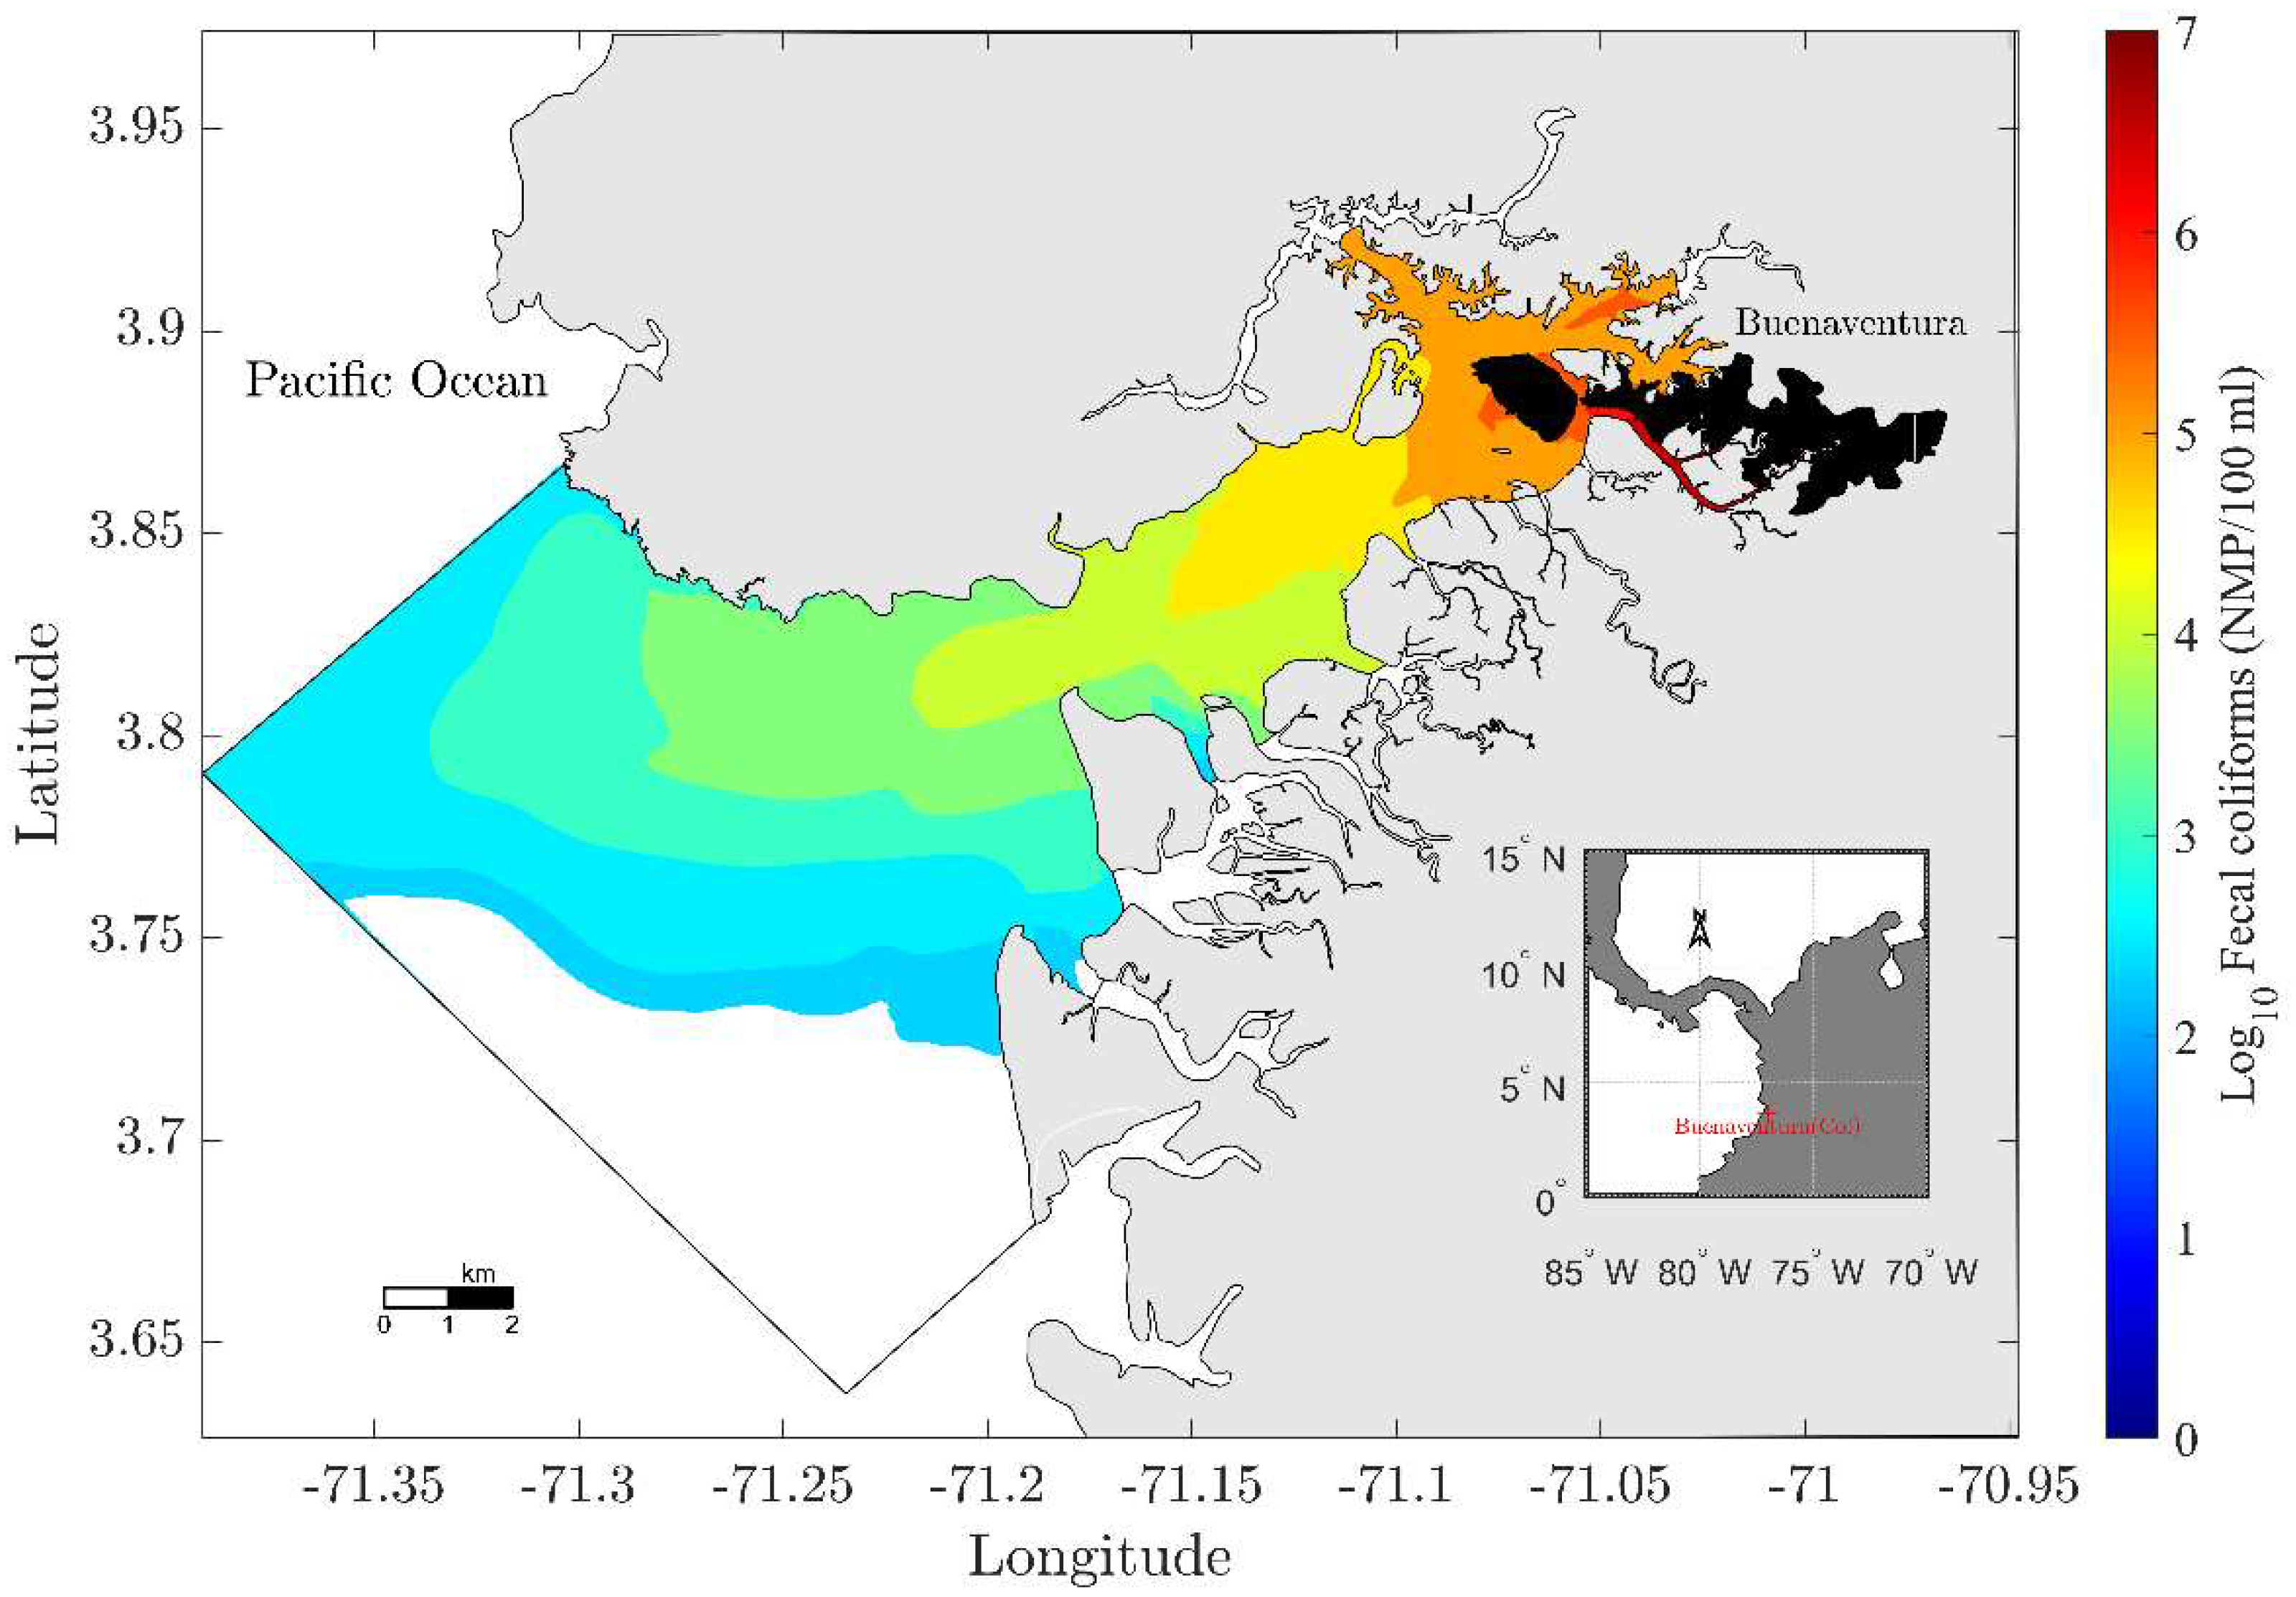
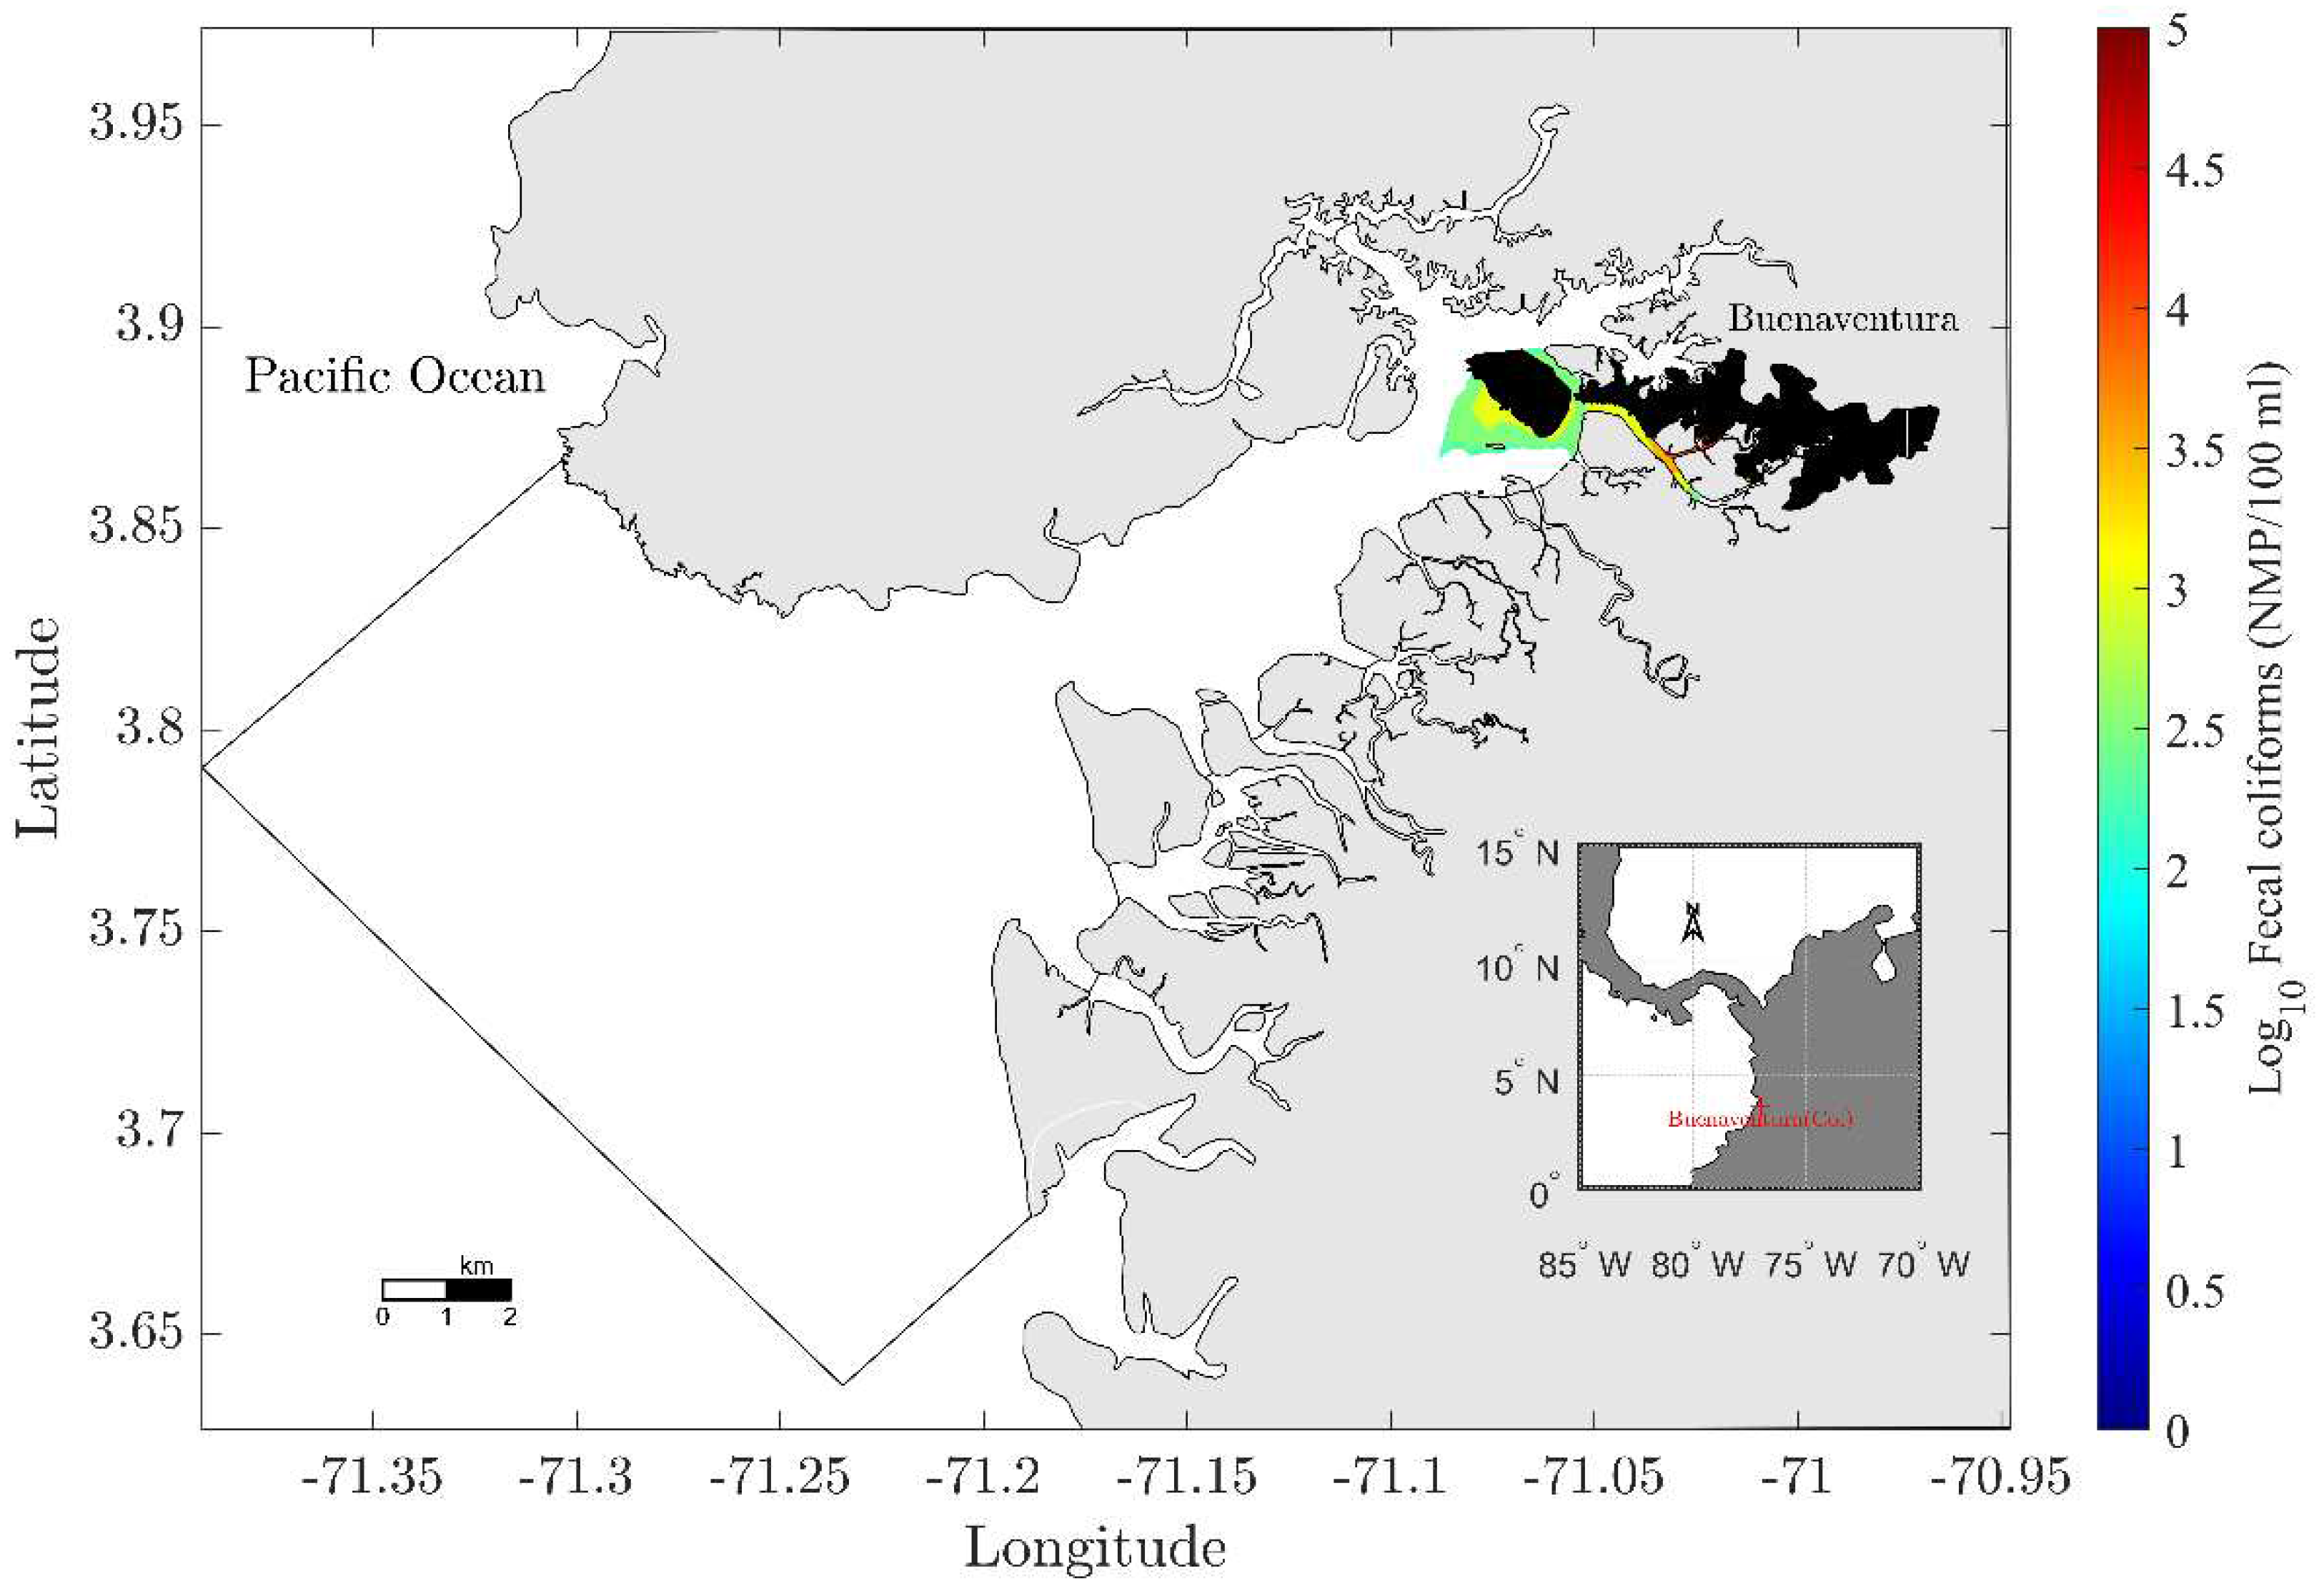
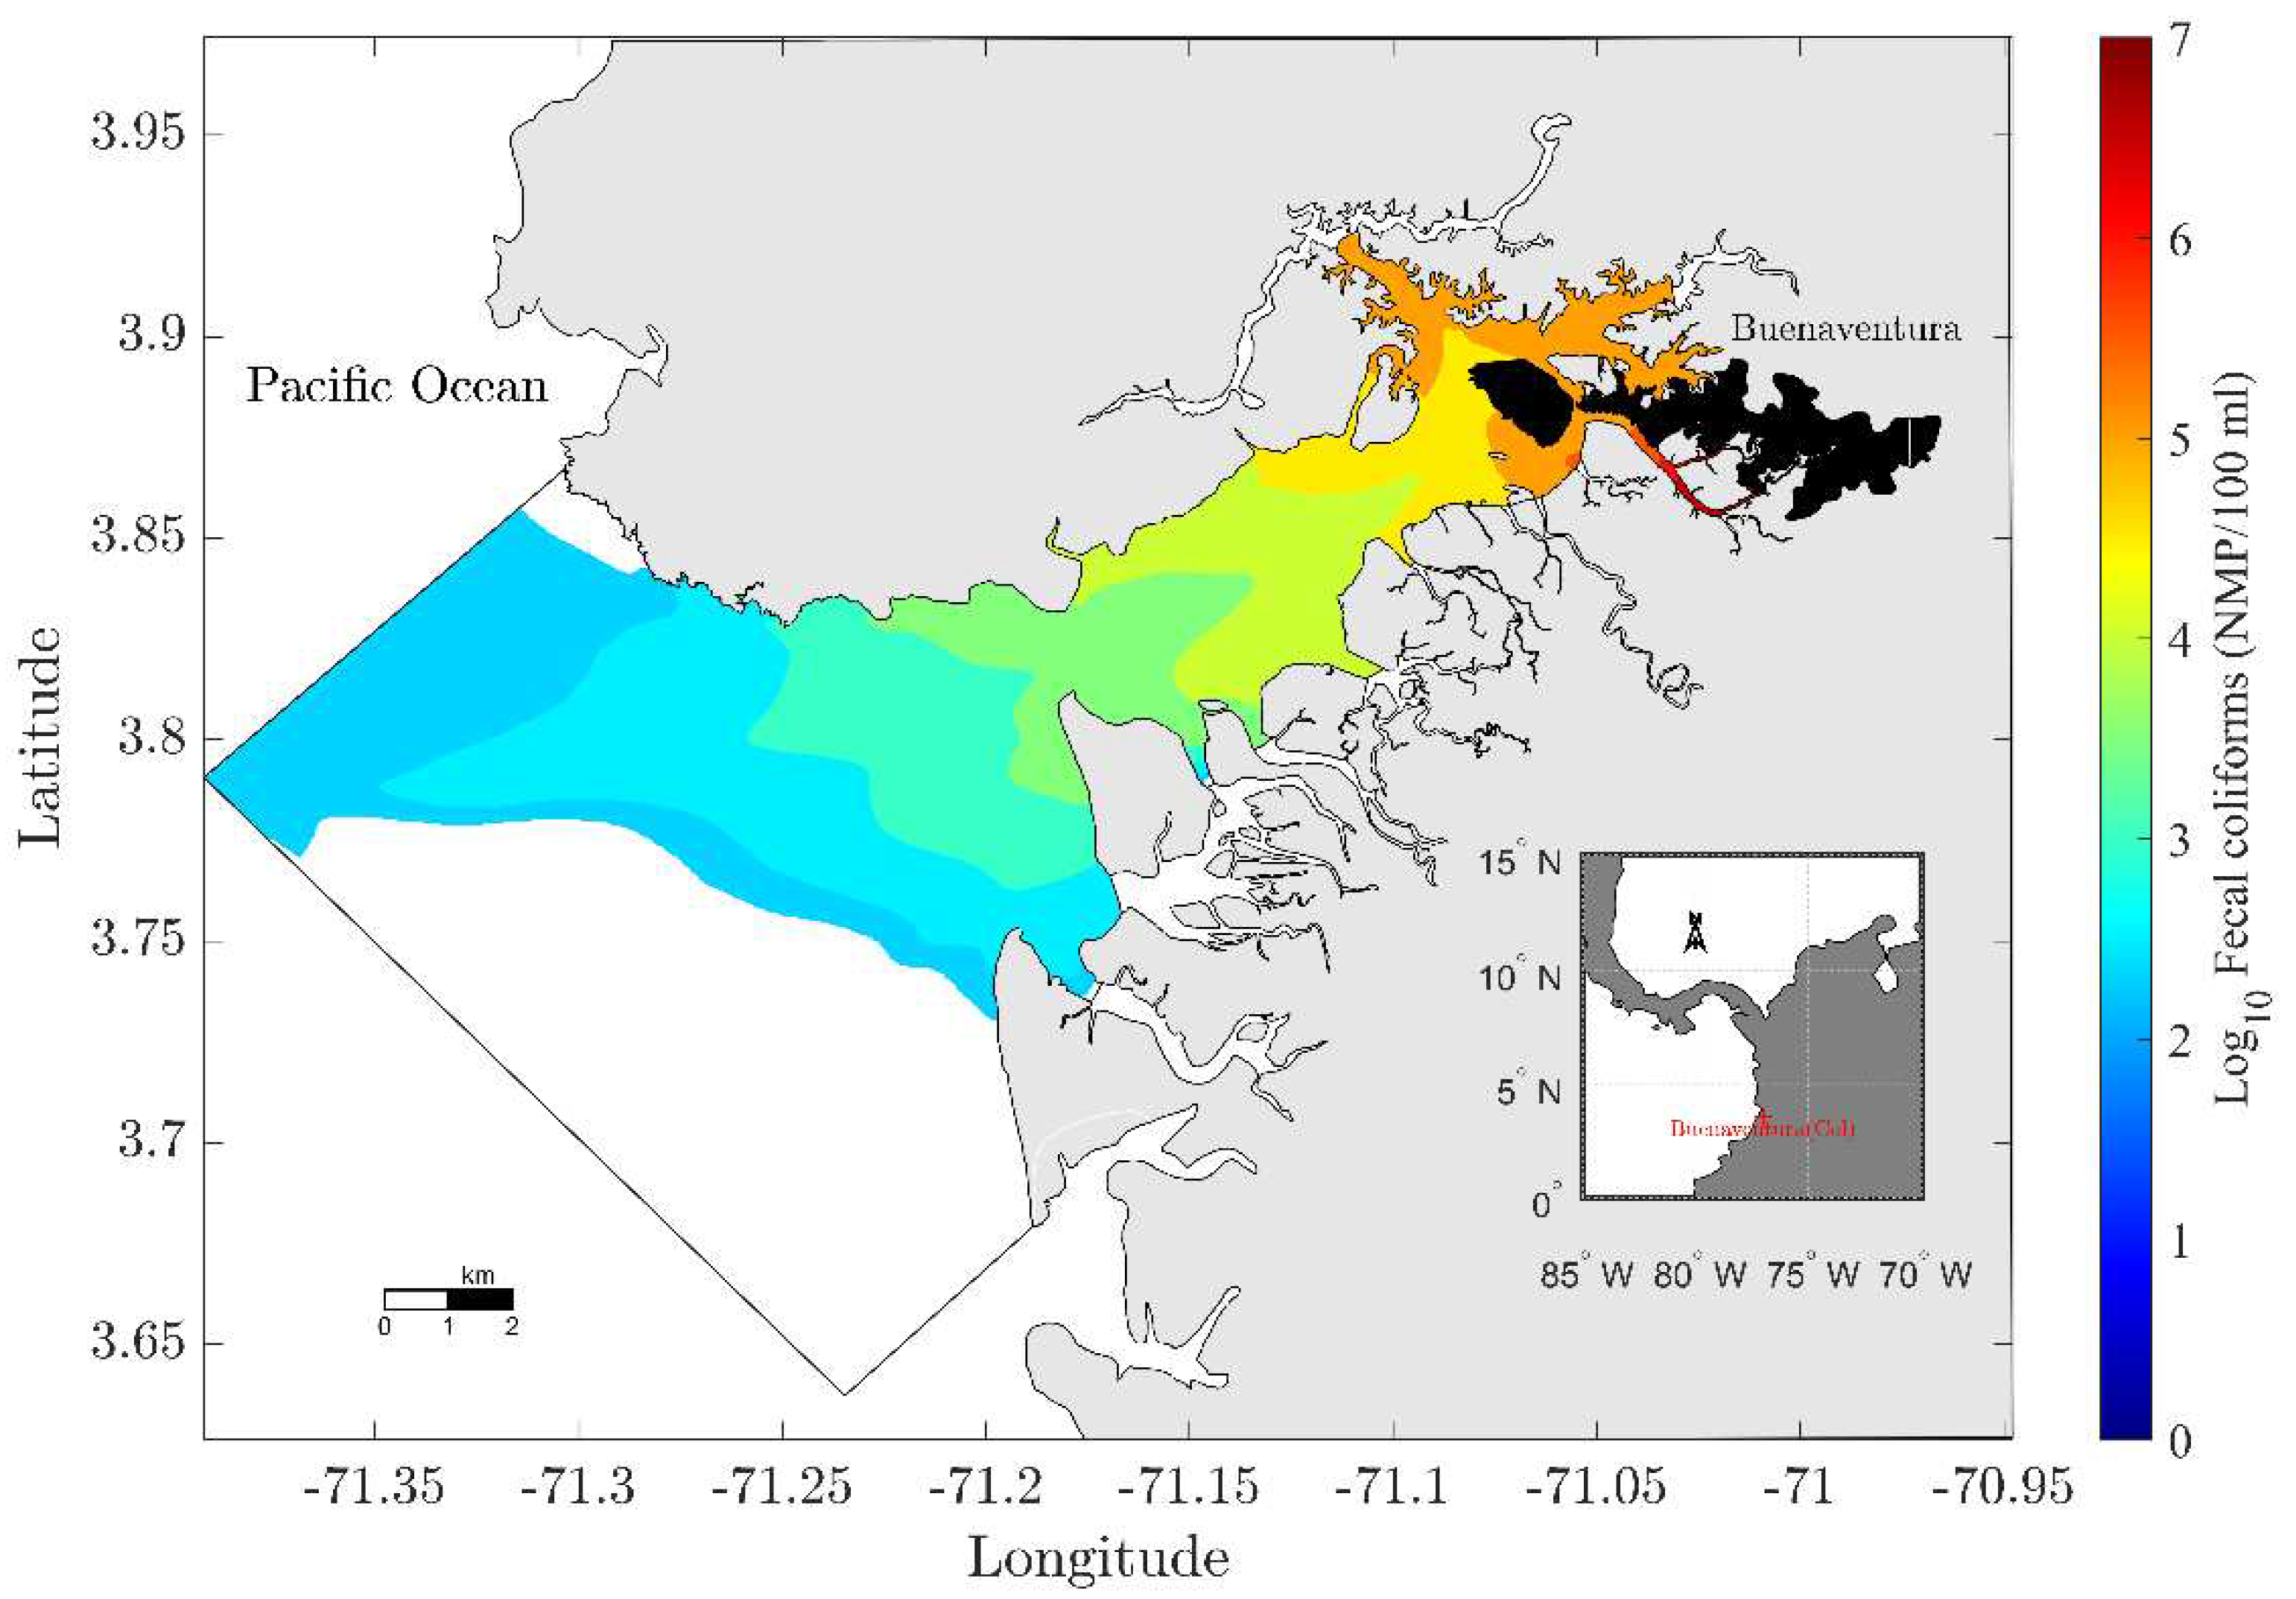
3.2. FC Concentration in the Water Column
| Unit | Maximum | Mean | Minimum | |
|---|---|---|---|---|
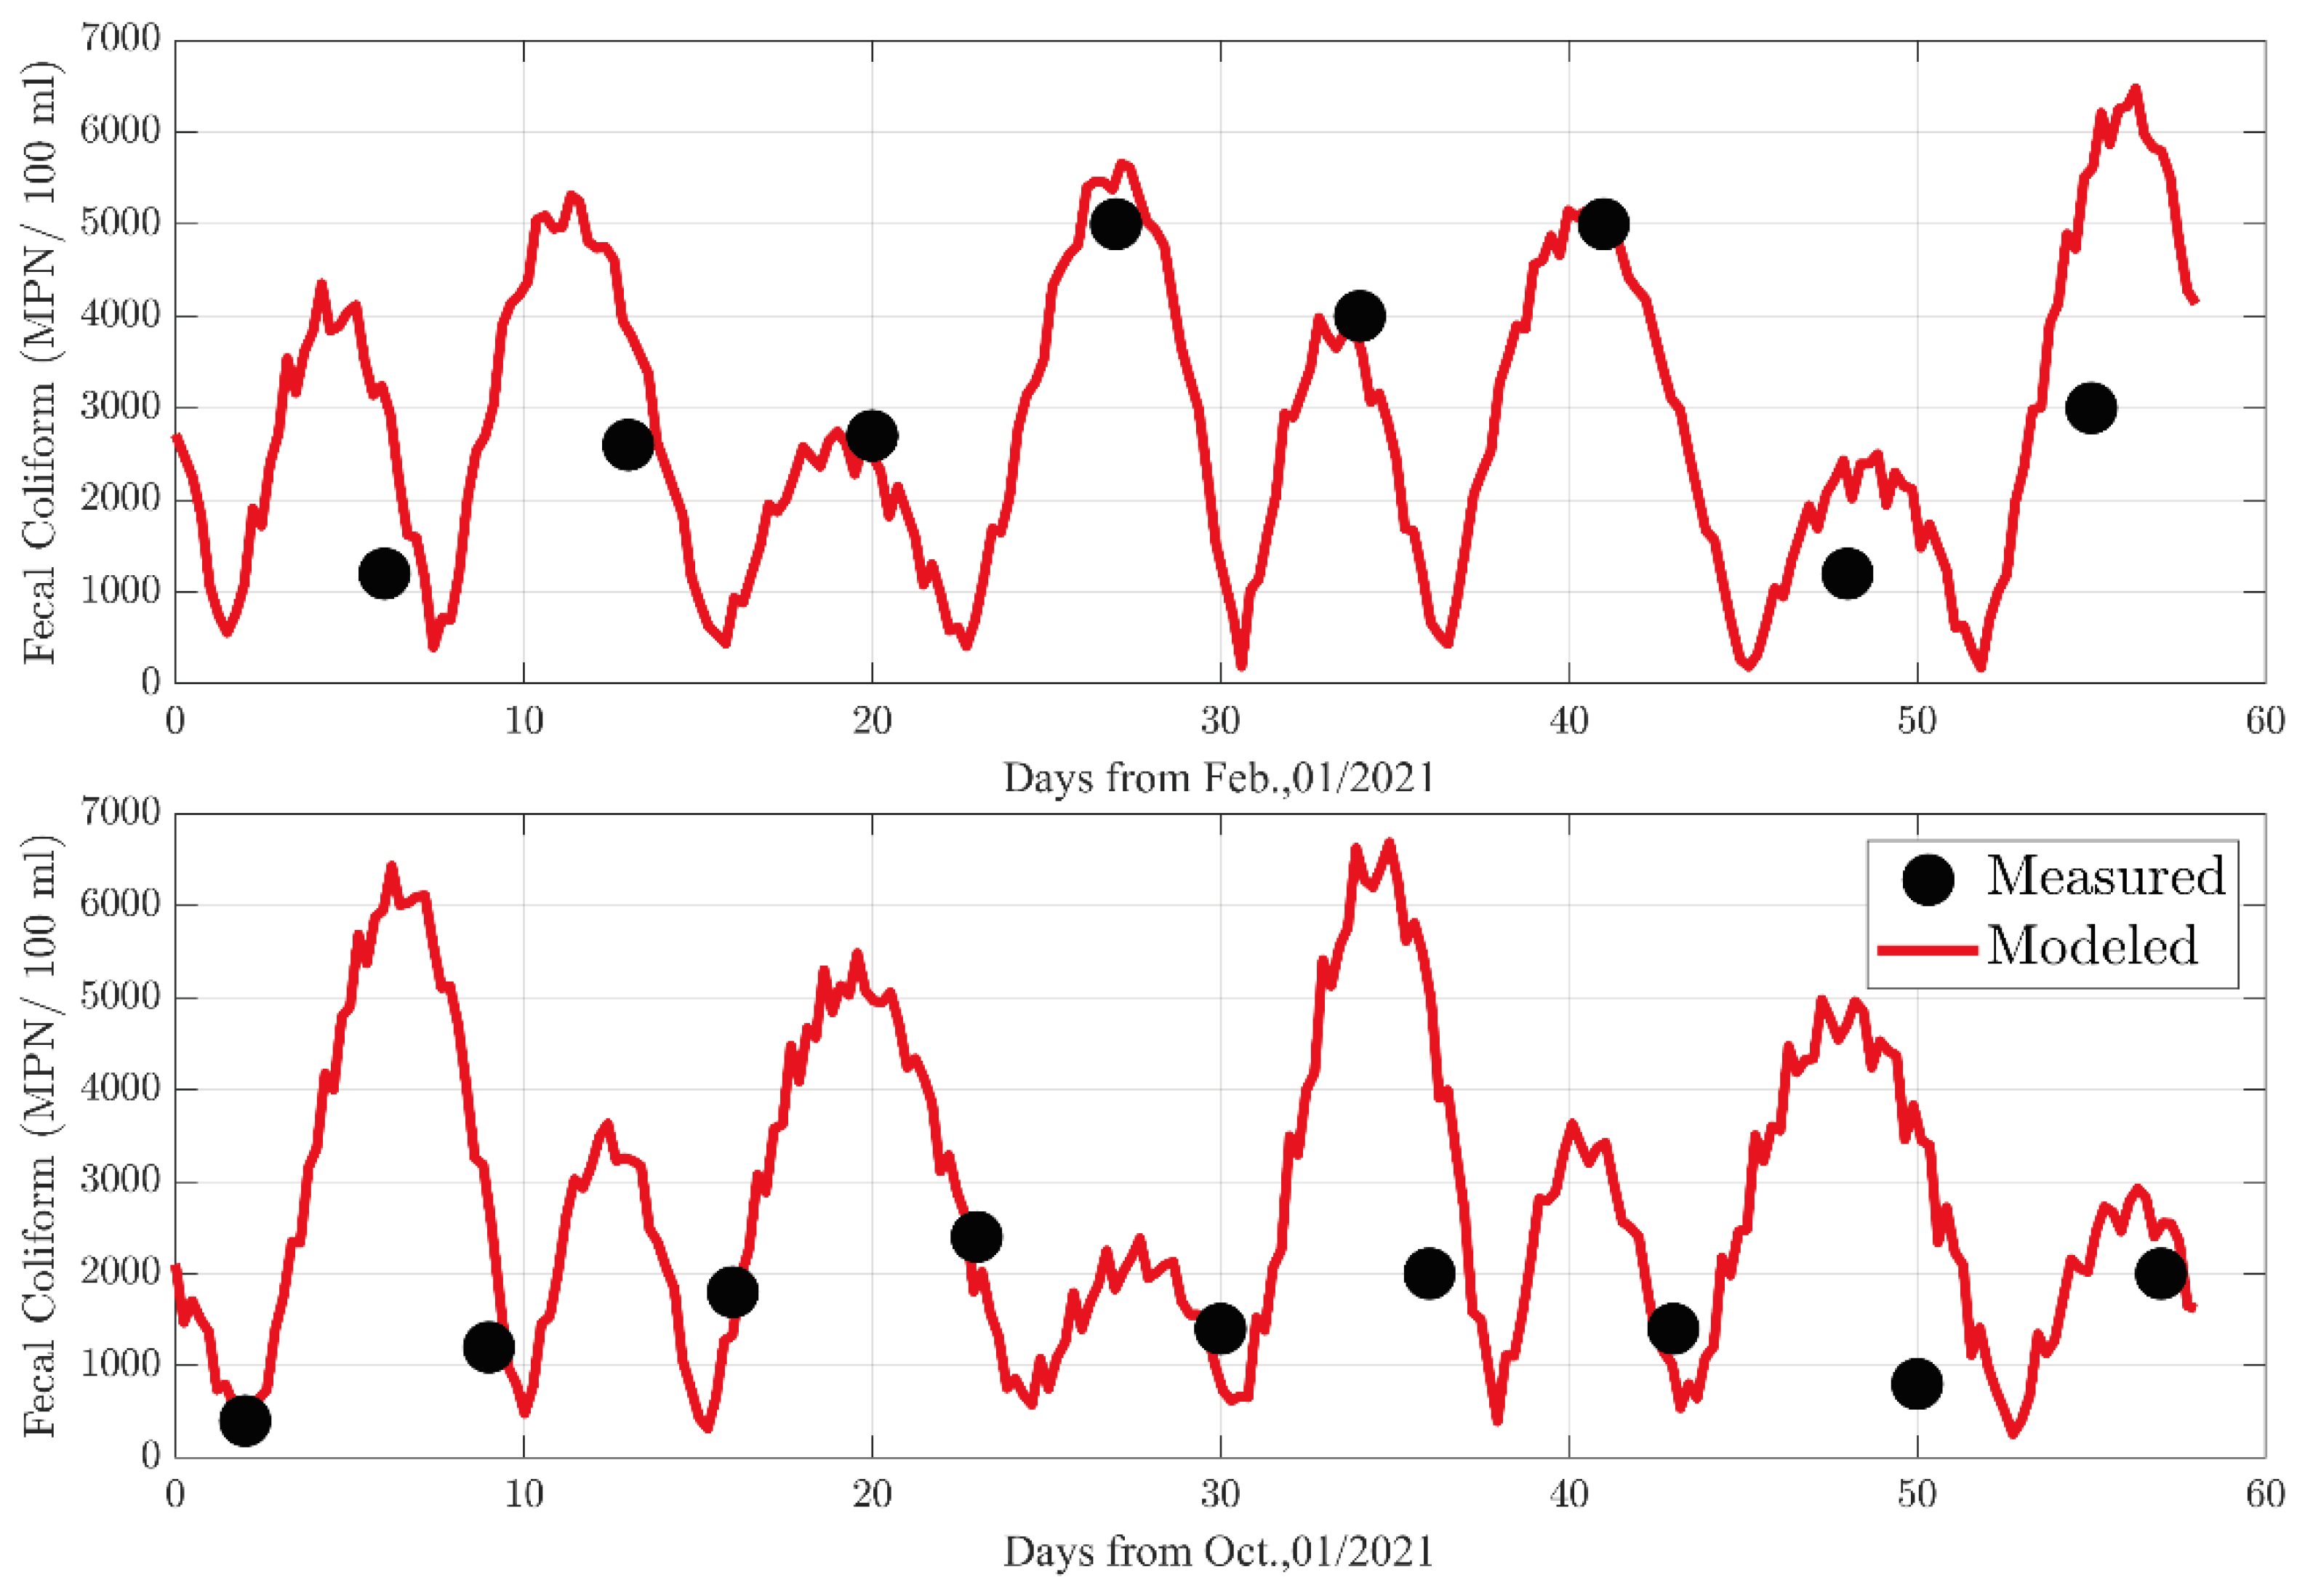
| calibration | MPN/100mL | 5× 10³ | 3 × 10³ | 1.2 × 10³ |
| validation | MPN/100mL | 2.4× 10³ | 1.4 × 10³ | 4× 10² |
3.3. Calibration Hydrodynamic Model
3.3.1. Sea Level
3.3.3. Water Quality Model
3.3.2. Currents

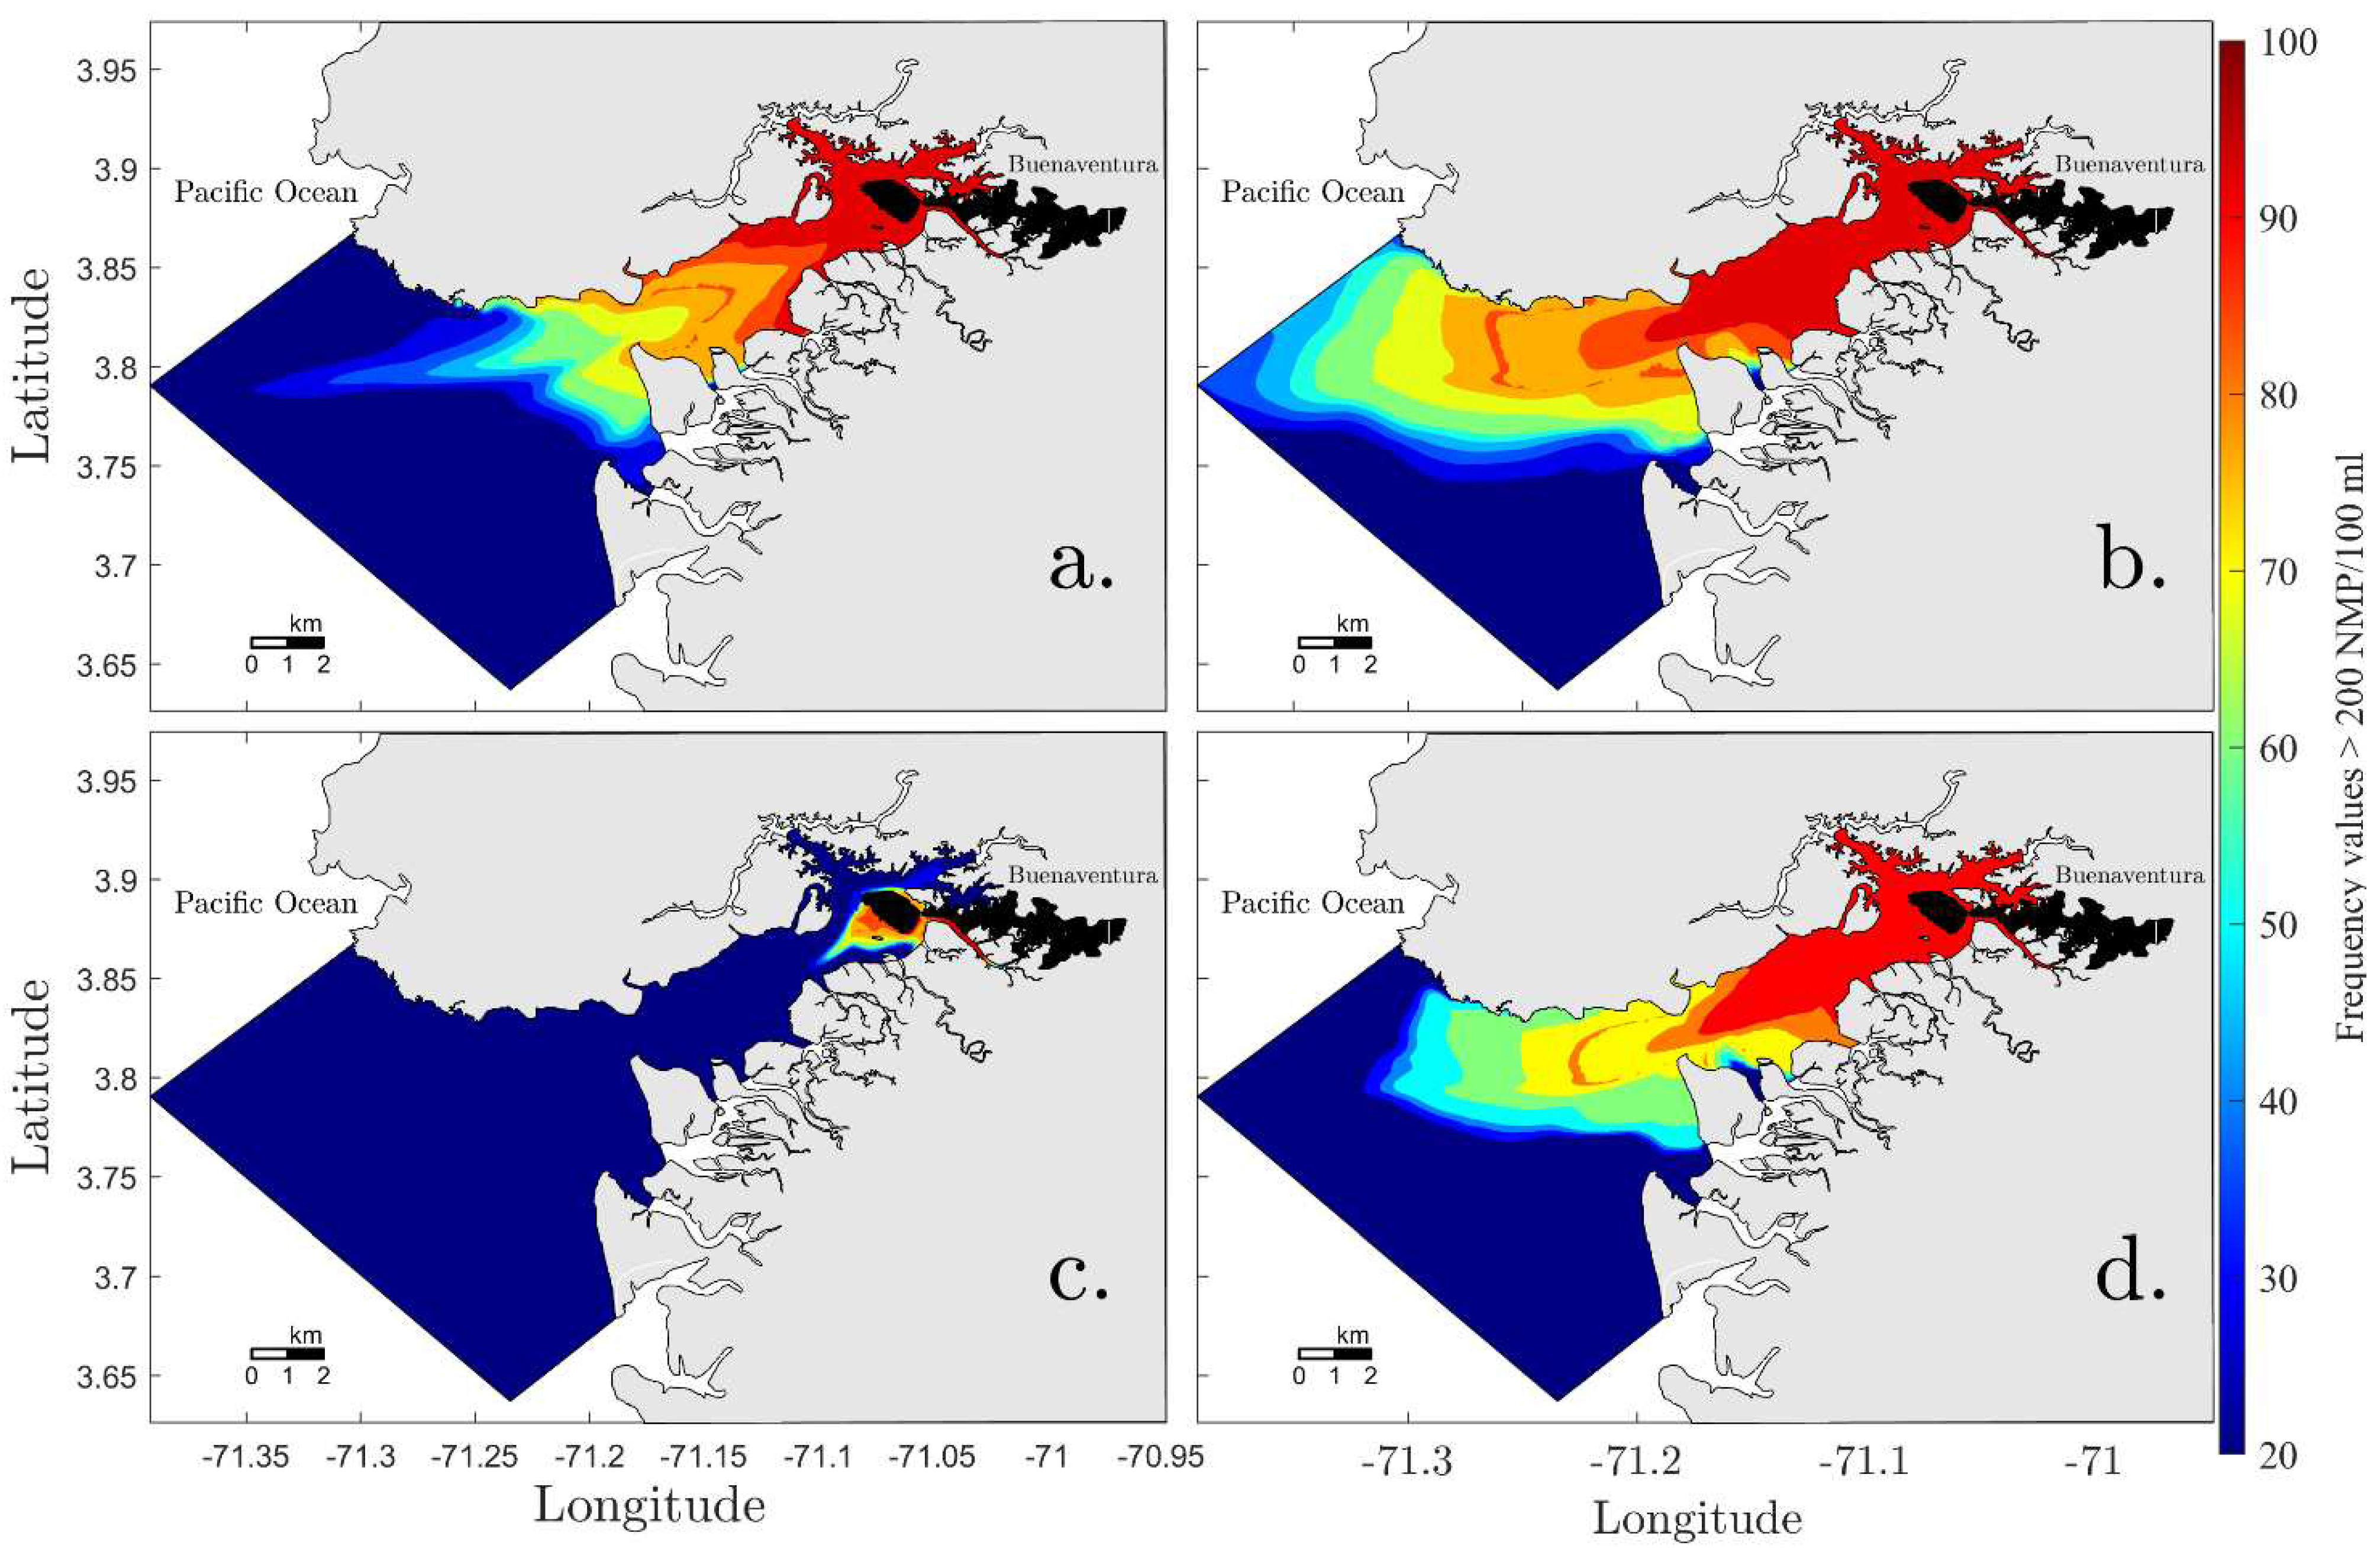
3.3.4. Discharge Reduction Scenario
4. Discussion
Author Contributions
Funding
Conflicts of Interest
References
- Superintendencia de Transporte. Ministerio de Transporte. Boletín estadístico tráfico portuario en Colombia año 2020. Available online: https://www.supertransporte.gov.co/documentos/2021/Febrero/Puertos_04/BOLETIN-TRAFICO-PORTUARIO-2020.pdf. (accessed on 20 October 2022).
- DANE. Available online: https://www.dane.gov.co/files/investigaciones/planes-desarrollo-territorial/100320-Info-Alcaldia-Buenaventura.pdf. (accessed on 20 October 2022).
- Gallego, B.E.; Josephraj, J. Evaluation of coastal vulnerability for the District of Buenaventura, Colombia: A geospatial approach. Remote Sensing Applications: Society and Environment 2019, 16, 1–16. [Google Scholar] [CrossRef]
- Otero, J.L. Determinación del régimen medio y extremal del nivel del mar para la bahía de Buenaventura. Boletín Científico CCCP 2004, 11, 30–41. [Google Scholar] [CrossRef] [PubMed]
- Alonso, D.; Ramírez, L.F.; Segura- Quintero, C.; Castillo-Torres, P.; Díaz, J.M.; Walschburger, T.; Arango, N. Informe Técnico: Planificación ecorregional para la conservación in situ de la biodiversidad marina y costera en el Caribe y Pacifico continental colombiano, INVEMAR Serie de documentos generales No. 41., 1st ed.; INVEMAR: Santa Marta, Colombia, 2009; 106p. [Google Scholar]
- INVEMAR. Informe diagnóstico de la situación ambiental marina de la bahía de Buenaventura-Isla cascajal y las playas de Juanchaco, Ladrilleros y La Bocana. Available online: https://alfresco.invemar.org.co/share/s/sF3nl3iCRWa1THm9Dmc5-g. (accessed on 17 September 2022).
- Instituto de Hidrología, Meteorología y Estudios Ambientales (IDEAM). Estudio Nacional del Agua 2018. Bogotá: IDEAM. Available online: https://www.andi.com.co/Uploads/ENA_2018-comprimido.pdf. (accessed on 5 October 2021).
- Espinosa, S.; Delgado, B.; Orobio, L.M.; Mejía-Ladino, L.; Gil-Agudelo, D. Estado de la población y valoración de algunas estrategias de conservación del recurso piangüa Anadara tuberculosa (Sowerby) en sectores de Bazány Nerete, costa Pacífica nariñense de Colombia. Boletín de Investigaciones Marinas y Costeras 2010, 39, 161–176. [Google Scholar] [CrossRef]
- Vivas-Aguas, L.; Vargas-Morales, M.; Guillen, K.; Villarraga, D.; Sánchez, D. Vulnerabilidad de la población costera frente a la contaminación orgánica y microbiológica en la bahía de Buenaventura; Serie de publicaciones generales del Invemar; No. 76.; INVEMAR: Santa Marta, Colombia, 2014; 24 p. [Google Scholar]
- APHA. Standard Methods for the Examination of Water and Wastewater, 20th ed.; American Public Health Association, American Water Works Association and Water Environmental Federation: Washington, DC, 1998. [Google Scholar]
- Marthanty, R.; Soeryantono, H.; Carlier, E.; Sutjiningsih, D. Assessment of the capability of 3D stratified flow finite element model in characterizing meander dynamics. Journal of Urban and Environmental Engineering 2014, 8, 155–166. [Google Scholar] [CrossRef]
- Fossati, M.; Piedra-Cueva, I. Numerical modelling of residual flow and salinity in the Rıo de la Plata. Applied Mathematical Modelling 2008, 32, 1066–1086. [Google Scholar] [CrossRef]
- Garcia, F.F.; Palacio, C. y Garcia, U. Simulation of hydrodynamic conditions at Santa Marta coastal area (Colombia). Dyna 2012, 174, 119–126. [Google Scholar]
- Garcia, F.F.; Palacio, C.; Garcia, U. Calibración y validación de un modelo 3D para el área costera de Santa Marta (Colombia). Rev. Fac. Ing. Univ. Antioquia 2012, 62, 177–188. [Google Scholar]
- Ezzatti, P.; Fossati, M.; Piedra-Cueva, I. An efficient version of the RMA-11 model. CLEI Electron. J. 2011, 14, 1–10. [Google Scholar] [CrossRef]
- Glamore, W.; Mitrovic, S.; Ruprecht, J.; Dafforn, K.; Scanes, P.; Ferguson, A.; Rayner, D.; Miller, B.; Dieber, M.; Tucker, T. The Hunter River Estuary Water Quality Model. In Proceedings of the Australasian Coasts & Ports 2019 Conference – Hobart, Australia, 10-13 September 2019. [Google Scholar]
- Ruprecht, J.; King, I.P.; Mitrovic, S.; Dafforn, K.A.; Miller, B.M.; Deiber, M.; Westhorpe, D.P.; Hitchcock., J.N.; Harrison, A.J.; Glamore, W.C. Assessing the validity and sensitivity of microbial processes within a hydrodynamic model. Water Res. 2022, 1–16. [Google Scholar] [CrossRef] [PubMed]
- Marthanty, D.; Soeryantono, H.; Carlier, E.; Sutjiningsih, D. Assessment of the capability of 3D stratified flow finite element model in characterizing meander dynamics. Journal of Urban and Environmental Engineering 2014, 8, 155–166. [Google Scholar] [CrossRef]
- Brown, L.C.; Barnwell., T.O. The Enhanced Stream Water Quality Models QUAL2E and QUAL2E-UNCAS: Documentation and Users Manual. Environmental Research Laboratory USEPA 1987. [Google Scholar]
- Thomann, R.V.; Mueller, J.A. Principles of Surface Water Quality and Control; Harper Collins: New York, 1987; 644 p. [Google Scholar]
- Engwirda, D. Locally-optimal Delaunay-refinement and optimisation-based mesh generation. Ph.D. Thesis, School of Mathematics and Statistics, The University of Sydney, Sydney, September 2014. [Google Scholar]
- Engwirda, D. Conforming Restricted Delaunay Mesh Generation for Piecewise Smooth Complexes. Procedia Engineering 2016, 163, 84–96. [Google Scholar] [CrossRef]
- Chassignet, E.P.; Hurlburt, H.E.; Smedstad, O.M.; Halliwell, G.R.; Hogan, P.J.; Wallcraft, A.J.; Baraille, R.; Bleck, R. The HYCOM (HYbrid Coordinate Ocean Model) data assimilative system. J. Mar. Syst. 2007, 65, 60–83. [Google Scholar] [CrossRef]
- Molina, A.; Duque, G.; Cogua, P. Influences of environmental conditions in the fish assemblage structure of a tropical estuary. Mar. Biodivers. 2020, 50, 1–13. [Google Scholar] [CrossRef]
- Chen, W. , Chen, K., Kuang, C., Zhu, D.Z., He, L., Mao, X., Liang, H., Song, H. Influence of sea level rise on saline water intrusion in the Yangtz River Estuary, China. Appl. Ocean Res. 2016, 54, 12–25. [Google Scholar] [CrossRef]
- Otero, L. Determinación del régimen medio y extremal del nivel del mar para la bahía de buenaventura. Boletín Científico CCCP 2004, 11, 30–41. [Google Scholar] [CrossRef] [PubMed]
- Gamboa-García, D.; Duque, G.; Cogua, P.; Marrugo-Negrete, J. Mercury dynamics in macroinvertebrates in relation to environmental factors in a highly impacted tropical estuary: Buenaventura Bay, Colombian Pacific. Environ Sci Pollut Res 2020, 27, 4044–4057. [Google Scholar] [CrossRef] [PubMed]
Disclaimer/Publisher’s Note: The statements, opinions and data contained in all publications are solely those of the individual author(s) and contributor(s) and not of MDPI and/or the editor(s). MDPI and/or the editor(s) disclaim responsibility for any injury to people or property resulting from any ideas, methods, instructions or products referred to in the content. |
© 2023 by the authors. Licensee MDPI, Basel, Switzerland. This article is an open access article distributed under the terms and conditions of the Creative Commons Attribution (CC BY) license (http://creativecommons.org/licenses/by/4.0/).


