Submitted:
08 February 2023
Posted:
13 February 2023
You are already at the latest version
Abstract
Keywords:
1. Introduction
2. Materials and Methods
3. Results
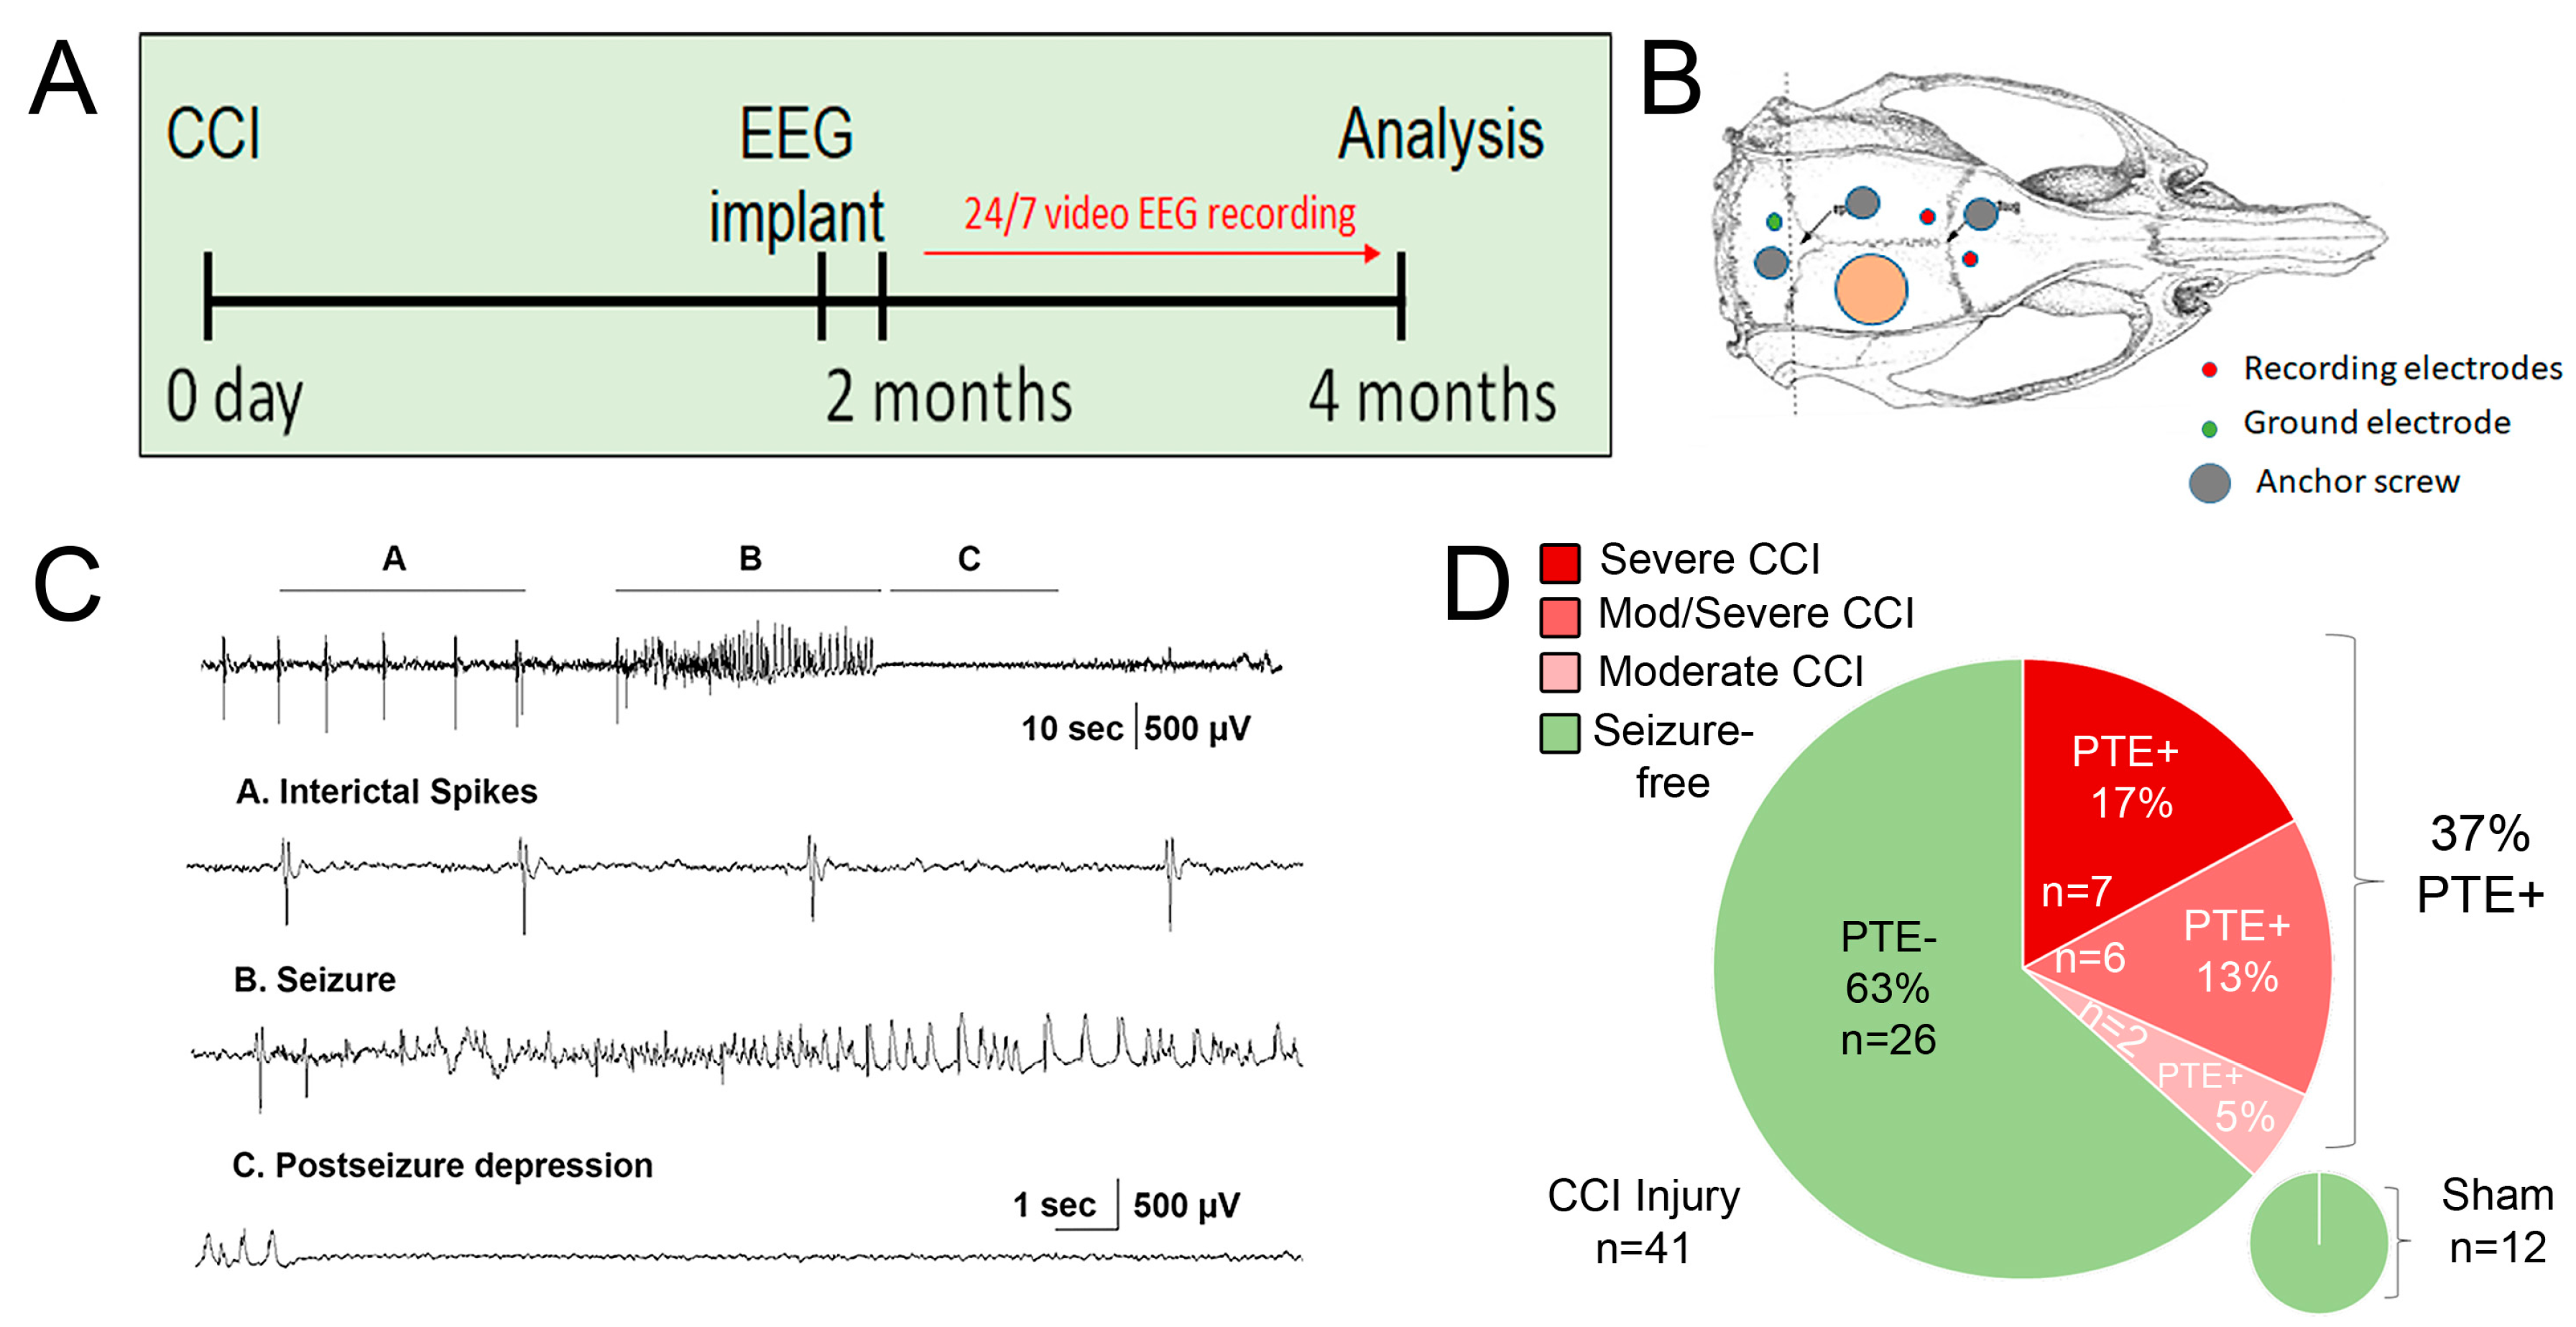
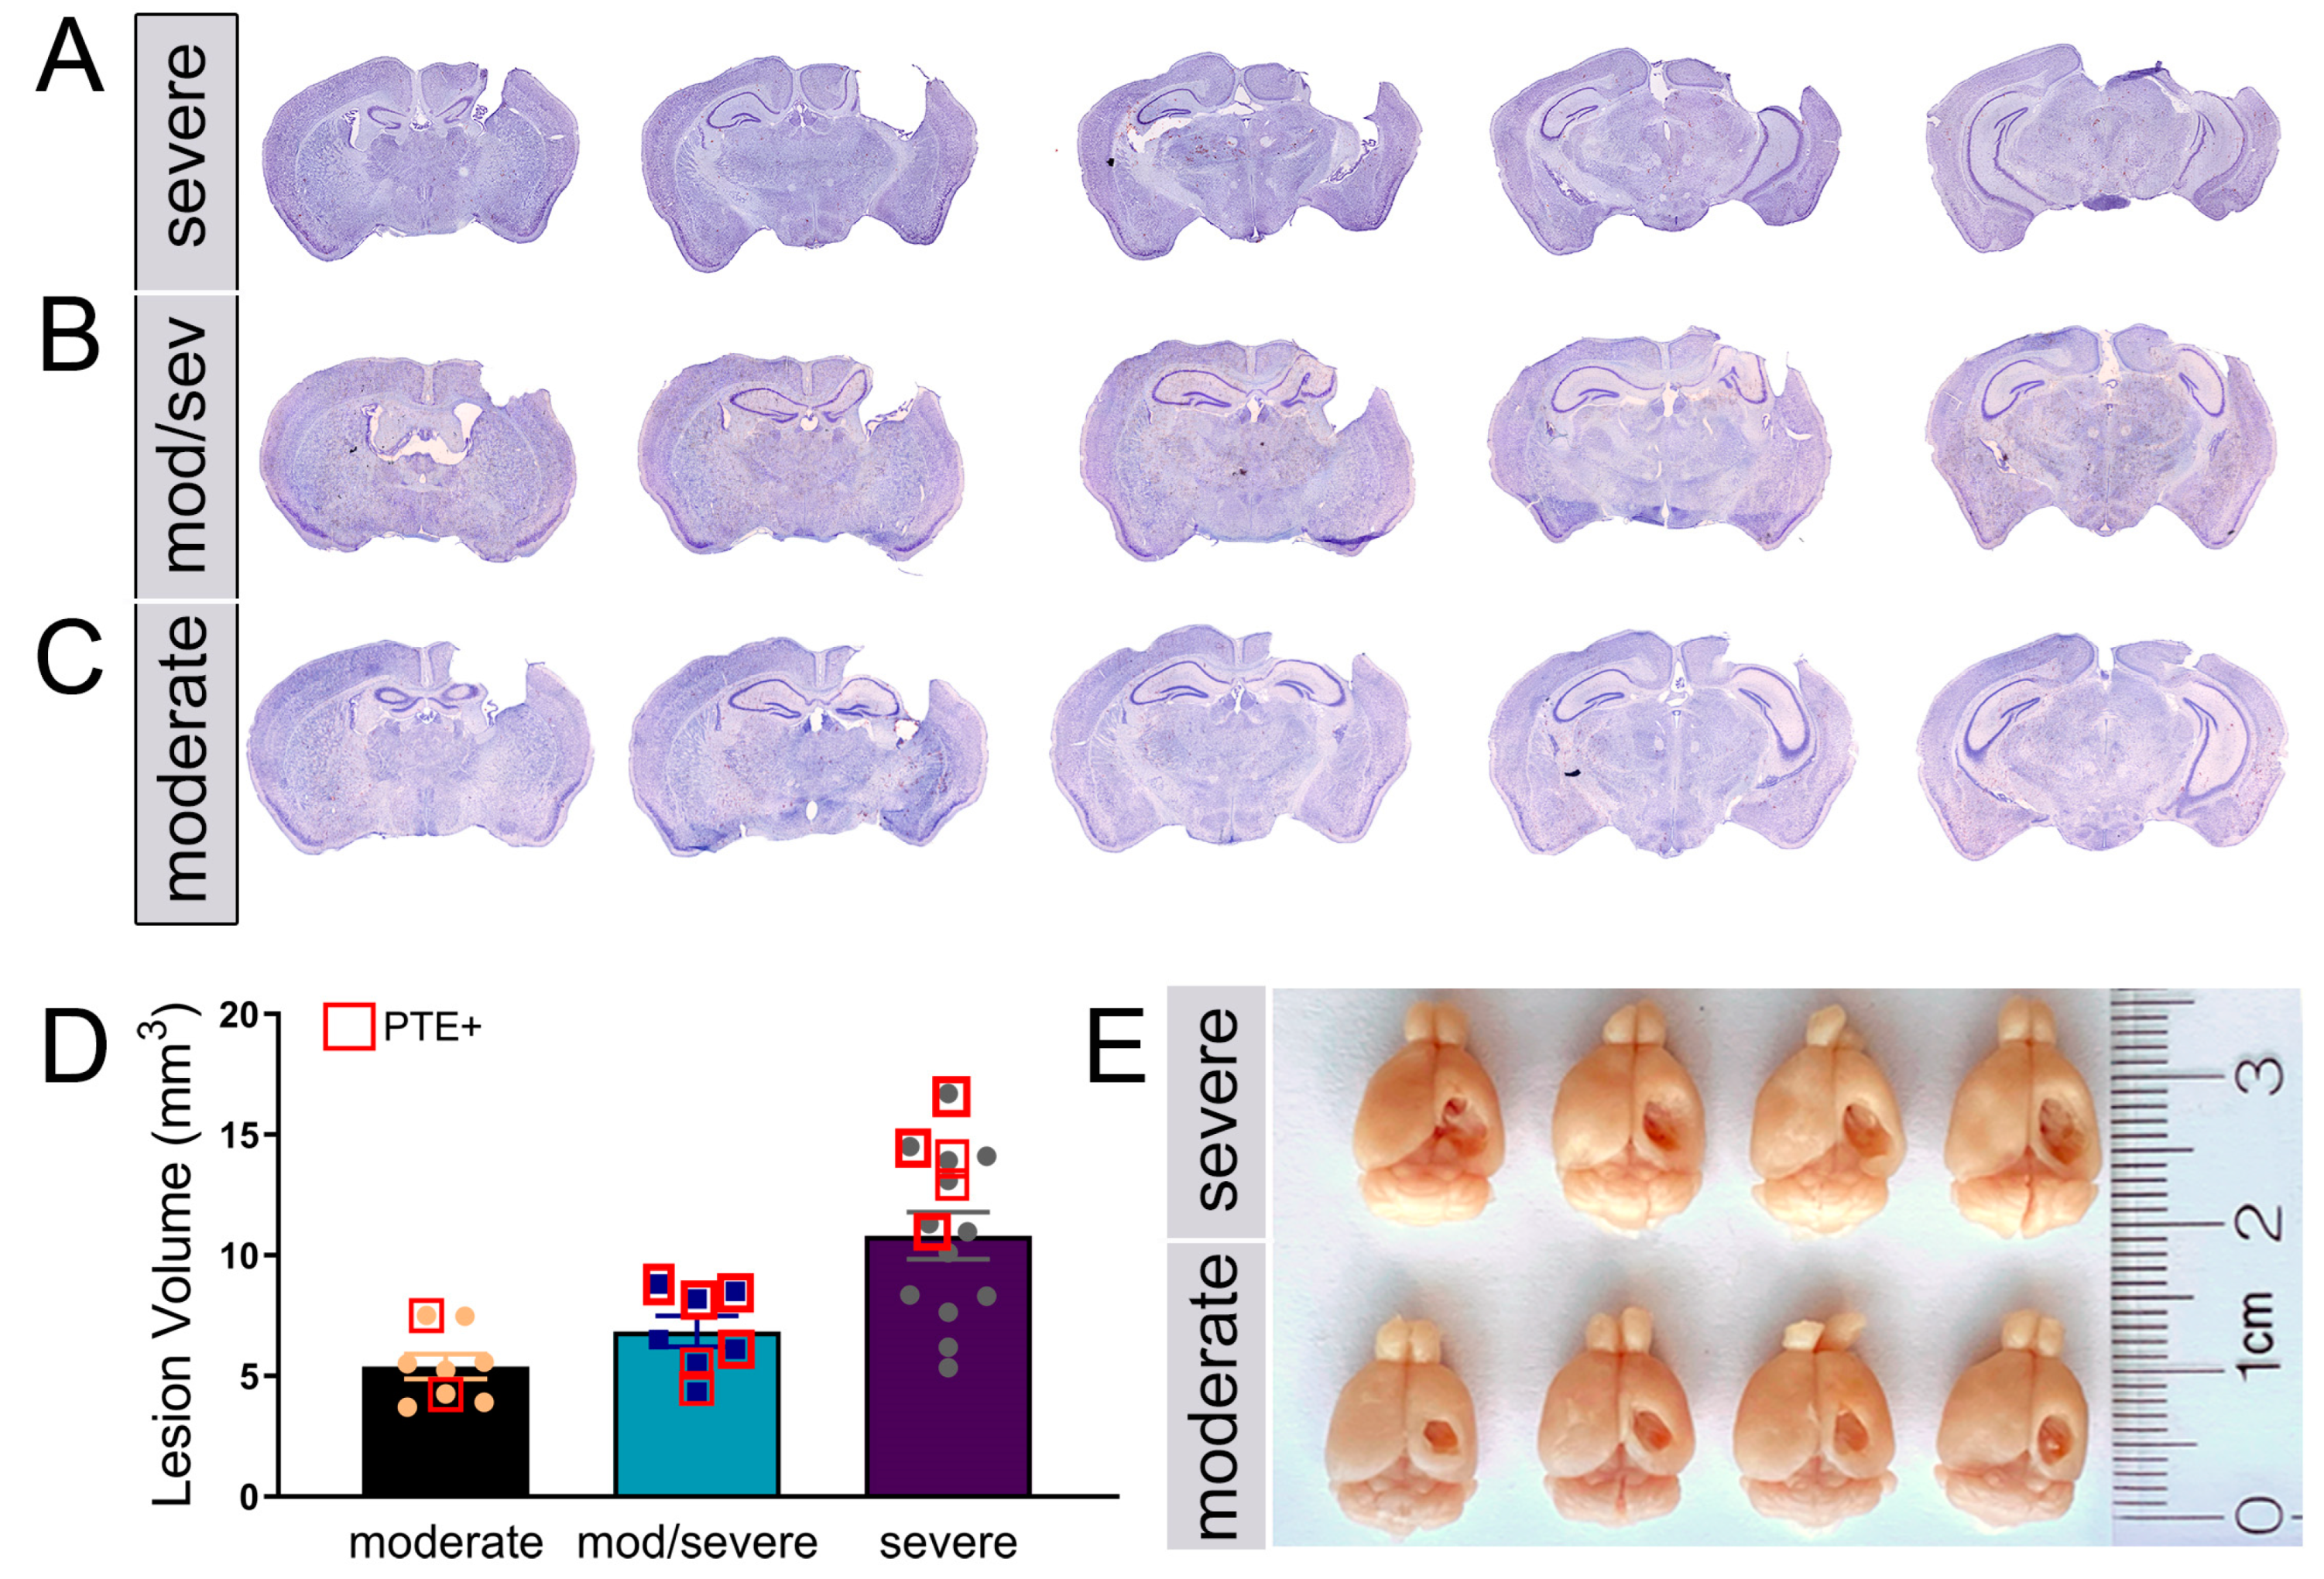
Murine CCI-induced PTE is associated with injury severity and hippocampal damage
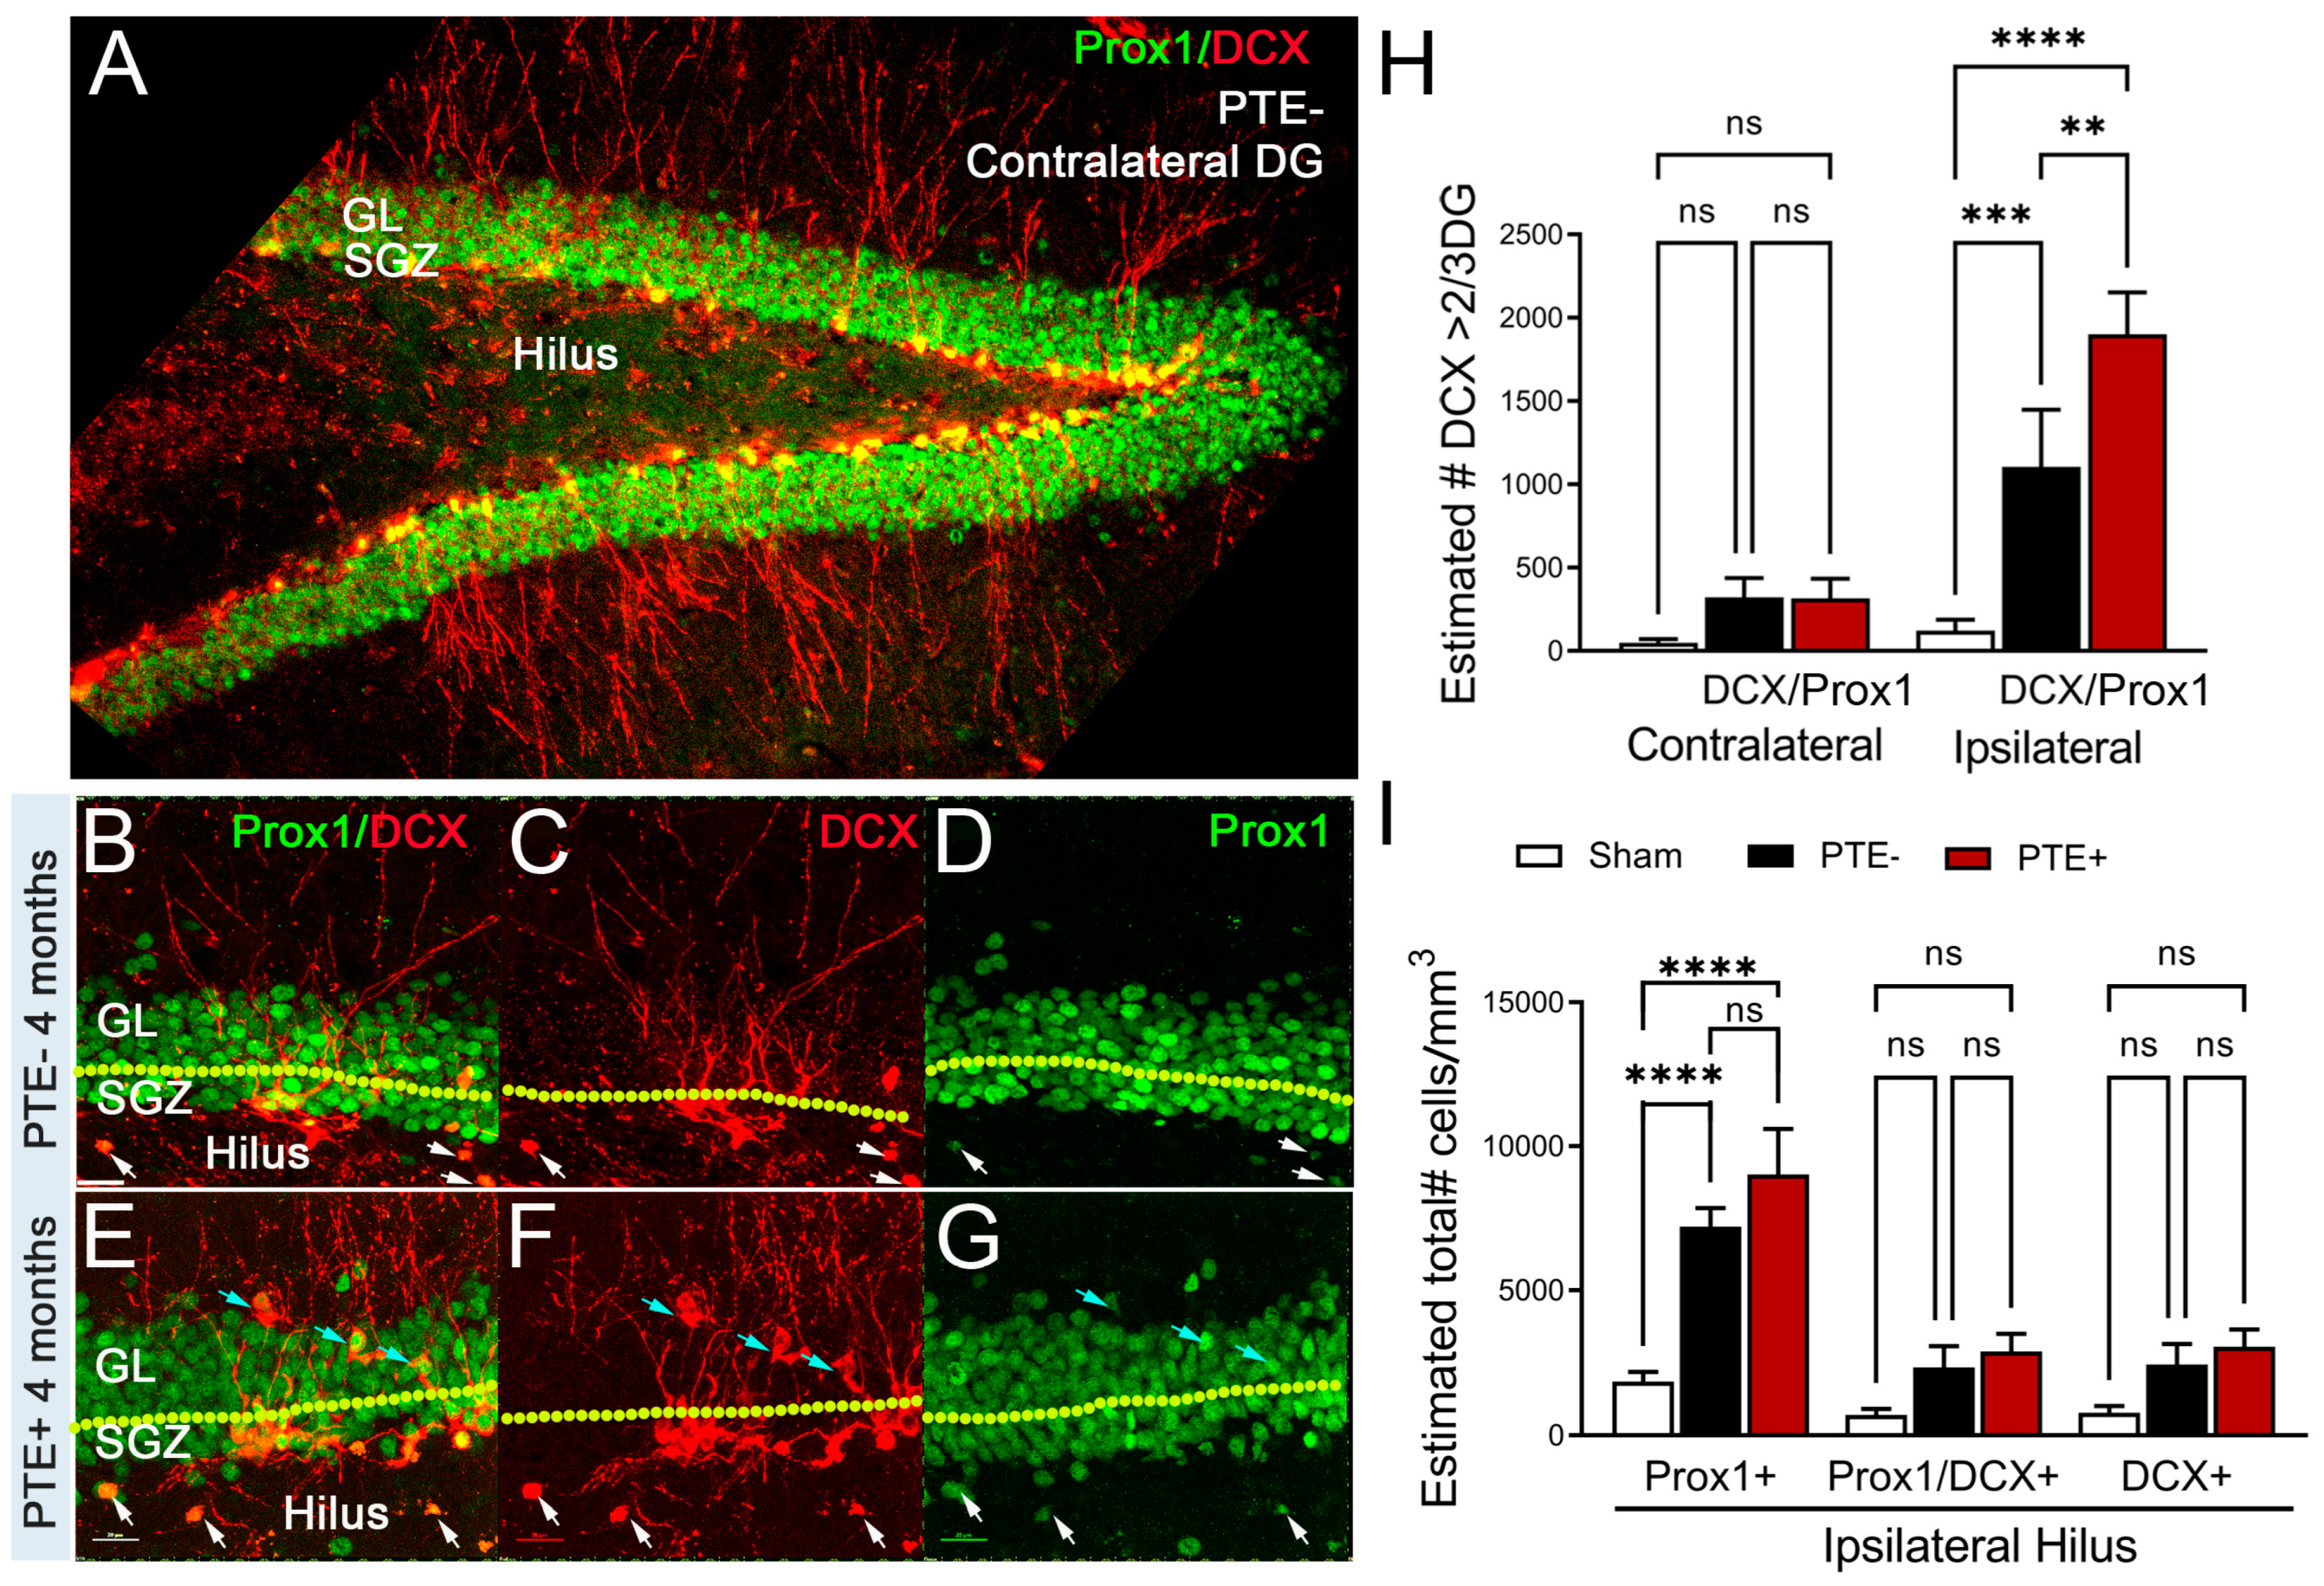
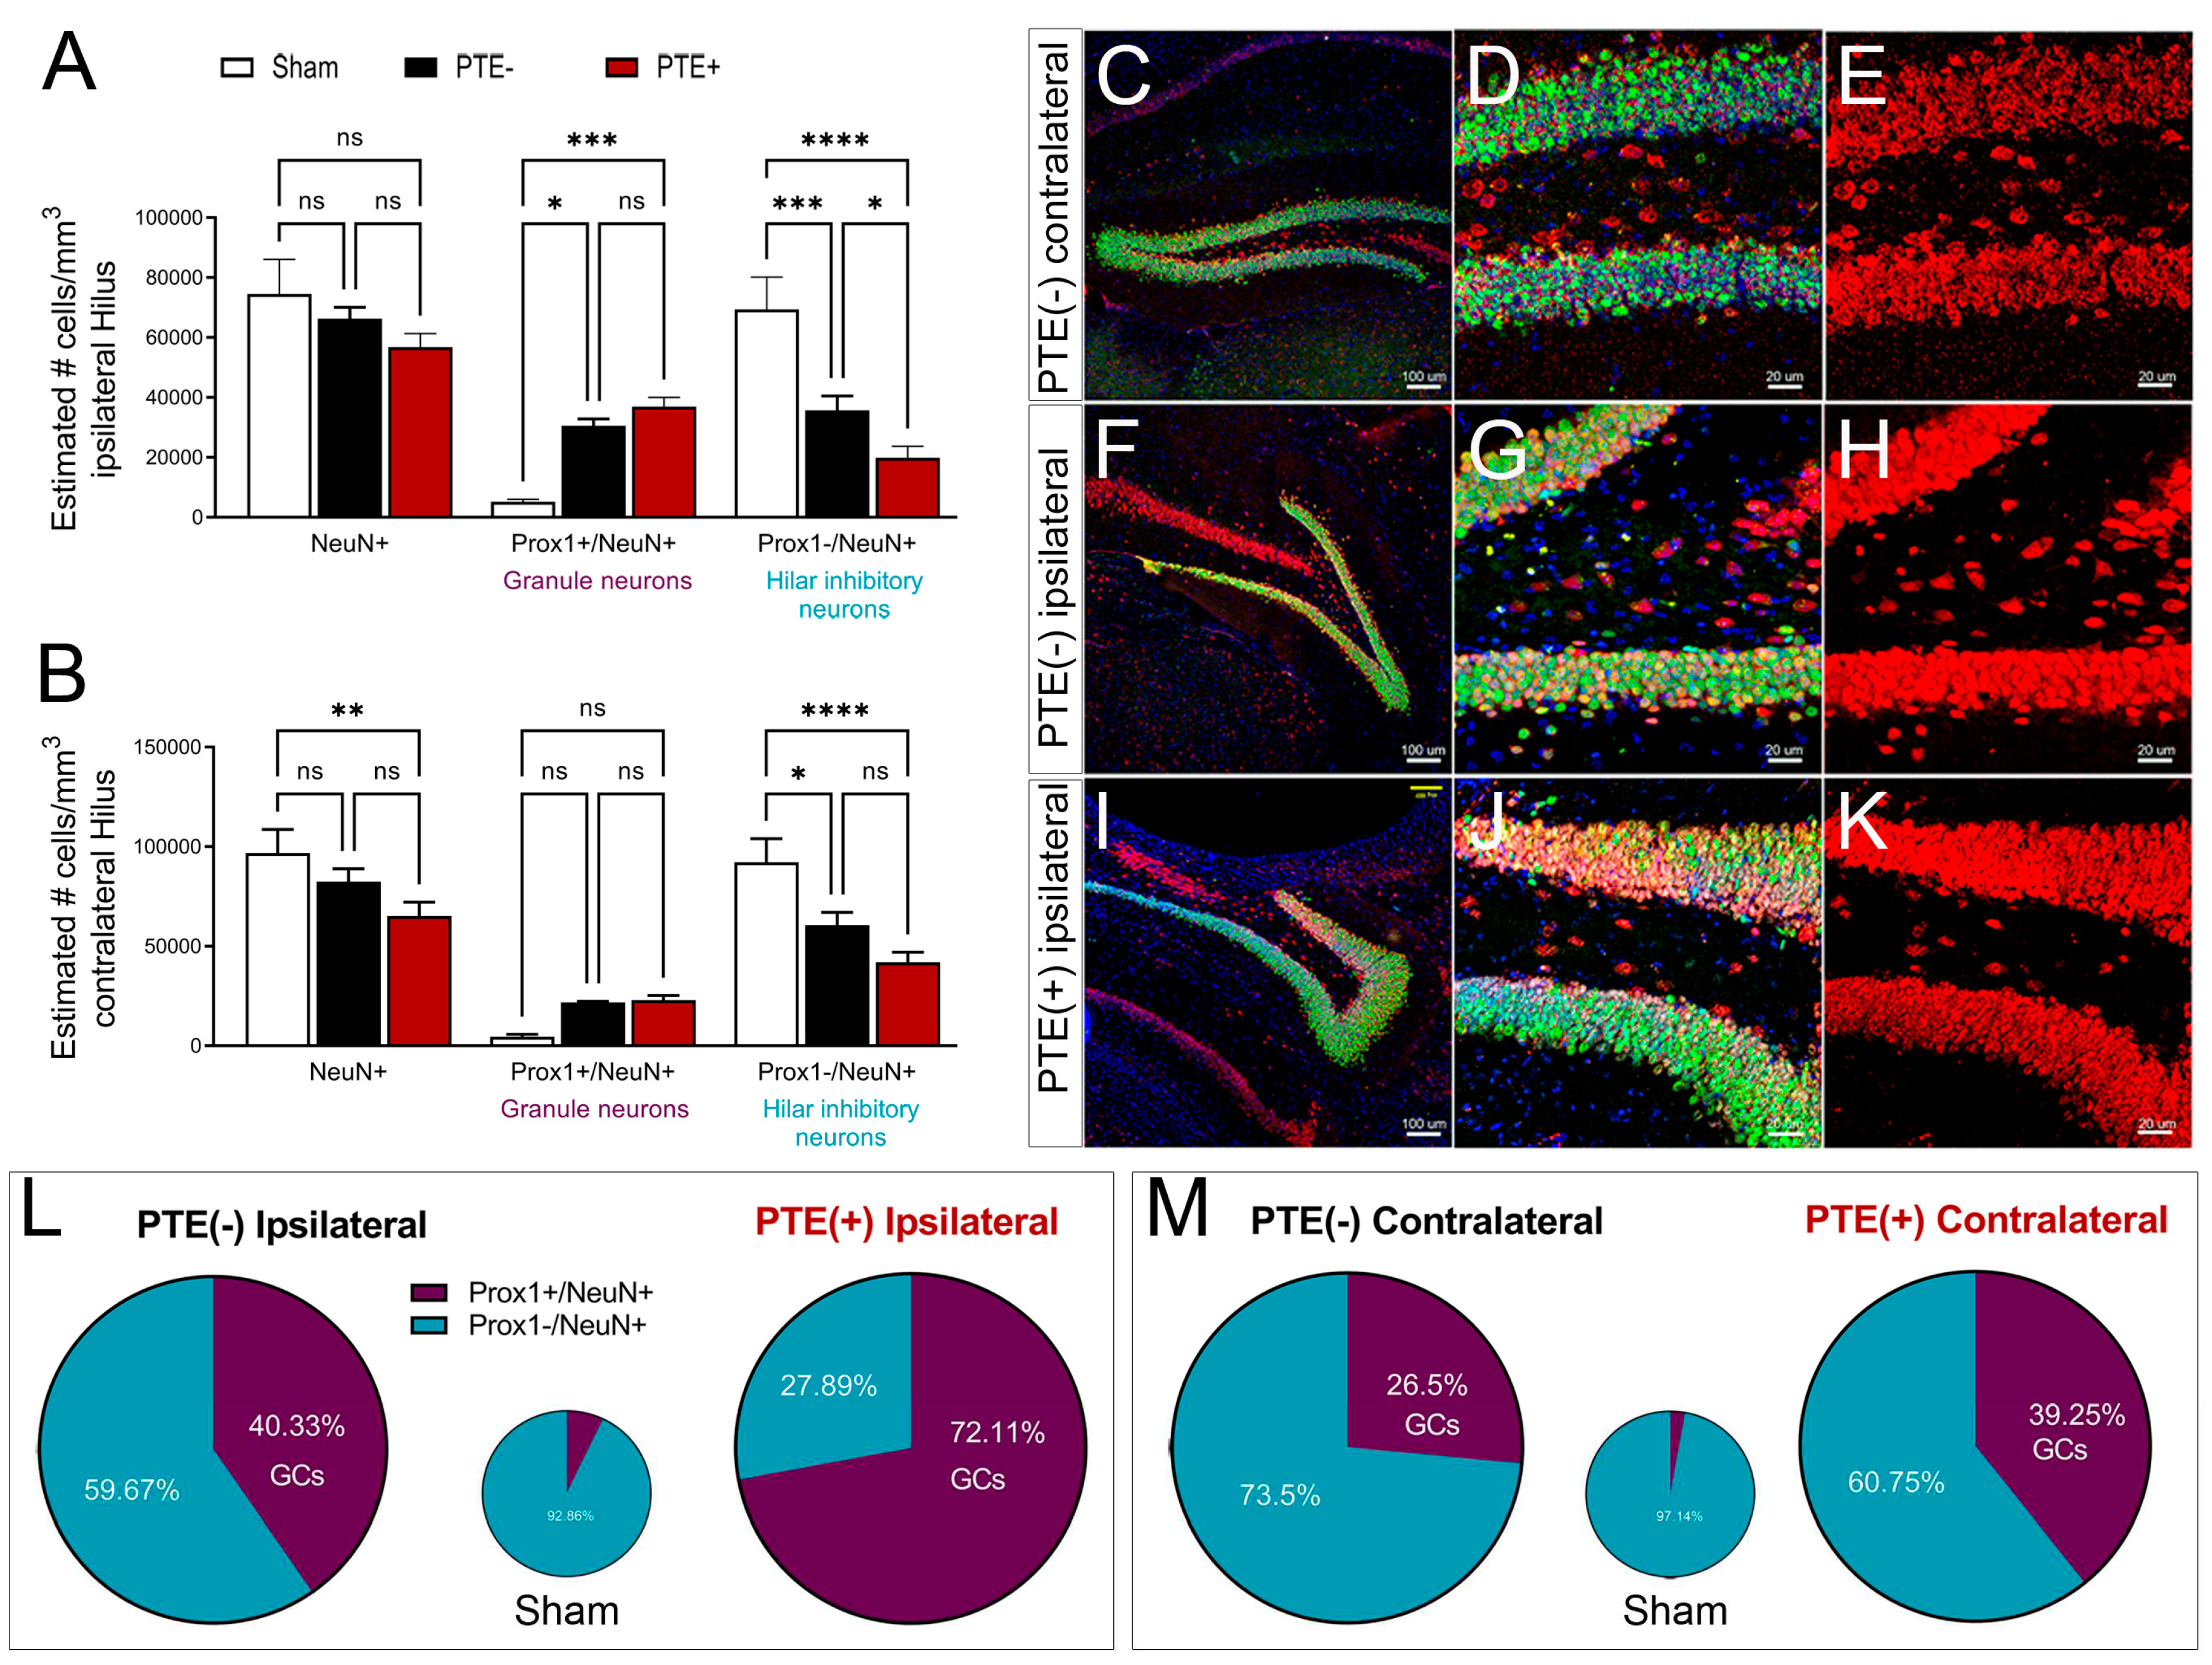
PTE+ mice show aberrant migration of Prox1-neuroblast in the dentate gyrus and hilus
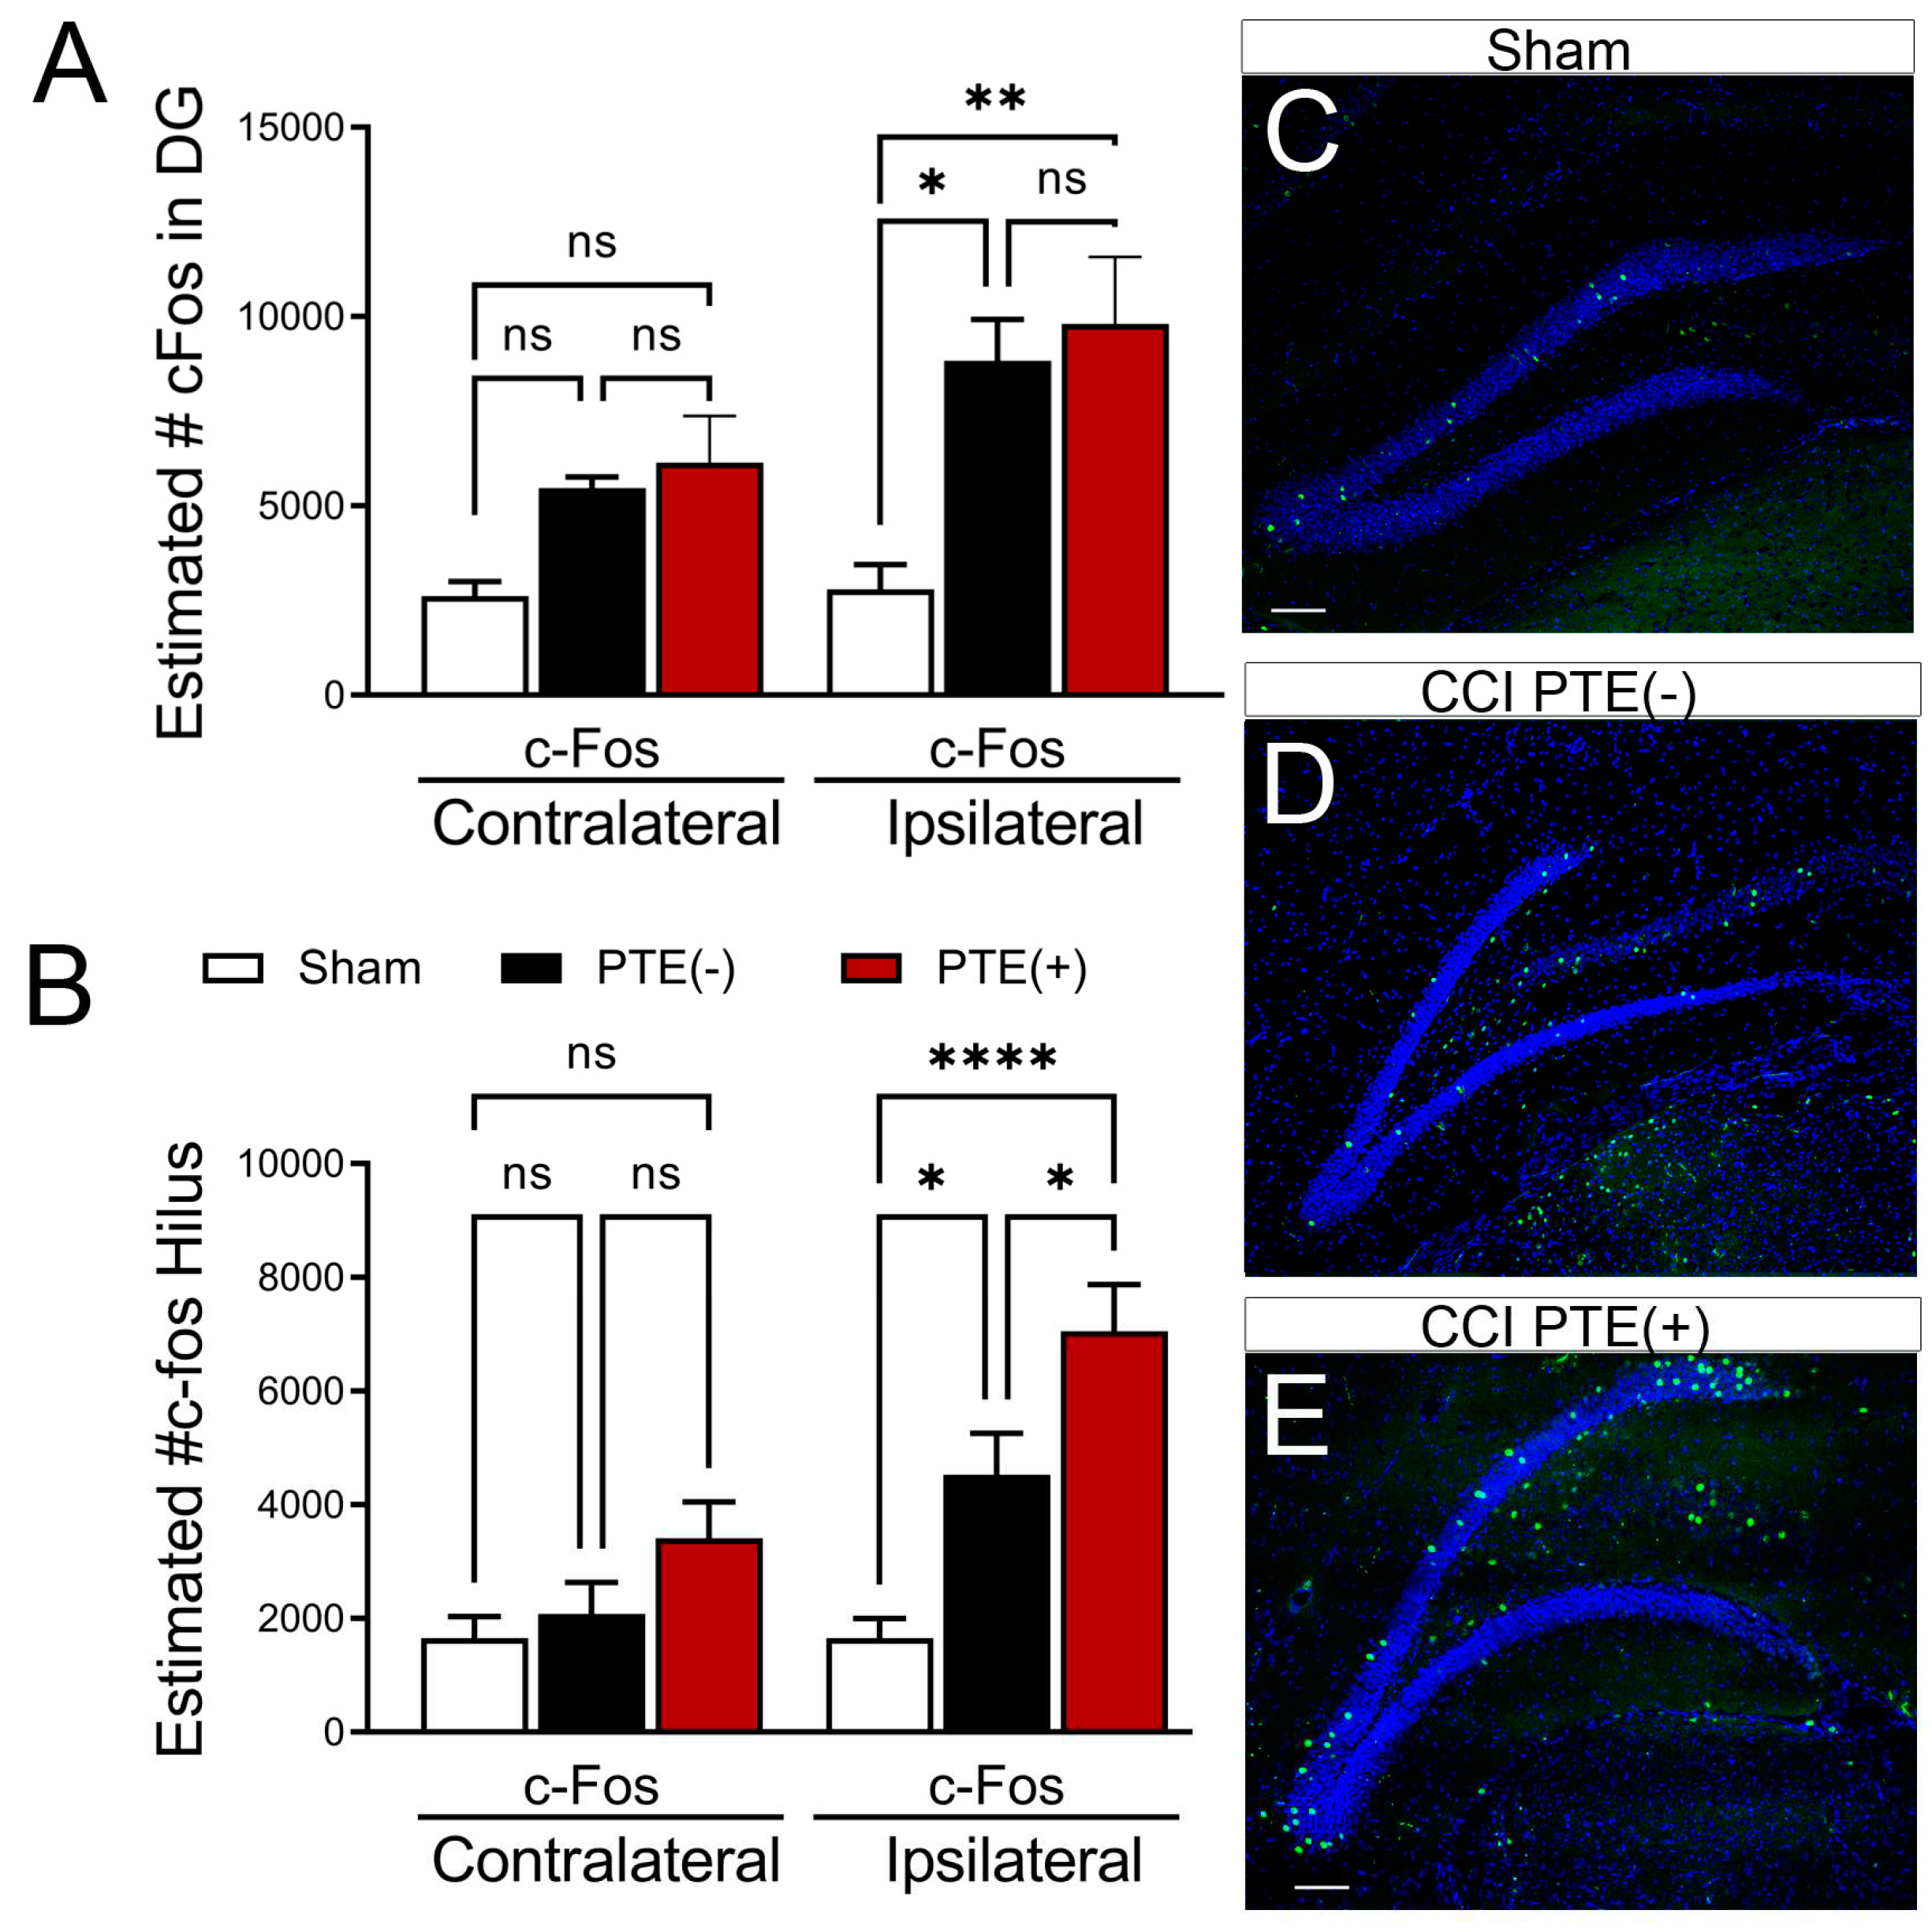
PTE+ mice display increased hilar expression of cFos alongside an excessive loss of inhibitory neurons
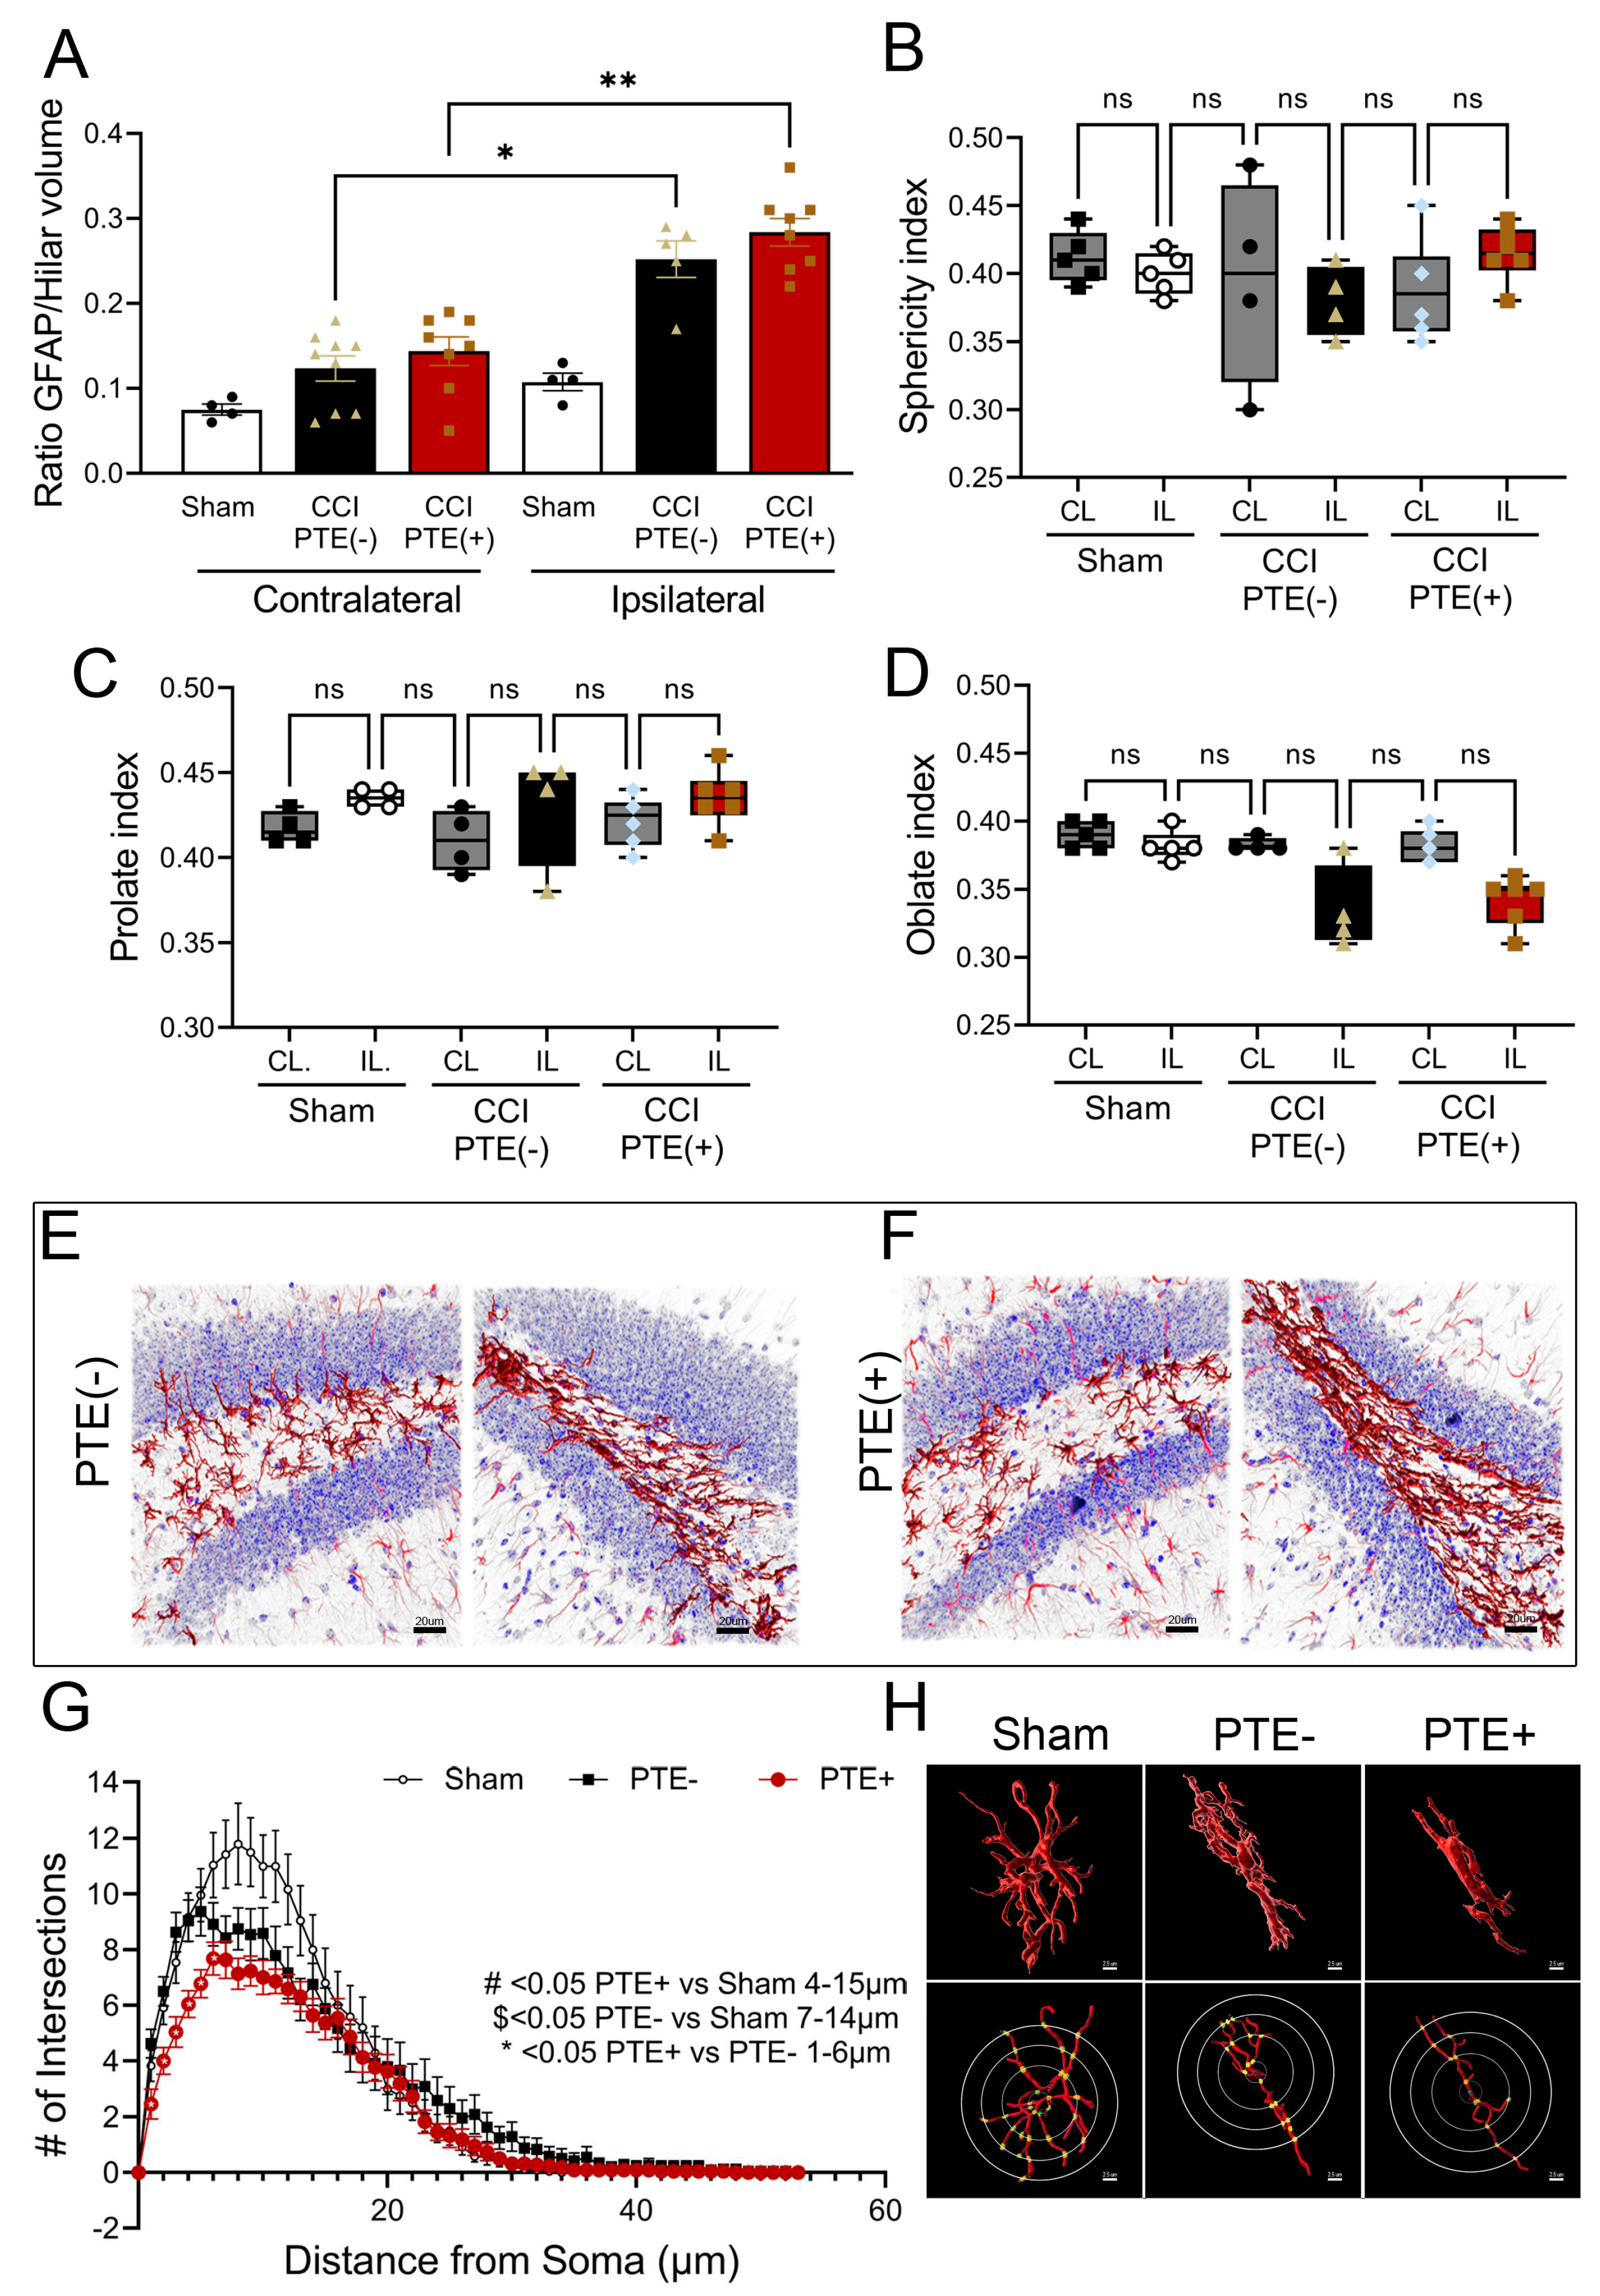
Post-traumatic epilepsy alters hilar astrogliosis and morphometric properties
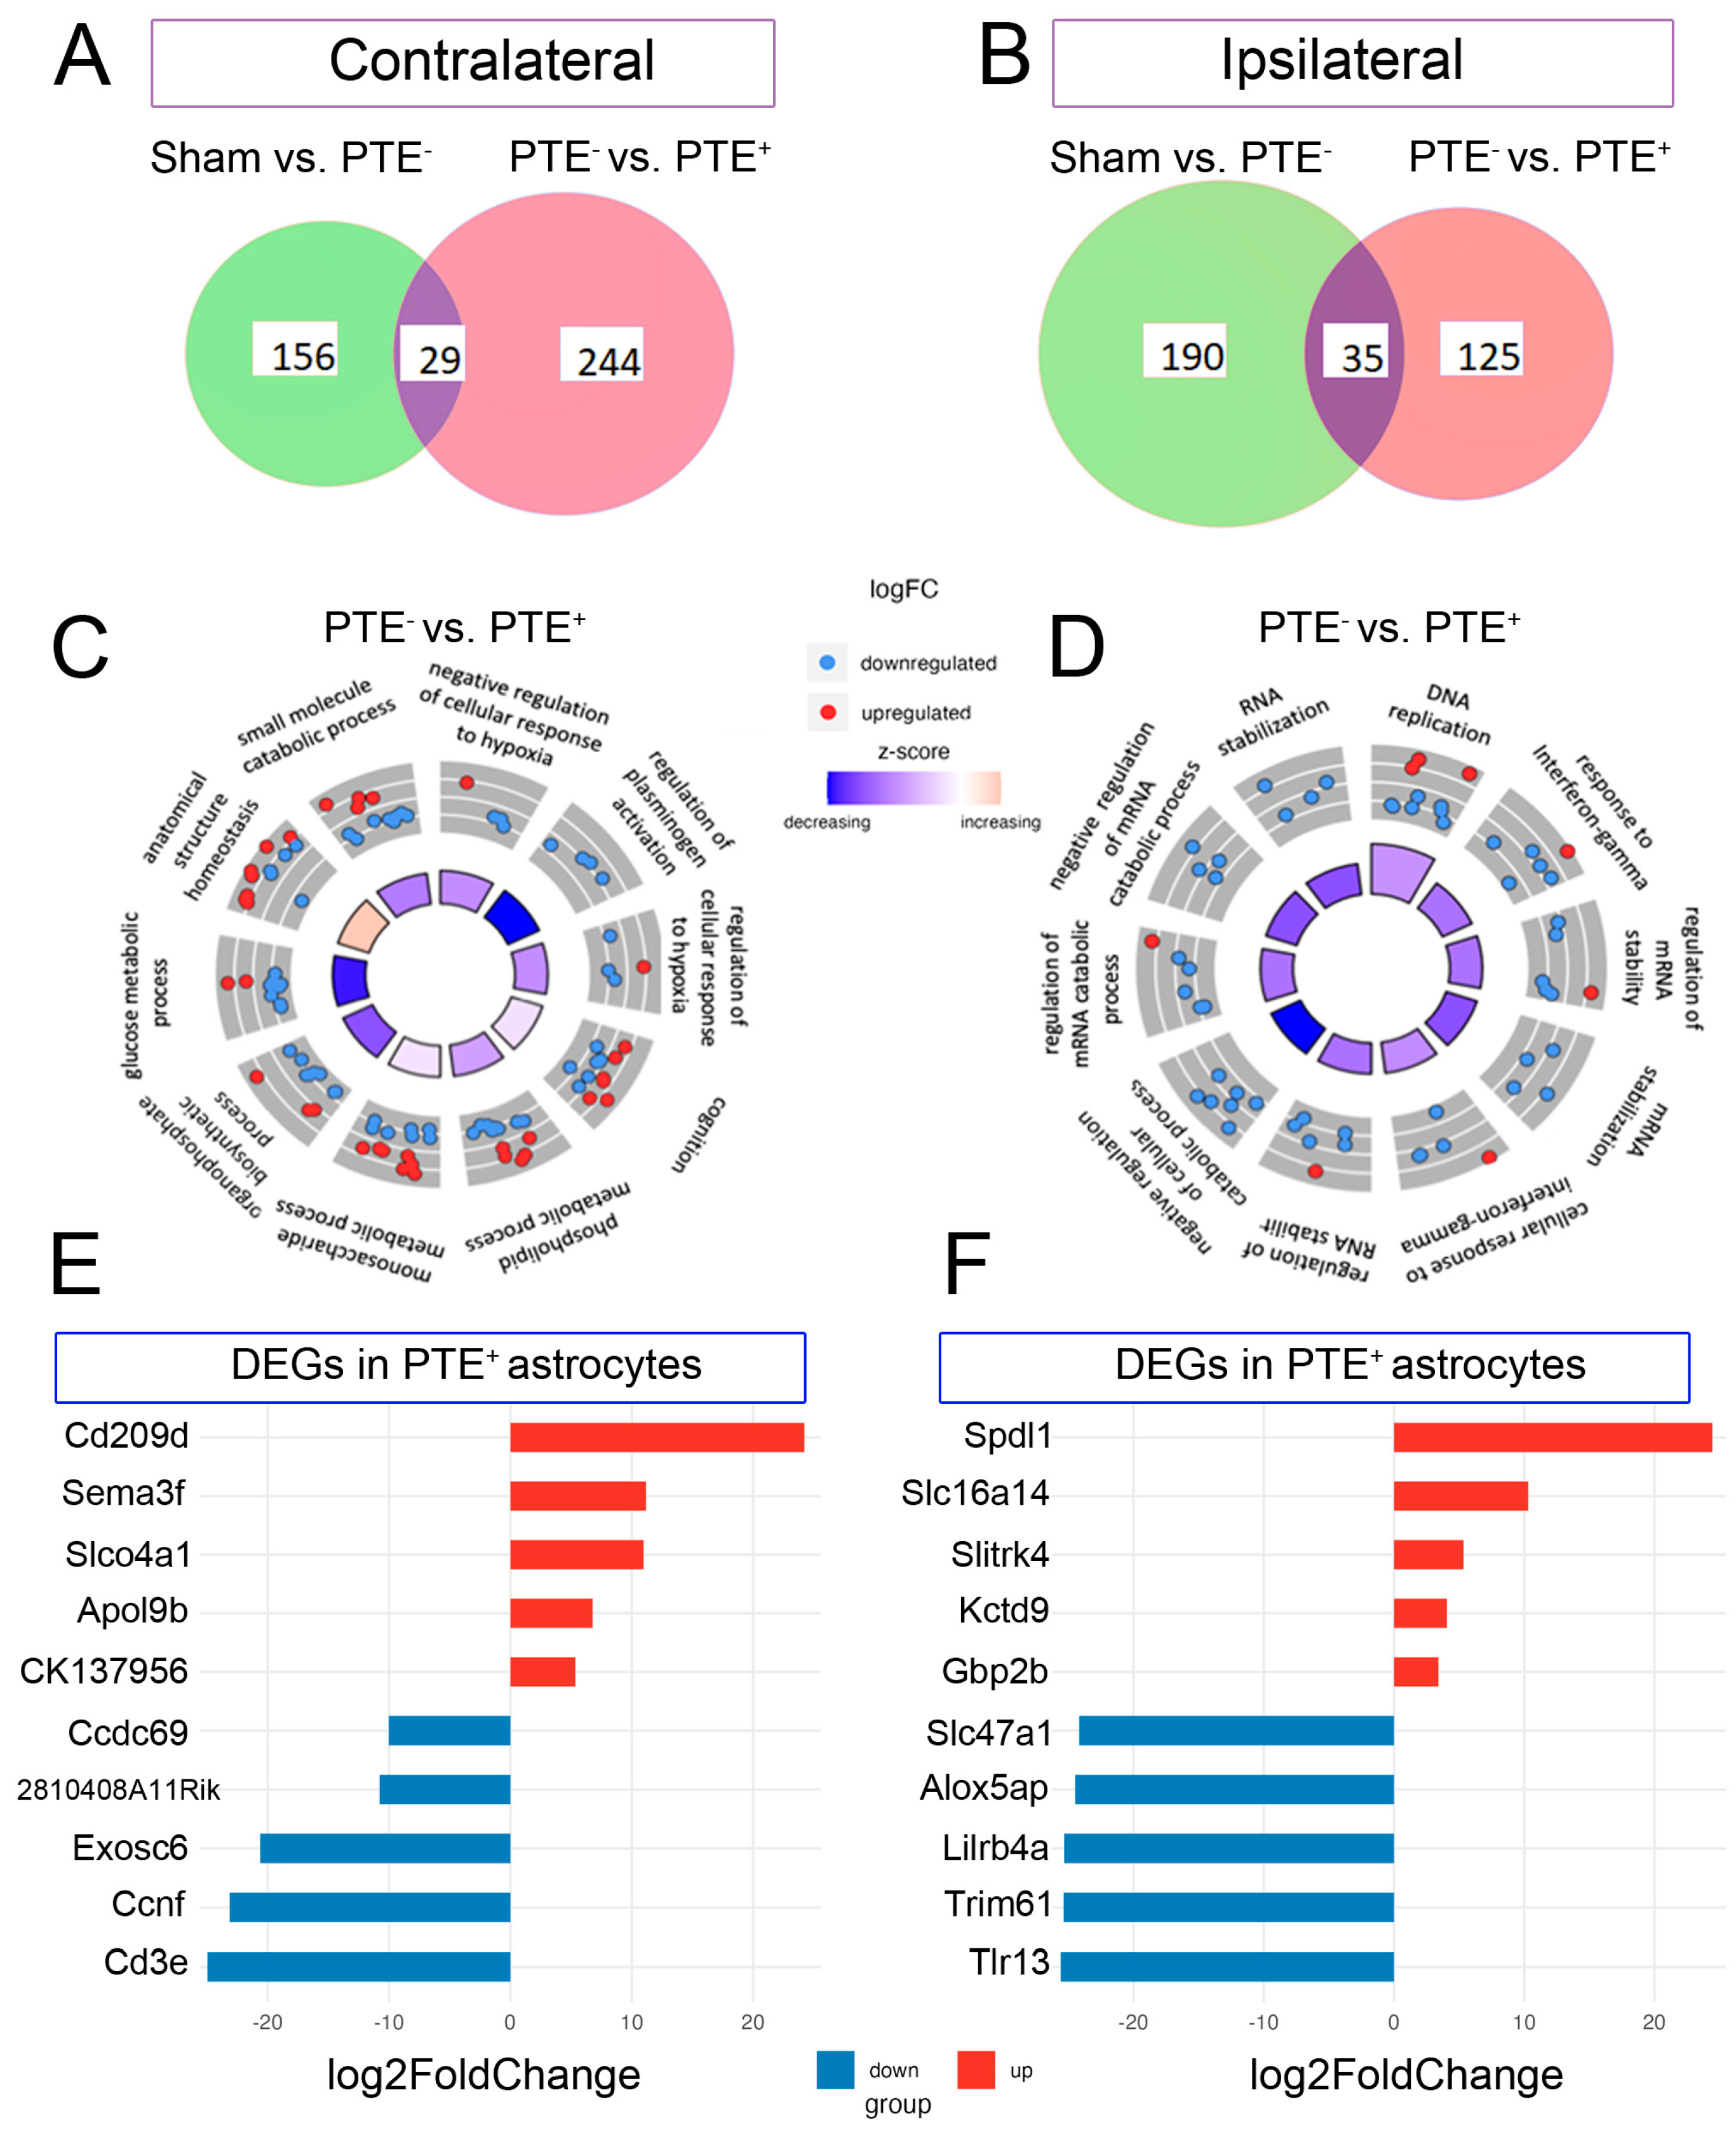
Transcriptomic signature of forebrain PTE+ astrocytes following CCI injury
4. Discussion
Author Contributions
Funding
Data Availability Statement
Acknowledgments
Conflicts of Interest
References
- Golub, V.M. and D.S. Reddy, Post-Traumatic Epilepsy and Comorbidities: Advanced Models, Molecular Mechanisms, Biomarkers, and Novel Therapeutic Interventions. Pharmacol Rev, 2022. 74(2): p. 387-438. [CrossRef]
- Timofeev, I. , et al., Decompressive craniectomy—operative technique and perioperative care, in Advances and technical standards in neurosurgery. 2012, Springer. p. 115-136.
- Taylor, C.A. , et al., Traumatic Brain Injury-Related Emergency Department Visits, Hospitalizations, and Deaths - United States, 2007 and 2013. MMWR Surveill Summ, 2017. 66(9): p. 1-16.
- DeGrauw, X. , et al., Epidemiology of traumatic brain injury-associated epilepsy and early use of anti-epilepsy drugs: An analysis of insurance claims data, 2004-2014. Epilepsy Res, 2018. 146: p. 41-49. [CrossRef]
- Asikainen, I., M. Kaste, and S. Sarna, Early and late posttraumatic seizures in traumatic brain injury rehabilitation patients: brain injury factors causing late seizures and influence of seizures on long-term outcome. Epilepsia, 1999. 40(5): p. 584-9. [CrossRef]
- Frey, L.C. , Epidemiology of posttraumatic epilepsy: a critical review. Epilepsia, 2003. 44(s10): p. 11-7. [CrossRef]
- Hauser, W.A., J. F. Annegers, and L.T. Kurland, Prevalence of epilepsy in Rochester, Minnesota: 1940–1980. Epilepsia, 1991. 32(4): p. 429-445. [CrossRef]
- Chen, J.W. , et al., Posttraumatic epilepsy and treatment. J Rehabil Res Dev, 2009. 46(6): p. 685-96. [CrossRef]
- Small, C. , et al., Examining the role of astrogliosis and JNK signaling in post-traumatic epilepsy. Egypt J Neurosurg, 2022. 37. [CrossRef]
- Mukherjee, S. , et al., Neuroinflammatory mechanisms of post-traumatic epilepsy. J Neuroinflammation, 2020. 17(1): p. 193. [CrossRef]
- Ping, X. and X. Jin, Transition from Initial Hypoactivity to Hyperactivity in Cortical Layer V Pyramidal Neurons after Traumatic Brain Injury In Vivo. J Neurotrauma, 2016. 33(4): p. 354-61. [CrossRef]
- Pitkänen, A. , et al., Epilepsy biomarkers–toward etiology and pathology specificity. Neurobiology of disease, 2019. 123: p. 42-58. [CrossRef]
- Greer, K. , et al., Abrogation of atypical neurogenesis and vascular-derived EphA4 prevents repeated mild TBI-induced learning and memory impairments. Scientific Reports, 2020. 10(1): p. 15374. [CrossRef]
- Hunt, R.F., J. A. Boychuk, and B.N. Smith, Neural circuit mechanisms of post-traumatic epilepsy. Front Cell Neurosci, 2013. 7: p. 89. [CrossRef]
- Dudek, F.E. and T.P. Sutula, Epileptogenesis in the dentate gyrus: a critical perspective. Prog Brain Res, 2007. 163: p. 755-73. [CrossRef]
- Larkin, M. , et al., Post-Traumatic, Drug-Resistant Epilepsy and Review of Seizure Control Outcomes from Blinded, Randomized Controlled Trials of Brain Stimulation Treatments for Drug-Resistant Epilepsy. Cureus, 2016. 8(8): p. e744. [CrossRef]
- Rao, V.R. and K.L. Parko. Clinical approach to posttraumatic epilepsy. in Seminars in neurology. 2015. Thieme Medical Publishers. [CrossRef]
- Lucke-Wold, B.P. , et al., Traumatic brain injury and epilepsy: Underlying mechanisms leading to seizure. Seizure, 2015. 33: p. 13-23. [CrossRef]
- Agrawal, A. , et al., Post-traumatic epilepsy: An overview. Clinical Neurology and Neurosurgery, 2006. 108(5): p. 433-439. [CrossRef]
- Englander, J. , et al., Analyzing risk factors for late posttraumatic seizures: a prospective, multicenter investigation. Arch Phys Med Rehabil, 2003. 84(3): p. 365-73. [CrossRef]
- Haltiner, A.M., N. R. Temkin, and S.S. Dikmen, Risk of seizure recurrence after the first late posttraumatic seizure. Arch Phys Med Rehabil, 1997. 78(8): p. 835-40. [CrossRef]
- Diaz-Arrastia, R. , et al., Neurophysiologic and neuroradiologic features of intractable epilepsy after traumatic brain injury in adults. Arch Neurol, 2000. 57(11): p. 1611-6. [CrossRef]
- Gupta, P.K. , et al., Subtypes of post-traumatic epilepsy: clinical, electrophysiological, and imaging features. J Neurotrauma, 2014. 31(16): p. 1439-43. [CrossRef]
- Temkin, N.R. , et al., A randomized, double-blind study of phenytoin for the prevention of post-traumatic seizures. N Engl J Med, 1990. 323(8): p. 497-502. [CrossRef]
- Szaflarski, J.P., Y. Nazzal, and L.E. Dreer, Post-traumatic epilepsy: current and emerging treatment options. Neuropsychiatr Dis Treat, 2014. 10: p. 1469-77. [CrossRef]
- Zaccara, G., S. Lattanzi, and F. Brigo, Which treatment strategy in patients with epilepsy with focal seizures uncontrolled by the first anti-seizure medication? Epilepsy Behav, 2021. 121(Pt A): p. 108031.
- Marion, D. , Management of traumatic brain injury: past, present, and future. Clinical neurosurgery, 1999. 45: p. 184-191.
- Brodie, M.J. , Road to refractory epilepsy: the Glasgow story. Epilepsia, 2013. 54 Suppl 2: p. 5-8. [CrossRef]
- Bratton, S.L. , et al., XIII. antiseizure prophylaxis. Journal of neurotrauma, 2007. 24(Supplement 1): p. S-83-S-86. [CrossRef]
- Kwan, P., S. C. Schachter, and M.J. Brodie, Drug-resistant epilepsy. New England Journal of Medicine, 2011. 365(10): p. 919-926. [CrossRef]
- Semah, F. , et al., Is the underlying cause of epilepsy a major prognostic factor for recurrence? Neurology, 1998. 51(5): p. 1256-1262. [CrossRef]
- Irimia, A. and J.D. Van Horn, Epileptogenic focus localization in treatment-resistant post-traumatic epilepsy. Journal of clinical neuroscience, 2015. 22(4): p. 627-631. [CrossRef]
- Pitkanen, A. , et al., From traumatic brain injury to posttraumatic epilepsy: what animal models tell us about the process and treatment options. Epilepsia, 2009. 50 Suppl 2: p. 21-9. [CrossRef]
- Bolkvadze, T. and A. Pitkanen, Development of post-traumatic epilepsy after controlled cortical impact and lateral fluid-percussion-induced brain injury in the mouse. J Neurotrauma, 2012. 29(5): p. 789-812. [CrossRef]
- Butler, C.R., J. A. Boychuk, and B.N. Smith, Effects of Rapamycin Treatment on Neurogenesis and Synaptic Reorganization in the Dentate Gyrus after Controlled Cortical Impact Injury in Mice. Front Syst Neurosci, 2015. 9: p. 163. [CrossRef]
- Guo, D. , et al., Rapamycin attenuates the development of posttraumatic epilepsy in a mouse model of traumatic brain injury. PLoS One, 2013. 8(5): p. e64078. [CrossRef]
- Hunt, R.F., S. W. Scheff, and B.N. Smith, Posttraumatic epilepsy after controlled cortical impact injury in mice. Exp Neurol, 2009. 215(2): p. 243-52. [CrossRef]
- Reddy, D.S. , et al., A Comprehensive and Advanced Mouse Model of Post-Traumatic Epilepsy with Robust Spontaneous Recurrent Seizures. Curr Protoc, 2022. 2(6): p. e447. [CrossRef]
- Kowalski, E.A. , et al., Monocyte proinflammatory phenotypic control by ephrin type A receptor 4 mediates neural tissue damage. JCI Insight, 2022. 7(15).
- Soliman, E. , et al., Conditional Deletion of EphA4 on Cx3cr1-Expressing Microglia Fails to Influence Histopathological Outcome and Blood Brain Barrier Disruption Following Brain Injury. Front Mol Neurosci, 2021. 14: p. 747770. [CrossRef]
- Kowalski, E.A. , et al., Peripheral loss of EphA4 ameliorates TBI-induced neuroinflammation and tissue damage. J Neuroinflammation, 2019. 16(1): p. 210. [CrossRef]
- Theus, M.H. , et al., Loss of NLRX1 Exacerbates Neural Tissue Damage and NF-kappaB Signaling following Brain Injury. J Immunol, 2017. 199(10): p. 3547-3558. [CrossRef]
- Brickler, T.R. , et al., Angiopoietin/Tie2 Axis Regulates the Age-at-Injury Cerebrovascular Response to Traumatic Brain Injury. J Neurosci, 2018. 38(45): p. 9618-9634. [CrossRef]
- Patel, D.C., E. G. Thompson, and H. Sontheimer, Brain-Derived Neurotrophic Factor Inhibits the Function of Cation-Chloride Cotransporter in a Mouse Model of Viral Infection-Induced Epilepsy. Front Cell Dev Biol, 2022. 10: p. 961292. [CrossRef]
- Shandra, O. , et al., Repetitive Diffuse Mild Traumatic Brain Injury Causes an Atypical Astrocyte Response and Spontaneous Recurrent Seizures. J Neurosci, 2019. 39(10): p. 1944-1963. [CrossRef]
- Okyere, B. , et al., EphA4/Tie2 crosstalk regulates leptomeningeal collateral remodeling following ischemic stroke. J Clin Invest, 2020. 130(2): p. 1024-1035. [CrossRef]
- Okyere, B. , et al., Temporal remodeling of pial collaterals and functional deficits in a murine model of ischemic stroke. J Neurosci Methods, 2018. 293: p. 86-96. [CrossRef]
- Holt, L.M. and M.L. Olsen, Novel Applications of Magnetic Cell Sorting to Analyze Cell-Type Specific Gene and Protein Expression in the Central Nervous System. PLoS One, 2016. 11(2): p. e0150290. [CrossRef]
- Holt, L.M., S. T. Stoyanof, and M.L. Olsen, Magnetic Cell Sorting for In Vivo and In Vitro Astrocyte, Neuron, and Microglia Analysis. Curr Protoc Neurosci, 2019. 88(1): p. e71. [CrossRef]
- Holt, L.M. , et al., Astrocyte morphogenesis is dependent on BDNF signaling via astrocytic TrkB.T1. Elife, 2019. 8.
- Theus, M.H. , et al., EphrinB3 blocks EphB3 dependence receptor functions to prevent cell death following traumatic brain injury. Cell Death Dis, 2014. 5: p. e1207. [CrossRef]
- Brickler, T. , et al., Nonessential Role for the NLRP1 Inflammasome Complex in a Murine Model of Traumatic Brain Injury. Mediators Inflamm, 2016. 2016: p. 6373506. [CrossRef]
- Iwano, T. , et al., Prox1 postmitotically defines dentate gyrus cells by specifying granule cell identity over CA3 pyramidal cell fate in the hippocampus. Development, 2012. 139(16): p. 3051-3062. [CrossRef]
- Barros, V.N. , et al., The pattern of c-Fos expression and its refractory period in the brain of rats and monkeys. Frontiers in Cellular Neuroscience, 2015. 9. [CrossRef]
- Szyndler, J. , et al., Mapping of c-Fos expression in the rat brain during the evolution of pentylenetetrazol-kindled seizures. Epilepsy & Behavior, 2009. 16(2): p. 216-224. [CrossRef]
- Dragunow, M. and H. Robertson, Generalized seizures induce c-fos protein (s) in mammalian neurons. Neuroscience letters, 1987. 82(2): p. 157-161. [CrossRef]
- Simler, S. , et al., C-fos expression after single and kindled audiogenic seizures in Wistar rats. Neuroscience letters, 1994. 175(1-2): p. 58-62. [CrossRef]
- Kempermann, G., H. Song, and F.H. Gage, Neurogenesis in the Adult Hippocampus. Cold Spring Harb Perspect Biol, 2015. 7(9): p. a018812. [CrossRef]
- Lake, B.B. , et al., Neuronal subtypes and diversity revealed by single-nucleus RNA sequencing of the human brain. Science, 2016. 352(6293): p. 1586-1590. [CrossRef]
- Hayatdavoudi, P. , et al., The role of astrocytes in epileptic disorders. Physiol Rep, 2022. 10(6): p. e15239. [CrossRef]
- Aoki, Y. , et al., Altered expression of astrocyte-related receptors and channels correlates with epileptogenesis in hippocampal sclerosis. Pediatric and Developmental Pathology, 2019. 22(6): p. 532-539. [CrossRef]
- Leiter, I. , et al., Attenuation of epileptogenesis by 2-deoxy-d-glucose is accompanied by increased cerebral glucose supply, microglial activation and reduced astrocytosis. Neurobiology of disease, 2019. 130: p. 104510. [CrossRef]
- Torres-Ceja, B. and M.L. Olsen, A closer look at astrocyte morphology: Development, heterogeneity, and plasticity at astrocyte leaflets. Current Opinion in Neurobiology, 2022. 74: p. 102550. [CrossRef]
- Zhang, H. , et al., Dynamic Transitions of Epilepsy Waveforms Induced by Astrocyte Dysfunction and Electrical Stimulation. Neural Plast, 2020. 2020: p. 8867509. [CrossRef]
- Steinhauser, C., G. Seifert, and P. Bedner, Astrocyte dysfunction in temporal lobe epilepsy: K+ channels and gap junction coupling. Glia, 2012. 60(8): p. 1192-202. [CrossRef]
- Seifert, G., G. Carmignoto, and C. Steinhauser, Astrocyte dysfunction in epilepsy. Brain Res Rev, 2010. 63(1-2): p. 212-21. [CrossRef]
- Heinemann, U., D. Kaufer, and A. Friedman, Blood-brain barrier dysfunction, TGFbeta signaling, and astrocyte dysfunction in epilepsy. Glia, 2012. 60(8): p. 1251-7. [CrossRef]
- Robinson, C., C. Apgar, and L.A. Shapiro, Astrocyte Hypertrophy Contributes to Aberrant Neurogenesis after Traumatic Brain Injury. Neural Plast, 2016. 2016: p. 1347987. [CrossRef]
- Pirttila, T.J. , et al., Cystatin C expression is associated with granule cell dispersion in epilepsy. Ann Neurol, 2005. 58(2): p. 211-23. [CrossRef]
- Liu, X. , et al., Manganese-induced neurotoxicity: the role of astroglial-derived nitric oxide in striatal interneuron degeneration. Toxicol Sci, 2006. 91(2): p. 521-31. [CrossRef]
- Liddelow, S.A. , et al., Neurotoxic reactive astrocytes are induced by activated microglia. Nature, 2017. 541(7638): p. 481-487. [CrossRef]
- Kharatishvili, I. and A. Pitkanen, Association of the severity of cortical damage with the occurrence of spontaneous seizures and hyperexcitability in an animal model of posttraumatic epilepsy. Epilepsy Res, 2010. 90(1-2): p. 47-59. [CrossRef]
- Hunt, R.F., S. W. Scheff, and B.N. Smith, Regionally localized recurrent excitation in the dentate gyrus of a cortical contusion model of posttraumatic epilepsy. J Neurophysiol, 2010. 103(3): p. 1490-500. [CrossRef]
- Lothman, E.W., E. H. Bertram, 3rd, and J.L. Stringer, Functional anatomy of hippocampal seizures. Prog Neurobiol, 1991. 37(1): p. 1-82. [CrossRef]
- Lowenstein, D.H. , et al., Selective vulnerability of dentate hilar neurons following traumatic brain injury: a potential mechanistic link between head trauma and disorders of the hippocampus. J Neurosci, 1992. 12(12): p. 4846-53. [CrossRef]
- Golarai, G. , et al., Physiological and structural evidence for hippocampal involvement in persistent seizure susceptibility after traumatic brain injury. J Neurosci, 2001. 21(21): p. 8523-37. [CrossRef]
- Shapiro, L.A., L. Wang, and C.E. Ribak, Rapid astrocyte and microglial activation following pilocarpine-induced seizures in rats. Epilepsia, 2008. 49 Suppl 2: p. 33-41. [CrossRef]
- Golub, V.M. and D.S. Reddy, Contusion brain damage in mice for modelling of post-traumatic epilepsy with contralateral hippocampus sclerosis: Comprehensive and longitudinal characterization of spontaneous seizures, neuropathology, and neuropsychiatric comorbidities. Exp Neurol, 2022. 348: p. 113946. [CrossRef]
- Di Sapia, R. , et al., In-depth characterization of a mouse model of post-traumatic epilepsy for biomarker and drug discovery. Acta Neuropathol Commun, 2021. 9(1): p. 76. [CrossRef]
- Butler, C.R., J. A. Boychuk, and B.N. Smith, Differential effects of rapamycin treatment on tonic and phasic GABAergic inhibition in dentate granule cells after focal brain injury in mice. Exp Neurol, 2016. 280: p. 30-40. [CrossRef]
- Bugay, V. , et al., A Mouse Model of Repetitive Blast Traumatic Brain Injury Reveals Post-Trauma Seizures and Increased Neuronal Excitability. J Neurotrauma, 2020. 37(2): p. 248-261. [CrossRef]
- Frankowski, J.C., Y. J. Kim, and R.F. Hunt, Selective vulnerability of hippocampal interneurons to graded traumatic brain injury. Neurobiol Dis, 2019. 129: p. 208-216. [CrossRef]
- Zhu, B., J. Eom, and R.F. Hunt, Transplanted interneurons improve memory precision after traumatic brain injury. Nat Commun, 2019. 10(1): p. 5156. [CrossRef]
- Kron, M.M., H. Zhang, and J.M. Parent, The developmental stage of dentate granule cells dictates their contribution to seizure-induced plasticity. J Neurosci, 2010. 30(6): p. 2051-9. [CrossRef]
- Parent, J.M. , et al., Dentate granule cell neurogenesis is increased by seizures and contributes to aberrant network reorganization in the adult rat hippocampus. J Neurosci, 1997. 17(10): p. 3727-38. [CrossRef]
- Covolan, L. , et al., Cell damage and neurogenesis in the dentate granule cell layer of adult rats after pilocarpine- or kainate-induced status epilepticus. Hippocampus, 2000. 10(2): p. 169-80.
- Houser, C.R. , Granule cell dispersion in the dentate gyrus of humans with temporal lobe epilepsy. Brain Res, 1990. 535(2): p. 195-204. [CrossRef]
- Jinde, S., V. Zsiros, and K. Nakazawa, Hilar mossy cell circuitry controlling dentate granule cell excitability. Front Neural Circuits, 2013. 7: p. 14. [CrossRef]
- Cho, K.O. , et al., Aberrant hippocampal neurogenesis contributes to epilepsy and associated cognitive decline. Nat Commun, 2015. 6: p. 6606. [CrossRef]
- Gong, C. , et al., Reelin regulates neuronal progenitor migration in intact and epileptic hippocampus. J Neurosci, 2007. 27(8): p. 1803-11. [CrossRef]
- Farhy-Tselnicker, I. , et al., Activity-dependent modulation of synapse-regulating genes in astrocytes. Elife, 2021. 10. [CrossRef]
- Hasegawa, A. , et al., Regulation of glial development by cystatin C. J Neurochem, 2007. 100(1): p. 12-22. [CrossRef]
- Pirttila, T.J. , et al., Cystatin C modulates neurodegeneration and neurogenesis following status epilepticus in mouse. Neurobiol Dis, 2005. 20(2): p. 241-53. [CrossRef]
- Gavrilovici, C. , et al., Postnatal Role of the Cytoskeleton in Adult Epileptogenesis. Cereb Cortex Commun, 2020. 1(1): p. tgaa024. [CrossRef]
- Perveen, N. , et al., Temporal Lobe Epilepsy: What do we understand about protein alterations? Chemical Biology & Drug Design, 2021. 98(3): p. 377-394. [CrossRef]
- do Canto, A.M. , et al., Neuroproteomics in Epilepsy: What Do We Know so Far? Frontiers in Molecular Neuroscience, 2021. 13.
- Zhang, S. , et al., Elevated expression of pleiotrophin in pilocarpine-induced seizures of immature rats and in pentylenetetrazole-induced hippocampal astrocytes in vitro. Acta Histochem, 2014. 116(2): p. 415-20. [CrossRef]
Disclaimer/Publisher’s Note: The statements, opinions and data contained in all publications are solely those of the individual author(s) and contributor(s) and not of MDPI and/or the editor(s). MDPI and/or the editor(s) disclaim responsibility for any injury to people or property resulting from any ideas, methods, instructions or products referred to in the content. |
© 2023 by the authors. Licensee MDPI, Basel, Switzerland. This article is an open access article distributed under the terms and conditions of the Creative Commons Attribution (CC BY) license (http://creativecommons.org/licenses/by/4.0/).


