1. Introduction
The separation of ions in gaseous media at atmospheric pressure is based on two main techniques. First is a time-of-flight method where ions of different mobility travel in a gas with different velocities, for example, Ion Mobility Spectrometers (IMS), Karasek (1974). In an IMS device, ions of various mobilities are issued simultaneously at the beginning of a drift tube and detected separately according to the drift time by a detector at the end of the drift tube, Eiceman and Karpas (2005). The duty cycle of an IMS is linked to the resolving power (RP) and normally it is circa 1%, Hill et al. (1990).
In the second technique ions are separated in space. An example of this approach is Field Asymmetric waveform Ion Mobility Spectrometry (FAIMS) where ions are separated according to a deviation of the ion mobility in a high electric field from mobility at the zero or low electric field, Buryakov et al. (1993). This enables a duty cycle of up to 100% in the ion filter mode when one ion is detected. The main disadvantage of FAIMS is a smaller variation in the deviation of the ion mobility at high electric field than variations in the ion mobility utilised in IMS. Therefore, it is rather difficult to increase the RP of FAIMS to the level of the IMS RP.
An important class of spatial ion selectors are Differential Mobility Analysers (DMA) that have been widely used for separation of ionised nanoparticles, Baron and Willeke (2001). Some nanoparticle DMAs have been applied for separation of ions, e.g., de la Mora et al. (1998). A DMA can work in a voltage scanning regime as a spectrometer or in a constant fixed voltage as an ion filter.
A planar DMA has an advantage of a high RP and sensitivity of ion detection. For example, a planar DMA with a performance close to the theoretical limit has been reported by Labowsky and de la Mora (2006). An interesting design described by Amo-Gonzaĺez and Peŕez (2018) enables achievement of an RP of 110. However, to achieve this resolution a sheath flow rate of order 1,000 l/min is necessary. Powerful and expensive pumps are required to achieve these flow rates. This restricts applications of this design for airport security where desktop or portable devices are required.
The diffusion of ions/molecules in a fluid is a combination of turbulent diffusion and Brownian diffusion, Kulkarni et al. (2011). In an ion DMA, the diffusion broadening of an ion cloud is defined by the residence time and controlled by increasing the sheath flow rate. A high sheath flow rate is needed to reduce the ion residence time and therefore diffusion broadening of ion clouds in the ion selection zone of a DMA. Here, we investigate if it’s possible to increase the resolution of an ion selecting device by optimising the ion cloud geometry, without generating very high sheath flow rates.
2. Ion cloud modelling and conceptual design optimisation
There are several ways to model ion separation in a fluid. The first approach is based on analysis of the width of Lagrangian trajectory packs. This approach gives the maximal value of the RP when the diffusion broadening is not considered. The advantage of the Lagrangian approach is the simplicity of numerical modelling and ability to identify the trend and basic response of the system to controls (geometry parameters, flow rates and voltage differences), Gorbunov (2020). In general, this approach allows inclusion of diffusion broadening in a Lagrangian numerical model, e.g., using Monte Carlo methods. However, in practice integration trajectories with diffusion requires complex algorithms with fine mesh structure. In practice supercomputer facilities are often needed to obtain reliable results in turbulent flows, Smith (1982).
The second, Eulerian approach, enables calculating diffusion broadening of ion clouds directly by considering the diffusivity of ions superimposed on the convection field comprising of both the drag and electric forces. This provides a 3D concentration field of ions with diffusion broadening. The latter approach seems to be ideal for calculating the RP.
In the reality it is not that simple. The diffusion mass transfer is much slower than the transfer by the drag and electric forces. This may cause appearances of negative concentrations in numerical solutions and widens the ion cloud dimensions, see more below. This problem is well known but a solution appropriate for routine applications has not been found yet. In this paper we use both Lagrangian and Eulerian approaches utilising their strong features for optimisation of the design enabling high resolution of ion separation.
The third is a hybrid approach where the Lagrangian approach is combined with analytical consideration of the diffusion broadening. The ion separation is a 3D problem where diffusion along the inlet and outlet slits (normal direction to the E-field (Z) and the sheath flow velocity field (X)) can be neglected. According to the Lagrangian approach the diffusion alongside the ion trajectory does not affect the ion cloud thickness. On the contrary, diffusion in the normal direction (to the ion trajectories) is crucial to the thickness of the ion cloud.
The hybrid approach has been used here for optimisation of the ion separation. Modelling comprises of two stages: first Lagrangian ion trajectories were obtained without diffusion and then diffusion broadening was applied to widen the trajectories’ parcel according to expression (1). This was carried out for variable voltage differences between the separation electrodes similar to DMA scans.
The resolution or resolving power of a conventional nanoparticle DMA is defined by the ratio of the sheath flow rate Qsh to the sample flow rate Qsamp, Steer et al., (2014). For a given geometry this ratio defines the residence time tR and the initial width of the ionised particle cloud in the DMA sample inlet slit. The width of the ionised particle cloud at the selected particle outlet is practically equal to the width of the sample, Kulkarni et al., (2011). This is due to a negligeable contribution from the diffusivity to separation of aerosol particles within a DMA. Therefore, the RP of a DMA is a function of Qsh/Qsamp. The negligeable diffusivity approximation works well for all aerosol particles except the very small nanoparticle below 10 nm.
Separation of ions is a different matter than separation of aerosol particles. The width of a molecular ion cloud in the selected ion outlet is not equal to the width of the ion cloud in the sample inlet. The ion cloud at the selected ion outlet is greater than the width of the ion cloud in the ion sample inlet due to diffusional broadening,
Figure 1. In the outlet slit of the ion DMA the full width at half maximum (FWHM) is defined as follows
where
Df is the total diffusion coefficient.
Ions with mobility k1 and k2 are issued from the low left corner of the separation zone and are shown schematically with straight lines. At the top electrode ions arrived at different x-coordinates separated by ΔL. The resolution criterion is defined by an inequality: FWHM < ΔL and the minimal RP is defined as FWHM = ΔL.
Expression (1) is for the zero width of the ion cloud in the sample inlet when the ion cloud profile is a δ(x) function. If the initial ion cloud width is greater than zero, the ion cloud profile at the top electrode is going to be wider. The resolution of the ion DMA is influenced by the width of the ion cloud in the sample inlet. Therefore, if we reduce the width of the ion cloud at the sample inlet electrode, then the resolving power will be increased.
This assumption opens the way for ion cloud engineering using an approach termed Anisotropic Diffusion (AD) where ions are urged by combination of the electric field force and drag force to form a thin (a narrow width) ion cloud close to the δ(x)-function. An implementation of this approach is described below as a device: Anisotropic Diffusion Mobility Analyser (ADMA).
The ADMA comprises of an ionisation chamber, ion cloud forming section, an ion separating chamber and a selected ion detecting device. An Individual Ion Counter (IIC) is shown in
Figure 2. The IIC is a novel device that enables to count ions individually, Gorbunov (2008). Optimisation of the engineering design was carried out to find system parameters satisfying several objectives:
Resolving power to be equal or greater than the RP of currently available systems used for airport security (RP>40)
Ion transfer rate from the ionisation region to the ion outlet to the Faraday ion collector should be in the range from 10% to 100%
The cost of manufacturing the system should be lower than currently used devices ($10k).
The system design was optimised in a multidimensional space of variable geometrical parameters (18 dimensions) and various operational parameters (up to 15 flow rates and voltage differences).
Multi-objective optimization is widely used in modern engineering design. Here, the optimisation process comprises of three objective functions to be optimized simultaneously with the aim of finding a location in 33-dimensional parameter space where all the objectives are achieved. In practice, this involves many iterations where, in some steps, the objectives and parameter sets are analysed to identify the optimal direction toward a satisfactory solution.
It is known that for a nontrivial multi-objective optimization problem, no single solution exists that simultaneously optimizes all objectives. To avoid conflicting the objective functions, additional subjective information was gleaned from experimental data and mathematical analysis of the relevant physical problems. Six different geometric versions of the ADMA have been optimised.
Numerical modelling was an important part of the optimization. It was based on a transient model using COMSOL Multiphysics® comprising of a Fluid Dynamics module, with Electrostatics and Transport of Diluted Species interfaces. Complete models are prerequisites for optimization steps. The numerical modelling enables establishment of useful functional relationships between variable parameters and objectives. This requires an expert analysis of the modelling results at each step that include mathematical and physical analysis. It is well known that often a complex system shows a systematic bias in experimental data due to technical imperfections or human errors. For example, the sheath flow rate and flow quality quantification in ADMAs is notoriously difficult to measure especially in a turbulent flow. Flow meters typically generate eddies in the flow. This often causes the flow rates data to be systematically biased. To minimise all similar data uncertainties, it is preferable to analyse a series of measurements that show how objective functions Fo react on the change parameters {pi}: Fo(pi).
The geometry parameters are:
height and diameter of the ionisation chamber,
height, width, and depth of ion cloud shaping chamber,
three dimensions of the ion inlet slit,
three dimensions of ion separation zone of the ADMA,
three dimensions of selected ions outlet slit,
height and diameter of the tag inlet to the tagging chamber,
height and diameter of the tagged ions outlet, Gorbunov (2017).
These parameters were optimised for all ADMA versions.
3. Optimisation results
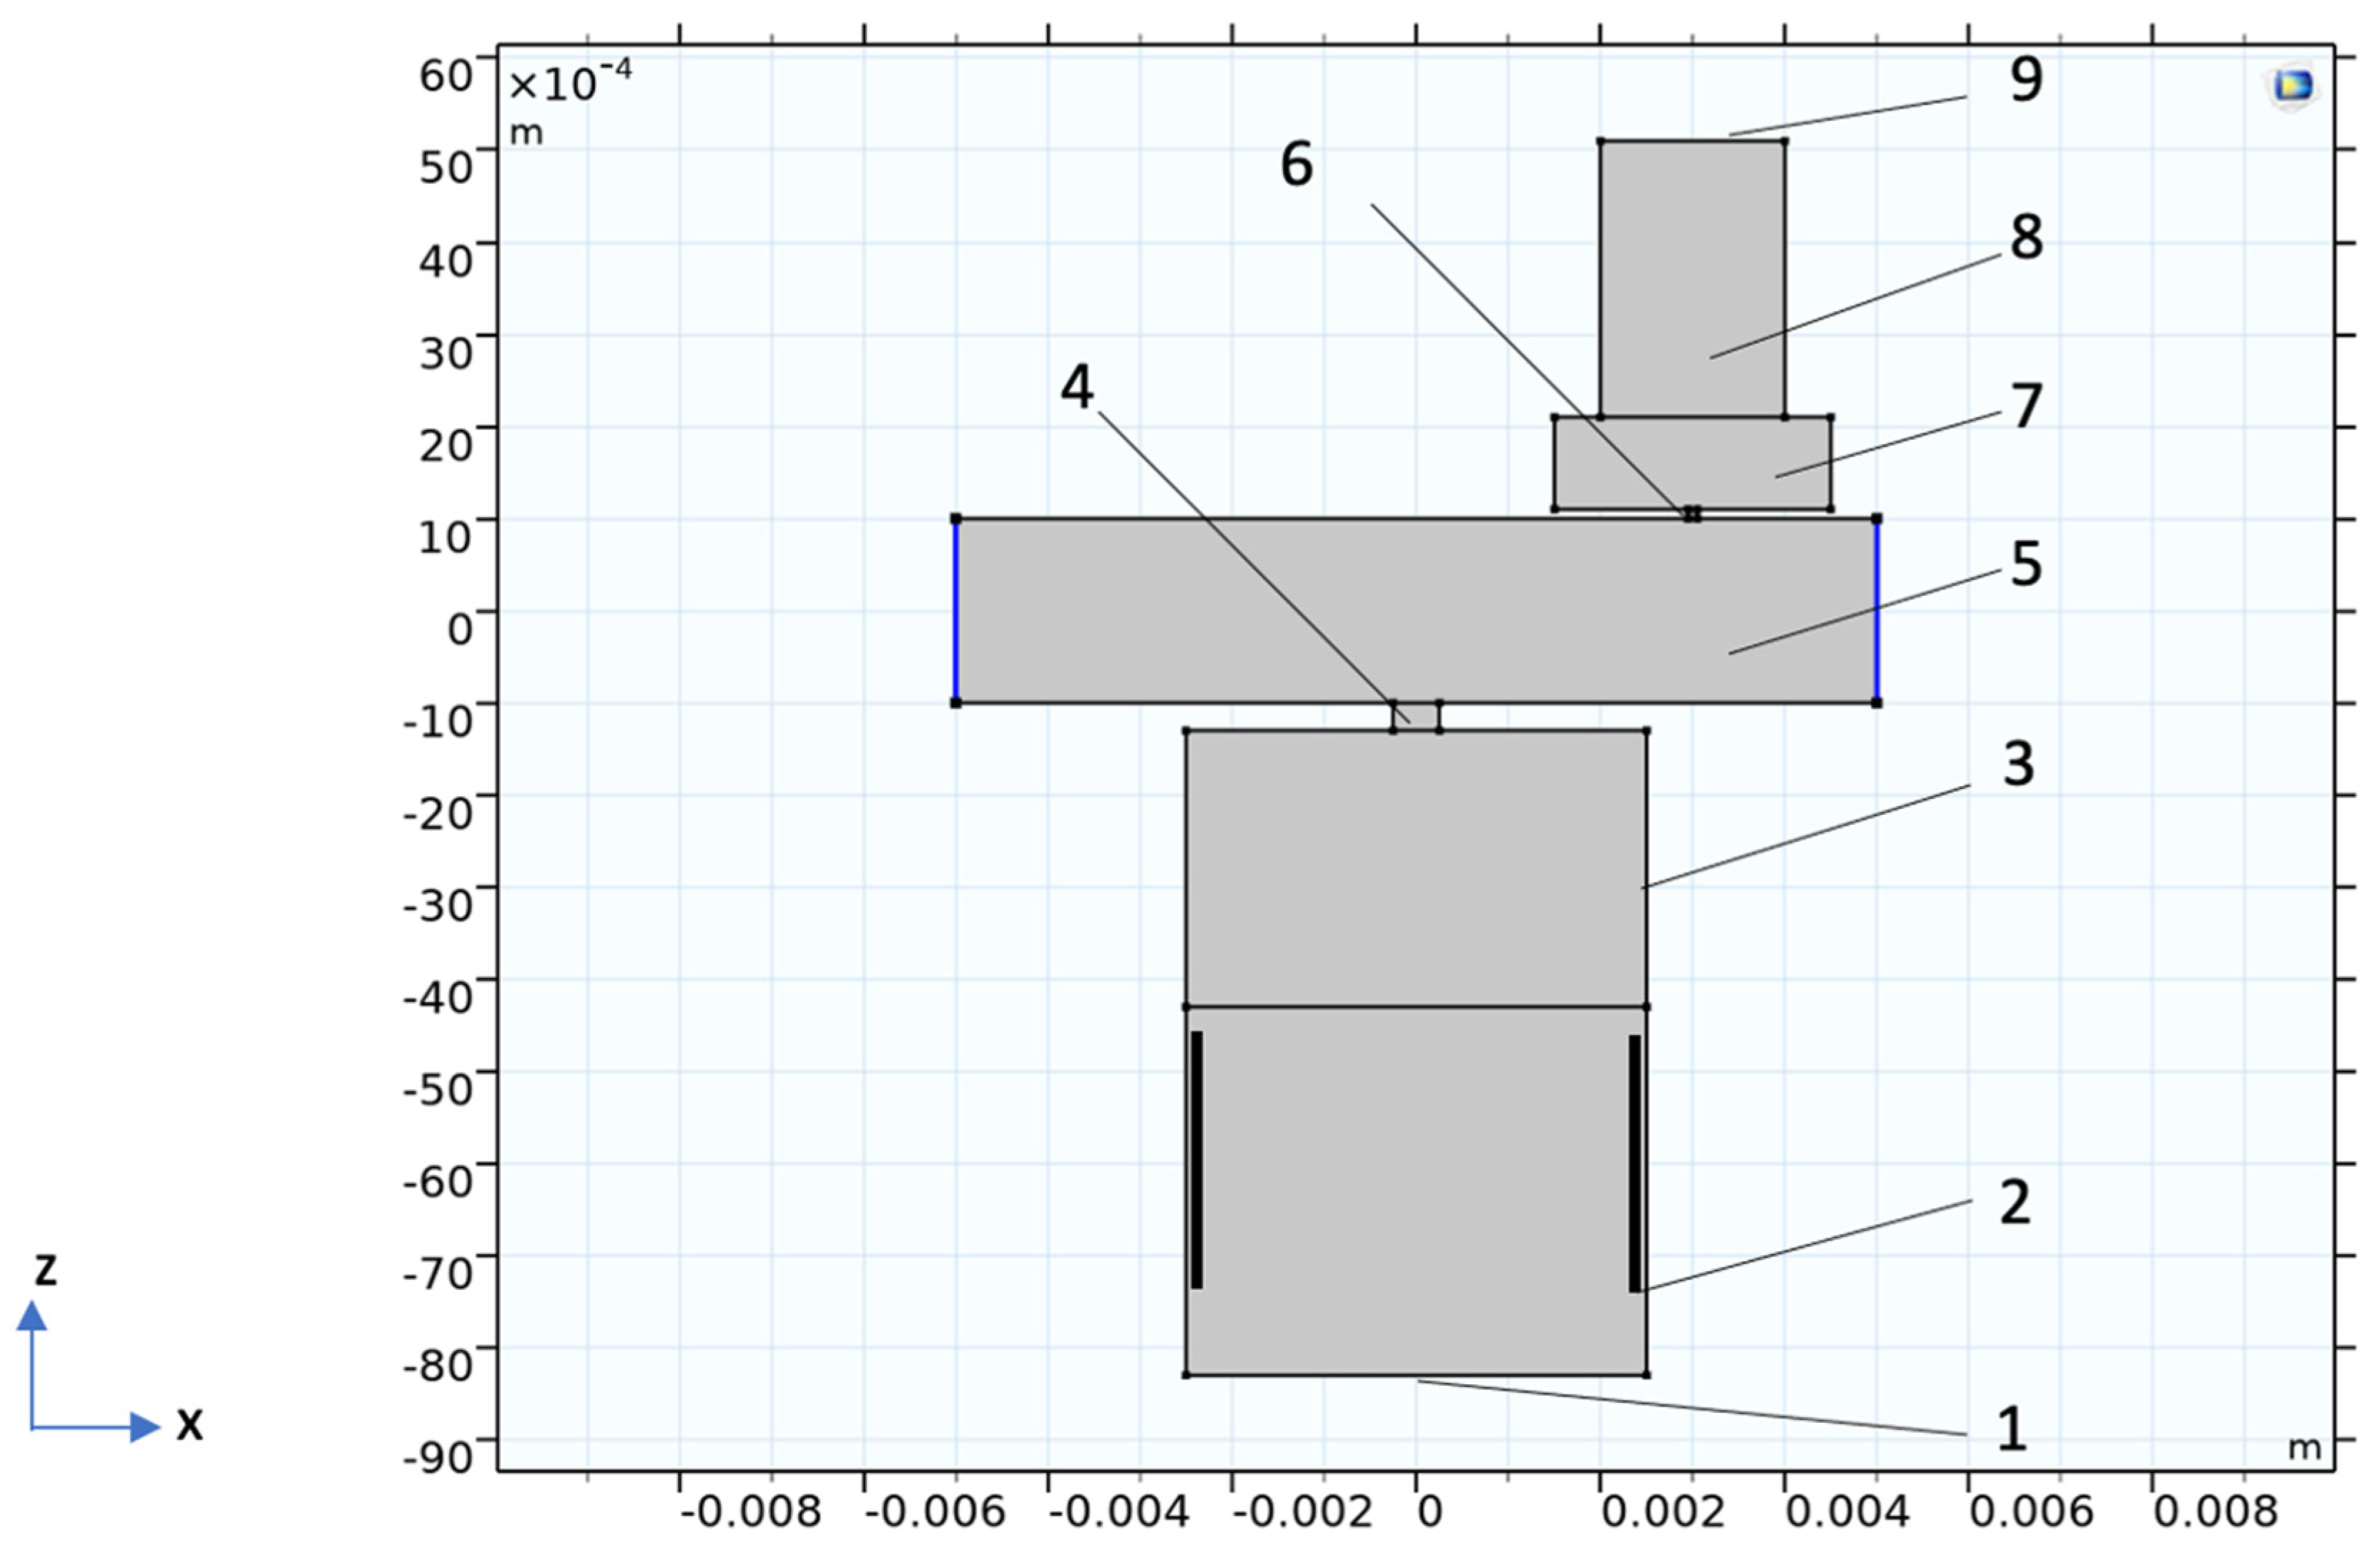
Optimisation was performed for all versions designed over several years in parallel with building and testing prototypes. The first three versions were optimised analytically using the assumption of uniform flow in the ion separation zone. The modelled RP obtained for these versions was gradually increasing with time from 30 to 40. Further progress was achieved by developing the ADMA concept and improving numerical modelling of the ion separation. One of the optimised models is shown in
Figure 2 where the geometry includes an ion cloud shaping chamber enabling engineering (directing?) of the ion cloud.
The ion cloud shaping chamber as well as the ADMA concept were novel, and therefore a comprehensive approach was necessary to evaluate the potential. This justifies a more realistic approach for modelling where nonuniformity of the flow was considered.
Figure 2.
An example schematic (X-Z cross-section) of the optimised ADMA system with 1 – sample inlet, 2- ionisation chamber with 63Ni foil (two bold black vertical lines), 3 – ion cloud shaping chamber, 4 – ion inlet slit, 5 – a fragment of the ion separation zone of the ADMA, 6 – selected ion outlet slit, 7 – tag inlet of the tagging chamber (8) and tagged ions outlet connected to an IIC (9). The left blue line indicates the sheath flow inlet into the ADMA ion separation zone, the right blue line – the sheath flow outlet of the separation zone.
The geometry shown in
Figure 2 is a conceptual geometry showing internal flow conduits. It is a simplified version of reality that gives a set of parameters for developing engineering drawings.
The hybrid approach to model the ADMA separation allows satisfactory optimisation in a reasonable time without using supercomputer resources. The final optimised version dimensions were found to be as follows:
The separation section of the ADMA cross-section – 2mm x 3mm and the length – 3mm,
The ion inlet slit - 0.5 mm x 2.5 mm x 0.3 mm (0.5 mm – width),
The selected ions outlet - 0.2 mm x 2.5 mm x 0.1 mm (0.2 mm – width),
The tag inlet to the tagging chamber – height was 1mm, diameter – 3 mm,
The height and diameter of the tagged ions outlet leading to an IIC were 3 mm and 2mm,
The width, depth and height of the ion cloud forming chamber were 5 mm, 5 mm and, 3 mm,
The height of the sample ionisation chamber was 6mm and the diameter 8 mm.
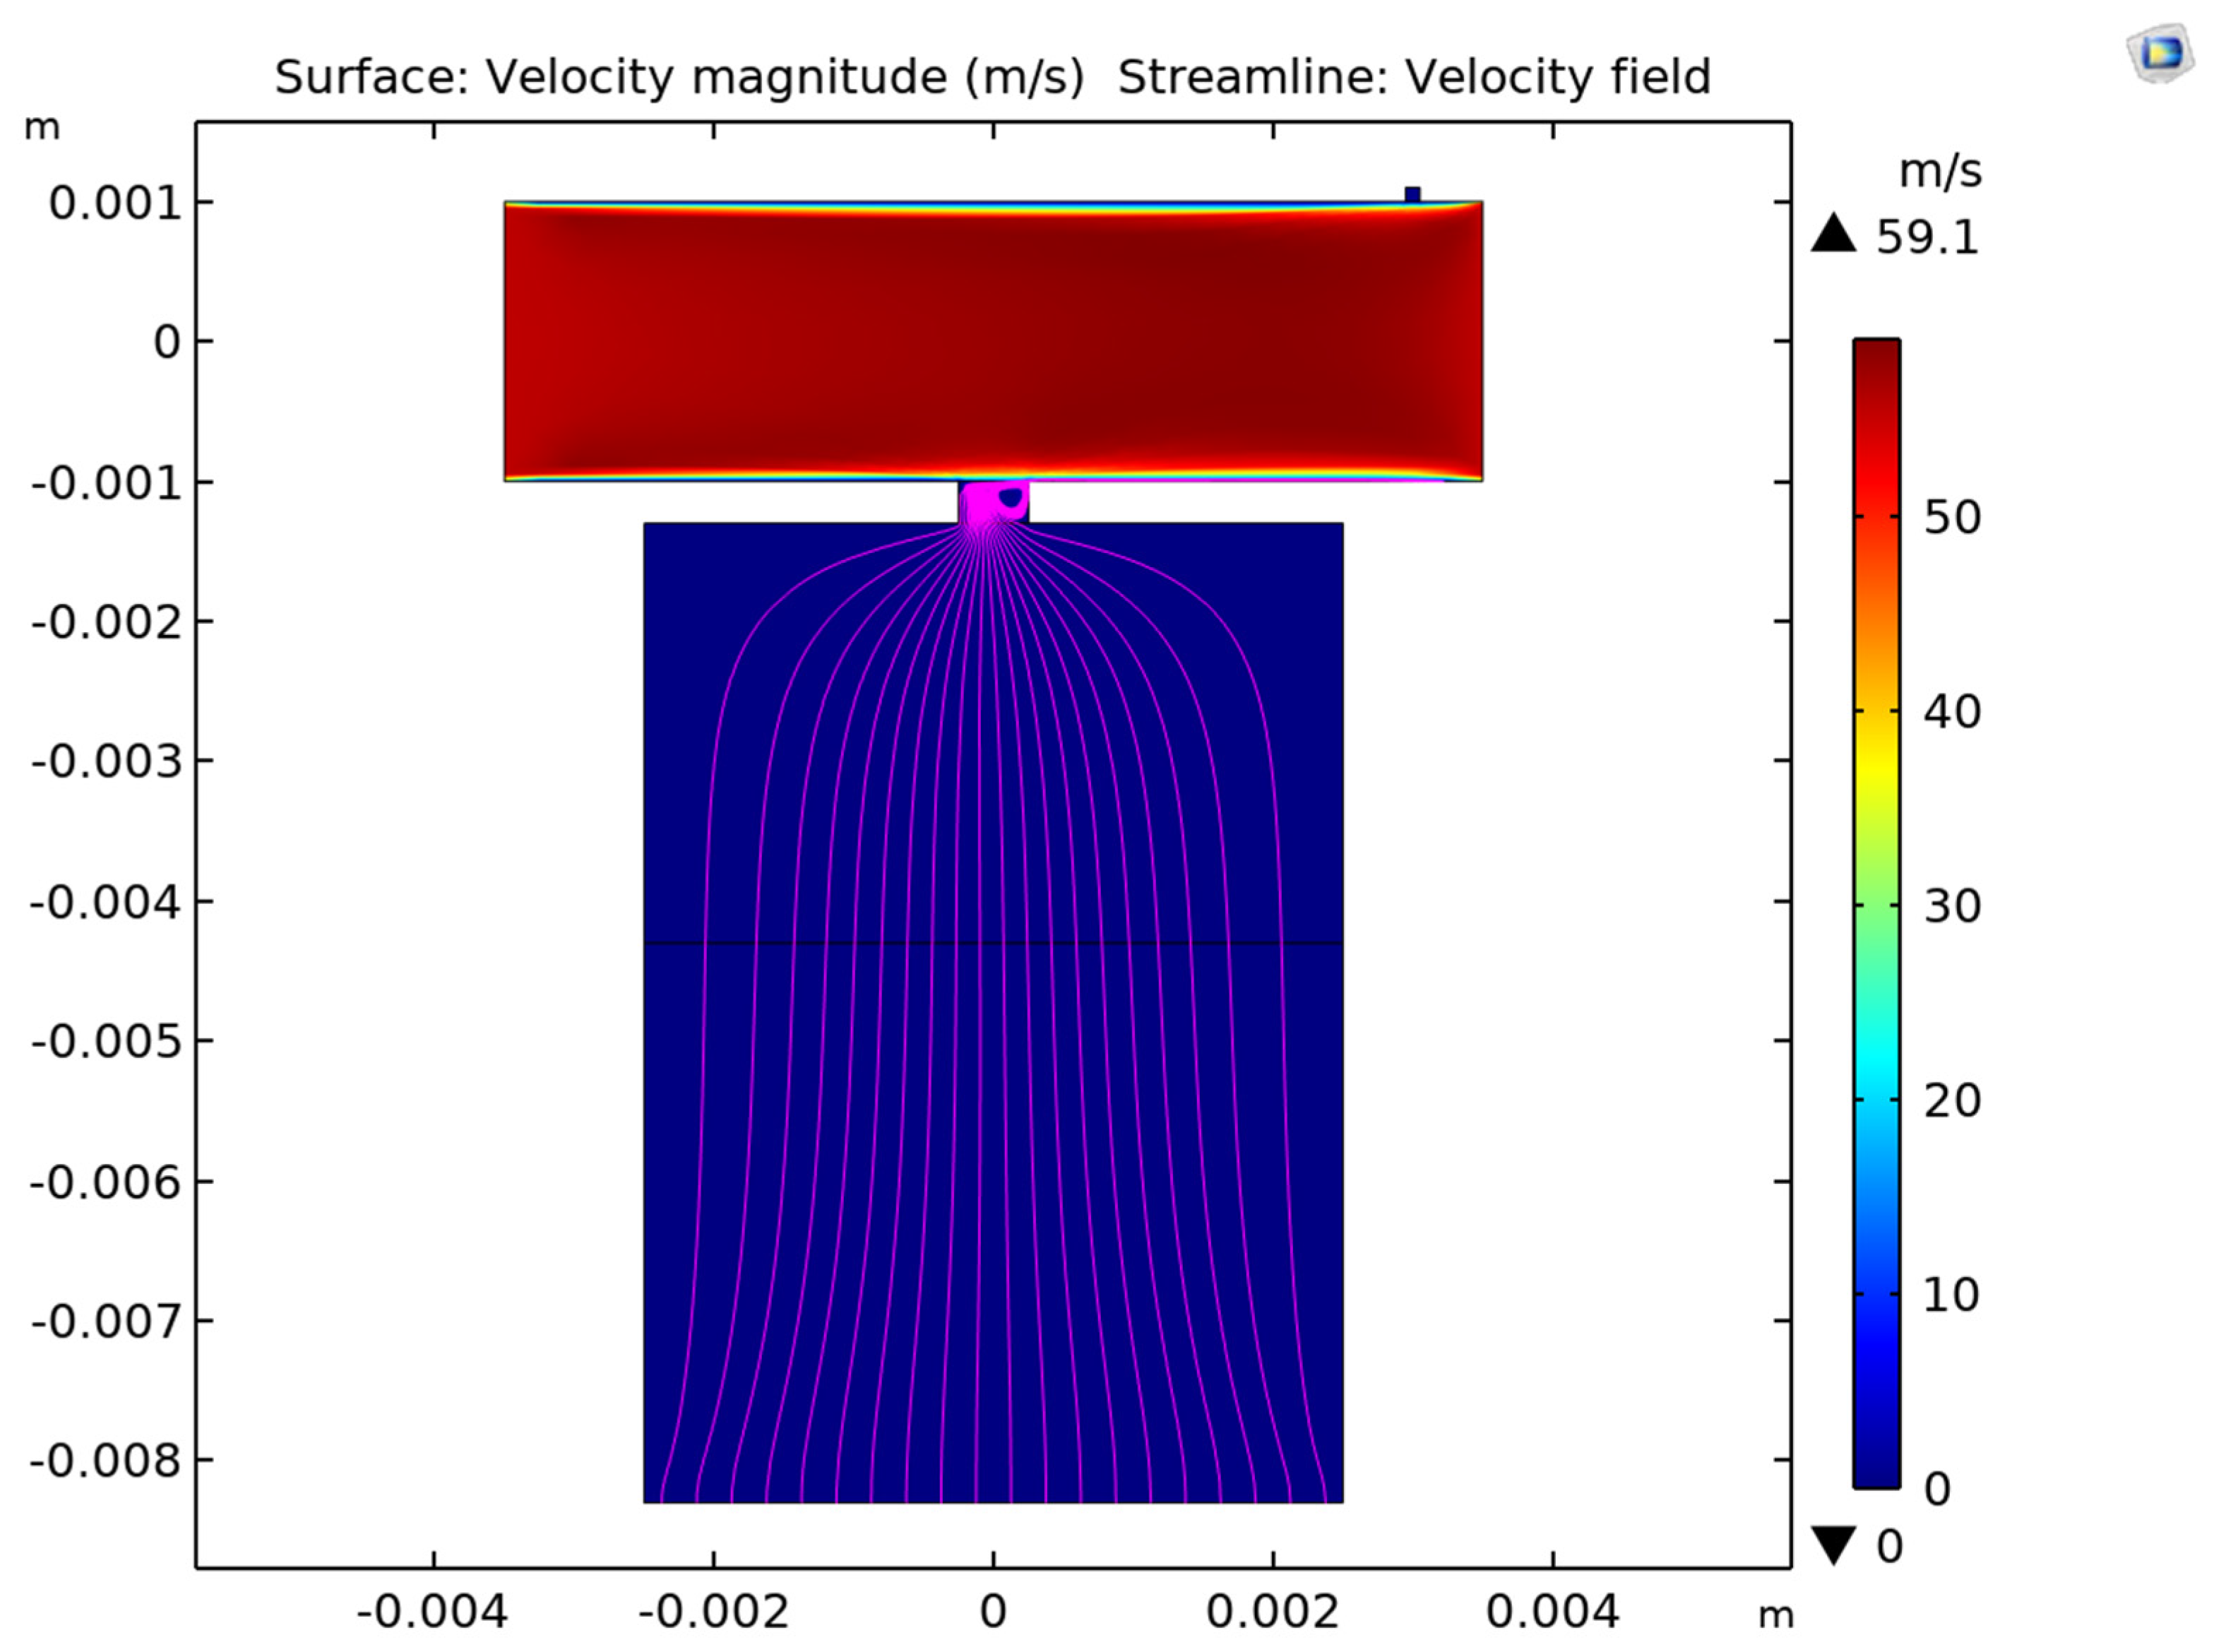
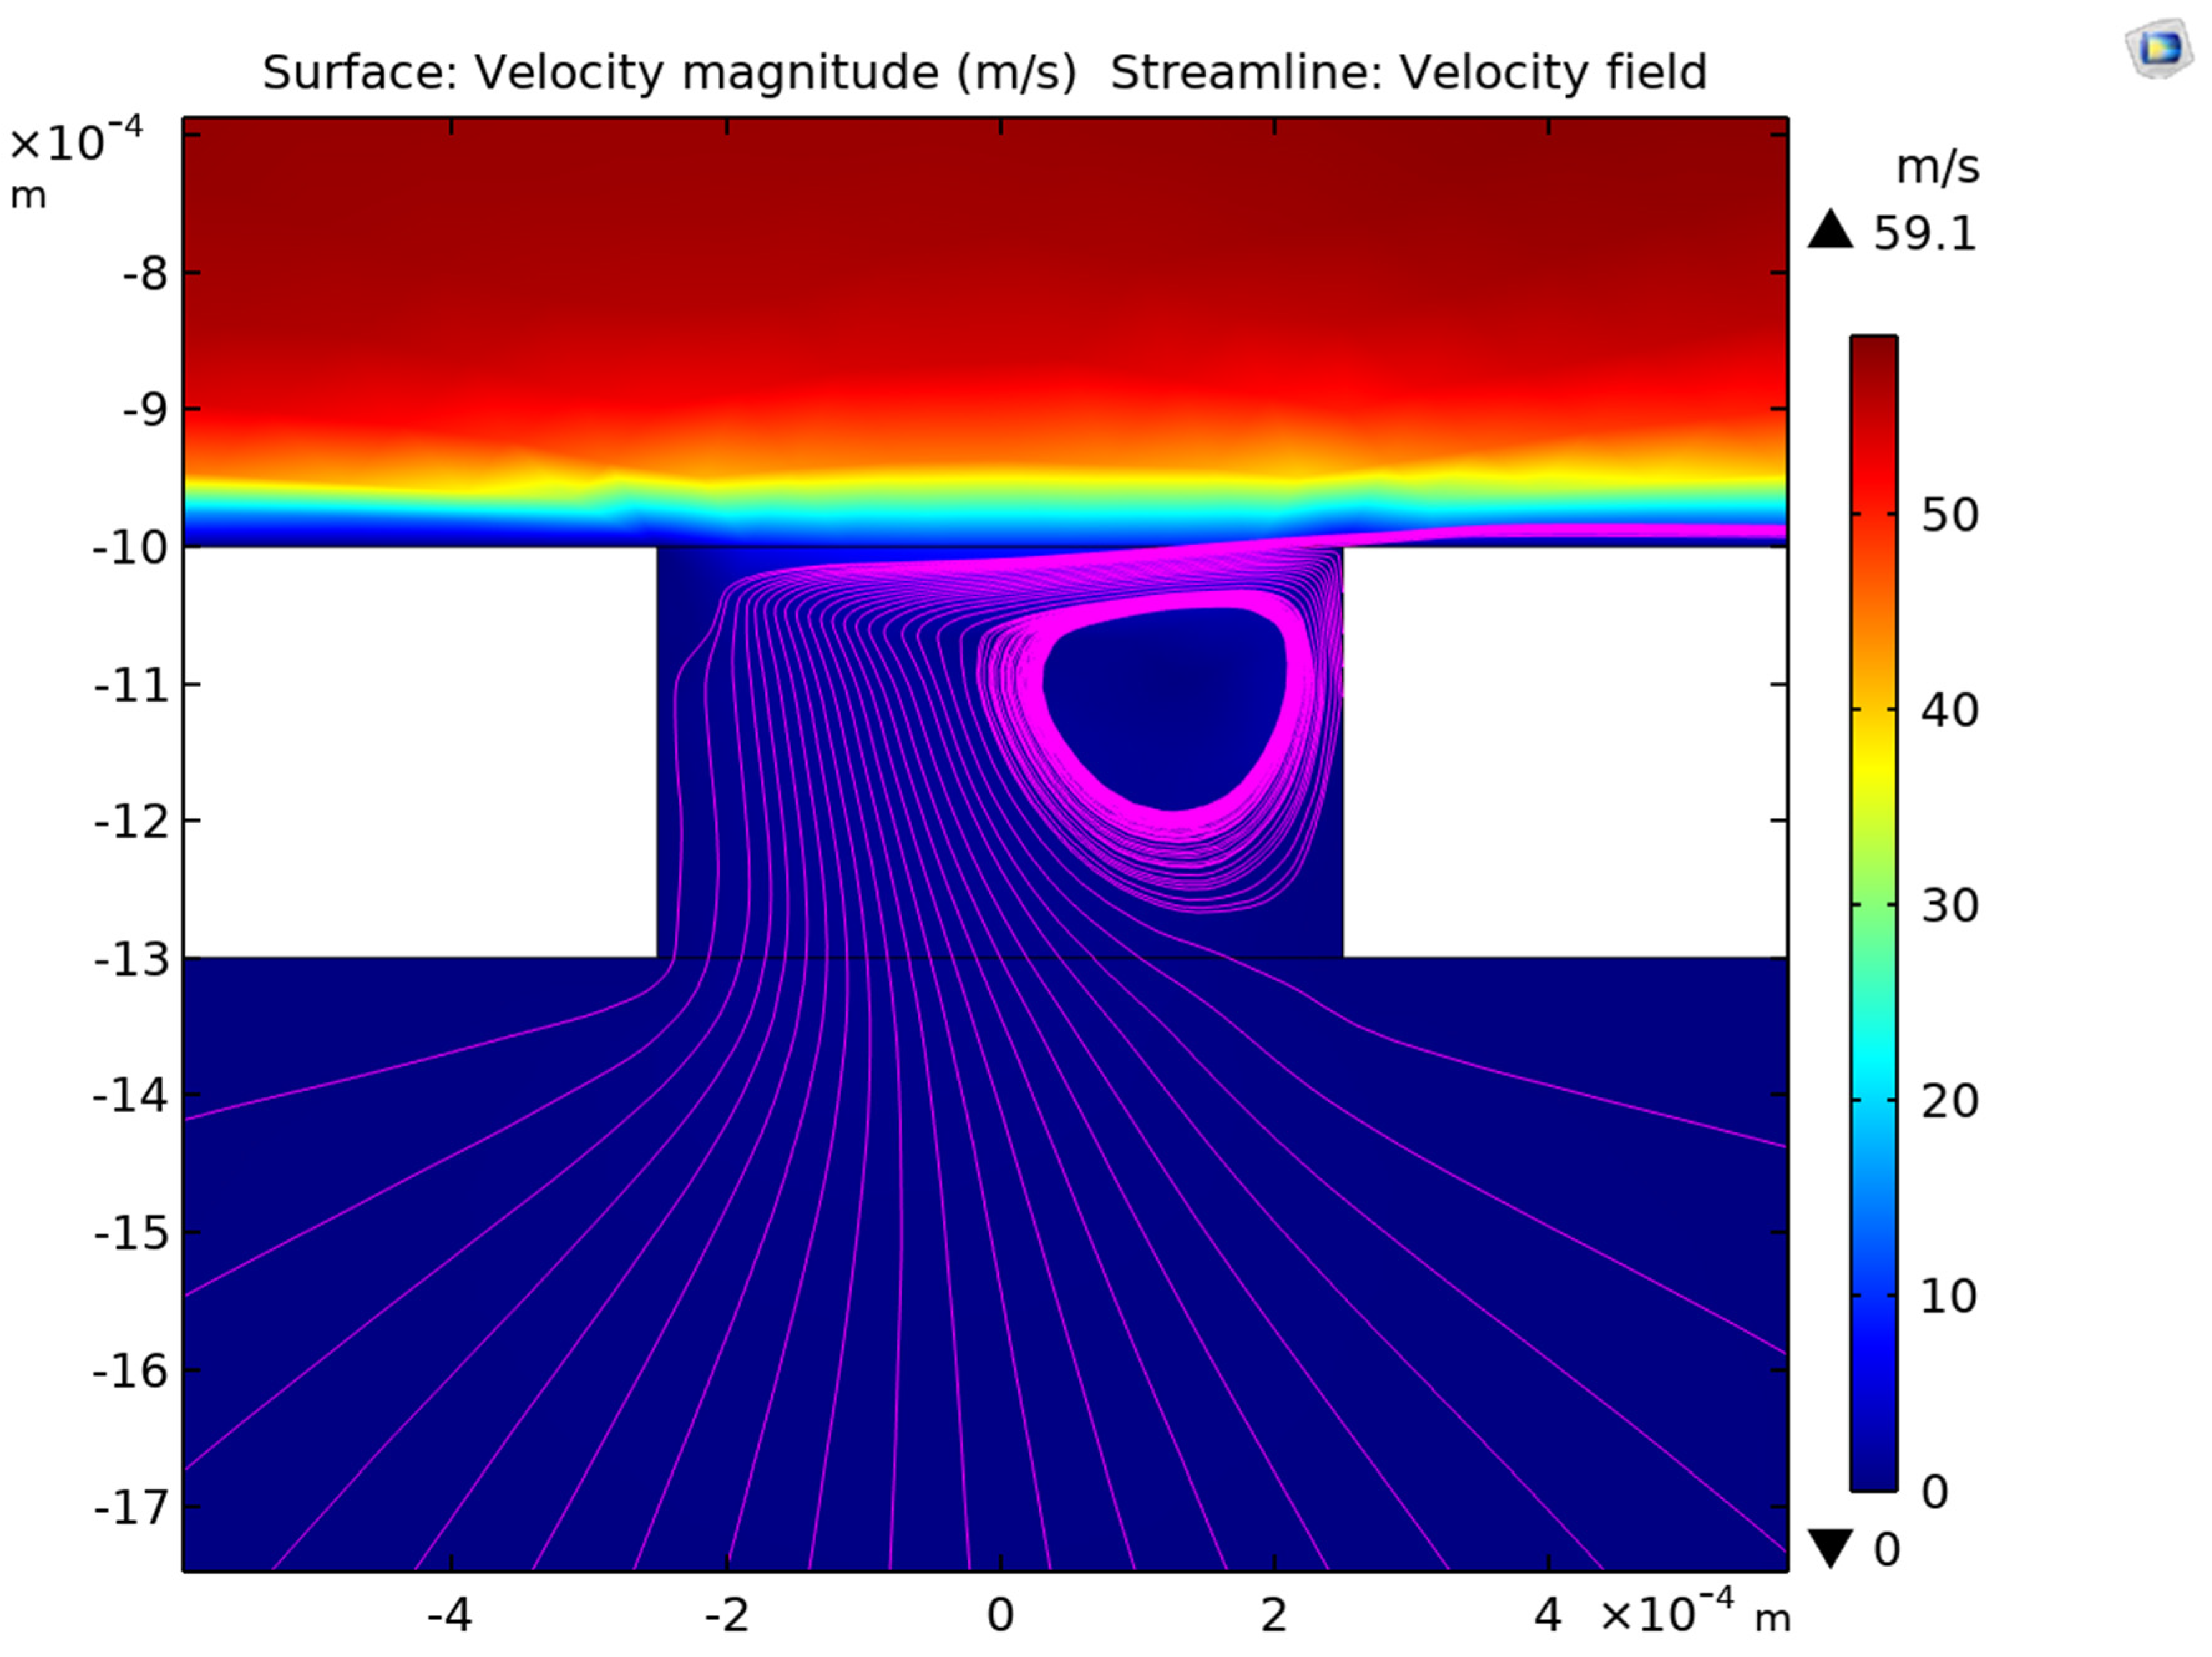
Modelling reveals complicated non-uniform flow patterns. For example, a large eddy is formed in the inlet of the sample flow into the separation section of the ADMA,
Figure 3. The large eddy (
Figure 4) is powered by the high velocity sheath flow. The eddy was observed in all runs with various Qsh and Qsamp. Non-uniformities like this eddy may lead to appearance of a local maximum in the RP objective and it can mask the existence of the global maximum.
The parameters most sensitive to performance (such as RP) are the cross-section of the sheath flow, dimensions of the ionised sample inlet, selected ions outlet and ion cloud forming section. The dimensions of the tagging chamber are mainly defined by the IIC, Gorbunov (2017). The ionisation chamber dimensions were not critical. During optimisation runs several variations of the ADMA geometry were found with high RP. The final choice of the engineering design was defined by the ion transfer rate and manufacturing considerations.
It should be noticed that a multi-objective optimisation does not provide the absolute maximum of the RP. Modelling enables finding a solution where the objectives are achieved, but it is extremely difficult to find the absolute maximum of the RP.
The large eddy shown in
Figure 3 and
Figure 4 potentially might disturb ion trajectories. Disturbance of the trajectories was observed during optimisation in some cases. Such disturbances were indicators of poor performance because of an association of the disturbances with decreasing the RP. Therefore, analysis of the Lagrangian ion trajectories enables finding a shorter way to the optimal geometry where ion trajectories are not disturbed by the eddy.
An example of a model where the presence of large eddies does not influence ion trajectories is shown in
Figure 5. The ion trajectories start in the ionisation chamber and then form into a sharp tip (X-Z plane) in the ion sample inlet. In the ADMA separation zone ions are deflected according to their mobility to the selected ion inlet through which they are directed to the IIC tagging chamber and finally counted.
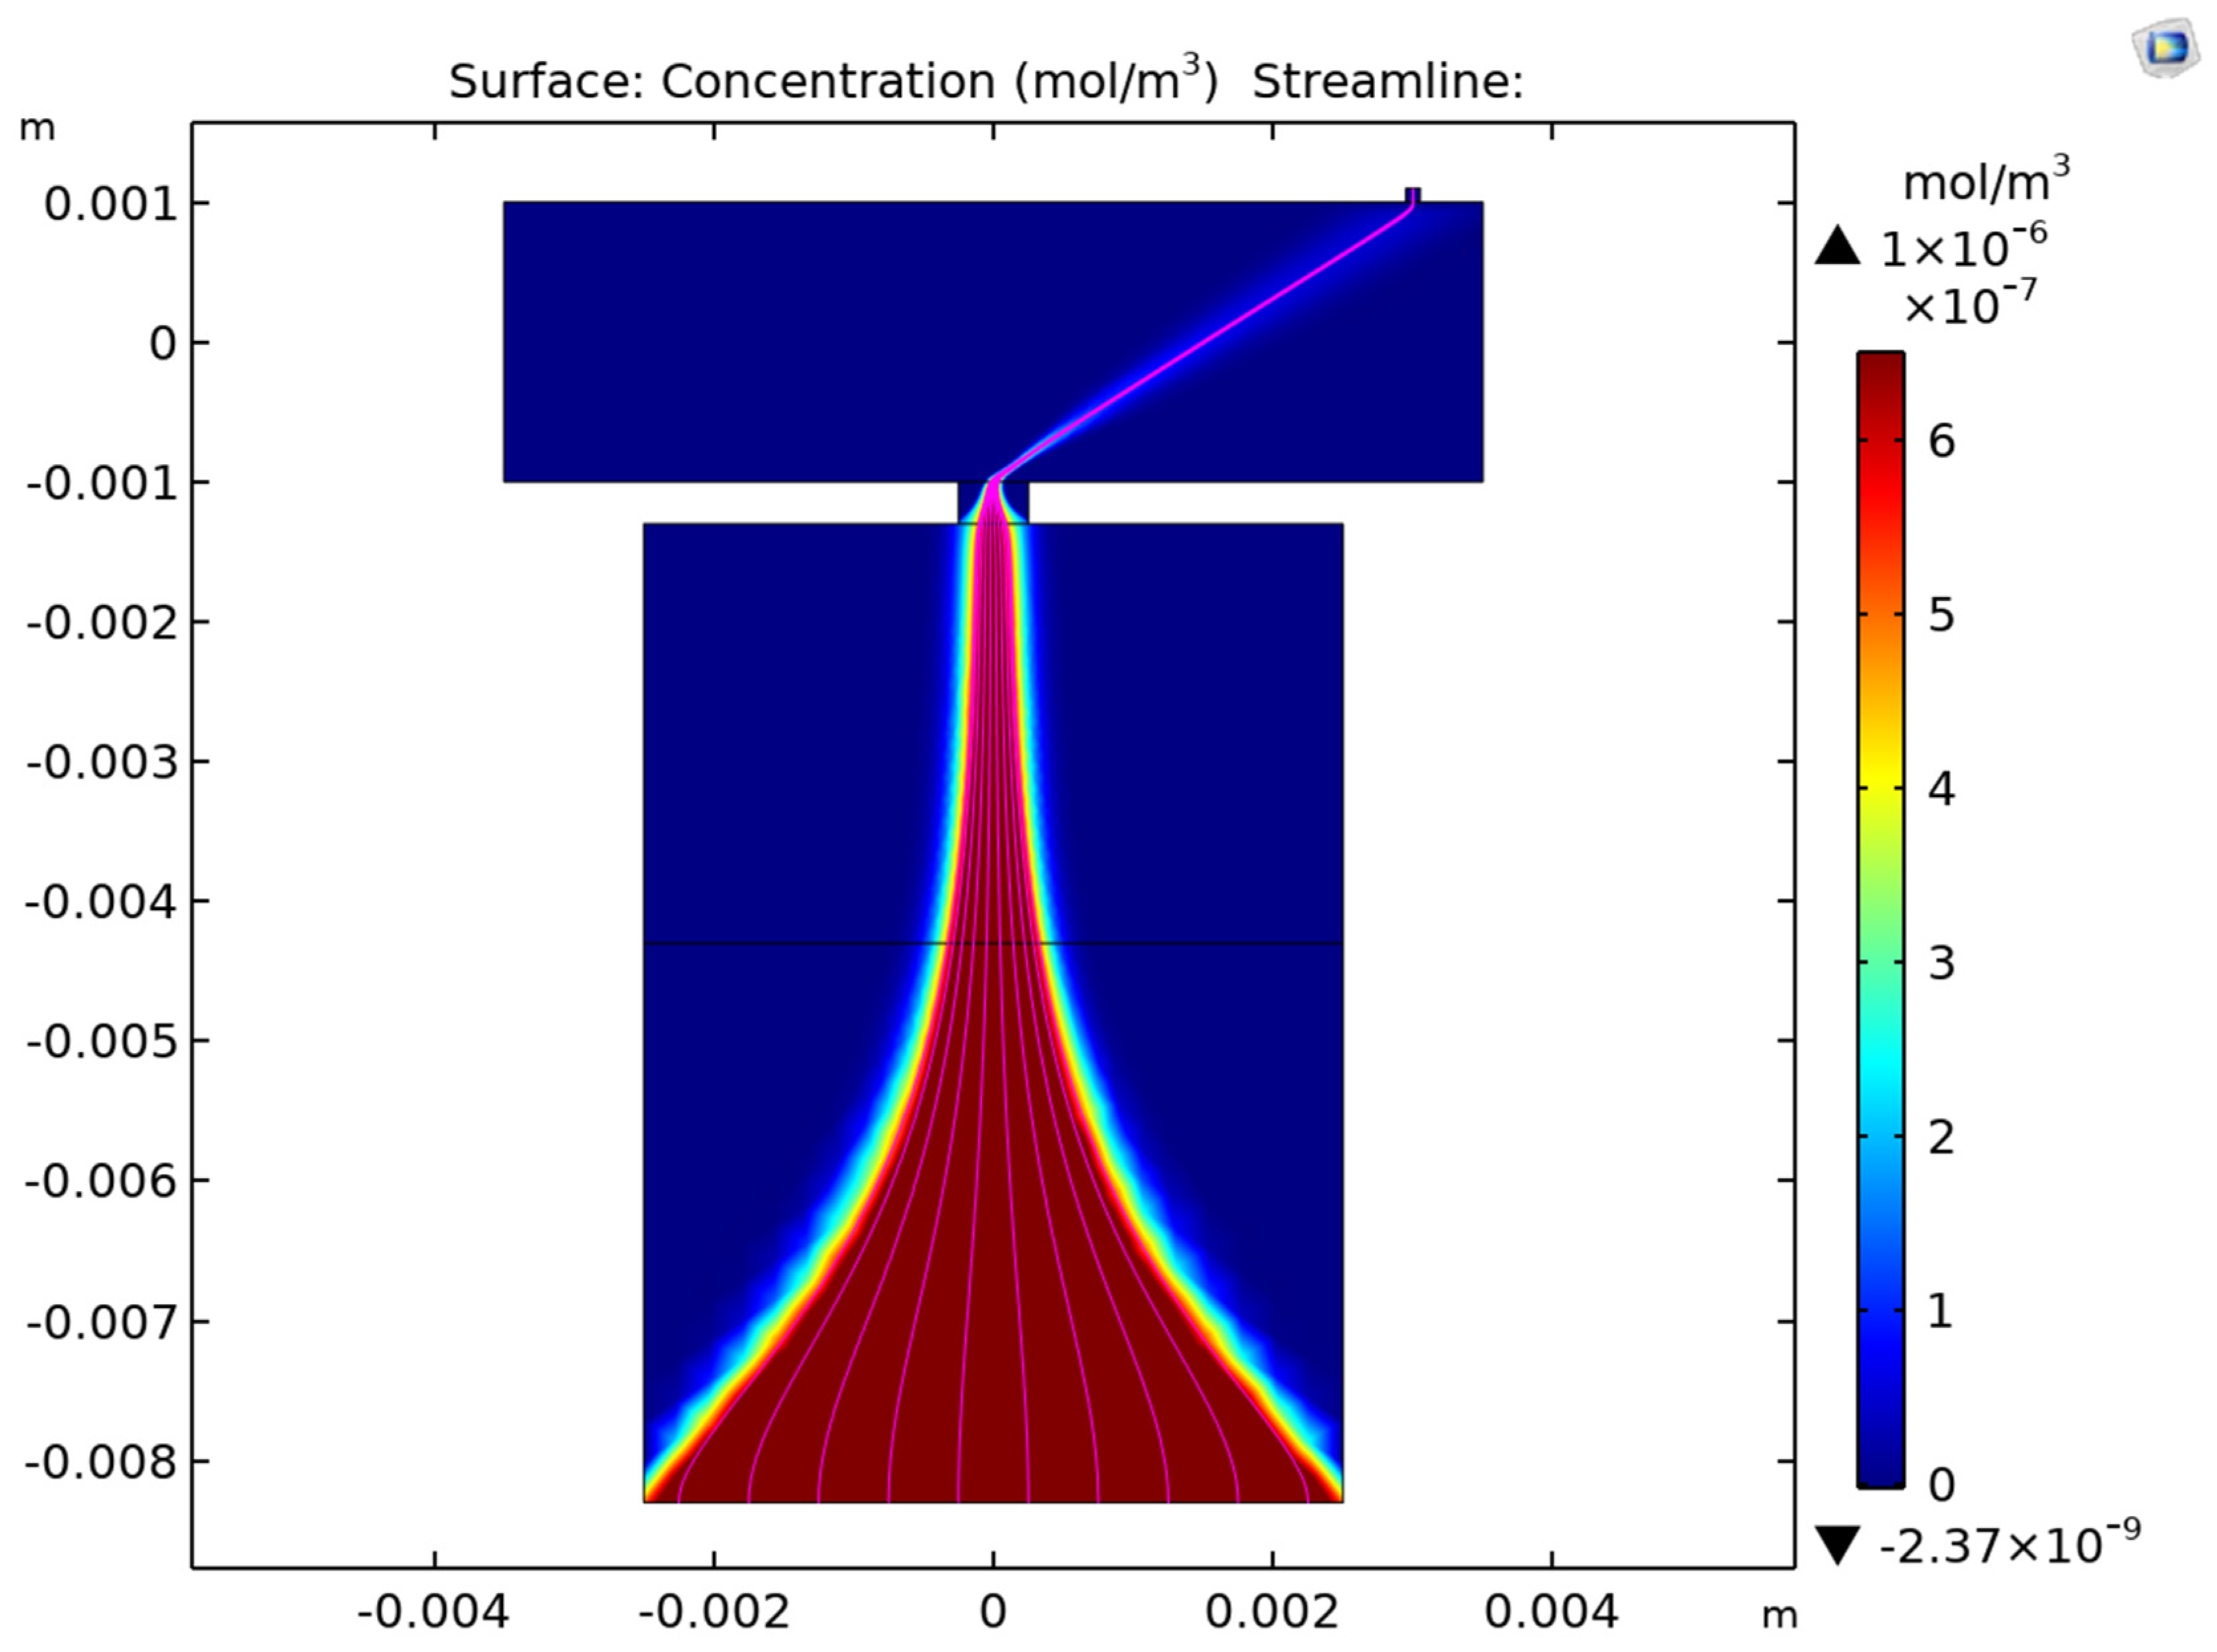
Analysis of ion trajectories is a useful way of rejecting parameters with undesirable performance, but Lagrangian trajectories do not show influence of the diffusion. For that the Eulerian approach enabling concentration of analytes to be calculated is required. Modelling of the concentration field was carried out in later stages of the optimisation. It was found that the concentration of ions forms a cloud that occupies the same space as the ion trajectories. In the ionisation chamber and in the ion-cloud shaping chamber the ion cloud is slightly wider than the ion trajectories,
Figure 6. It is difficult to see any difference in the ion separation chamber because of a small residence time in the ADMA, but a small difference was confirmed by analysis of concentration profiles.
The concentration field of analytes was calculated according to a Eulerian approach for various chemicals and for various geometries. An important observation was the presence of the negative concentrations in the concentrations field, e.g., -2.37·10
-9 mol/m
2/s (see the minimal value near the lower black triangle in
Figure 6). It was shown that negative concentrations are artefacts caused by insufficiently fine mesh, see the Supplementary materials. Therefore, a more reliable and practical way was to employ a hybrid approach to evaluate RP from Lagrangian trajectories and an analytical consideration of ion cloud broadening in the system.
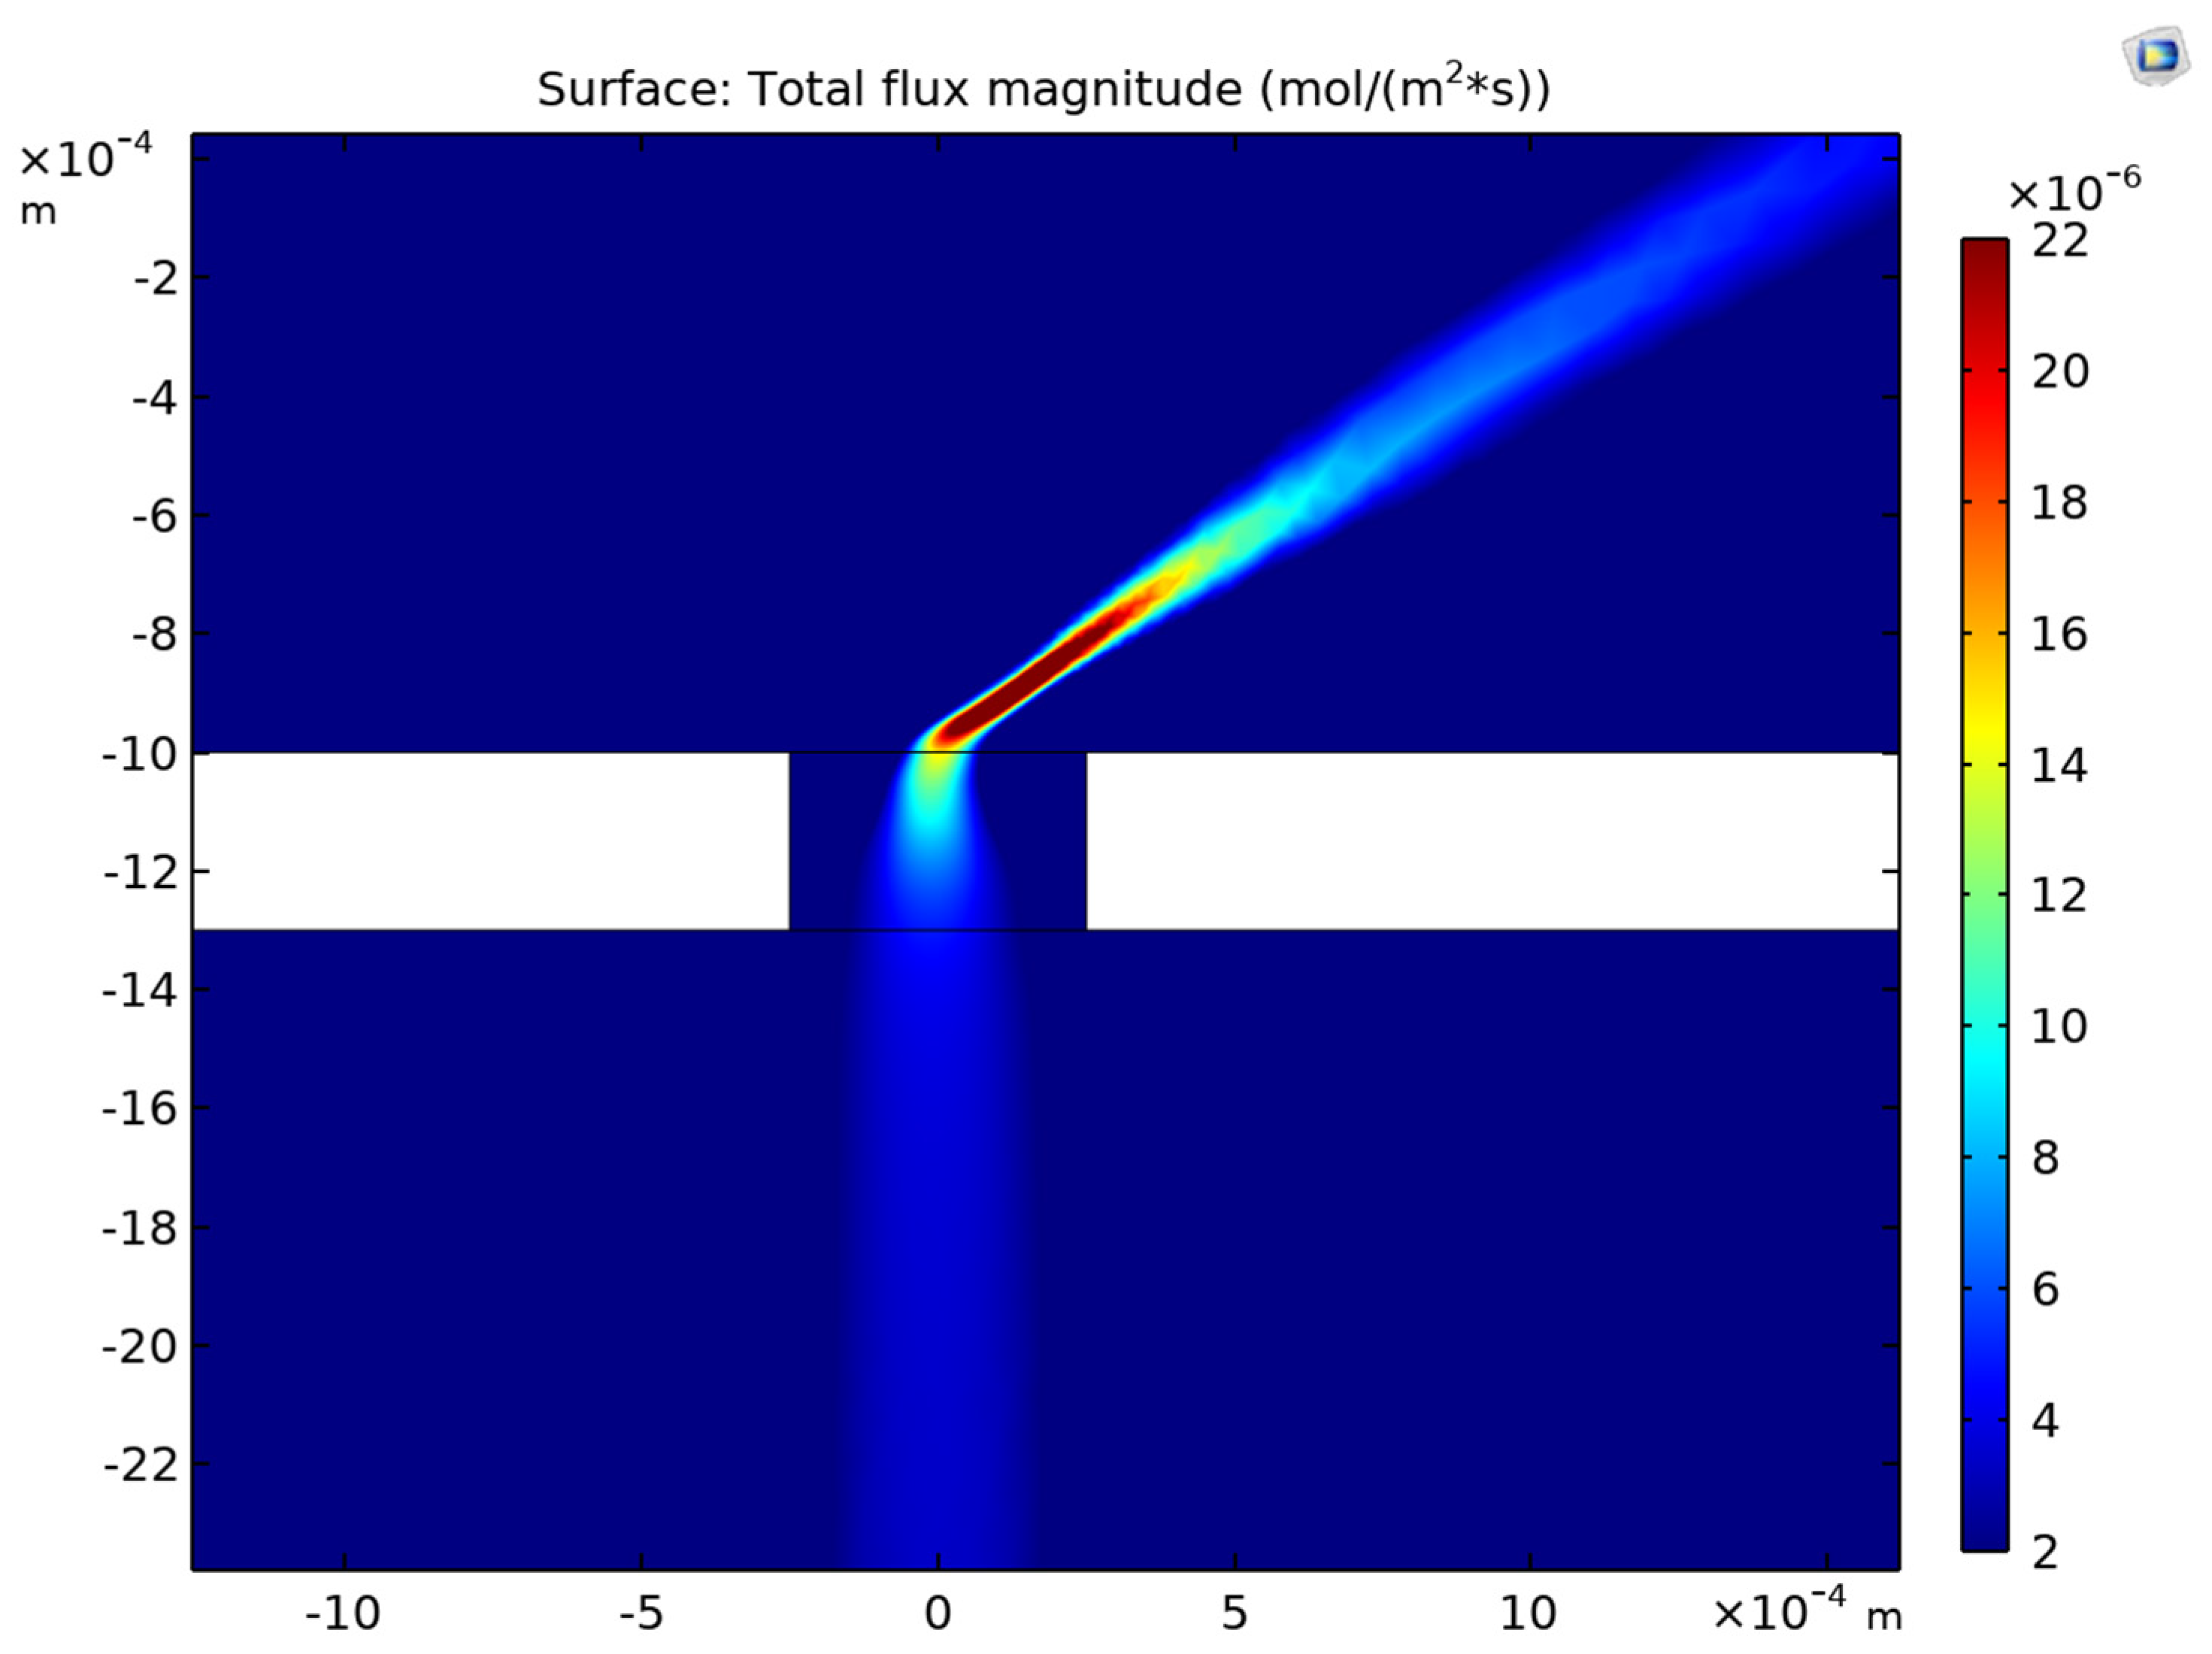
The evolution of Eulerian ion clouds is sometimes better to see in the total analyte flux magnitude,
Figure 7. It demonstrates the same shape of ion clouds, but with a more contrasted picture. It is possible to see a decrease of the flux magnitude in the middle of the cloud with the ions moving towards the selected ion outlet. This clearly indicates a widening of the ion cloud in the ion separation zone. In practice, an ADMA operates at high velocity in a well developed turbulent regime. There are many microscopic manufacturing imperfections due to practical restrictions on the engineering tolerances, especially for a miniature device. These imperfections may facilitate formation of eddies in the system. They generate both spatial and temporal non-uniformities in the velocity field. It is necessary that ion cloud thickness and resolution are evaluated at more realistic conditions when both the Brownian diffusion and turbulent diffusion are considered.
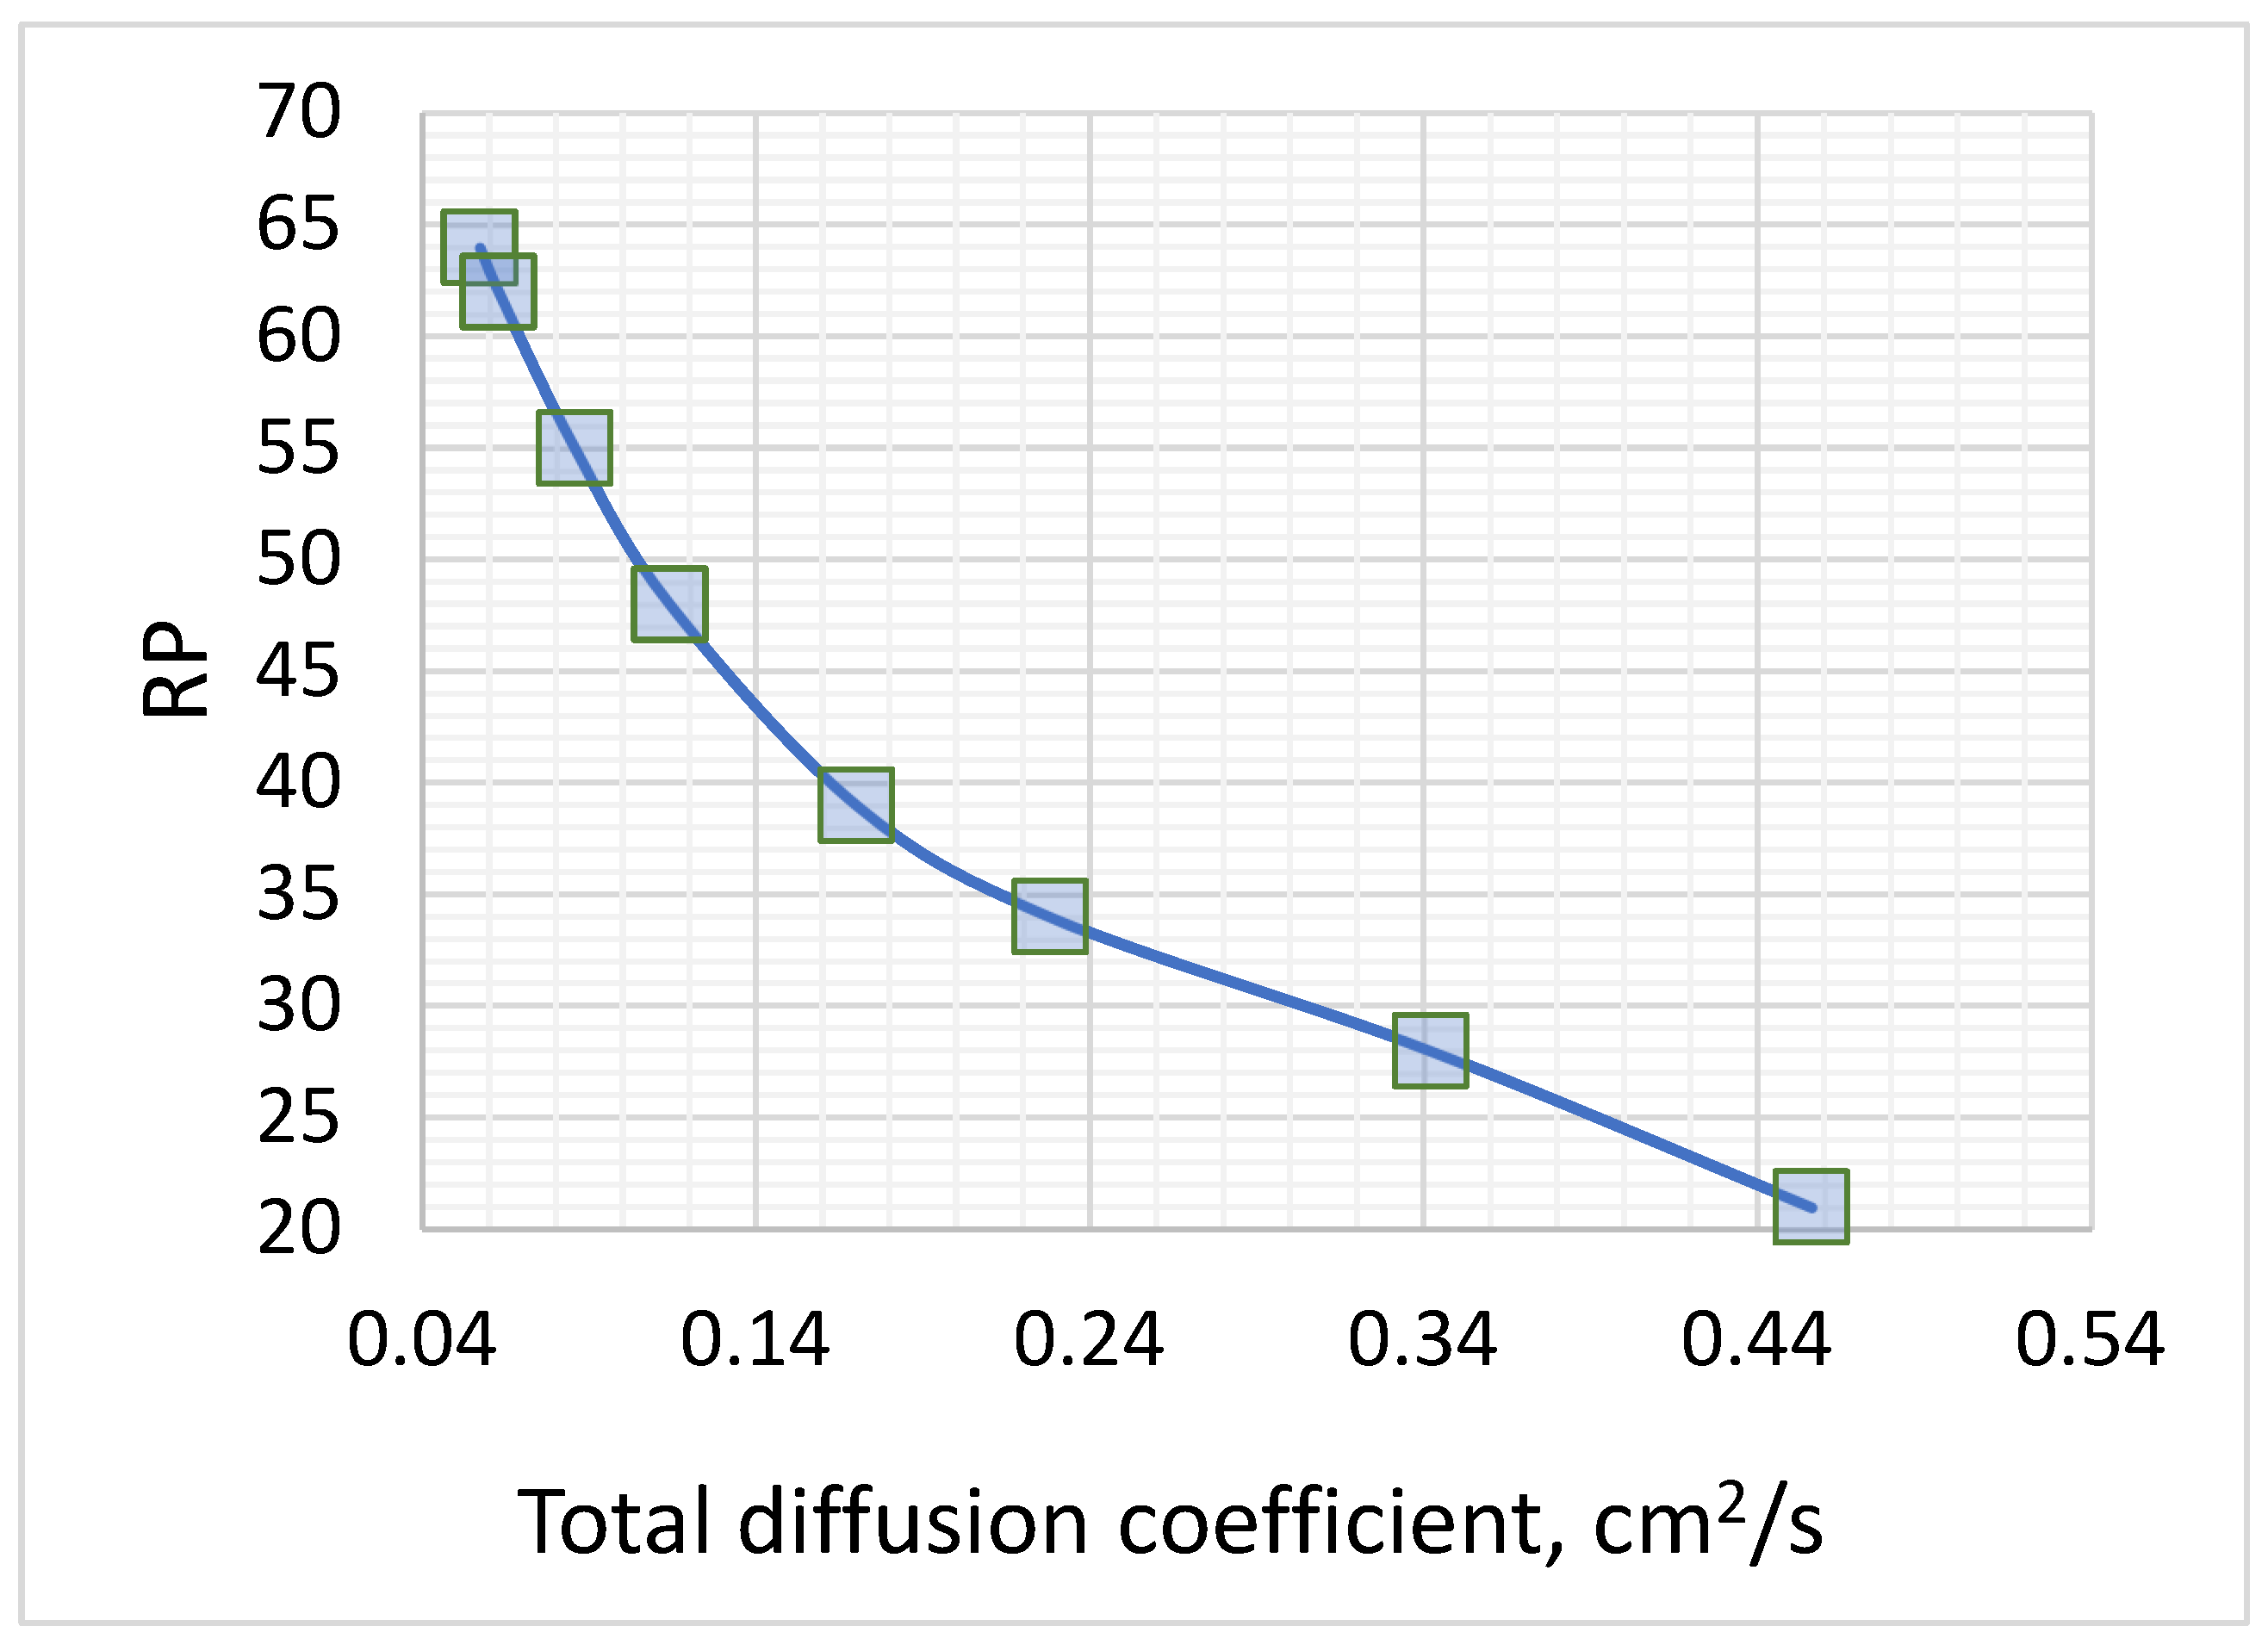
It was found that the RP is strongly influenced by the turbulent diffusion,
Figure 8. Here it was assumed that the total diffusion coefficient is equal to sum of the Brownian and turbulent diffusion coefficients. An increase in turbulent diffusion, shown as an increase in the total diffusion coefficient, reduces the RP. In a hypothetical case of zero turbulent diffusion the resolving power at Qsh=40 l/min is equal to RP=64. For the total diffusion coefficient equal to 0.45 cm
2/s the RP = 21. This indicates that the quality of the sheath flow in the ADMA might be important for the resolving power.
4. Discussion
It is known that the RP of an ADMA and an ion DMA (Amo-Gonzaĺez
et al., 2018) increases with the Re number and therefore with the sheath flow rate. It was also observed experimentally, see Steer
et al., (2014) and other publications. The cost – dimension consideration in the optimisation procedure suggested to limit the sheath flow rate by Qsh=40 l/min. For a 2 mm x 3 mm cross-section (
Figure 1) of ion separation this gives a Re number well in the turbulent zone, e.g.,
Smith (1982). The velocity profile shown in
Figure 3 of Supplementary Material (SM)* also confirmed this.
Another advantage of working in the turbulent zone is the uniformity of the flow along the z-coordinate. However, this uniformity may not justify a simple uniform-flow analytical modelling of the separation of ions in the ADMA. The reason for that is the flow pattern near the ion sample flow inlet into the ADMA separation zone,
Figure 3 and
Figure 4. There is a large eddy formed that is fuelled by the sheath flow. This is a stable formation that was observed in modelling various geometries and flow rates.
This eddy also disturbs ion streamlines in some geometries and operational parameters. This complicates optimisation because the modelling should find regimes and geometries when the separation of ions in the ADMA is not corrupted by such velocity features, as shown in
Figure 5. It was also observed that around such large eddies a cascade of smaller eddies exists. Given the inherited temporal non-uniformity of the flow in the ADMA due to pump pulsations it is likely the large eddy and the family be affected by the pulsations. The modelling confirms that.
One of the main features of the ADMA is design of the ion cloud shape. The aim is to reduce the thickness of ion clouds in the ion sample inlet because it is crucial for the RP of the ADMA,
Figure 1. The reduction of the thickness should be preferably arranged in one dimension across the sample inlet width (x-axis direction). Ideally, an ion cloud should resemble the cross-section of the sample inlet slit in the X-Y plane, but be much thinner than the opening in the slit along the x-axis. In the optimised geometry the sample inlet slit has a rectangle shape 0.5 mm x 2.5 mm. The y-axis is not critical because the Y-dimension of the slit is 2.5 mm and it is 5 times greater than the width of the slit (0.5 mm).
The ion cloud thickness in the x-axis was reduced by generating a nonlinear electric field and velocity field starting in the ionisation chamber. This field is then also applied in the ion cloud shaping chamber, the ion inlet sample slit and finally in the ion separation zone of the ADMA adjacent to the sample inlet,
Figure 2 (US10458946). The narrowing of the x-dimension of the ion cloud is started from 5 mm in the ionisation chamber down to ~0.5 mm near the bottom of the sample inlet to the ADMA and further down to 10 μm ~ 30 μm near the top of the sample inlet,
Figure 5. Diffusivity widens the ion cloud.
Nevertheless, the zero-diffusion approximation for optimisation of the ADMA system is quite useful, especially at the beginning of the optimisation process to exclude combinations of parameters that have low chances to deliver a high-performance device. In practice it gives a considerable computational advantage for the ADMA development.
To evaluate the effect of diffusivity on the ion cloud the modelling of Eulerian analyte concentration field was carried out. This shows remarkable results. In models that are close to the optimal geometry the diffusion widening is relatively small,
Figure 6. There is a clear similarity of the Lagrangian ion streamlines boundaries (without diffusivity) and Eulerian ion cloud boundaries modelled with diffusion. This shows that the anisotropic diffusion supresses Brownian widening and even overpowers it. This behaviour of ions can also be described as a diffusivity with a negative diffusion coefficient.
It was expected that the Eulerian approach would provide a reliable way to evaluate the RP in the ADMA device. However, the modelling of the analyte concentration field enabled evaluation of the real ion cloud thickness with accuracy that is influenced by the negative concentration artefacts,
Figure 1, in SM. The negative concentrations appear at the tails of the analyte concentration profile in all sections of the ion cloud evolution from the ionisation chamber up to the selected ion outlet. There is a correlation between the mesh size, roughly linked to the numerical modelling runtime, and the RP,
Figure 2, in SM. The trend of the correlation that RP approaches RPmax that was calculated from the FWHM according to expression (1). However, to achieve the maximal RP numerically the refining of the mesh structure requires impractically fine mesh sizes and therefore very long runtimes or expensive supercomputer facilities.
In general, approaching high RP = 100 requires modelling of very narrow ion cloud profiles when the concentration of an analyte c(x) shape is close to the delta function δ(x). Approaching the singularity at the delta function requires even more refined mesh and further increases the runtime. Therefore, numerical modelling with the Eulerian approach has rather limited applications for thin ion clouds necessary for modelling high resolution devices.
Anisotropic diffusion in a gas is similar to diffusion in an anisotropic crystal where anisotropy is defined by atomic forces. In our case the anisotropy of diffusion is defined by a combination of electric and drag force fields. In some sections of the ADMA system there is a symmetry plane at {x=0,y,z} where the electric field strength is zero. The convergence of ion trajectories and the ion concentration fields towards x=0 is caused by gradual variations in the electric field strength and a domination of the electric force over the drag and other forces, US10458946.
Here, anisotropic diffusion is used as a convenient term that enables a numerical friendly description of the diffusion in complicated non-linear force fields. The justification of the ADMA term is based on highlighting a new possibility of increasing the RP by engineering of ion cloud shapes.
Modelling also shows that the narrowing of the ion cloud thickness takes place - in the ion separation zone near the ion sample inlet slit
Figure 6. The narrowing can be better seen in the ion flux field (
Figure 7) where appearance of the red colour (-0.7 mm > z > -1 mm) indicates an increase in the magnitude of the ion peak and therefore a decrease in the thickness of the ion cloud. Therefore, the anisotropic diffusion region spreads into the ADMA separation zone where narrowing of the cloud takes place far from the initial symmetry line {x=0,y,z}. This is a non-trivial result that is not fully understood.
Modelling also reveals that the ion cloud narrowing effect is not automatically present in any ion sample inlet. There are some requirements for the geometry, electric field (electric charge) and flow rates that support the effective ion cloud narrowing. For example, there is an optimal width of the ion inlet slit, and any deviation from the optimal width reduces the RP, see also US10458946. This optimal width is also influenced by the flow rates.
The RP varies with the optimal geometry and operational parameters from 30 to 100. It is influenced by the sheath flow rate and the ion transfer rate. The ion transfer rate at the upper limit of the RP range is below 50%. At Qsh=40 l/min a better option is the RP~70 when the ion transfer rate ~ 50%. The experimental results for the geometry based on the modelling are going to be presented in the Part II of the ADMA paper.
5. Conclusions
A comprehensive model comprising of numerical calculations with mathematical and physical analysis (hybrid approach) has been developed for the ADMA system optimisation.
The anisotropic diffusion concept was implemented to design an ADMA system.
It was confirmed that the anisotropic diffusion can compensate and even surpass the diffusion broadening, e.g., the modelled cross-section of ion cloud coming out of the ionisation chamber was reduced circa 1000 times at the ADMA ion sample inlet.
The resolving power of the assembly was found to be circa RP~70 for a hypothetical case (only Brownian diffusion) when the sheath flow turbulent diffusion was zero.
The main objective of the modelling was evaluating the potential of the Anisotropic Diffusion Mobility Analyser (ADMA) in separating analytes relevant to the airport security applications. This objective was successfully achieved.
Acknowledgments
to Dr Jonathan Rowles for help with preparation this paper.
Conflicts of Interest
The authors declare no conflicts of interest.
References
- Amo-Gonzaĺez M. and Peŕez S., Planar Differential Mobility Analyzer with a Resolving Power of 110. Anal. Chem. (2018), 90, 6735−6741. [CrossRef]
- Baron, P.A. and Willeke, K. (2001). Aerosol Measurement. Principles, Techniques and Applications. J. Wiley and sons, pp. 1131.
- Buryakov A., E.V. Krylov, E.G. Nazarov, U.Kh. Rasulev (1993) A new method of separation of multi-atomic ions by mobility at atmospheric pressure using a high-frequency amplitude-asymmetric strong electric field. Int. J. of Mass Spectrometry and Ion Processes, 128, pp. 143-148. [CrossRef]
- Gorbunov B. (2017) Counting individual ions in the air by tagging them with particles. J. Chem. Phys., 492, 1-4. [CrossRef]
- Gorbunov B. (2008) Ion counter. Patent US7372020.
- Gorbunov B. (2020) Aerosol Particles Generated by Coughing and Sneezing of a SARS-CoV-2 (COVID-19) Host Travel over 30 m Distance, Aerosol and Air Quality Research, 21, 3, 200468. [CrossRef]
- Ion Mobility Spectrometry (2005) By G.A. Eiceman, Z. Karpas, CRC Press, 368 p. DOI https://doi.org/10.1201/9781420038972. [CrossRef]
- Hill HH, Siems WF, St. Louis RH, McMinn DG. Ion mobility spectrometry. Anal. Chem. 1990; 62: A1201–A1209. [CrossRef]
- Karasek F. W. (1974) Plasma Chromatography. Anal. Chem. 46, 8, pp. 710A–720A. https://doi.org/10.1021/ac60344a724 . [CrossRef]
- Kulkarni P., Baron P. A., Willeke, K., Aerosol Measurement - Principles, Techniques, and Applications, (2011); John Wiley & Sons.
- Labowsky, M. and Fernández, de la Mora J. 2006. Novel Ion Mobility Analyzers and Filters. J. Aerosol Sci., 37: 340–362. [CrossRef]
- de la Mora F. J., L. de Juana, T. Eichlerb, J. Rosellc (1998) Differential mobility analysis of molecular ions and nanometer particles. Trends in Analytical Chemistry, 17, pp. 328-339. [CrossRef]
- Steer B., Gorbunov B., Muir R., Ghimire A. & Rowles J. (2014) Portable Planar DMA: Development and Tests, Aerosol Science and Technology, 48:3, 251-260. [CrossRef]
- Smith F. T. (1982) On the High Reynolds Number Theory of Laminar Flows. IMA J. of Applied Mathematics, 28, pp. 207–281. [CrossRef]
- US5869831A, Method and apparatus for separation of ions in a gas for mass spectrometry, J. Fernandez De La Mora, De Juan L., Eichler T., Rosell J.
- US10458946, Miniature Ion Selecting Device for Identification of Ions in Gaseous Media. B. Gorbunov.
|
Disclaimer/Publisher’s Note: The statements, opinions and data contained in all publications are solely those of the individual author(s) and contributor(s) and not of MDPI and/or the editor(s). MDPI and/or the editor(s) disclaim responsibility for any injury to people or property resulting from any ideas, methods, instructions or products referred to in the content. |
© 2023 by the authors. Licensee MDPI, Basel, Switzerland. This article is an open access article distributed under the terms and conditions of the Creative Commons Attribution (CC BY) license (http://creativecommons.org/licenses/by/4.0/).
