Preprint
Article

Climate Change, Sustainable Forest Management, ICT Nexus, and the SDG 2030: A Systems Thinking Approach

Altmetrics

Downloads

230

Views

130

Comments

0

A peer-reviewed article of this preprint also exists.

Submitted:

19 February 2023

Posted:

20 February 2023

You are already at the latest version

Alerts
Abstract
The 2030 global agenda of the United Nations emphasizes peace, human rights, gender equality, partnership, and women's empowerment. It balances the social, economic, and environmental dimensions of sustainable development. The SDG framework was designed to be integrated and indivisible, making the interconnections of 17 Goals and 169 Sustainable Development Goals Targets (SDTs) more complex that need extensive and intensive investigative research. Recent studies have increased on the interrelationships of SDGs, but none of these have focused on integrating Climate Change (CC), Sustainable Forest Management (SFM), and Information and Communication Technology (ICT), also known as CSI Nexus. This study aims to investigate and identify the 169 SDTs linked to CC, SFM, and ICT and assesses the significance of the relationships between these variables. The alignment of SDTs to CSI Nexus was identified through clustering and mapping techniques. The result argued that 56 SDTs are directly connected within CC+SFM+ICT, 16 within CC+SFM, one within SFM+ICT, and 51 within ICT+CC. Our result suggests that CC is significantly associated with SFM; however, ICT has no significant association with CC and SFM. It further asserts that the ICT and SFM have minimal influence on the SDG 2030 framework. The proposed CSI Nexus and SDTs Integration Framework was a science-informed guide for priority-setting, policy coherence, and decision-making supporting the 2030 Sustainable Development Goals. This study does not include interactions, network analysis and visualization, simulations, and modeling between SDG targets.
Keywords: 
Subject: Environmental and Earth Sciences  -   Environmental Science

1. Introduction

In the past seven years, the member states of the United Nations adopted the 2030 global agenda of sustainable development, known as Sustainable Development Goals (SDG), on September 25, 2015. The SDG consists of 17 Goals, 169 SDG targets (SDTs), and 231 SDG indicators (SDIs) [1] that seek to realize people's human rights, gender equality, and the empowerment of all women and girls. They are seen as an indivisible and interconnected network that balances the three pillars of sustainable development, namely, social (So), economic (Ec), and environmental (En) dimensions [2,3]. The SDG framework is designed to be a network of 169 targets [4,5] that are intertwined. Blanc said that the SDG goals and targets should be considered a network [5]. He used network analysis to determine how strong the connections between the goals and targets were. His research shows that some SDTs are well-connected, while other parts of the network have weaker links to the rest of the system. After his paper came out, a number of studies mapped, explored, and looked into SDG links both inside and outside the network systems [5]. Likewise, several studies examined how SDGs are connected to the Venn diagram of sustainable development [4,6]; mapped the relationship, interaction, interlinkages, and synergy and trade-off of the SDGs [7,8,9]. Other studies integrated other frameworks into the system's network of SDGs, such as policy coherence and education [10,11].
The interconnection of all the targets is indisputable and crucial in achieving the 2030 Global Agenda. Moreover, the integration of Climate Change (CC) and Sustainable Forest Management (SFM) are explicitly included in SDG 13 and 15, respectively. At the same time, Information and Communication Technology (ICT) is implicitly stated in other Goals [12]. Groundbreaking contributions have been made to connecting the SDG with energy interlinkages [13], global learning [14], SDG 14 – Life below water [15], SDG 9 – Industry, Innovation, Infrastructure [16], and oceans. More research would be needed to strengthen the evidence of linkages with other goals and targets [9] due to the significant gaps in the existing information about the examination of interlinkages and inadequate investigations on interactions between and among the 169 SDTs [17]. The complexity of the intricate network of interlinkages between the SDGs is one of the main difficulties the signatory countries will need to overcome and comprehend, considering their universal and integrated nature [18]. Therefore, to our knowledge, no existing study has yet been conducted specifically in integrating climate change, sustainable forest management, ICT, and the SDG 2030. This study has two objectives: (a) to investigate and identify the SDTs aligned and connected to CC, SFM, and ICT; and (b) to assess the significant relationships between and among CC, SFM, and ICT. It was hypothesized in this study that no significant associations exist between and among the CC, SFM, and ICT components. It used the meta-analysis approach as a data source linking the CC, SFM, ICT, and SDTs using systems thinking approach through mapping of SDTs in an affiliation matrix table and quantifying the frequency distributions of SDTs to CSI Nexus.

1.1. Relationships Between and Among CC, SFM, and ICT

Human-caused climate change affects 85 percent of the world's population [19,20]. Scientists say global warming will have direct, worsening, and eventually irreversible effects on the world, including more heatwaves, droughts, floods, extreme weather, climate-sensitive jobs, poverty, and poor health. Those populations and ecosystems least able to adapt are hit the hardest [21,22]. A dramatic increase in greenhouse gas emissions from anthropogenic activities has caused approximately 1.1°C warming, likely reaching 1.5°C within the next 20 years [23]. Evidence suggests that the ecological connection between climate change and forests is essential for addressing the adverse effects of global warming. It is well known that forests are both a cause and a solution for greenhouse gas emissions, preventing forest ecosystem loss and degradation [24,25]. Promoting their restoration could help with more than a third of the total carbon reduction needed by 2030 to achieve the goals of the Paris Agreement [26]. However, despite the benefits of forests and trees, deforestation and desertification continue at a high rate due to human activities and climate change, endangering millions of people [27].Similarly, several studies demonstrate that ICT has been recognized to combat climate change [28,29,30] by revealing changing climate signals, analyzing, and modeling climate change; and implementing mitigation and adaptation measures to improve human resilience. Cutting-edge ICT innovations have been identified as practical means of combating climate change [29,31,32]. Literature indicates that ICTs have been utilized in sustainable forest management (SFM) for mapping and monitoring forest resources and environmental threats and promoting sustainable forestry practices [33].

1.2. Connecting CC, SFM, ICT, and the 17 SDG Targets

One hundred ninety-seven countries signed the Paris Agreement to combat climate change, adapt to its effects, and aid developing nations [34]. The U.N. member countries adopted the 2030 Agenda for Sustainable Development in 2015, which includes SDG 13 on climate action and SDG 15 on Life on Land [2]. Several studies have explored the interconnections of Climate change and the SDGs. Fuso Nerini et al. connected 72 SDG targets (SDTs) [35]; Intergovernmental Panel for Climate Change (IPCC) linked the 121 SDTs to CC [36]; Food and Agriculture Organization (FAO) delineated the interlinkages, synergies, and trade-offs between Climate-Smart Agriculture (CSA) and connected 89 SDTs [37]. Lastly, Zhou et al. examined ten pieces of literature to establish the interconnections of 169 targets and interlinked 131 SDTs associated with SDG 13 [17].
Several pieces of literature connect SFM and SDGs, e.g., agroforestry as the nexus of SDGs [37]; the impacts of the SDGs on forest and people [38]; the SDGs, forest, and the role of Austrian forestry [39], and SDGs, and the forest sector - complex relationship [40]. SDG 15 - Life on Land, specifically the SFM, seeks to maintain, restore, and promote sustainable use of terrestrial ecosystems, sustainably manage forests, battle desertification, and halt and reverse land degradation and biodiversity loss [3]. However, few literatures were conducted to align SFM with 169 SDTs: (1) The State of the World’s Forests 2018 - Forest Pathways to Sustainable Development assesses forests' contribution to 28 SDTs [38]; (2) the Organization-led Initiatives in support of United Nations Forum on Forest (OLI-UNFF) developed a worldwide core set of forest indicators to support the 2030 SDGs and connects 17 SDTs [39]; (3) Forest Stewardship Council (FSC) is the world's leading system for promoting sustainable forest management, with a focus on mobilizing consumers through chain of custody and labeling schemes identified 40 SDTs connected to SFM [40]; Lastly, (4) World Business Council for Sustainable Development – Forest Solutions Group (WBCSD-FSG) forests roadmap outlines the forest sector's most impactful contributions through process, product, and partnership innovation and provides attainable pathways to help achieve the SDGs through impact opportunities and pathways that include specific actions, key enablers, and partners to engage with and are mapped to 43 SDG targets [41].
ICT is a known SDG catalyst [42], it accelerates and measures SDG implementation until 2030. Although ICT-related SDG targets were implicitly distributed to different SDGs, several studies explored and investigated their connectedness with each other. Four of them were included in this study; namely, (1) Huawei (2018) used ICT SDGs Benchmark 2018 to gauge progress and examines how countries might employ digital technology to boost social and economic advancement, and they aligned 55 SDTs in their report [43]; (2) Ericsson and The Earth Institute Columbia University (EICU) said that ICT could accelerate SDG action by scaling up health, education, financial services, smart agriculture, and low-carbon energy systems; reduce urban and rural deployment costs; increase public engagement; innovation, connectivity, productivity, and efficiency across sectors; and improving services and jobs faster through 27 ICT-related SDTs [42]; (3) The World Summit on the Information Society (WSIS) produced a WSIS-SDG Matrix to map SDG targets to WSIS-Action lines and they aligned 83 SDTs to ICT [44]; (4) The Partnership on Measuring ICT for Development (PMID) has spearheaded international ICT monitoring and awareness-raising. Their collaboration has underlined the relevance of ICTs in attaining the SDGs and established and aligned 27 ICT-related SDTs [45].

1.3. Systems thinking Approach and the Sustainable Development Goals

The integration and indivisible nature of SDGs as a framework could become more complex if treated as one whole network. Previous studies have emphasized that it is difficult to understand the interactions of 169 SDG targets because they all affect each other [18,46]. Analyzing the complexity of interconnections of all targets needs an approach that uses or analyzes a system [47,48].
Many authors have focused on the components of systems thinking but have neglected to detail what systems thinking is. Some defined Systems Thinking vaguely, while others have simplified Systems Thinking too much. Both approaches have failed to capture the systemic essence of System Thinking as it is. Therefore, a new definition is proposed [49]:
“Systems thinking is a set of synergistic analytic skills used to improve the capability of identifying and understanding systems, predicting their behaviors, and devising modifications to them to produce desired effects. These skills work together as a system.”
Recently, a growing study in sustainable development using systems thinking approach is increasing because of the SDGs' complexity, integration, and indivisible nature. Echendu used systems thinking to assess how Nigeria's floods affected all food security components and the SDGs [50]. Clark et al. conducted an exploratory study using the systems thinking approach and presented an 18th SDG called Digital Connection [51]; Stead used the systems thinking approach to strengthening the aquaculture policy for U.N. SDGs [52]. With the popularity of the systems thinking approach, this study used this technique in integrating the CC, SFM, ICT, and the SDTs for interlinkages analysis and visualization.

2. Materials and Methods

This study has two objectives: (a) to investigate and identify SDG targets aligned and connected to CC, SFM, and ICT, and (b) to assess the relationships between and among CC, SFM, and ICT. It uses two research techniques: the systems thinking approach [53,54] and the quantification of the SDTs' interlinkages [17].
The phase process diagram in Figure 1 depicts the analytical process of integrating CC, SFM, ICT, and the SDG Framework from a siloed structure to a network system. Phase 1 utilized a circle relationship diagram to illustrate the four groups of data sources, namely: 169 SDTs [2,55], Climate Change [17,35-37], Sustainable Forest Management [38-41], Information and Communication Technology [42-45]. Phase 2 made use of a Venn diagram to merge the four distinct groups, CC, SFM, ICT, and 169 SDTs. In Phase 3, the researchers quantified and analyzed the degree of connectivity and link between CC, SFM, ICT, and SDTs to develop the integrated CSI-Nexus and SDTs Framework.

2.1. Phase 1: Identification of SDTs that are Aligned to CC, SFM, and ICT

Several researchers have utilized the existing literature to determine the SDG linkages [16,35,56]. This study gathered its data sources from twelve (12) pieces of literature: 4 articles of literature on climate change, four on sustainable forest management, and four on ICT. Different research databases were used, such as Google Scholar®, Science Direct®, MDPI®, Scopus®, Directory of Open Access Journal®, and Microsoft Academic®. The keywords used in the search engine were a combination of ["Sustainable Development Goals"] AND ["Climate Change" OR Forest OR ICT] AND [mapping OR integration OR connect OR interlink] in the title field of the search engine. All literature was then imported to Reference Management Software EndNote 20 to filter duplicates and unnecessary literature. Based on the intensive literature review, the twelve references of sources of connection and the number of aligned SDTs are listed in Table 1.

2.2. Phase 2: Mapping and Clustering of SDTs to CC, SFM, and ICT

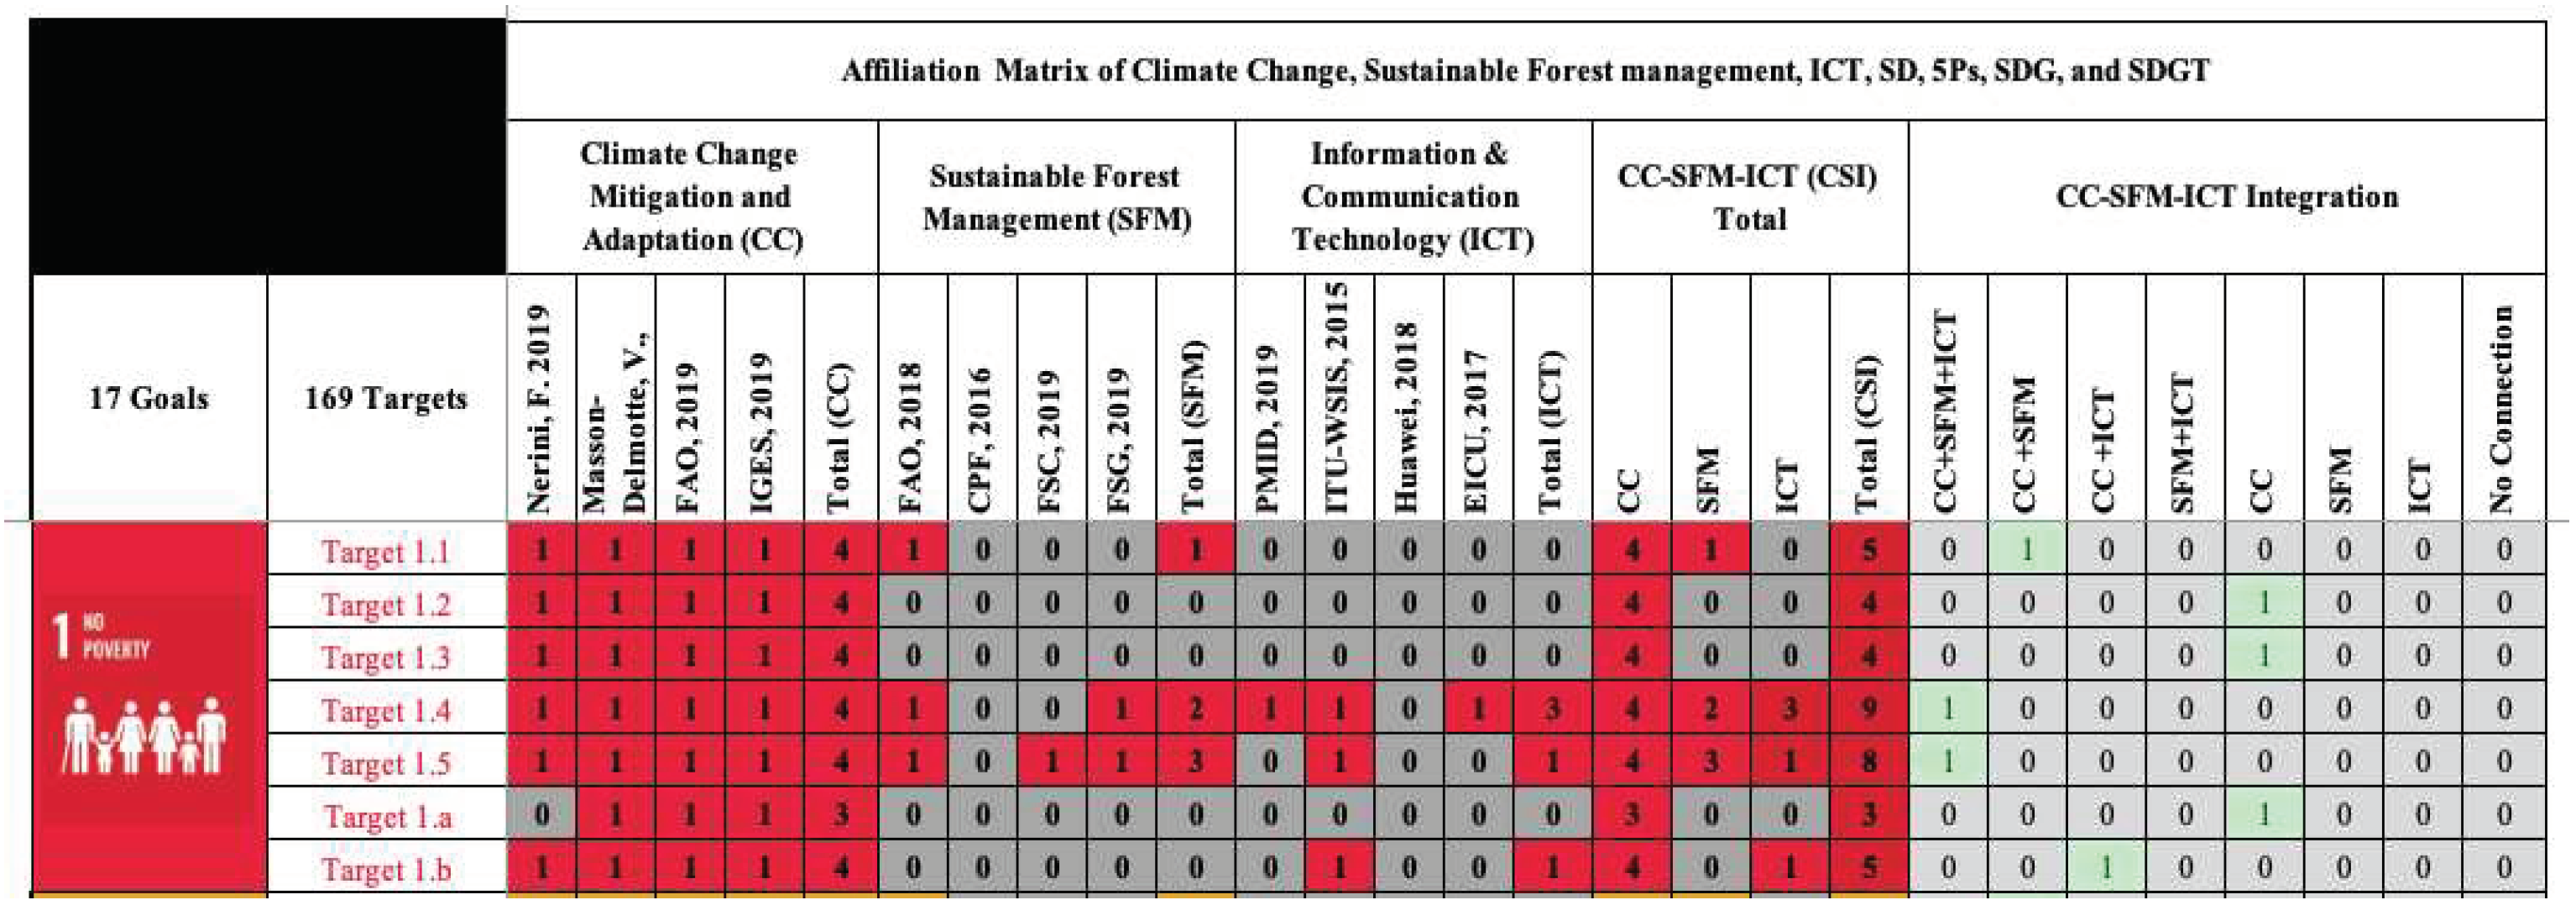
The current study maps the linkages of SDTs to CC, SFM, and ICT and clusters them into CC+SFM (CS), SFM+ICT (SI), ICT+CC (IC), and CC+SFM+ICT (CSI) using affiliation matrix mapping techniques. It is a two-mode rectangular network used to collect survey data. A 2-mode matrix or bimodal matrix describes the organizations, events, labels, nations, or activities (mode 1) with which nodes (mode 2) are linked. It describes the participation of a specific group in a specific event. It contains actor and event nodes [57]. The direct connections were mapped into an "affiliation matrix" in this study, a table with rows for the 169 SDTs and columns for the CC, SFM, and ICT. If there was a relationship between two rows or columns, it was indicated with a "1" otherwise, it was indicated with a "0" (see Table 2).
The systems thinking approach is one of the most utilized methods for determining network connections, making the complexity of network systems easier to understand through network visualization. According to Pereira et al. and Laumann et al., one of the primary challenges that countries will face is understanding the nature and complexity of the intricate network of interlinkages between the SDGs, given their universal and integrated nature [18,46].
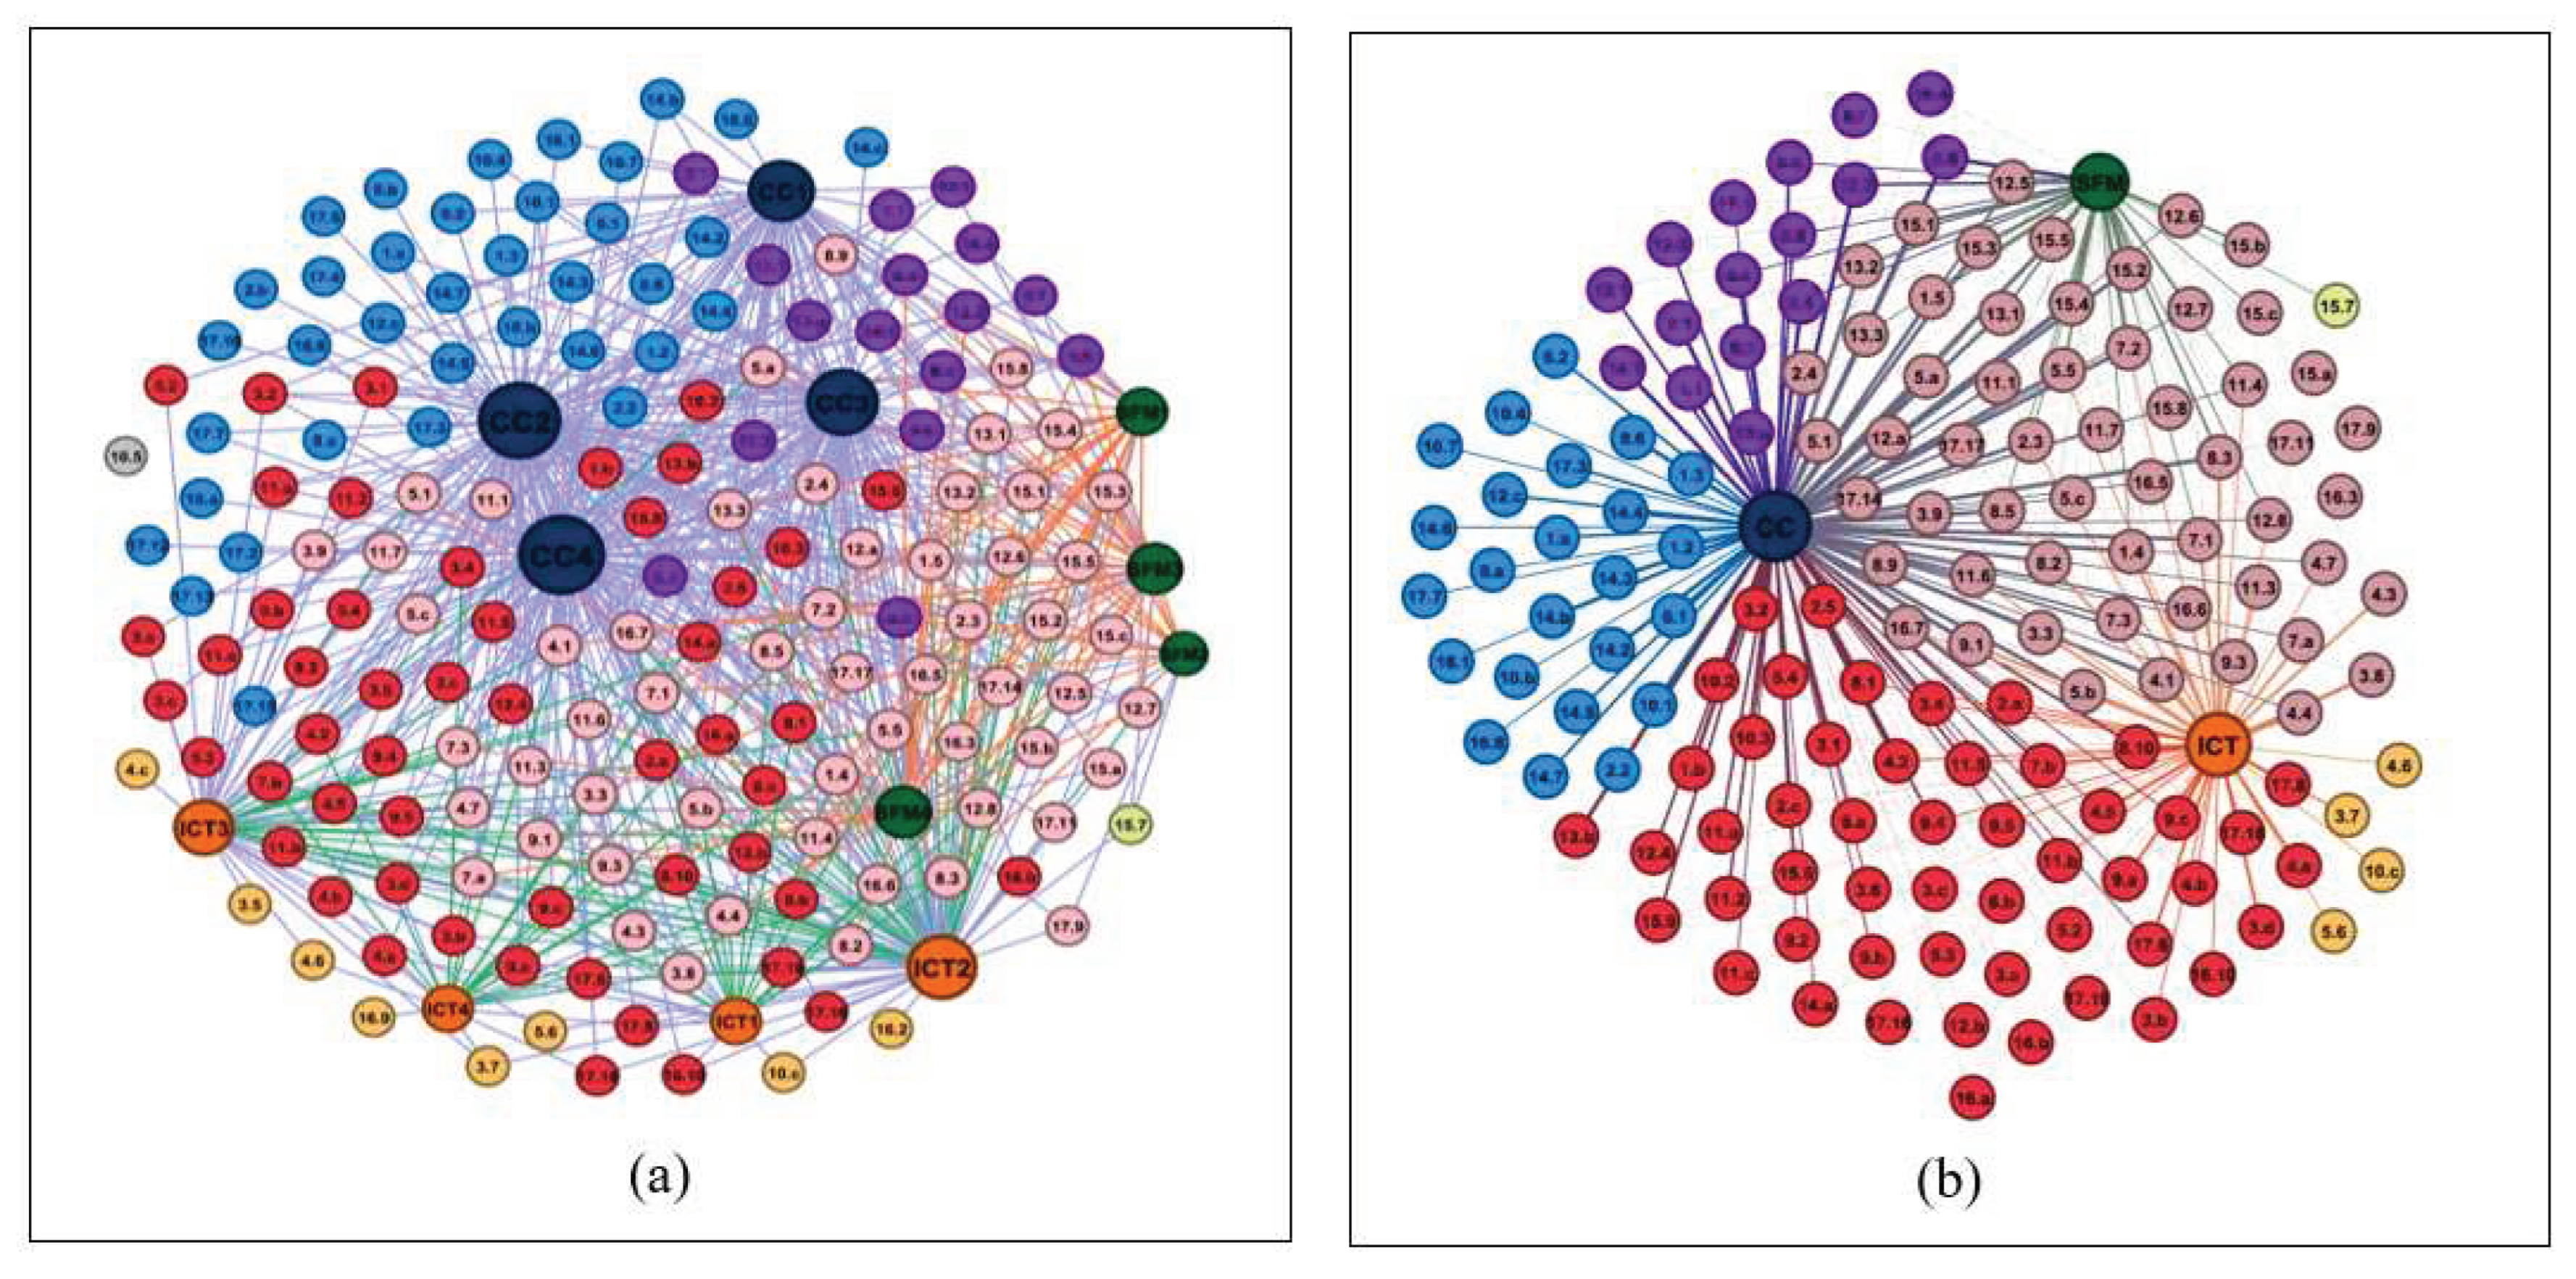
The open-source software Gephi® is used for network analysis and visualization of interlinkages. The CSI-SDT integration network is built in three stages. The first technique is based on the direct alignment of SDTs to CSI identified by the 12 selected publications (4 pieces of literature in each CSI cluster). A preferential attachment network is used in the thematic clustering of CC, SFM, and ICT interlinkages. Figure 2a depicts the complex network visualization of the 12 data sources (CC 1 to CC 4, SFM 1 to SFM 4, and ICT 1 to ICT 4), having 181 nodes and 733 edges. The nodes were color coded based on the clusters, such as: pink (CC+SFM+ICT), purple (CC+SFM), yellow (SFM+ICT), orange (ICT+CC), blue (CC), orange (ICT), dark blue (CC), dark green (SFM), dark orange (ICT), and gray (No Connection). We simplified the interconnections of the network by combining the four similar hubs into a single network with 155 nodes and 332 edges undirected graphs. The integrated network system was integrated into three hubs, namely CC, SFM, and ICT, and deleted all SDTs with zero and one interconnection (Figure 2b).

2.3. Phase 3: Quantification of the relationships of CC, SFM, and ICT

This study employs social network analysis to determine the interconnection between CSI-Nexus and the SDTs and its network centralities, encompassing degree, closeness, betweenness, and eigenvector. In addition, quantitative research is utilized to evaluate the statistical frequency distributions of the SDTs, and Spearman’s rho correlations were conducted to determine the association between CC, SFM, and ICT.
A network consists of nodes and links between them, and each edge may be weighted or unweighted [58]. Moreover, a new body of research is emerging on using social network analysis to identify the most central nodes of the network systems through centrality measures, such as degree, distance, betweenness, and eigenvector [59,60].
This study used the statistical network centrality metrics to determine the most significant targets in the CSI-Nexus and SDTs integration. The following measurements were used: 1) Degree centrality measures the number of edges connected to the SDT node, which indicates that with a high degree of centrality, it has broader interactions with other targets; 2) Closeness centrality is a path-based measure of Centrality, which indicates that an SDT node with high closeness centrality is closer to all the targets of the network than a node with low closeness centrality; 3) Betweenness centrality measures the extent to which a node lies on the paths between other nodes, which implies that the nodes with high betweenness centrality may have considerable influence within a network due to their ability of control over the information passing between others; and 4) Eigenvector centrality takes into account not only how many neighbors a node has but also whether it has significant neighbors, e.g., central points in the network. A high eigenvector centrality target interacts widely with other targets and connects to influential targets strategically.
All the data collected and plotted in the affiliation matrix was then inputted into the spreadsheet as a dataset composed of nodes (targets) and edges (connection). The process in building the network CSI-SDT for analysis is as follows: First, prepare two spreadsheets, one was for the node that contains two columns for the ID, Label, and other information describing the nodes, e.g., Id – 1; Label – 1.1; Description = Target 1.1: Eradicate extreme poverty; SDG – Goal 1; CSI Cluster – CC+SFM, etc., and save it in CSV format. The second file was for the edges that contain four columns, such as the Source, Target, Type, and Weight, e.g., Source – CC; Target – 1.1; Type – Undirected; Weight – 1 and saved in CSV format. Secondly, import these two files (Node.csv and Edges.csv) into a Social Network Analysis (SNA) software like Gephi® for statistical network analysis and visualization. Lastly, simulate the network based on the desired output appearance of the nodes (color, size, layout) and the network analysis using statistics and filters. Figure 3 illustrates the Graphical User Interface (GUI) of the network analysis and visualization using Gephi®. It displayed the color-coded degree centrality; the number of nodes (127), edges (304), and type of graph (undirected); and the network statistics such as average degree, average weighted degree, network diameter, eigenvector centrality, etc. The data laboratory displayed the result of network centralities such as the degree centrality, distance, betweenness, and eigenvector.

2.4. Statistical Test of Relationship Between and among CSI and SDTs Integration

The Descriptive Frequency Distribution and Spearman’s rho Correlation were used to test the percentage distributions and the significance of the relationship between CC, SFM, and ICT. Their connections were rated based on whether the SDG target is aligned, with a score of 0 (no) or 1 (yes). The number of edges connected to the targets was determined by the width of the lines connecting the two nodes. Each SDT was given a score of 0 for no connection, 1 for a weak connection, 2 for a moderate connection, 3 for a strong connection, and 4 for a very strong connection. Also, the 12 pieces of literature that combined the CC, SFM, and ICT total scores were given ratings of No Connection (0), Weak Connection (1–4), Moderate Connection (5–8), and Strong Connection (9–12).
The 169 SDG targets were then grouped into four (4) clusters of CSI Nexus: CC+SFM (CS) if the target is linked to climate change and sustainable forest management, SFM+ICT (SI) if the target is connected to climate change and sustainable forest management; ICT+CC (IC) if the target is related to information and communication technology and climate change; and lastly, CC+SFM+ICT (CSI) if the target is connected with climate change, sustainable forest management, and information and communication technology.

3. Results

3.1. Interconnection of SDTs to CC, SFM, and ICT

There were 12 sources of literature used in data collection of the alignment of SDTs to CC, SFM, and ICT. The connections of the SDTs into three components of CSI-Nexus depend on four possible clusters, namely, CC+SFM, SFM+ICT, ICT+CC, and CC+SFM+ICT. Moreover, the affiliation matrix shown in Table 2 was the alignment and the clustering of SDTs to CC, SFM, and ICT. Table 2 also indicates that of 169 SDTs, 159 were aligned to CC with 413 interconnections, SFM has a total of 73 SDTs with 128 interconnections, and ICT has a total of 116 SDTs with 192 interconnections. The affiliation matrix table implies that CC dominates the interconnections, followed by ICT and SFM. Table 3 shows the SDTs frequency distributions of the CSI Nexus. The strength of the connection was determined through the total number of connected targets in the CSI clusters. The result suggests that 16 SDTs were interconnected with the CC+SFM cluster; only one target is connected to the SFM+ICT; 51 SDTs were connected to the ICT+CC; and 56 SDTs were connected to the CC+SFM+ICT.

3.2. Descriptive Analysis and Comparison of the Frequency Distributions of CC, SFM, and ICT

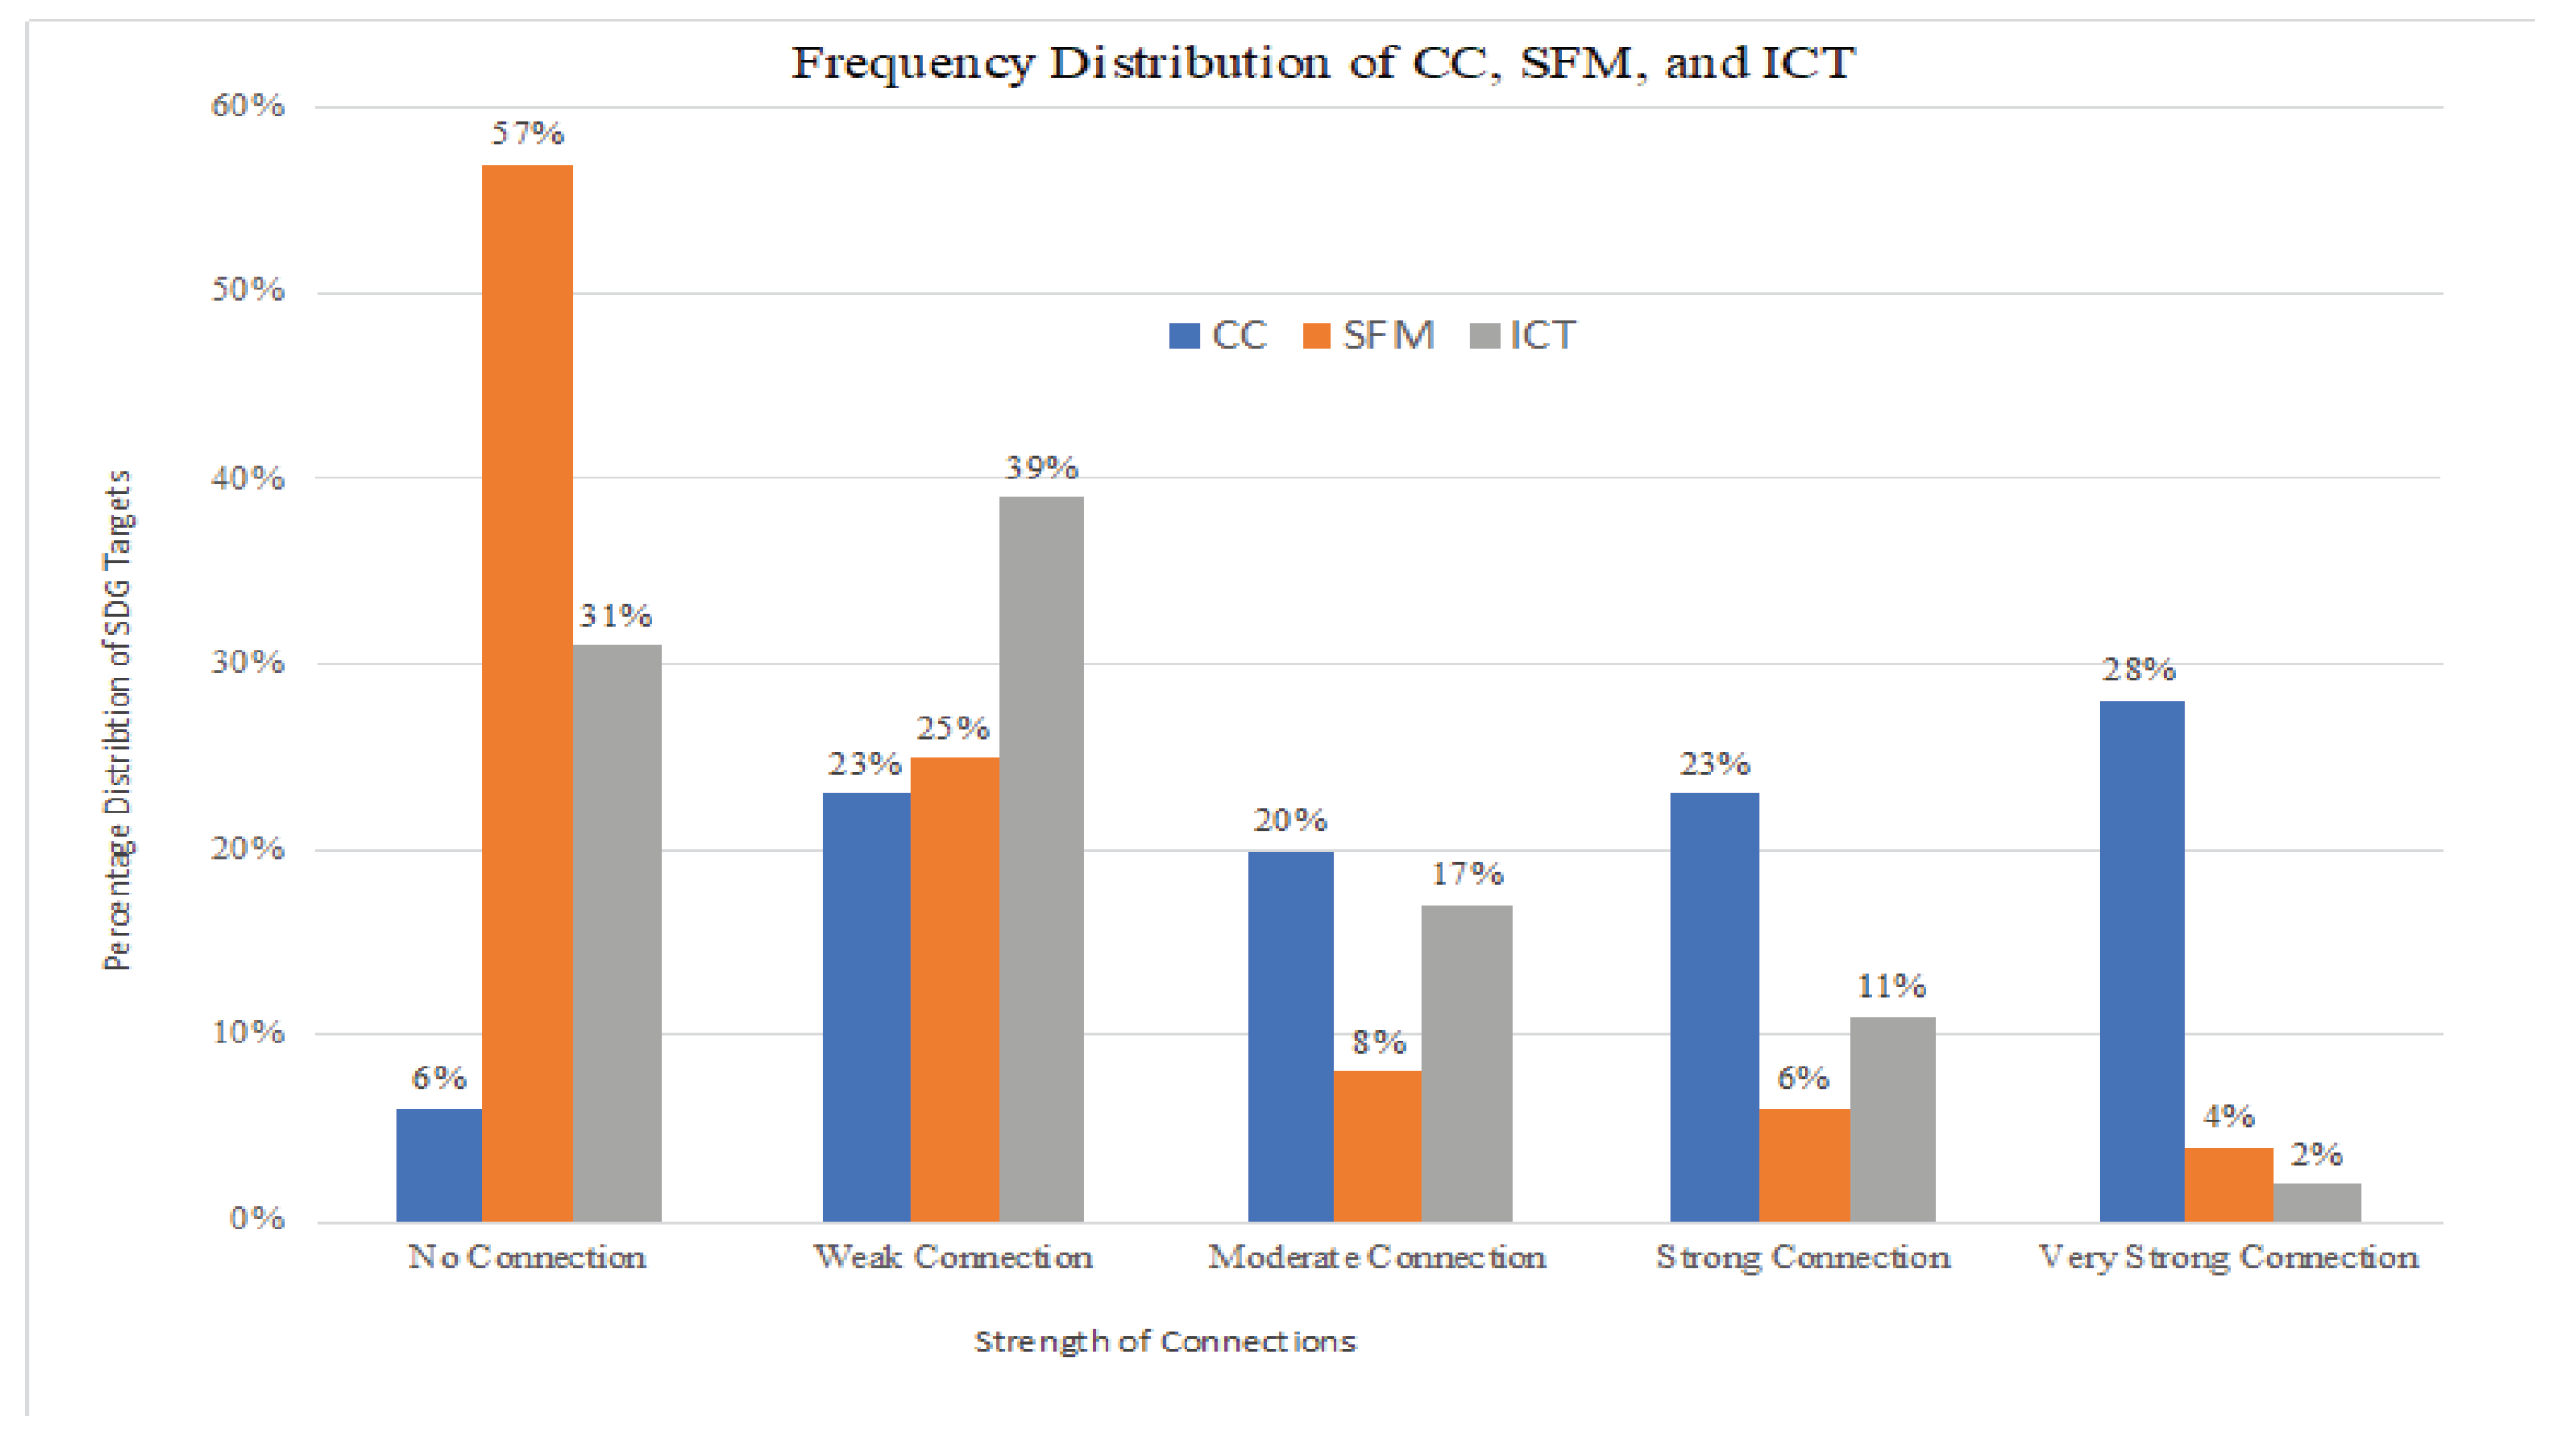
Figure 4 shows the percentage distribution of 169 SDG targets based on their strength of connections. It suggests that most (23% + 28% = 51%) of the SDT were strongly and very strongly connected to CC, while only a few were strongly and very strongly connected to SFM (6%+4%=10%) and ICT (11%+2%= 13%). On the contrary, the findings also showed that most of the SDTs were not connected with SFM (57%).

3.3. Network Visualization of the Interlinkages of CC, SFM, ICT, SD, and the SDT

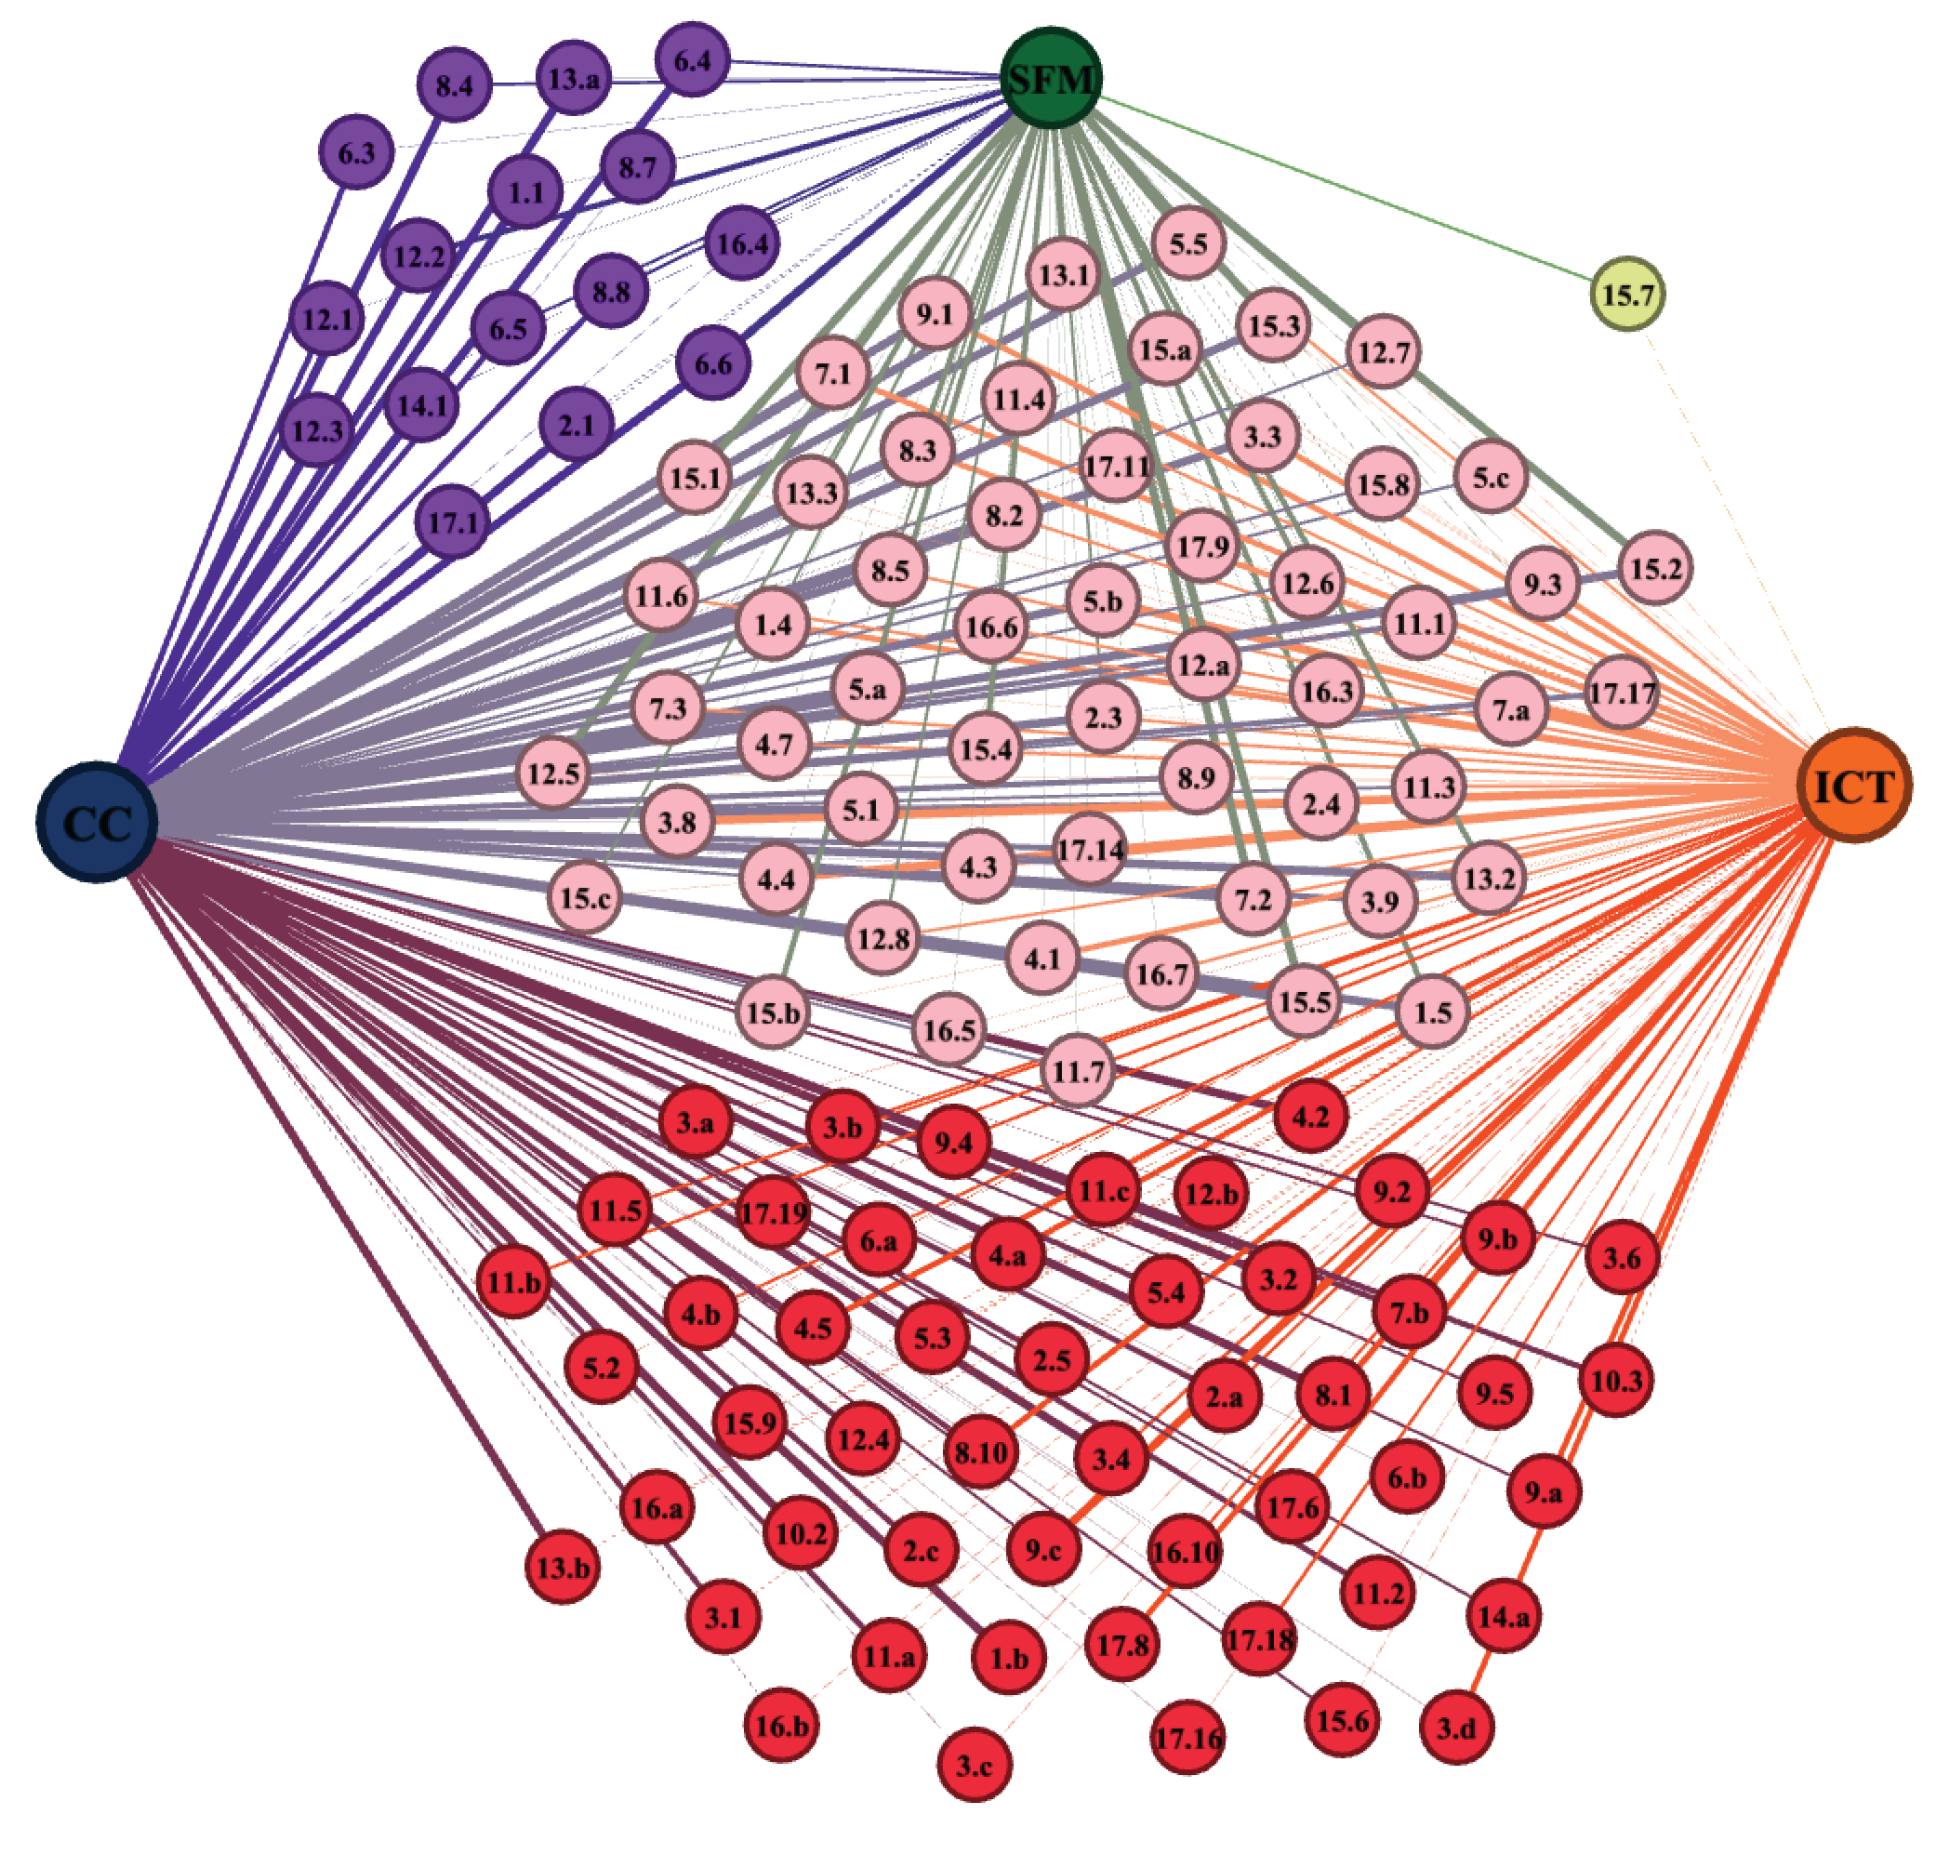
This study simplified the complex interconnection of SDGs and CSI Nexus through systems thinking approach using Gephi®. Figure 5 illustrates the results of the CSI-SDT network, which reduced the number of nodes to 127 and edges (connections) to 304. It was found that 16 SDTs (Purple Nodes) were connected to CC and SFM hubs, one (1) SDT (Yellow Node) connected to SFM and ICT Hubs, 51 SDTs (Red nodes) connected to ICT and CC hubs, and 56 SDTs (Pink nodes) were connected to CC, SFM, and ICT Hubs. Out of 169 SDTs, 124 were interconnected with CSI – Nexus. Thus, removing all SDTs with zero and one connection. The width of the edges depends on the number of connections ranging from 1 to 4 lines. The thicker the width of the lines, the higher the number of links, and the more lines connected, the larger the size of the nodes the more connected SDTs which means the more significant the nodes are.

3.4. Assessment of the Relationships between the CC, SFM, ICT, and the SDTs

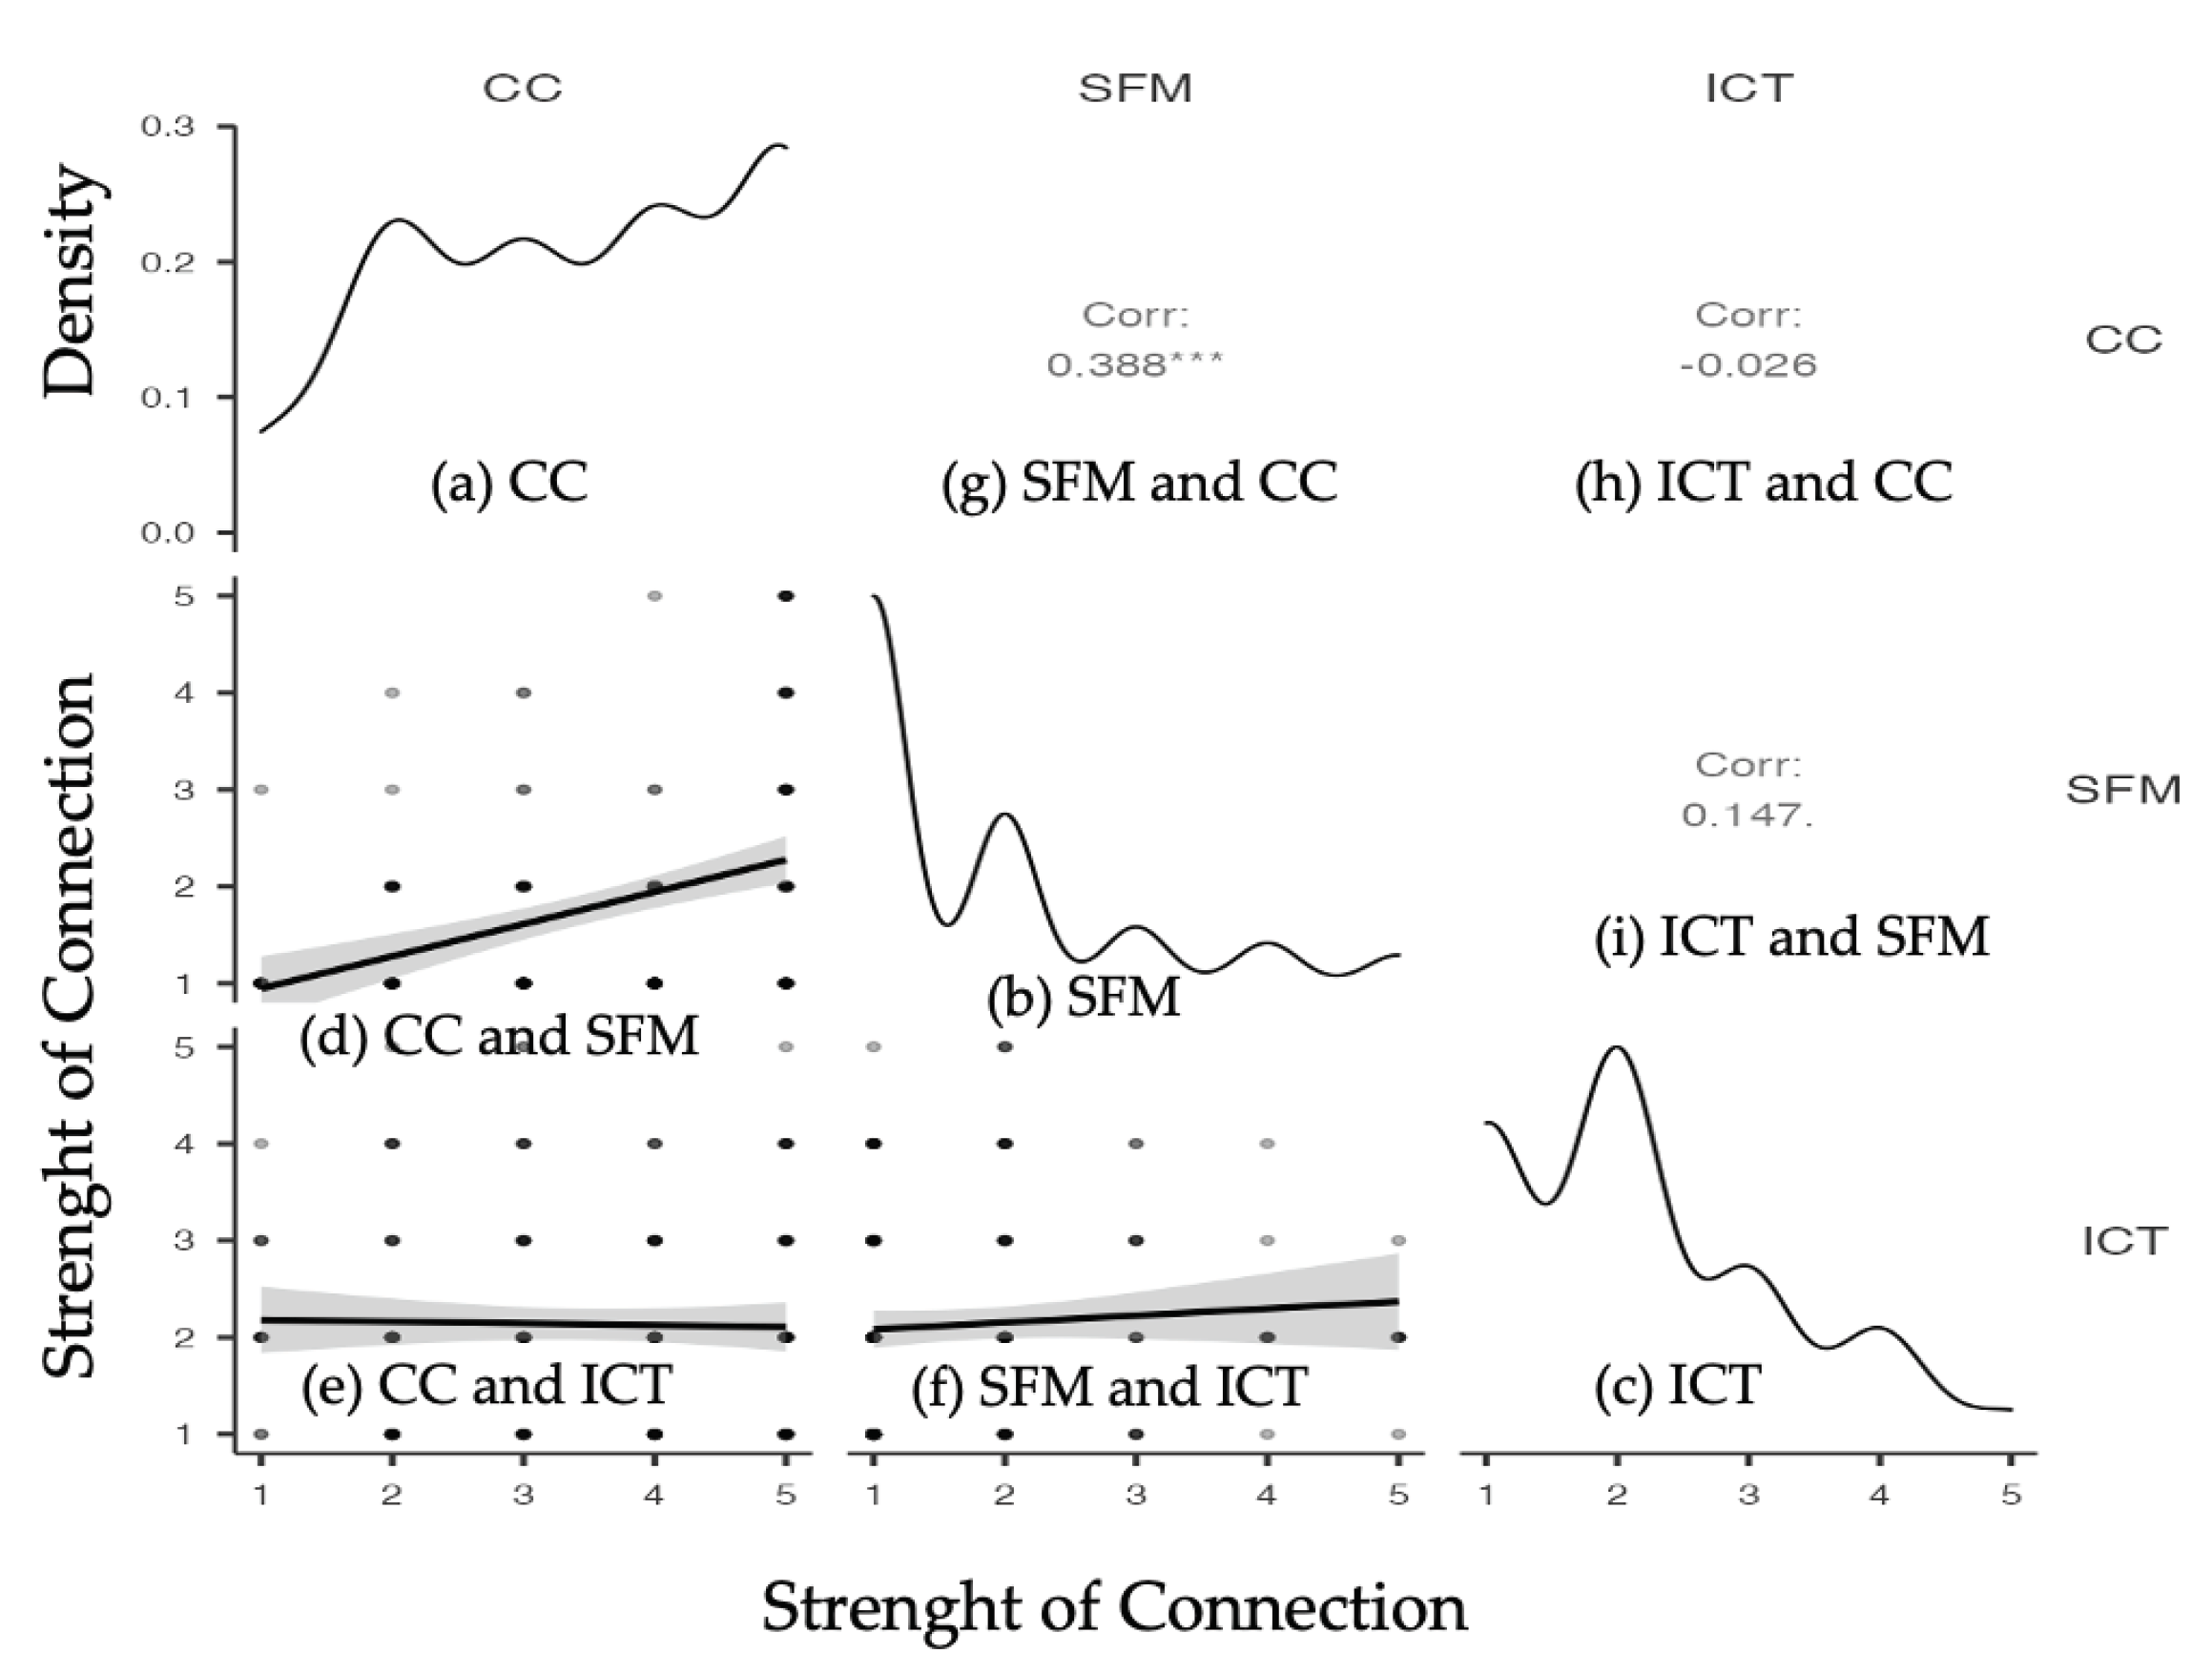
Figure 6 shows Spearman's rho Correlations Matrix between and among CC, SFM, and ICT, illustrating their densities, statistics, and significant correlations. The CC revealed to not correlate with ICT, rho = -.026, p = .736 but positively correlated and statistically significant with SFM, rho = +.388, p < .001. Likewise, the ICT was positively correlated but had no significant relationship with SFM, rho = .147, p = .057. In addition, Figure 6 shows the density curve, which suggested that the majority of SDTs were strongly connected to CC; however, only a few numbers of SDTs were strongly linked to SFM and ICT. The linear scatter plot was used to visualize the relationship between CC and SFM, CC and ICT, and SFM and ICT. It used series of dots to observe trends and patterns. The slope of the line of best fit of CC and SFM shows an increasing trends, indicating a positive correlation. However, CC and ICT decreases, indicating negative correlations. Lastly, SFM and ICT relationships shows a slightly increasing trend, indicating weak positive correlations between the two components.

3.2.2. CSI-Nexus and the SDG 2030 Integration Framework

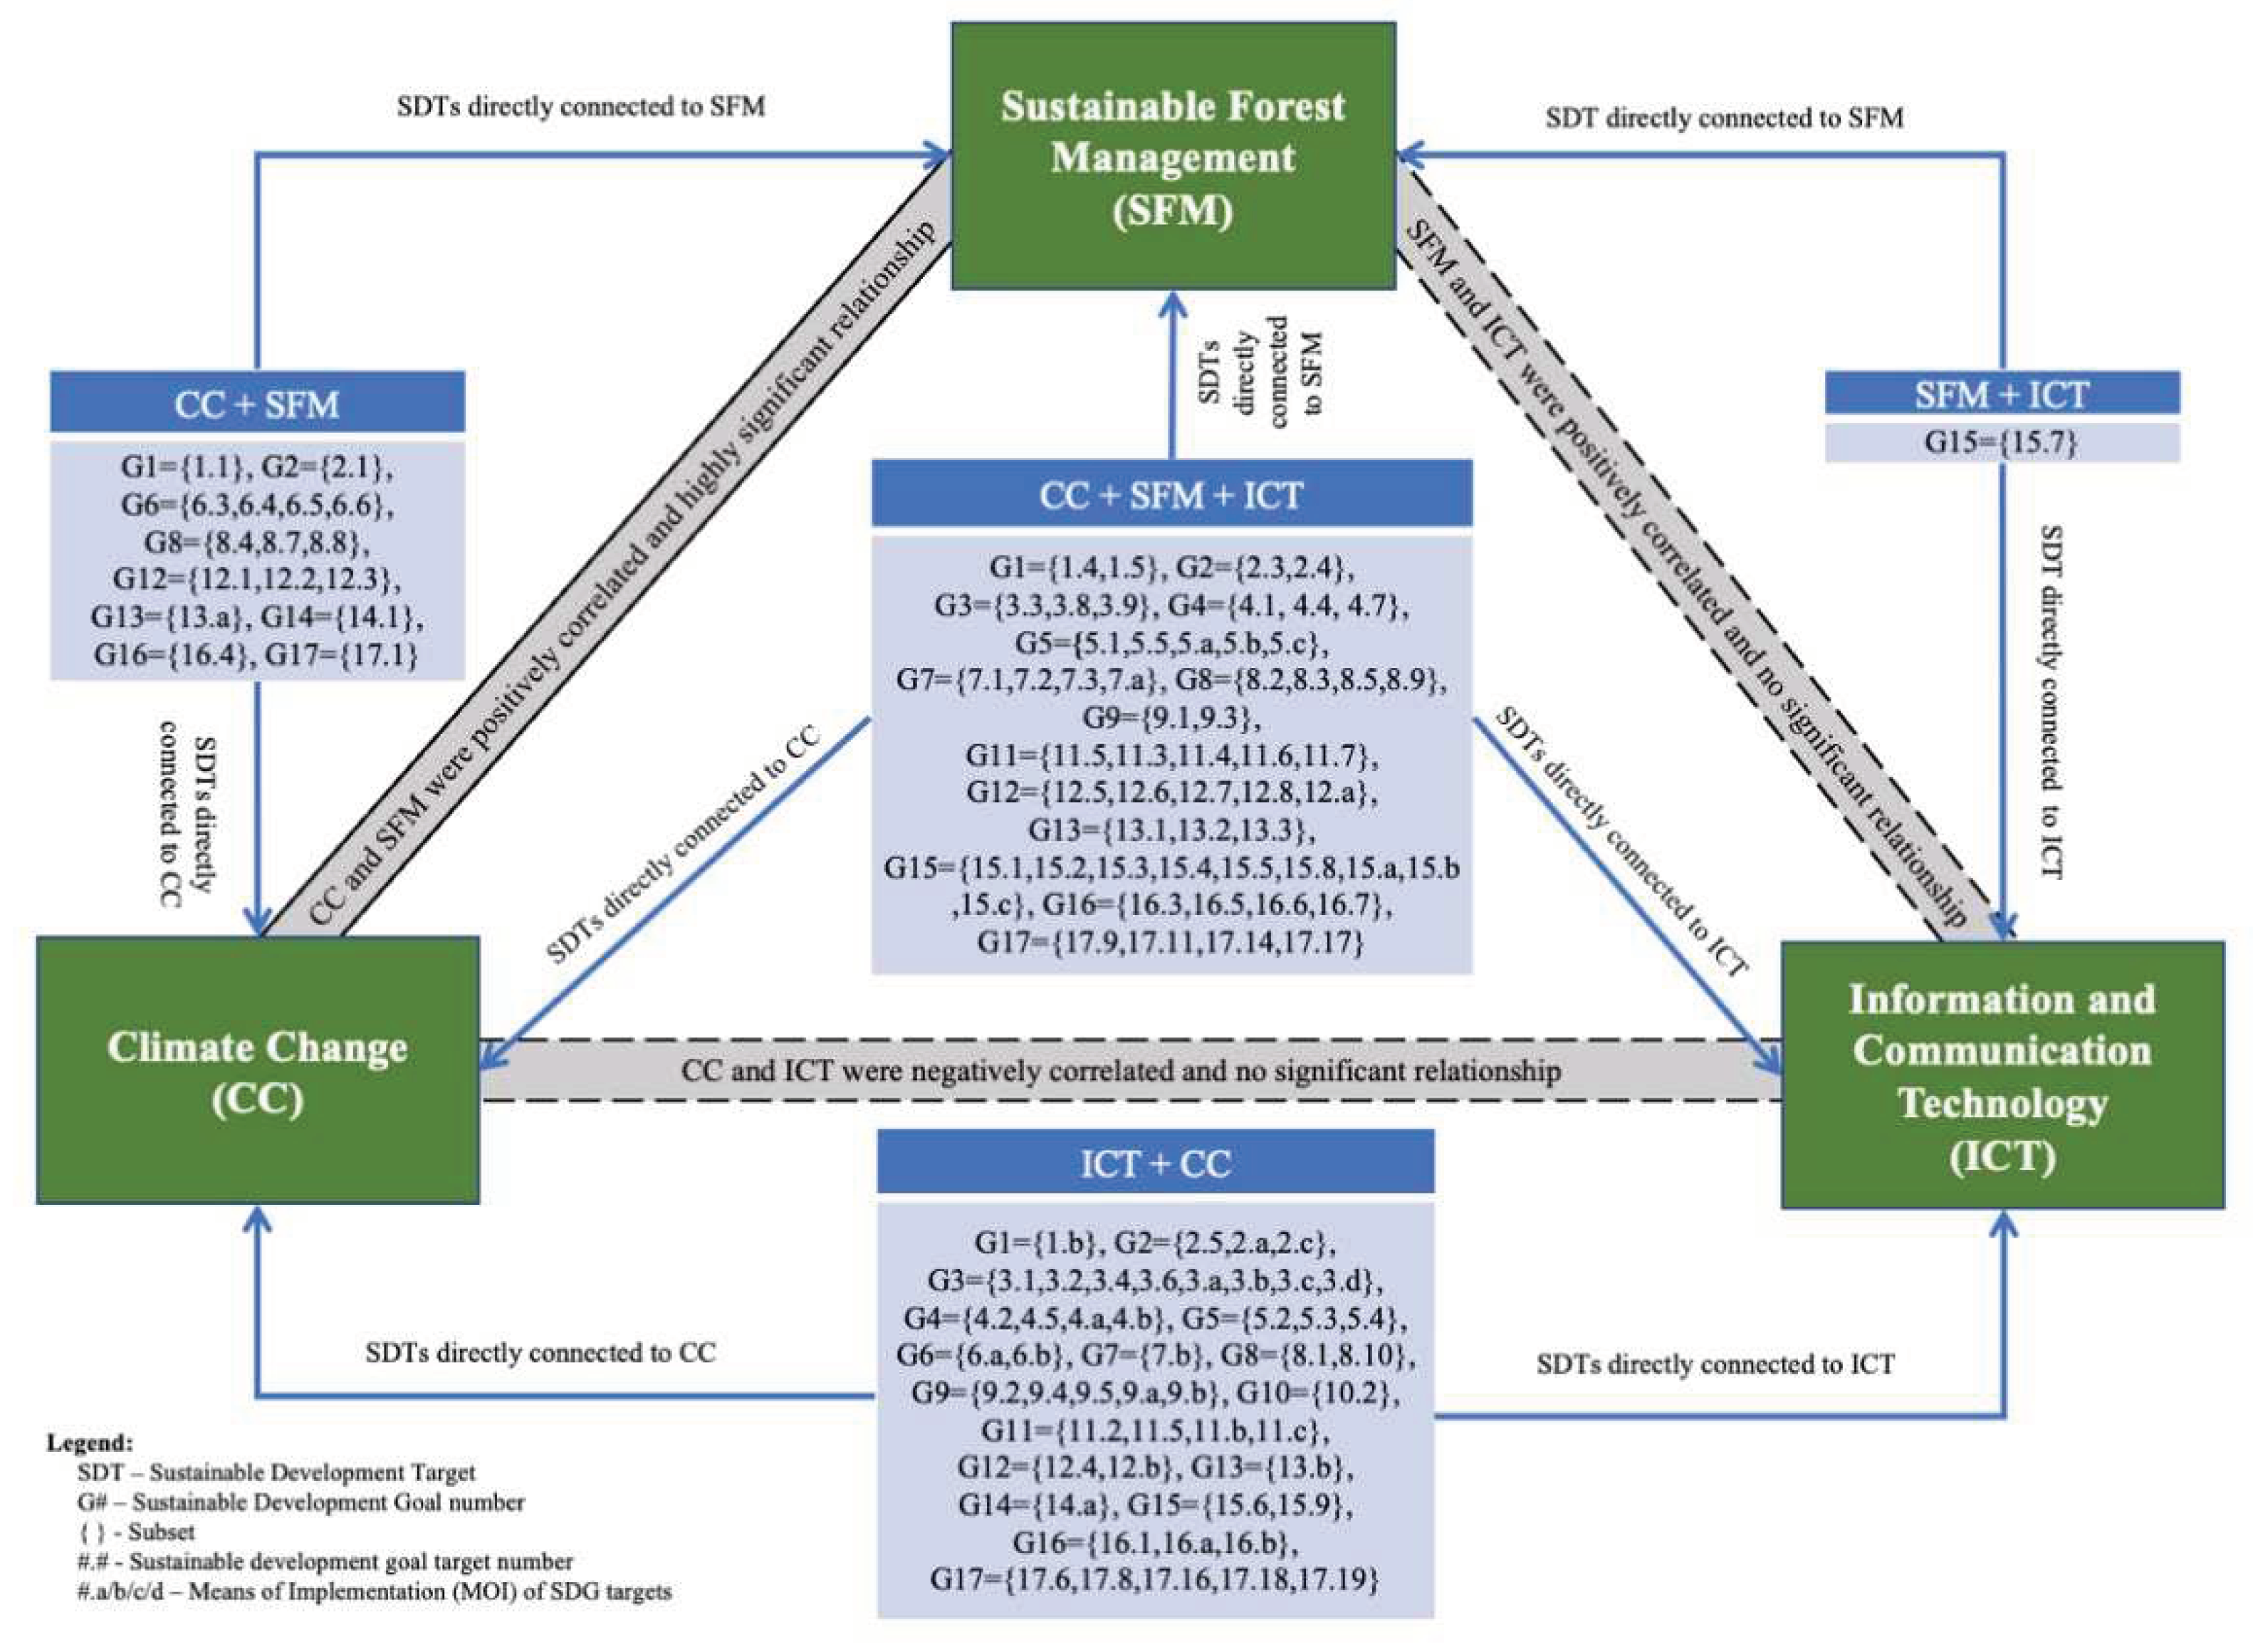
Figure 7 displays a simplified CSI-Nexus and SDG 2030 integration framework that includes CC, SFM, ICT, and the SDT. It illustrates the significant relationships and correlations between CC, SFM, and ICT, along with their connected SDTs. Significant associations and positive correlations were found between the CC and SFM with 16 SDTs directly connected within the CC+SFM cluster of CSI-nexus. SFM and ICT were positively correlated but had no significant association, with only 1 SDT directly connected to them, called the SFM+ICT cluster. ICT and CC were negatively correlated but with no significant association, and 51 SDTs were directly connected within the ICT+CC cluster. Although ICT has no significant association with the CC and SFM, there were 56 SDTs strongly and directly connected within the CC+SFM+IC cluster. The groupings of SDT in each cluster was just a subset of 17 SDGs, e.g., G1 = {1.4,1.5} indicates that, in SDG 1-No Poverty, there were two targets aligned to CC+SFM+ICT cluster, one target, G1 = {1.1}, connected to CC+SFM cluster, and another one target, G1 = {1.b}, connected to ICT+CC cluster.

4.0. Discussion

This section analyzes the interconnections of CC, SFM, and ICT to the 169 targets using two different techniques: 1) mapping of interconnections using affiliation matrix and statistically comparing the frequency distributions of CC, SFM, and ICT; and 2) Network analysis and visualization of the interconnection of SDTs to CSI-Nexus.

4.1. Connecting SDG Targets to CC, SFM, ICT, and SD

The first set of analyses examined the connections of 169 SDTs from the collected data of 12 pieces of literature covering the following themes, namely: CC, SFM, and ICT, by mapping their alignment in the affiliation matrix table. Table 3 revealed that of 124 SDTs connected to CSI-Nexus, there were only ten (10) strongly connected SDTs within the CC+SFM+ICT cluster, namely: targets 1.4, 5.5, 5.b, 7.1, 7.2, 8.3, 15.1, 15.2, 15.3, 15.5. It includes 5 Goals: SDG 1 – No Poverty, SDG 5 – Gender Equality, SDG 7 – Affordable and Clean Energy, SDG 8 – Decent Work and Economic growth, and SDG 15 – Life on Land. It implies that these five (goals) are most significant in the CSI Nexus.
The detailed descriptions of 10 SDTs are as follows: Target 1.4 assures that all men and women, especially the poor and vulnerable, have equal access to economic resources and basic services, land ownership and control, inheritance, natural resources, new technology, and financial services, including microfinance; Target 5.5 ensures women's full and effective involvement and equal opportunities for leadership in political, economic, and public life; Target 5.b enhances the use of enabling technologies, especially information and communications technology, to empower women; Target 7.1 assures universal access to affordable, dependable, and modern energy services, while Target 7.2 raises the worldwide proportion of renewable energy; Target 8.3 fosters development-oriented policies that support productive activities, decent job creation, entrepreneurship, creativity, and innovation, and the formalization and growth of micro-, small-, and medium-sized firms; Target 15.1 assures the conservation, restoration, and sustainable use of terrestrial and inland freshwater ecosystems and their services, including forests, wetlands, mountains, and drylands; Target 15.2 supports sustainable forest management, halts deforestation, restores degraded forests, and increases global afforestation and replanting; Target 15.3 combats desertification, restores degraded land and soil, including land affected by desertification, drought, and floods, and strives to achieve a land degradation-neutral world; Target 15.5 reduces the degradation of natural habitats, halts the loss of biodiversity, and protects and prevents the extinction of threatened species.
Although the CC+SFM+ICT cluster have 56 targets, it is still of vital importance to focus on these ten (10) targets by developing a policy that is consistent with the SDG targets and prioritizing and aligning all projects for effective resource allocation. In this instance, all government agencies, corporate sectors, and stakeholders involved in CC, SFM, and ICT can maximize their chances of achieving the SDGs.
Figure 4 reveals the unbalanced distribution of the targets in which most SDTs were connected to CC while only a few SDTs related to SFM and ICT. These results reflect those of Blanc et al. (2017), who also found out that some targets are well-connected, and some have a weaker bond as they are connected in one network system [61]. This study argued that to effectively address the CC adaptation and mitigation, additional SDG targets aligned to sustainable forest management and ICT must be considered. Moreover, Figure 7 shows that the majority of the 17 Goals of SDGs are interconnected to CC (99%), SFM (65%), and ICT (63%) (Figure 6). If the analysis is at the level of the 17 SDGs, they are seen as interconnected and indivisible [2]. The findings show a blatant misrepresentation between goals and targets, corroborating the study of Dalampira and Nastis (2020) and Blanc et al. (2017) that the SDG Framework is designed to be a network of 169 Targets [4,61]. Their findings gave an impetus and the basis for the study to focus on analyzing the interconnections of 169 SDTs to CC, SFM, and ICT.
Consequently, greenhouse gas emissions from fossil fuel consumption and deforestation are choking our planet and endangering billions of people [20]. In addition, according to the latest report of IPCC, climate change is already a code red for humanity. As a result, this study aimed to integrate CC, SFM, and ICT based on the rationale of solving the environmental degradation and human risks caused by climate change through sustainable management of the forest and the use of ICT to protect the forest and combat the negative effect of climate change. Aye et al., found that climate change and the forest are ecologically connected in that forests are both a cause and a solution for greenhouse gas emissions [24]. The strong connection between climate change and sustainable forest management was evident because of the dedicated inclusion of climate change in SDG 13 – Climate Action and Sustainable Forest Management in SDG 15 – Life on Land [1]. Lima et al. (2017) study investigated the potential synergies between SDGs and REDD+ (Reducing Emissions from Deforestation and Forest Degradation), a climate mitigation mechanism negotiated under the auspices of the United Nations Framework Convention on Climate Change, further strengthened their ties [62].

4.2. Network Analysis and Visualization of Integrating CSI-Nexus and SDTs

Figure 5 reveals that 56 SDTs (green color nodes) connect to the three network hubs of CSI Nexus, namely, CC, SFM, and ICT, which were considered the core and significant SDG targets of the network. The network also suggests that the connections can be extended further into the CC and SFM hubs with 16 SDTs, SFM and ICT hubs with one (1) SDT, and CC and ICT hubs with 51 SDTs. The complexity of the interconnections was simplified through network analysis and visualization. In Figure 2a,b, it was challenging to identify which targets were connected to CC, SFM, and ICT due to the higher number of edges and nodes connected individually, resulting in a messy network. However, after running the statistical network analysis and combining all the linkages of Climate Change [17,35-37], Sustainable Forest Management [38-41], and Information and Communication Technology [42-45], we were able to simplify the interconnections of the network as shown in Figure 5.
To identify the SDTs that interconnect CC, SFM, and ICT, the researchers eliminated 45 SDTs connected in silos with 0 or 1 degree of connection and retained the 124 SDTs commonly associated with two or more degree of connections. This study argued that, of the 124 SDTs connected to CSI-Nexus, the 56 SDTs connected to CC+SFM+ICT should be given priority in resource allocation and policy coherence because these were considered the most influential nodes in the network.

4.3. Assessment of the Relationships Between and Among CC, SFM, and ICT

The second objective of this study is to assess the relationships between and among CC, SFM, and ICT. Using a Spearman Rho Correlation, the researchers analyzed and tested the null hypothesis, "H0: that there are no significant relationships between and among climate change, sustainable forest management, and information and communication technology."
The assessment of the relationship between CC and SFM, SFM and ICT, and ICT and CC are described as follows: First, the relationship between CC and SFM was positive, moderate in strength, and statistically highly significant, r = +.388, p < .001. The mean for CC was 3.44 (SD = 1.29), and the mean for SFM was 1.76 (SD = 1.10). The difference in the mean indicates that SFM was weakly connected as compared to CC, which was strongly linked to the SDG Framework. The results suggest that more SDTs shall be aligned to SFM to increase its positive contribution to help achieve some of the SDG targets that are related to CC. Second, the relationship between SFM and ICT was positive, weak in strength, and statistically insignificant, r = +.014, p = .057. The mean for SFM was 1.76 (SD = 1.10), and the mean for ICT was 2.14 (SD = 1.05). It indicates that SFM and ICT were weakly connected to the SDG Framework. The result suggests that additional SDTs aligned with ICT are needed to maximize the potential of using ICT to sustainably protect and manage the forest. Third, the relationship between ICT and CC was negative, weak in strength, and statistically no significant r = -.026, p = .736. The mean for ICT was 2.14 (SD = 1.05), and the mean for CC was 3.44 (SD = 1.29). It indicates that ICT was moderately connected while CC was strongly linked to SDGs Framework. Hence ICT and CC were negatively correlated, and there is a need to add more SDTs aligned with ICT to strengthen its connections for CC mitigation. These findings were also supported by the study of Aye et al. (2022), which suggest that forests are both a cause and a solution for greenhouse gas emission and preventing forest ecosystem loss and degradation and promoting their restoration could contribute more than one-third of the total climate change mitigation required by 2030 to achieve the goals of the Paris Agreement [24,26].
Lastly, to emphasize the relationship between CC, SFM, and ICT, this research assessed the hypothesis: "H0: There are no significant relationships between and among the CC, SFM, and ICT". The results showed that the relationship between CC and SFM is highly significant. However, ICT has no significant association with CC and SFM; hence, H0 was rejected for the relationship between CC and SFM but acceptable for the relationship between ICT and CC and ICT and SFM.

4.4. CSI-Nexus and SDG 2030 Integration Framework

Figure 7 shows the CSI-Nexus and SDG 2030 Integration Framework, which indicates the interconnection of 124 SDTs to the four (4) clusters, namely, CC+SFM, SFM+ICT, ICT+CC, and CC+SFM+ICT. Although this study revealed that the ICT has no significant association with CC and SFM, it can still be considered as significantly connected because of the 56 SDTs connected to CC+SFM+ICT, 51 SDTs connected to ICT+CC, and one (1) SDT connected to SFM+ICT clusters of the CSI – Nexus Network. On the other hand, CC and SFM were positively correlated and significantly highly associated with each other interconnecting 16 SDTs in the CC+SFM cluster. SFM and ICT were also interconnected with only one (1) SDT within the SFM+ICT cluster. The CSI-Nexus Framework also suggests that the CC+SFM+ICT cluster consists of 14 goals, and 56 SDTs shall be the priority agenda of all stakeholders in the field of CC, SFM, and ICT. The results impl0 that any institutions involved in climate change, forestry, and ICT must focus their policies and resource allocation on the identified targets for policy coherence as presented [17] and systemic and contextual prioritization of implementing the Agenda 2030 of sustainable development [63].

5. Conclusions

In conclusion, this study integrated CC, SFM, and ICT into the SDG framework and analyzed their relationships across 169 SDTs. CC was more connected than SFM and ICT. ICT's role in reducing climate change and safeguarding forests is overlooked in the SDG framework. The study finds that the SDG framework undervalues ICT's interlinkages to combat climate change.
This study found a significant positive association between CC and SFM, whereas ICT has a negative relationship with CC and a positive relationship with SFM. According to the analysis of SDG target connections, ICT has a limited impact on CC and SFM.
The SDGs' integrated design is simplified by this study. Decision-makers in diverse sectors may prioritize initiatives and allocate resources to the most relevant SDTs aligned to CC, SFM, and ICT based on the findings. Future study can utilize network simulations and modeling to identify more significant and interdependent SDTs.
Finally, our analysis was limited by a lack of existing literature and an emphasis on centrality in identifying SDTs linkages in the CSI-Nexus. SDT interactions and interdependencies must be studied to determine their interrelationships and create a systems thinking paradigm.

Supplementary Materials

The following supporting information can be downloaded at the website of this paper posted on Preprints.org. Figure S1: Network Visualization of Connecting CC_1 to CC_4, SFM_1 to SFM_4, ICT_1 to ICT_4, and the SDTs into One Network System; Table S1: List of Literature as Data Source in Connecting SDTs to CC, SFM, and ICT; Table S2: Affiliation matrix of CC, SFM, ICT, SDTs, and CSI-Nexus Clusters; Table S3: Network Centrality Measures of Integrating CC, SFM, ICT, and SDTs; Table S4: Descriptions of Sustainable Development Goals, Targets, and Indicators of 56 SDTs Interconnecting CC, SFM, and ICT.

Author Contributions

Conceptualization, E.E., R.A., A.S., and R.P.; methodology, E.E., R.A, and A.S.; software, E.E.; validation, R.A, A.S., R.P., P.S., R.L., MR.T., and MC.F.; formal analysis, E.E.; investigation, E.E; resources, R.A., A.S, R.P., R.L.; data curation, E.E., R.A., and A.S.; writing—original draft preparation, E.E.; writing—review and editing, R.A. and A.S..; visualization, E.E.; supervision, R.A., and A.S.; project administration, R.A., A.S., and R.P.; funding acquisition, E.E., R.A., A.S., and R.P.; All authors have read and agreed to the published version of the manuscript.”

Funding

This sandwich research collaboration was funded by Mindanao State University Systems and MSU-Iligan Institute of Technology, Philippines; Kastamonu University, Turkey; and the Erasmus+.

Data Availability Statement

The collected Data source of the alignment of 169 Sustainable Development Goal Targets are available in the following URLs: 1) https://bit.ly/3jJBlCu, 2) https://bit.ly/3vztl9P, 3) https://bit.ly/3vx2Xx7, 4) https://bit.ly/3CEeAqj, 5) https://bit.ly/3Z7W6rQ, 6) https://bit.ly/3G66RlH, 7) https://bit.ly/3X0G0y4, 8) https://bit.ly/3WBVLvC, 9) https://bit.ly/3G7MMeQ, 10) https://bit.ly/3Q9Cxv9, 11) https://bit.ly/3WWKeGX, and 12) https://bit.ly/3i8mrFe, accessed on October 30, 2022.

Acknowledgments

The authors wish to thank the following: The Administrators of MSU Systems for granting me an opportunity to conduct a research collaboration at Kastamonu University, Turkey; the Administrators of MSU-Iligan Institute of Technology for giving me a three-year Faculty Development Program (FDP) for me to finish my Dissertation; administrators of Kastamonu University, Turkey, especially, to all academic and technical staff of the Faculty of Forestry, for granting me an opportunity to use their resources and offices during my six months (3 months in 2017 and 3 months in 2019) stayed to conduct my research; Dr. Venus R. Parmisana for reviewing and editing our manuscripts; to the unwavering supports and prayers of my family; and lastly, to the Lord Almighty for divine guidance and intellectual analysis to finish my Dissertation.

Conflicts of Interest

The authors declare no conflict of interest.

References

  1. UNDESA. Global indicator framework for the Sustainable Development Goals and targets of the 2030 Agenda for Sustainable Development. Available online: https://bit.ly/3G9B82T (accessed on October 29, 2022).
  2. UNEP. Resolution Adopted by General Assembly A/RES/70/1, Transforming our world: the 2030 Agenda for Sustainable Development Available online:. Available online: https://bit.ly/3jLcxdh (accessed on October 29, 2022).
  3. United Nations. Transforming our world: The 2030 agenda for sustainable development. Available online: https://bit.ly/3Gxv6KZ (accessed on November 30, 2022).
  4. Dalampira, E.-S.; Nastis, S.A. Mapping Sustainable Development Goals: A network analysis framework. Sustainable Development 2020, 28, 46–55. [Google Scholar] [CrossRef]
  5. Blanc, D.L. Towards Integration at Last?: The Sustainable Development Goals as a Network of Targets. Sustainable Development 2015, 23, 176–187. [Google Scholar] [CrossRef]
  6. UNESCAP. Integrating the three dimensions of sustainable development: A framework and tools. Available online: www.unescap.org (accessed on October 29, 2022).
  7. Fonseca, L.M.; Domingues, J.P.T.; Dima, A.M. Mapping the sustainable development goals relationships. Sustainability 2020, 12, 3359. [Google Scholar] [CrossRef]
  8. Fuso Nerini, F.; Tomei, J.; To, L.S.; Bisaga, I.; Parikh, P.; Black, M.; Borrion, A.; Spataru, C.; Castán Broto, V.; Anandarajah, G.; et al. Mapping synergies and trade-offs between energy and the Sustainable Development Goals. Nature Energy 2017 3:1 2017, 3, 10–15. [Google Scholar] [CrossRef]
  9. Nilsson, M.; Chisholm, E.; Griggs, D.; Howden-Chapman, P.; McCollum, D.; Messerli, P.; Neumann, B.; Stevance, A.S.; Visbeck, M.; Stafford-Smith, M. Mapping interactions between the sustainable development goals: lessons learned and ways forward. Sustainability Science 2018, 13, 1489–1503. [Google Scholar] [CrossRef]
  10. Pilling, M.; Lucille, B. The sustainable development goals: Implications and integration across the Curricula. 2016. [Google Scholar] [CrossRef]
  11. Schina, D.; Esteve-González, V.; Usart, M.; Lázaro-Cantabrana, J.L.; Gisbert, M. The integration of sustainable development goals in educational robotics: A teacher education experience. Sustainability (Switzerland) 2020, 12. [Google Scholar] [CrossRef]
  12. UNDESA. SDG Indicators —Metadata Repository. Available online: https://unstats.un.org/sdgs/metadata/ (accessed on October 29, 2022).
  13. McCollum, D.L.; Echeverri, L.G.; Busch, S.; Pachauri, S.; Parkinson, S.; Rogelj, J.; Krey, V.; Minx, J.C.; Nilsson, M.; Stevance, A.-S.; et al. Connecting the sustainable development goals by their energy inter-linkages. Environ. Res. Lett. 2018, 13, 033006–033006. [Google Scholar] [CrossRef]
  14. Aljuaid, H. Connecting United Nations Sustainable Development Goals (SDGs) with Global Learning. International Journal of English Language and Linguistics Research 2021, 9, 15–25. [Google Scholar]
  15. Ntona, M.; Morgera, E. Connecting SDG 14 with the other Sustainable Development Goals through marine spatial planning. Marine Policy 2018, 93, 214–222. [Google Scholar] [CrossRef]
  16. Mantlana, K.B.; Maoela, M.A. Mapping the interlinkages between sustainable development goal 9 and other sustainable development goals: A preliminary exploration. Business Strategy and Development 2020, 3, 344–355. [Google Scholar] [CrossRef]
  17. Zhou, X.; Moinuddin, M.; Xu, M. Sustainable Development Goals Interlinkages and Network Analysis: A practical tool for SDG integration and policy coherence. 2017, 122–120. [Google Scholar] [CrossRef]
  18. Pereira, G.; González, A.; Blanco, G. Complexity Measures for the Analysis of SDG Interlinkages: A Methodological Approach. In Proceedings of the 6th International Conference on Complexity, Future Information Systems and Risk - COMPLEXIS; pp. 13–24. [CrossRef]
  19. Callaghan, M.; Schleussner, C.-F.; Nath, S.; Lejeune, Q.; Knutson, T.R.; Reichstein, M.; Hansen, G.; Theokritoff, E.; Andrijevic, M.; Brecha, R.J. Machine-learning-based evidence and attribution mapping of 100,000 climate impact studies. Nature climate change 2021, 11, 966–972. [Google Scholar] [CrossRef]
  20. IPCC. Climate change: a threat to human wellbeing and health of the planet. Taking action now can secure our future. Available online: https://bit.ly/3Ci46N3 (accessed on October 20, 2022).
  21. Pörtner, H.-O.; Roberts, D.C.; Adams, H.; Adler, C.; Aldunce, P.; Ali, E.; Begum, R.A.; Betts, R.; Kerr, R.B.; Biesbroek, R. Climate change 2022: Impacts, adaptation and vulnerability. IPCC Sixth Assessment Report 2022. [Google Scholar]
  22. Jones, A. The health impacts of climate change: why climate action is essential to protect health. Orthopaedics and Trauma 2022, 36, 248–255. [Google Scholar] [CrossRef]
  23. IPCC. Climate change widespread, rapid, and intensifying – IPCC. Available online: https://bit.ly/3G1KLRe (accessed on 30 November 2022).
  24. Aye, W.N.; Tong, X.; Tun, A.W. Species Diversity, Biomass and Carbon Stock Assessment of Kanhlyashay Natural Mangrove Forest. Forests 2022, 13, 1013. [Google Scholar] [CrossRef]
  25. Kumar, R.; Kumar, A.; Saikia, P. Deforestation and Forests Degradation Impacts on the Environment. Environmental Degradation: Challenges and Strategies for Mitigation 2022, 19–46. [Google Scholar] [CrossRef]
  26. IUCN. forests and climate change issues brief 2021. Available online: https://www.iucn.org/sites/default/files/2022-04/forests_and_climate_change_issues_brief_2021.pdf (accessed on November 30, 2022).
  27. United Nations. Sustainably manage forests, combat desertification, halt and reverse land degradation, halt biodiversity loss. Available online: https://www.un.org/sustainabledevelopment/biodiversity/ (accessed on July 3, 2022).
  28. Abdollahbeigi, B.; Salehi, F. The role of information and communication industry (ICT) in the reduction of greenhouse gas emissions in Canada. International Research Journal of Business Studies 2021, 13, 307–315. [Google Scholar] [CrossRef]
  29. Ajwang, S.O.; Nambiro, A.W. Climate Change Adaptation and Mitigation using Information and Communication Technology. International Journal of Computing Sciences Research 2022, 1046–1063. [Google Scholar] [CrossRef]
  30. Shobowale, K.O.; Olanrewaju, A.A.; Muftau, A. Effectiveness of the Role Technology Plays in Tackling Climate Change. Earth Systems Protection and Sustainability 2022, 141–159. [Google Scholar] [CrossRef]
  31. Dickerson, K.; Torres, D.; Canet, J.-M.; Smiciklas, J.; Faulkner, D.; Bueti, C.; Vassiliev, A. Using ICTs to Tackle Climate Change. Available online: https://bit.ly/3jLWTOQ (accessed on 20 October 2022).
  32. Stankovic, M.; Neftenov, N.; Gupta, R. Use of Digital Tools in Fighting Climate Change: A Review of Best Practices. Available online: https://bit.ly/3Gxodt6 (accessed on 21 October 2022).
  33. FAO. Application of ICTs in Forestry Management. Available online: https://www.fao.org/e-agriculture/news/application-icts-forestry-management (accessed on 30 June 2022).
  34. United Nations. Paris Agreement on Climate Change. Available online: https://bit.ly/3i6CRhp (accessed on 22 October 2022).
  35. Fuso Nerini, F.; Sovacool, B.; Hughes, N.; Cozzi, L.; Cosgrave, E.; Howells, M.; Tavoni, M.; Tomei, J.; Zerriffi, H.; Milligan, B. Connecting climate action with other Sustainable Development Goals. Nature Sustainability 2019, 2, 674–680. [Google Scholar] [CrossRef]
  36. IPCC. Global warming of 1.5 C: An IPCC Special Report on the impacts of global warming of 1.5°C above pre-industrial levels and related global greenhouse gas emission pathways. Available online: https://bit.ly/3vztl9P (accessed on 5 December 2022).
  37. FAO. Climate-smart agriculture and the Sustainable Development Goals: Mapping interlinkages, synergies and trade-offs and guidelines for integrated implementation. Available online: https://bit.ly/3vx2Xx7 (accessed on 23 October 2022).
  38. FAO. The State of the World’s Forests 2018 - Forest Pathways to Sustainable Development. Available online: https://bit.ly/3Z7W6rQ (accessed on 5 September 2022).
  39. OLI-UNFF. Development of a global core set of forest indicators to support the implementation of the 2030 Agenda on Sustainable Development and the IAF Strategic Plan. Available online: https://bit.ly/3G66RlH (accessed on 29 October 2022).
  40. FSC. FSC: A Tool to Implement the Sustainable Development Goals. Available online: https://bit.ly/3X0G0y4 (accessed on 29 October 2022).
  41. WBCSD’s FSG. Forest Sector SDG Roadmap. Available online: https://bit.ly/3WBVLvC (accessed on November 30, 2022).
  42. Ericson and EICU. ICT and SDGs: How Information and Communications Technology Can Accelerate Action on the Sustainable Development Goals. Available online: https://bit.ly/3i8mrFe (accessed on October 30, 2022).
  43. Huawei; ITU; GeSI. ICT Sustainable Development Goals Benchmark: Accelerating SDGs through ICT. Available online: https://bit.ly/3WWKeGX (accessed on December 6, 2022).
  44. WSIS. Linking WSIS Action Lines with Sustainable Development Goals. Available online: https://bit.ly/3Q9Cxv9 (accessed on October 29, 2022).
  45. PMID. A Thematic List of ICT indicators for the SDGs. Available online: https://bit.ly/3G7MMeQ (accessed on October 29, 2022).
  46. Laumann, F.; von Kügelgen, J.; Kanashiro Uehara, T.H.; Barahona, M. Complex interlinkages, key objectives, and nexuses among the Sustainable Development Goals and climate change: a network analysis. The Lancet Planetary Health 2022, 6, e422–e430. [Google Scholar] [CrossRef] [PubMed]
  47. Martín, E.G.; Giordano, R.; Pagano, A.; van der Keur, P.; Costa, M.M. Using a system thinking approach to assess the contribution of nature based solutions to sustainable development goals. The Science of the total environment 2020, 738, 139693. [Google Scholar] [CrossRef] [PubMed]
  48. Kutty, A.; Abdella, G.; Kucukvar, M.; Onat, N.; Bulu, M. A system thinking approach for harmonizing smart and sustainable city initiatives with United Nations sustainable development goals. Wiley 2020. [Google Scholar] [CrossRef]
  49. Arnold, R.D.; Wade, J.P. A definition of systems thinking: A systems approach. Procedia Computer Science 2015, 44, 669–678. [Google Scholar] [CrossRef]
  50. Echendu, A.J. Flooding, food security and the sustainable development goals in Nigeria: An assemblage and systems thinking approach. Social Sciences 2022, 11, 59. [Google Scholar] [CrossRef]
  51. Clark, S.; MacLachlan, M.; Marshall, K.; Morahan, N.; Carroll, C.; Hand, K.; Boyle, N.; O’Sullivan, K. Including digital connection in the united nations sustainable development goals: A systems thinking approach for achieving the SDGs. Sustainability 2022, 14, 1883. [Google Scholar] [CrossRef]
  52. Stead, S.M. Using systems thinking and open innovation to strengthen aquaculture policy for the United Nations Sustainable Development Goals. Journal of fish biology 2019, 94, 837–844. [Google Scholar] [CrossRef]
  53. Parrish, A.E.M. Discovering the United Nations sustainable development goals through the integration of systems thinking in a greener and sustainable chemistry course. 2020. [Google Scholar] [CrossRef]
  54. Reynolds, M.; Blackmore, C.P.; Ison, R.; Shah, R.; Wedlock, E. The Role of Systems Thinking in the Practice of Implementing Sustainable Development Goals. 2017, 677–698. [Google Scholar] [CrossRef]
  55. OECD. Better policies for sustainable development 2016: A new framework for policy coherence. 2016. [Google Scholar] [CrossRef]
  56. Lucia, M.; Beatriz, V.L.; Matteo, V.; Dominic, W.; Giacomo, G.; David, P. Mapping the role of Raw Materials in Sustainable Development Goals. 2019. [Google Scholar] [CrossRef]
  57. Borgatti, S.P.; Everett, M.G. Network analysis of 2-mode data. Social Networks 1997, 19, 243–269. [Google Scholar] [CrossRef]
  58. Barabási, A.-L. Linked: The new science of networks. 2003. [Google Scholar] [CrossRef]
  59. De Brún, A.; McAuliffe, E. Social network analysis as a methodological approach to explore health systems: A case study exploring support among senior managers/executives in a hospital network. International Journal of Environmental Research and Public Health 2018, 15. [Google Scholar] [CrossRef] [PubMed]
  60. Hansen, D.L.; Shneiderman, B.; Smith, M.A.; Himelboim, I. Social network analysis: Measuring, mapping, and modeling collections of connections. Analyzing Social Media Networks with NodeXL 2020, 31–51. [Google Scholar] [CrossRef]
  61. Blanc, D.L.; Freire, C.; Vierros, M. Mapping the Linkages between Oceans and Other Sustainable Development Goals: A Preliminary Exploration. Research Papers in Economics 2017. [Google Scholar] [CrossRef]
  62. Lima, M.G.B.; Kissinger, G.; Visseren-Hamakers, I.J.; Braña-Varela, J.; Gupta, A. The Sustainable Development Goals and REDD+: assessing institutional interactions and the pursuit of synergies. International Environmental Agreements-politics Law and Economics 2017, 17, 589–606. [Google Scholar] [CrossRef]
  63. Weitz, N.; Carlsen, H.; Nilsson, M.; Skånberg, K. Towards systemic and contextual priority setting for implementing the 2030 Agenda. Sustainability Science 2017, 13, 531–548. [Google Scholar] [CrossRef]
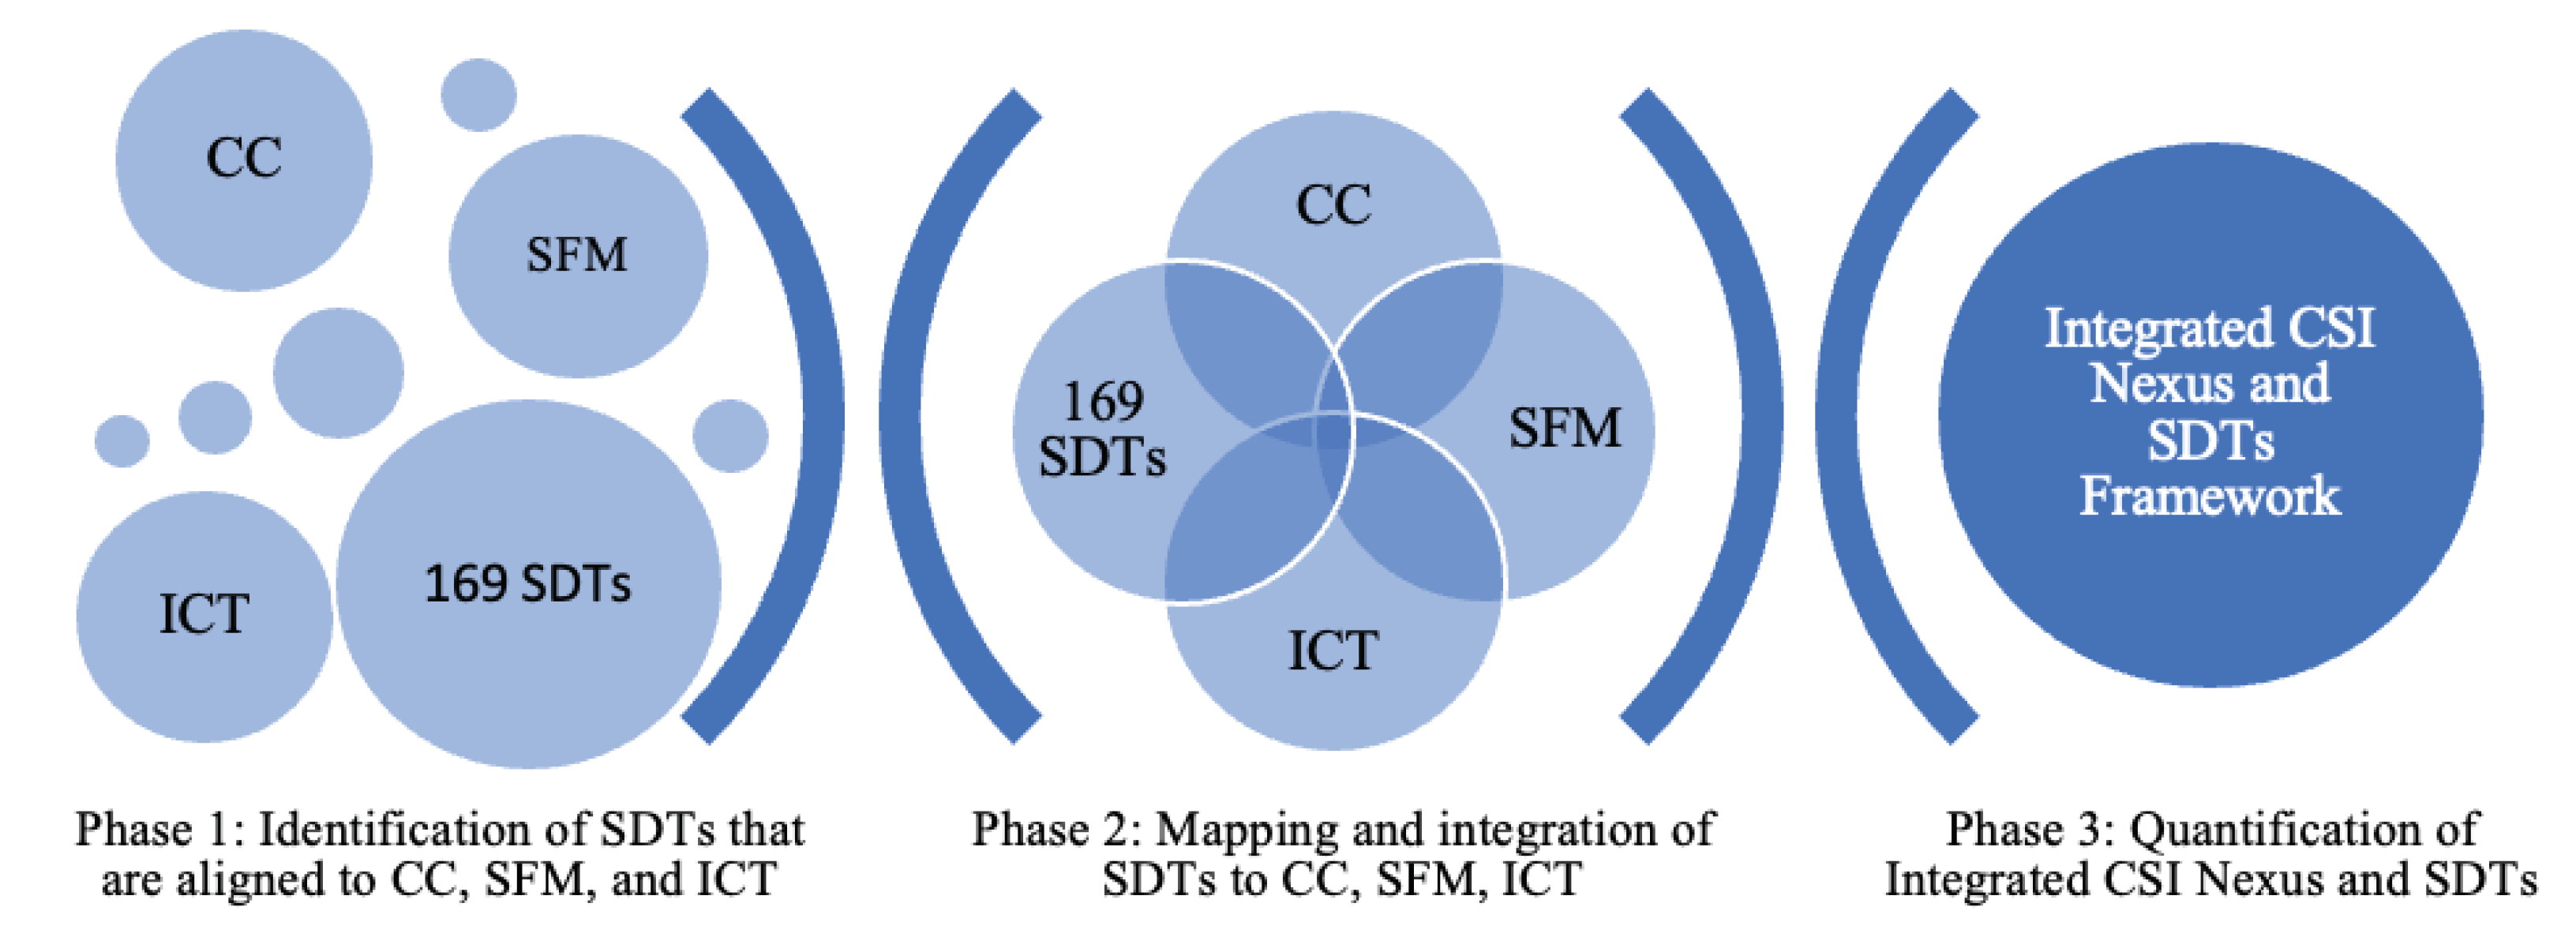
Figure 1. Analytical Framework for Integrating CC, SFM, ICT, and the SDTs.
Preprints 68861 g001
Figure 2. Network Visualization of the Interconnections of SDTs to CC, SFM, and ICT: a) Interconnections of CC1-CC4, SFM1-SFM4, and ICT1-ICT4; b) Simplified Interconnections of combining CC, SFM, and ICT.
Preprints 68861 g002
Figure 3. Illustration of Network Analysis and Visualization of the Interconnections of CSI and SDTs using Gephi: a) Network visualization of CSI-SDT Integration; b) Network Analysis Showing the data table of Network Centrality.
Preprints 68861 g003
Figure 4. Frequency distribution of SDG targets to CC, SFM, and ICT.
Preprints 68861 g004
Figure 5. Network Visualization of the Integrated CSI-SDG Targets.
Preprints 68861 g005
Figure 6. Correlation Matrix Plot of CC, SFM, and ICT. Note: The correlation matrix plot shows the relationship of three variables, CC, SFM, and ICT, represented by the density curve, the scatter plot, and the correlation coefficient: (a) Density curve of Climate Change (CC), (b) Density curve of Sustainable Forest Management (SFM), (c) Density curve of Information and Communication Technology (ICT); Visual relationship of two variable using dots and best fit line: (d) scatter plot of CC and SFM, (e) scatter plot of CC and ICT, and (f) scatter plot of SFM and ICT; The correlation coefficient of: (g) SFM and CC, (h) ICT and CC, and (i) ICT and SFM. The value for x and y axis represents the strength of connections, with values ranging from 1 (no connection), 2 (weak connection), 3 (moderate connection), 4 (strong connection), and 5 (very strong connection).
Preprints 68861 g006
Figure 7. CSI Nexus and SDG 2030 Integration Framework.
Preprints 68861 g007
Table 1. List of Twelve Literature as Data Sources of CC, SFM, and ICT integration.
Climate Change
(CC)
Sustainable Forest Management
(SFM)
Information and Communication Technology (ICT)
ode Literature SDGs & SDTs Code Literature SDGs & SDTs Code Literature SDGs & SDTs
CC1 Nerini, F. F., et al., 2019 16 & 72 SFM1 FAO, 2018 11 & 28 ICT1 PMID, 2019 11 & 27
CC2 IPCC, 2018 17 & 121 SFM2 OLI-UNFF, 2016 8 & 17 ICT2 ITU-WSIS, 2015 17 & 83
CC3 FAO, 2019 17 & 89 SFM3 FSC, 2019 14 & 40 ICT3 Huawei, 2018 6 & 55
CC4 Zhou, X. et al., 2019 17 & 131 SFM4 WBCSD-FSG, 2019 11 & 43 ICT4 Ericsson & EICU, 2017 9 & 27
Table 2. Affiliation matrix of SDGs and the 12 Literature of CC, SFM, and ICT.
Preprints 68861 i001
Table 3. Frequency Distribution of SDG Targets to CC, SFM, and ICT Clusters.
Strength of Connection
CSI Clusters Counts Weak Connection Moderate Connection Strong Connection
CC + SFM 16 6.3, 8.7, 12.1, 12.3, 16.4, 17.1 1.1, 2.1, 6.4, 6.5, 6.6, 8.4, 8.8, 12.2, 13.a, 14.1
SFM + ICT 1 15.7
ICT + CC 51 2.5, 2.c, 3.1, 3.6, 3.a, 3.b, 3.c, 3.d, 4.a, 4.b, 5.2, 5.3, 5.4, 6.a, 6.b, 9.2, 9.5, 9.b, 10.3, 11.2, 11.a, 11.b, 11.c, 12.4, 12.b, 14.a, 15.6, 15.9, 16.1, 16.a, 16.b, 17.8, 17.16, 17.18, 17.19 1.b, 2.a, 3.2, 3.4, 4.2, 4.5, 7.b, 8.1, 8.10, 9.4, 9.a, 9.c, 10.2, 11.5, 13.b, 17.6
CC + SFM + ICT 56 5.c, 11.7, 15.8, 15.a, 15.c, 16.3, 16.5, 17.9, 17.11 1.5, 2.3, 2.4, 3.3, 3.8, 3.9, 4.1, 4.3, 4.4, 4.7, 5.1, 5.a, 7.3, 7.a, 8.2, 8.5, 8.9, 9.1, 9.3, 11.1, 11.3, 11.4, 11.6, 12.5, 12.6, 12.7, 12.8, 12.a, 13.1, 13.2, 13.3, 15.4, 15.b, 16.6, 16.7, 17.14, 17.17 1.4, 5.5, 5.b, 7.1, 7.2, 8.3, 15.1, 15.2, 15.3, 15.5
Note. The alphanumeric (e.g., 1.a, 1.b, 2.a) is an SDT that indicates the Means of Implementation of the different targets included in the specific goal. The Likert scale used the number of interconnections of SDT as follows: 1 to 4 – Weak Connection, 5 to 8 – Moderate Connection, and 9 to 12 – Strong Connection.
Disclaimer/Publisher’s Note: The statements, opinions and data contained in all publications are solely those of the individual author(s) and contributor(s) and not of MDPI and/or the editor(s). MDPI and/or the editor(s) disclaim responsibility for any injury to people or property resulting from any ideas, methods, instructions or products referred to in the content.
Copyright: This open access article is published under a Creative Commons CC BY 4.0 license, which permit the free download, distribution, and reuse, provided that the author and preprint are cited in any reuse.
Prerpints.org logo

Preprints.org is a free preprint server supported by MDPI in Basel, Switzerland.

Subscribe

© 2024 MDPI (Basel, Switzerland) unless otherwise stated