1. Introduction
A kinetic equation previously presented [
1] allowed determining the time history of porosity of a given shale section in terms of four constant parameters, m,n,A and activation energy E :
The right hand side is analogous to customary chemical kinetic equations, and anticipates that compaction occurs because some shale component either dissolves into pore water, or moves along the mineral-water interface, and then precipates to infill pore space. Constant ’A’ has units /time, and is a lumped constant which includes collision frequency, changing grain-to-grain contact areas, varying mineralogies, morphologies, geometical restrictions, and complications among inhogeneous solids, many of which may not participate.
The first two dimensionless parameters, m and n, were estimated by first noting that the time derivitive on the left would be zero at zero porosity, so that the first non-vanishing term in a Taylor series representation would be proportional to
. For a particular actual shale porosity profile, m and n can be varied to make
close to constant over the deeper part, as was illustrated for six sections. The exponents are not near 2/3, as expected for mathematically flat interfaces, but reflect the rough interfaces at the molecular level. The ’deeper part’ restriction arises because the compaction mechanism is pressure solution, and this necessarily disappears at the surface where there is no overburden. Other mechanisms like mechanical compaction and bioturbation contribute more at shallow depths. The six example shales used here are the same as in [
1] and the same m, n and temperature profiles are used. The included temperatures are extended to 25 deg C [
2] instead of the less inclusive 30-40 deg C as previously. This changes A and E slightly. The
A values reported here for the largest deposition rate replace those in [1]. ’Deeper part’, as before also excludes porosities greater than 0.5 if measured or reported.
The activation energies to be derived here show some variation. This variation is, however, small compared to the range among common sedimentary minerals[
3]. Current understanding and information is not complete enough to choose among minerals and conditions. For instance, there are six varieties of quartz for which different solubilities have been measured at 25 dec C, and it may be that derived pressure solution parameters will also vary for this one mineral. Mineral activation energies E for solubility also vary with pH [
3]. Other mineral cements such as CaCO3 are potential candidates. Variations observed here could be a consequence of the model, a shale property, or experimental uncertainty. Deposition rates, discussed here, are another source of variation, as are temperature variations over geologic time. Temperatures may vary non-linearly with depth presently or in the past.
Probably the source of pressure solution/compaction is an abundant mineral fraction. qualifies, as it is usually 20-50% of shales, the other largest fraction being clay minerals which also contain as framework. Reactions such as montmorillonite to illite can sometimes be a source of . Additionally, quartz is the last major mineral to freeze out of igneous materials, and thus is briefly a pore fluid and coats minerals which solidified earlier in the Bowen’s reaction series.
As a footnote, a compendium of shale porosities [
4] shows only greater than zero porosities for shales or slates.
If the actual deposition history of a shale section were known, it could be put into the left hand side (LHS) of equation 1 and the right hand side (RHS) parameters A and E could be determined. As mentioned, m and n will be unchanged here.
2. Development
As the deposition histories are not known for our examples, the missing link between deposition time and depth is required to continue. To proceed, a constant rate of solids deposition, r, in mm/y or km/Ma, is assumed for the entire section, allowing A and E to be obtained. This is done successfully for a large range, 0.2 to 20 km/Ma, for each of the six example shales, which insures that actual complicated depositional histories can be covered. The time-depth link is:
Intergrating from the section top,
to the bottom
gives the total time for deposition,
Then the geologic age at any depth
is
Here is the middle of the known geologic time interval through in which deposition occurred. All times are reckoned positive backward from the present.
The integral (4) can be numerically evaluated by dividing
through
into many, N, equal small intervals
,
Substituting Equation (
5) into (4) gives the time
since deposition, as needed in Equation (
1). For each i = 1 through N,
where subscripts containing ’z’ or ’
’ are shortened to ’i’.
This is the desired result, allowing parameters A and E to be obtained from the depositional history of the shale section on the LHS.
3. Results
For these calculations, for this mechanism, the porosity extrapolated
to z=0 is estimated for simplicity as 0.5 for all wells/sections [
5,
6,
7,
8,
9]. Reported actual surface porosities are sometimes more or less, or were omitted.
Moving all porosity terms to the left of
Equation (6) and taking the logarithm of each side yields a linear equation with intercept ln(A) and slope E. Table 1 gives the derived E and A for a broad range of realistic deposition rates, r, for each section or well studied. For each section the range of E is small compared to laboratory measurements of
quartz[
2], 24+-15kJ/mol, and all are in this range.
Table 1.
Section deposition rates and parameter fits.
Table 1.
Section deposition rates and parameter fits.
| Example |
r |
E |
A |
|
| Properties |
km/Ma |
kJ/mol |
|
std dev |
| Akita |
0.2 |
30.8 |
43 |
0.04 |
| 5-149 Ma |
0.3 |
31.1 |
49 |
0.04 |
| m,n = 0.95,1. |
1 |
31.6 |
59 |
0.04 |
| t >= 25°C |
4 |
31.8 |
62 |
0.04 |
|
=0.269 |
20 |
31.8 |
64 |
0.04 |
| Makran1 |
0.2 |
17.2 |
1.4 |
0.01 |
| 2.6 - 66 Ma |
0.3 |
18.1 |
2.1 |
0.01 |
| m,n = 0.85,1.0 |
1 |
19.7 |
4.0 |
0.01 |
| t >= 25°C |
4 |
20.3 |
5.1 |
0.01 |
|
=0.168 |
20 |
20.4 |
5.4 |
0.01 |
| Makran2 |
0.2 |
14.4 |
0.9 |
0.06 |
| 2.6 - 66 Ma |
0.3 |
15.4 |
1.3 |
0.06 |
| m,n = 0.85,0.95 |
1 |
17.8 |
2.5 |
0.06 |
| t >= 25°C |
4 |
17.5 |
3.2 |
0.06 |
|
=0.126 |
20 |
17.7 |
3.4 |
0.06 |
| "SuluSea" |
0.2 |
12.3 |
0.55 |
0.01 |
| 0 - 23 Ma |
0.3 |
13.9 |
1.1 |
0.01 |
| m,n = 0.9,0.8 |
1 |
17.4 |
4.6 |
0.01 |
| t >= 25°C |
4 |
19.0 |
8.9 |
0.01 |
|
=0.163 |
20 |
19.5 |
11.0 |
0.01 |
| Oklahoma |
0.2 |
31.4 |
44 |
0.04 |
| 254-323 Ma |
0.3 |
31.5 |
46 |
0.04 |
| m,n = 0.85,1.0 |
1 |
31.6 |
48 |
0.04 |
| t >= 25°C |
4 |
31.6 |
49 |
0.05 |
|
=0.130 |
20 |
31.6 |
49 |
0.05 |
| Maracaibo |
0.2 |
18.4 |
2.4 |
0.03 |
| 2.6-66 Ma |
0.3 |
19.1 |
3.1 |
0.03 |
| m,n = 0.9,0.9 |
1 |
20.0 |
4.5 |
0.03 |
| t >= 25°C |
4 |
20.3 |
5.2 |
0.03 |
|
= 0.212 |
20 |
20.4 |
5.3 |
0.03 |
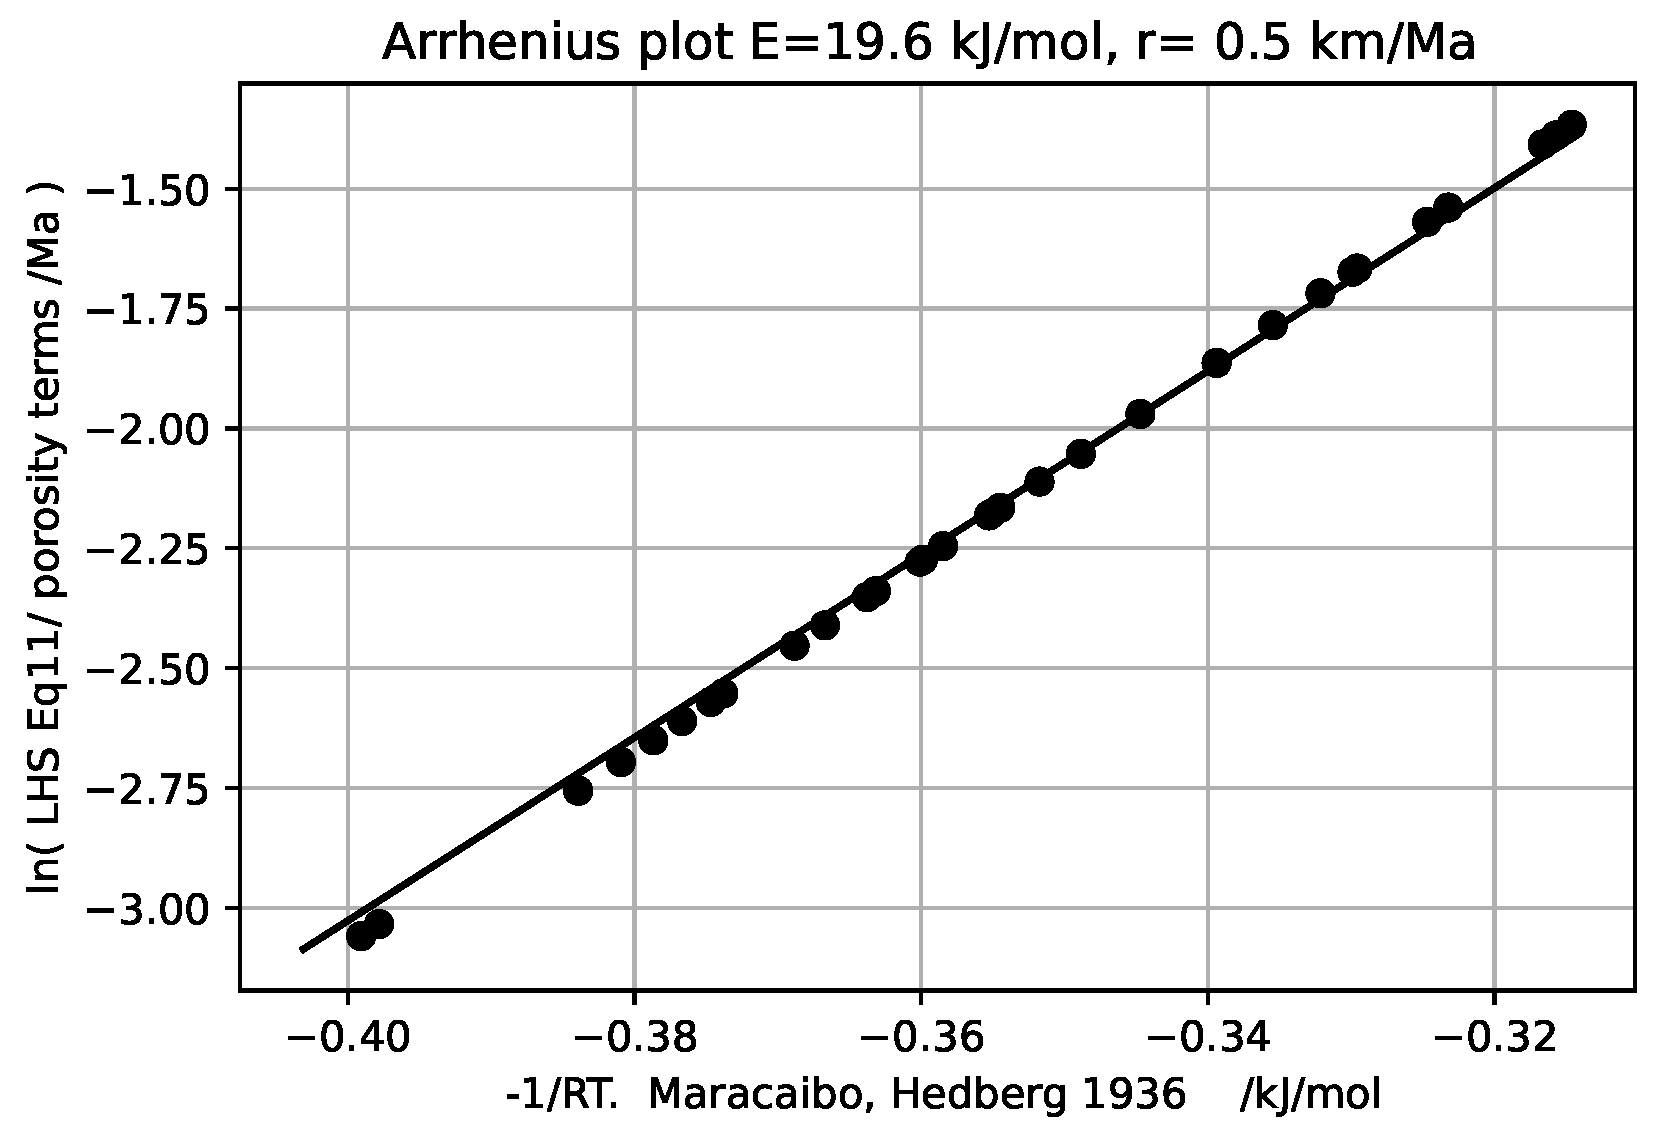
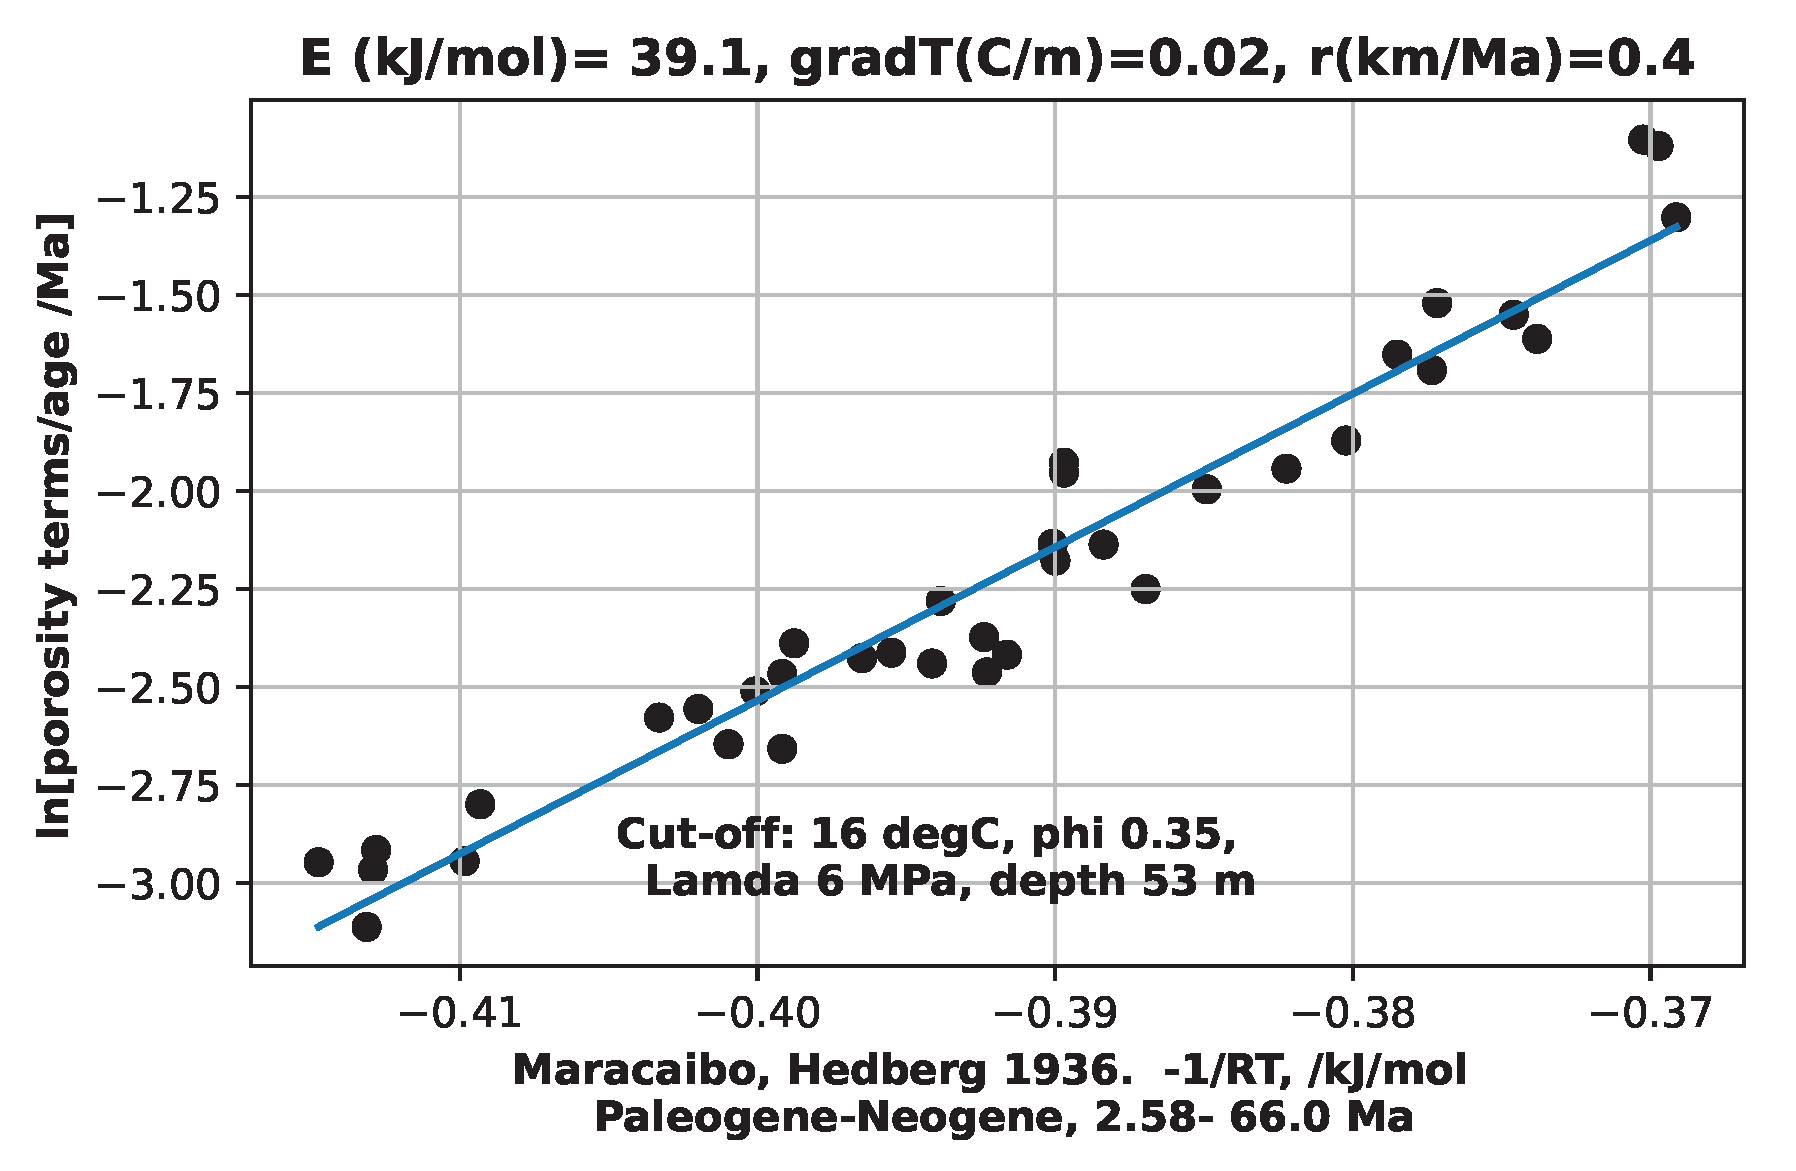
As contrasting examples which have abundant data, the Arrhenius plot is given for the Maracaibo well[
9],
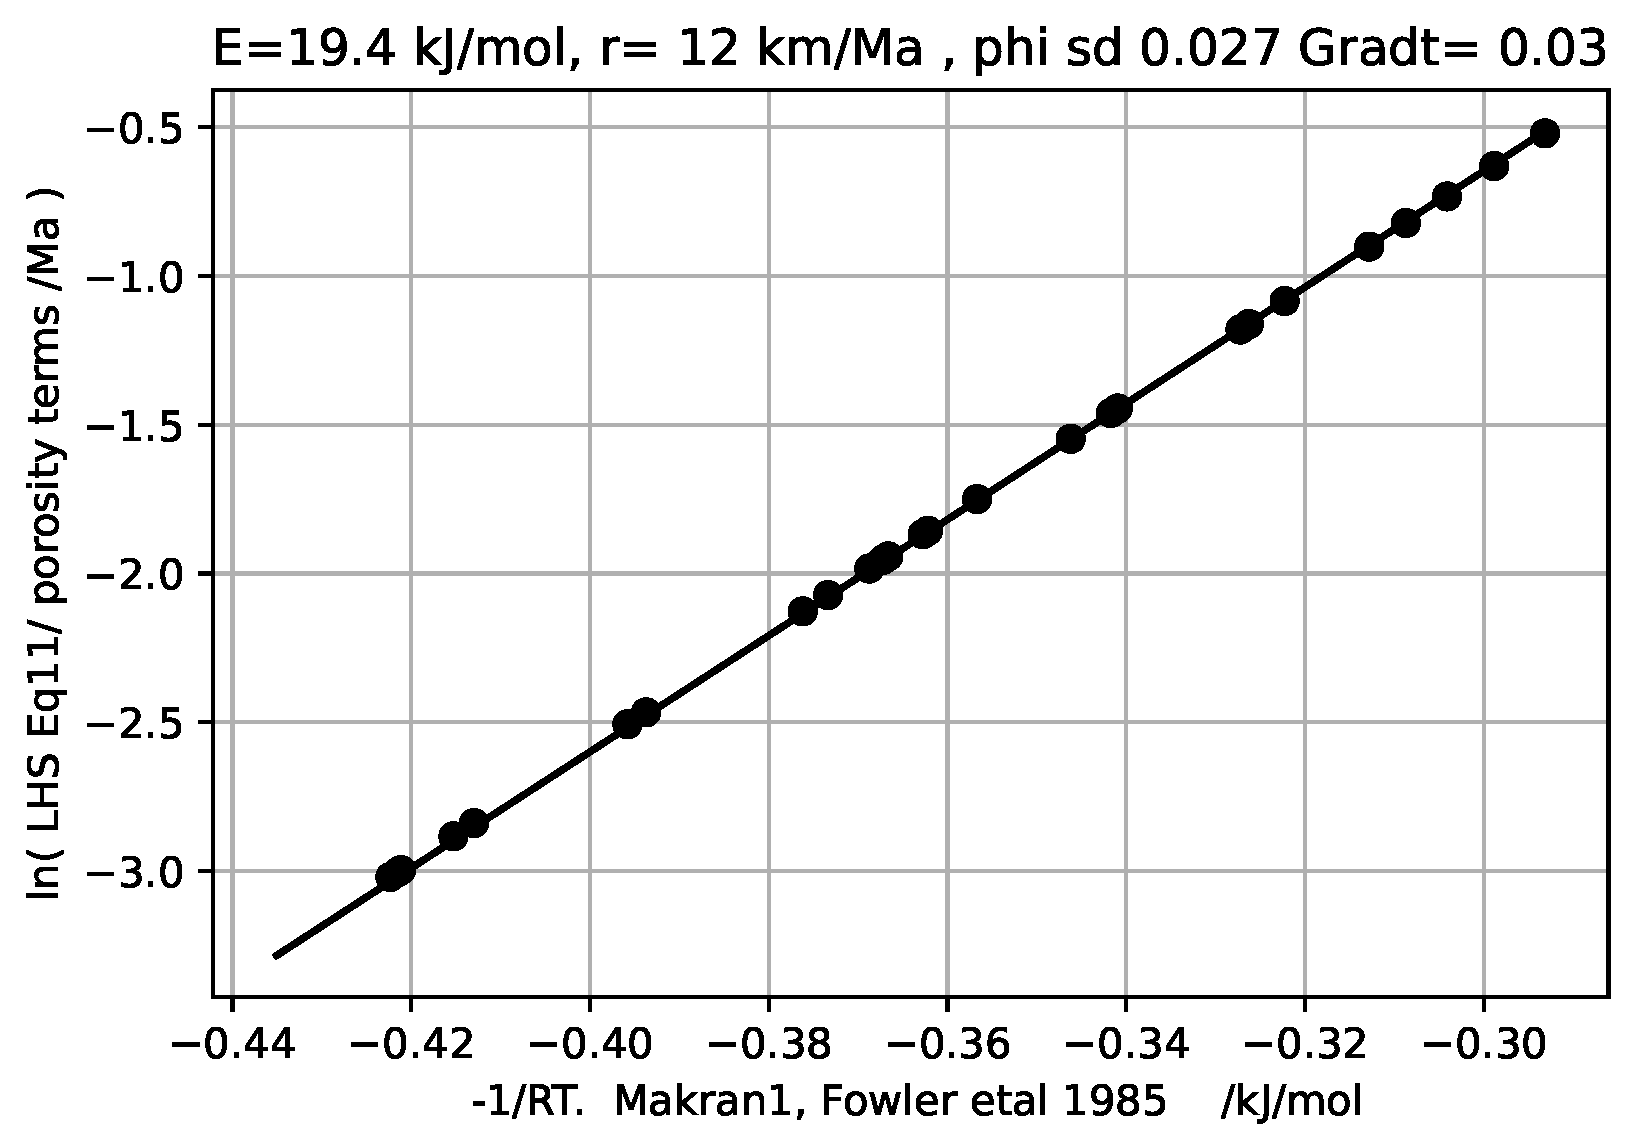
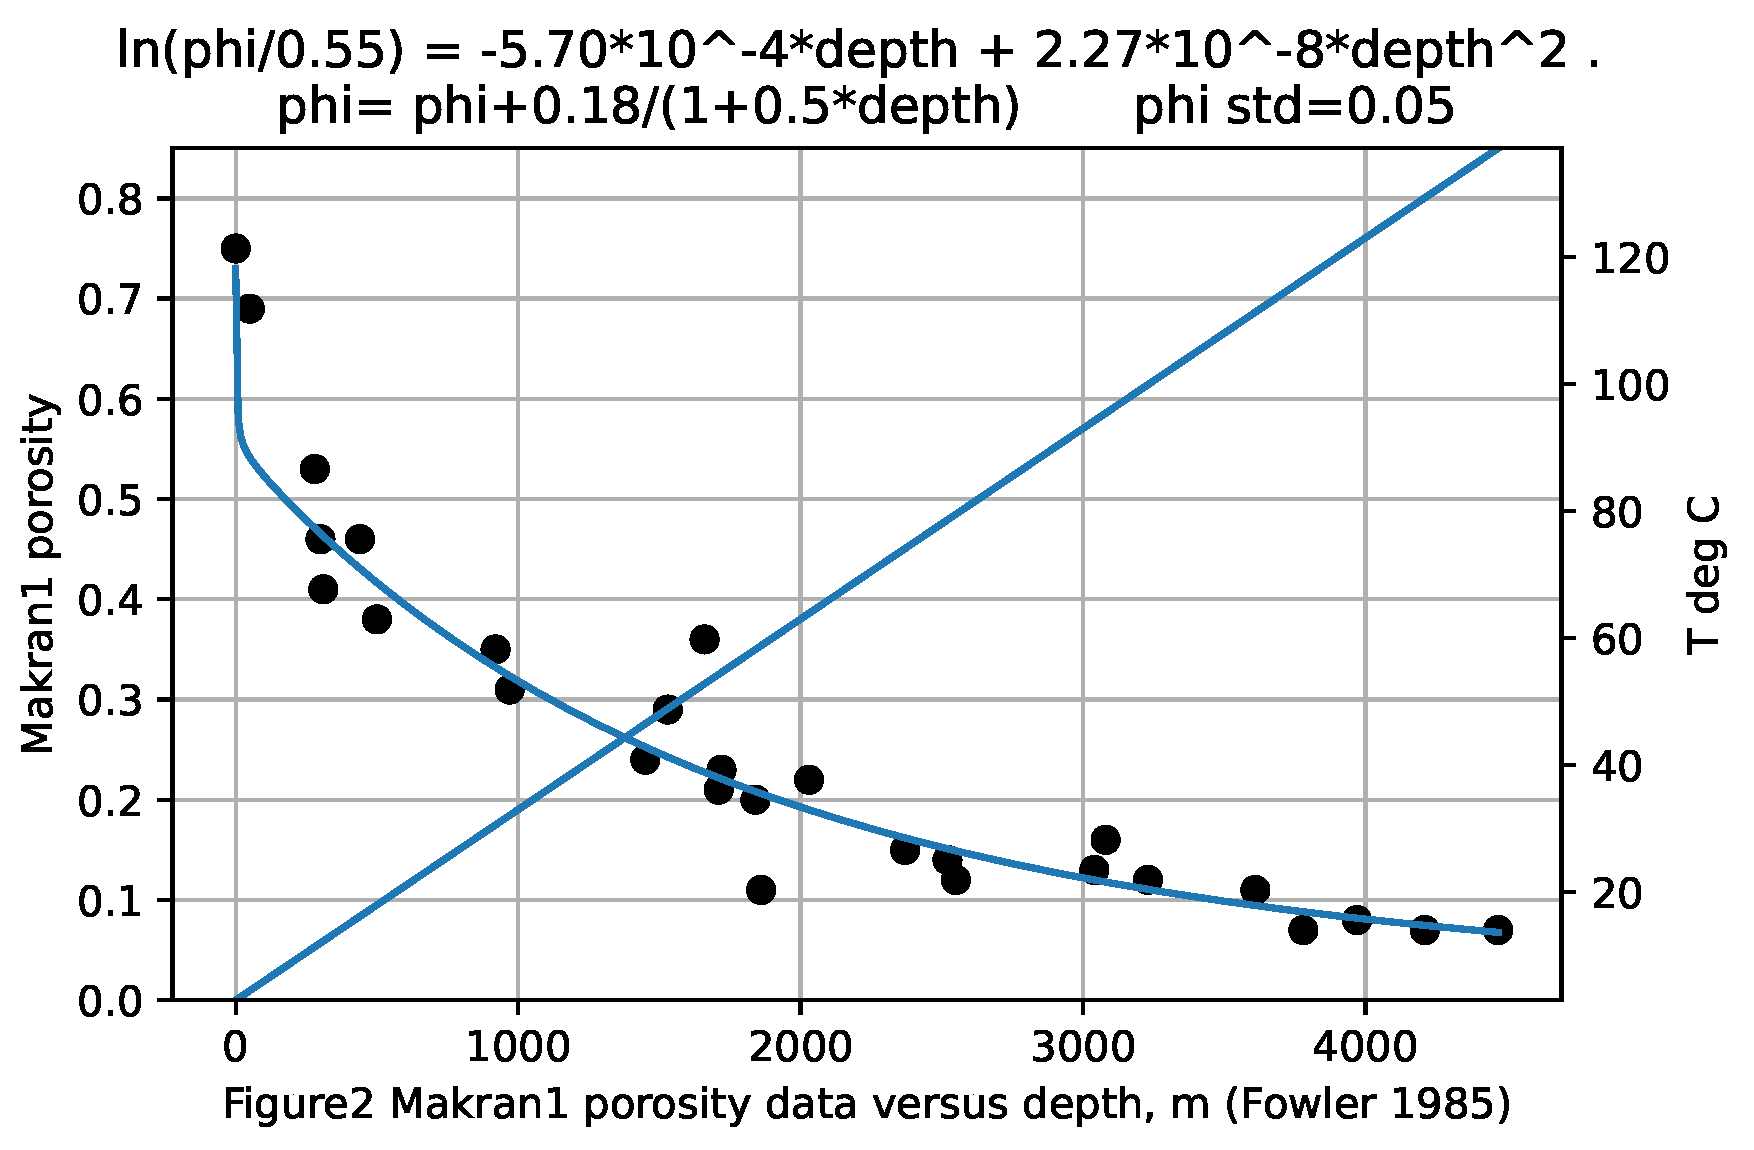
Figure 1, and the Macran1 section [
6],
Figure 2. A low solids deposition rate of 0.5 km per million years is used. Figures for all six sections were previously given [
1] for very high, >20 km/Ma, deposition rates such that
is maximum.
The Maracaibo porosities were measured on hand samples. Porosities were fitted with a straight line. The line omitted large near-surface porosities and made deeper porosities seem to go to zero too quickly, as was recognized[
9]. Experimental porosities above about 36% were left out. The lake pH is slightly less than 7.0.
The well was drilled in or near shallow lake Maracaibo in a tropical climate. In consrast,the Macran-1 data were derived from seismic data with the maximum porosity reported as 69%. The environment was deep cold ocean with pH 8.1.
This completes the forward model of deposition and compaction of these six shales. In conclusion, pressure solution of quartz can account for vertical compaction of shales quantitatively. Other examples may indicate carbonate or iron cements. The procedure is expected to work similarly for most shale sections, whether overpressured or not, if not strongly disturbed.
A check can be made to see how well the derived parameters m,n,A and E reproduce the known shale porosity profiles.
Equation (6) rearranges to
with all four fixed parameters on the right, along with the fitted porosities
, to give the estimated porosity at this depth on the left. The mean of the errors is zero percent for each well. The standard deviations are given in Table1. Values of A in Table 1 supercede values in [
1], which were wrong but did not affect conclusions.
The Macron 2 section, in the Macron accretionary prism, has reduced porosities which are
[
6] of the Macron 1 porosities in the nearby abyssal plain with similar sediment. This reduced porosity is thought due to greater horizontal stress. Usually the excess horizontal stress is not known. A quasi-equivalent vertical stress can be obtained as a multiplier, w, of the vertical stress,
. The proposal is that if
produces the Macron 1 porosities,
, then
produces the Macron2 porosities,
:
which gives
Using average porosities over the respective depth intervals 1 to 3.5 km gives w = 1.06 using the porosity curve fits, and w = 1.068 using the seismically inferred porosities. The infered quasi vertical stress is thus about 6.4% greater than to include the excess horizontal stress with the vertical. This procedure qualitatively bridges a gap between the effects of vertical and horizontal metamorphic stresses, ignoring anisotropy and timing factors.
Similar horizontal stress effects were thought to account for reduced porosities in the Oklahoma well [
8,
9]. There is no ’normal’ well for conparison in this case.
The Maracaibo location was thought to be free of excess horizontal stress[
9]. This lake is fed by tropical rivers, with lake water having pH 7 or slightly lower, as compared to ocean waters of pH 8.1. Solubilities and rates are sensitive to pH [
2,
3], Experiments to determine whether reactions are endo- or exothermic could be made.
A three dimensional model is required to fully understand tectonically active areas.
4. Discussion
The present model brings up unanswered questions, which are listed as potential experimental problems.
1- Is more than one type of mineral solution occuring among different wells or in each well.
2- Variations of stress, both positive and negative, lead to increased solubility of shale minerals[2]. Are local vertical and horizonal stresses the only drivers. What contributions do quakes and crustal movements make. A linked question is, what is the minimum time that a change in stress can occur and produce porosity reduction.
3. How small can effective stresses be, and how small can a time increment be to produce pressure solution in shales.
The successful forward modeling here of a wide range of deposition rates for each shale section indicates that depositional rate for shales is of secondary importance. Temperature, stress, and stress variations are more important.
These questions highlight that tidal forces are possibly part of the proposed pressure solution mechanism and were initially ignored here. To state the problem again, the vertical force per unit area of supporting grains,
, is given by the ratio of the vertical force per unit area,
, divided by the area of the supporting grains,
:
Here the vertical force,
, is the difference between the overburden,
S, and the pore fluid pressure,
p. Tidal forces are part of
and should be separated as the time derivative is intrinsically never zero, while the part of
due to Earth’s gravitational field alone,
is essentially independent of time. Separating the tidal forces as
,
or
Here
is the vertical stress toward the center of the earth, without Moon and Earth tidal pulls, and
is the scalar vertical component of these tidal forces which vary continuously. The latter should realistically be replaced by the vector pulls of Moon and Sun on every part of a section, these vectors rotating 360 degrees every lunar or solar day. Taking the time partial derivative with this in mind gives
The quote marks indicate this scalar term stands in for the three-dimensional vector derivative. If the shales are primarily elastic over small macro-sized distances but have imperfactions at sites where a few molecular diameters of extension collect, these sites might be a place to consider for pressure solution. Elaborating further, the ’equator’ of the Moon - Earth orbit can have a large vertical force component near the Moon-Earth axis, but as seen from the Moon, horizontal stretching forces toward the Earth’s edges predominate, especially toward the ’poles’. This difference might be experimentally observable. Mutatis mutandis for the Sun. Additionally, remembering that the Oklahoma well is Pennsylvanian age, the Moon was substantially closer to the Earth several hundred million years ago - with Oklahoma near the equator - and gravitational stretching forces vary inversly as the cube of the distance.
5. Future Work
The compaction problem is now mature enough to allow a more complete complete description via a unified model. Thus far, and separately, quantitative mechanisms for shale compaction by pressure solution, and for expulsion of pore fluids [
10], are known. Further elucidation and constraints of the time evolution of shales can be attained by modelling the simultaneous (1) deposition of a shale, (2) heat conduction up through the new sediments, (3) compaction by pressure solution, and (4) expulsion of pore fluids by a porosity and temperature dependent Darcy’s law. A starting point would be to continue deposition on top of a section such as Macron 1 and assuming the temperature gradient at the base of Macron 1 stays constant with fixed 3 deg C at the rising ocean bottom. During sedimentation there would always be a thickness of un-cemented and highly porous sediments at the growing top of the section,
Figure 3,
with low thermal diffusivity [
11], resulting in a higher (barring convection) geothermal gradient there than at greater depths.
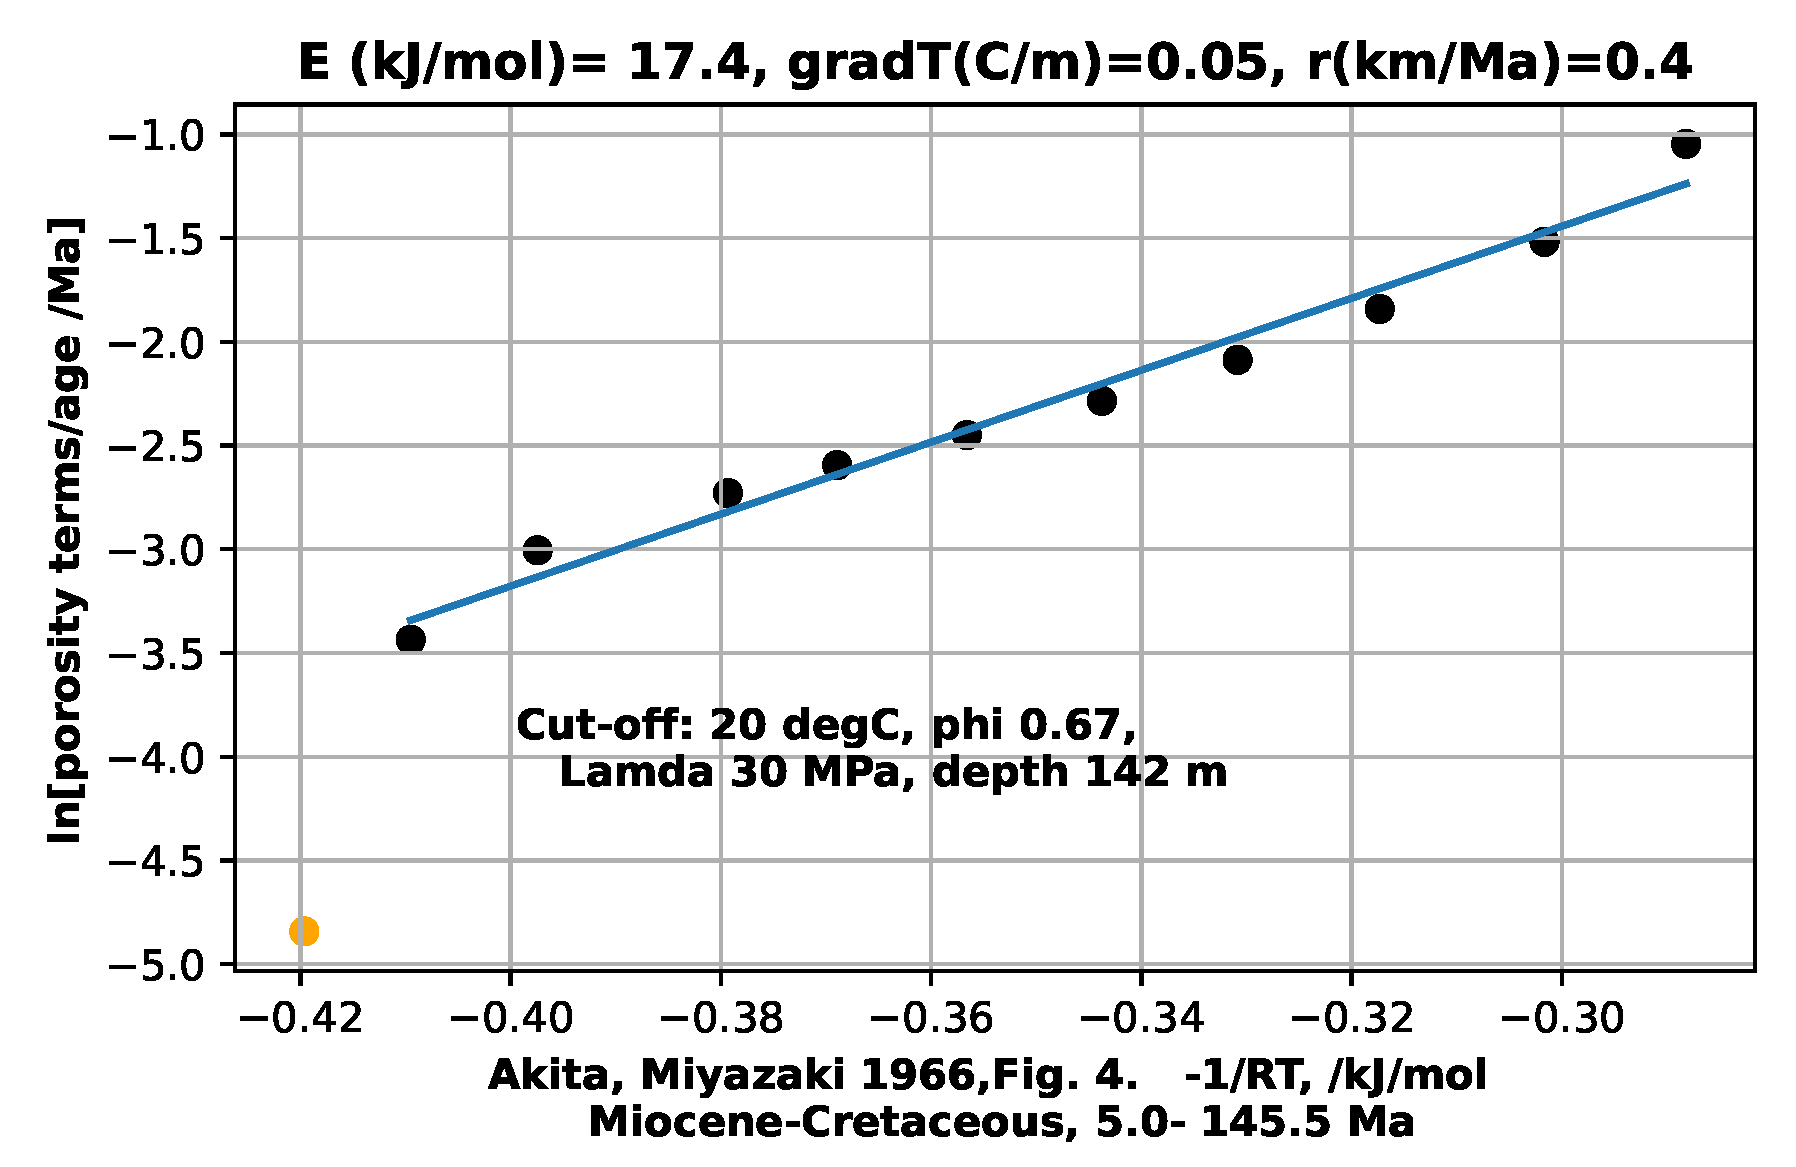
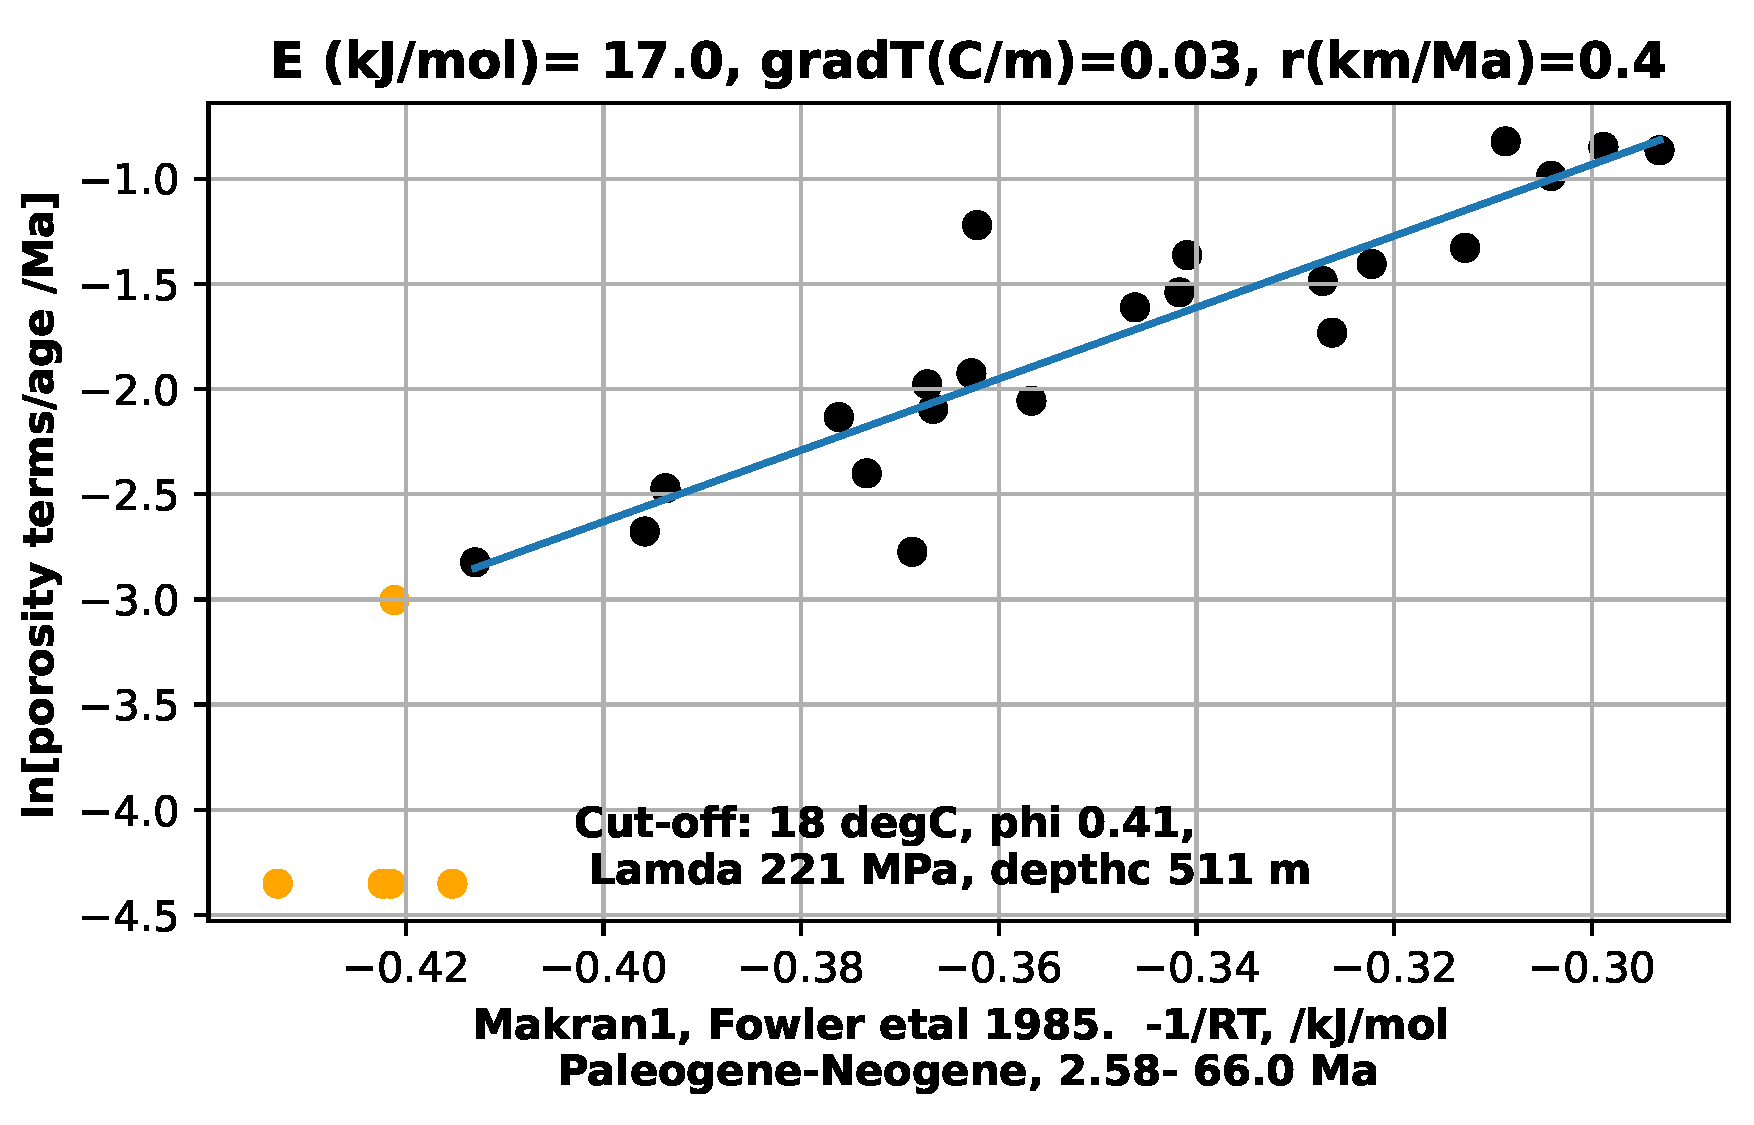
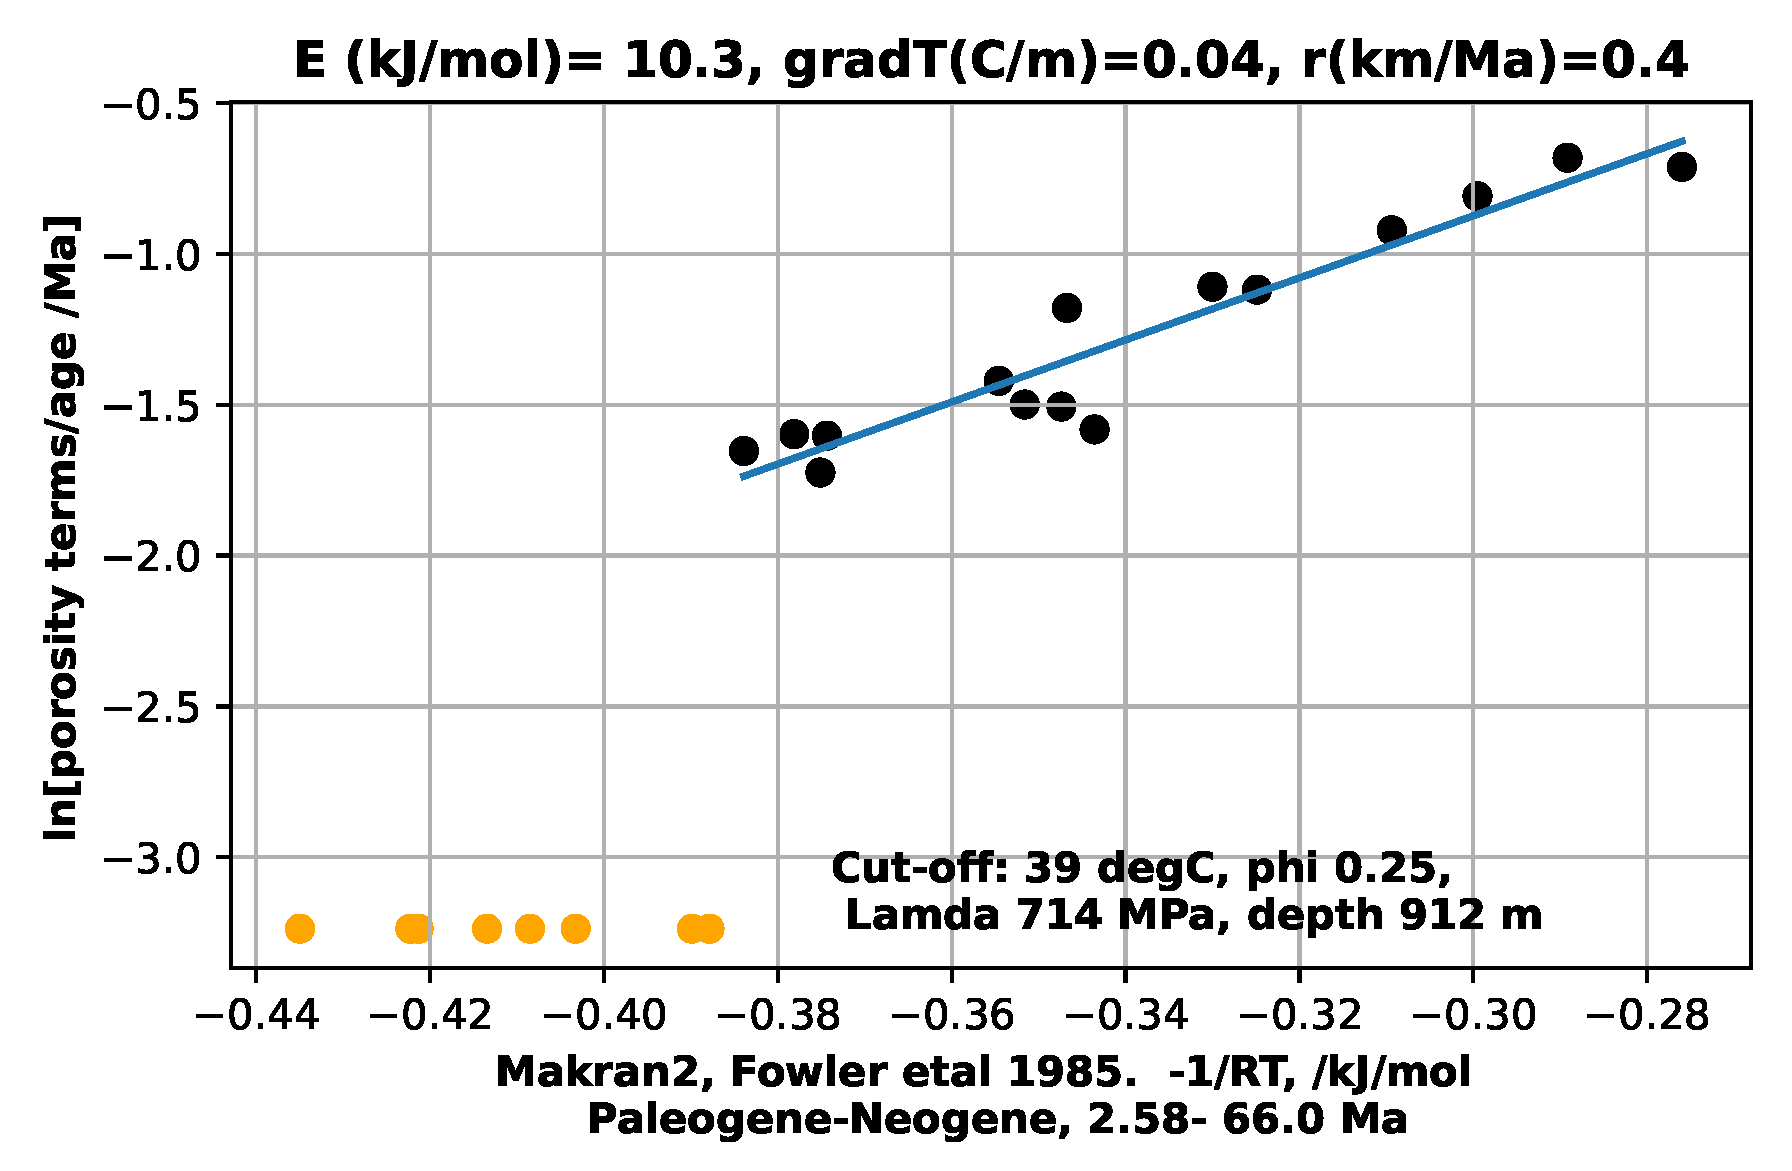
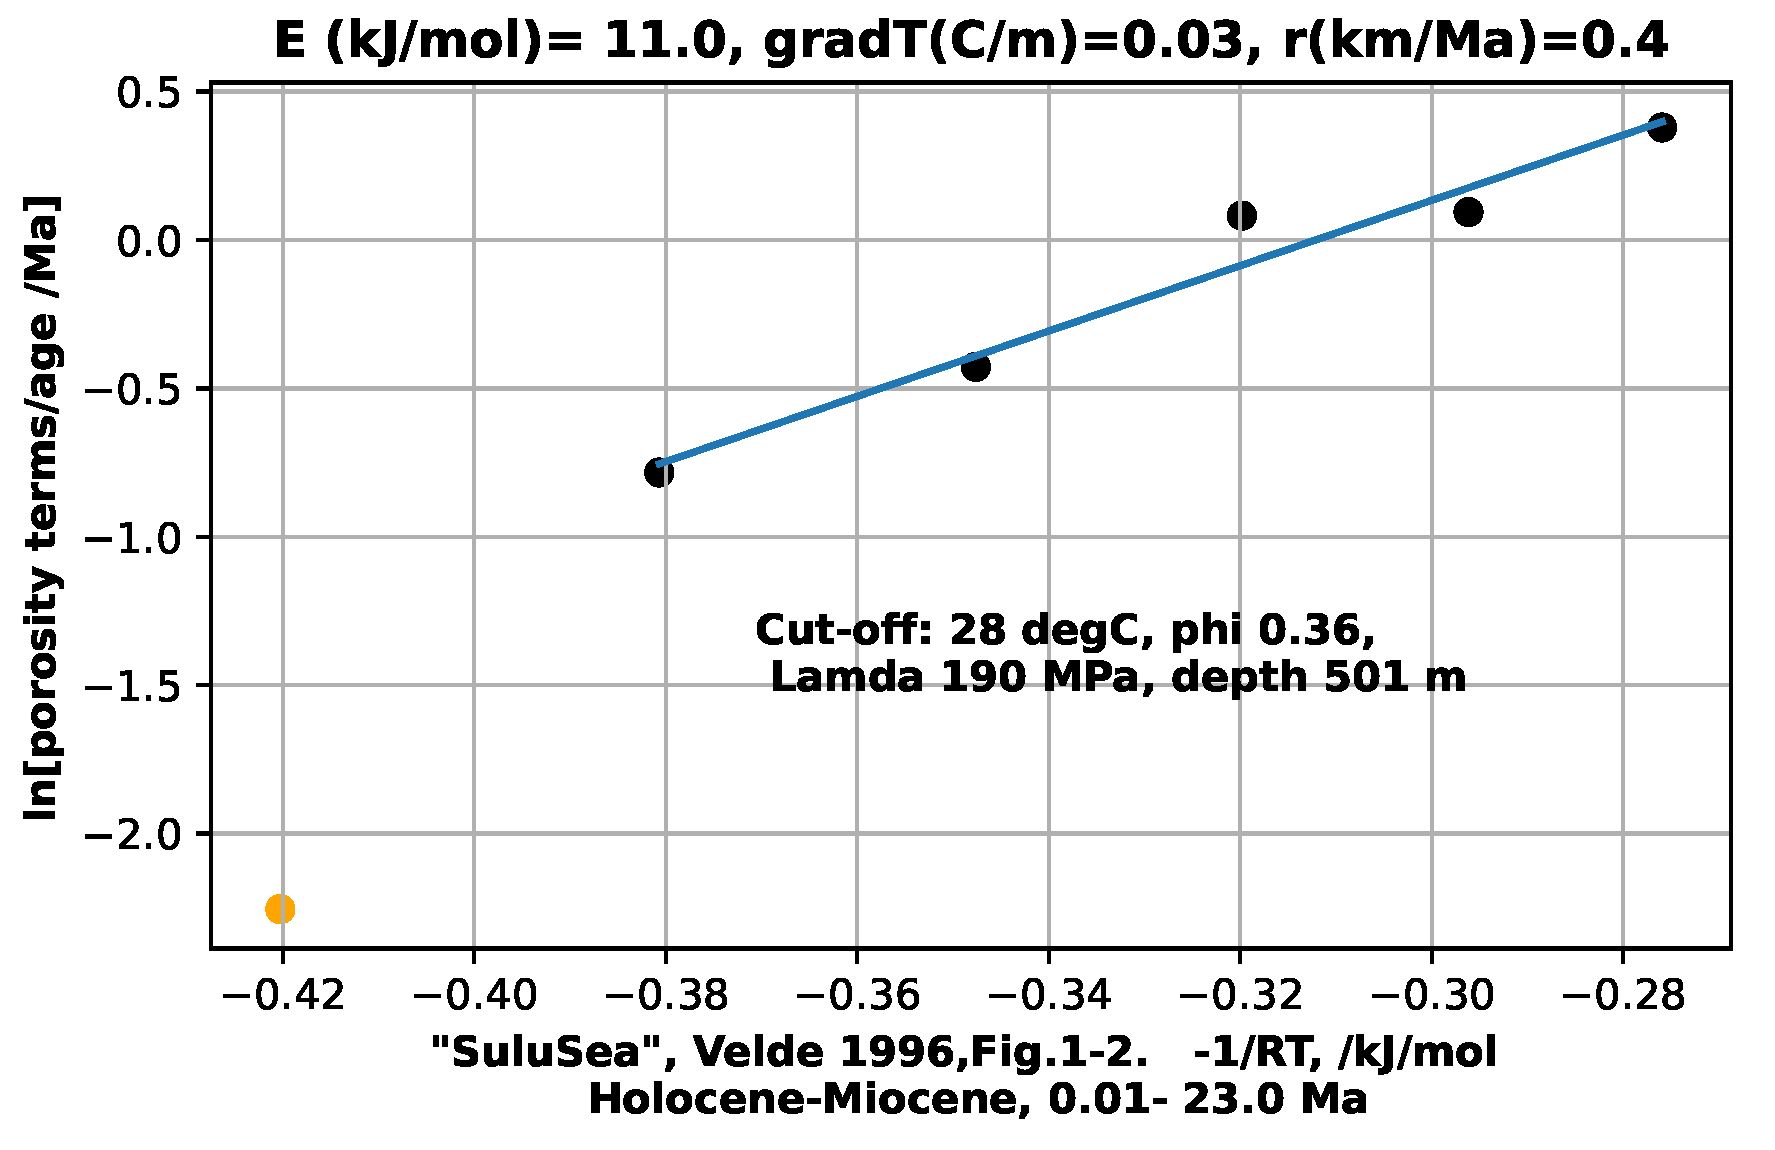
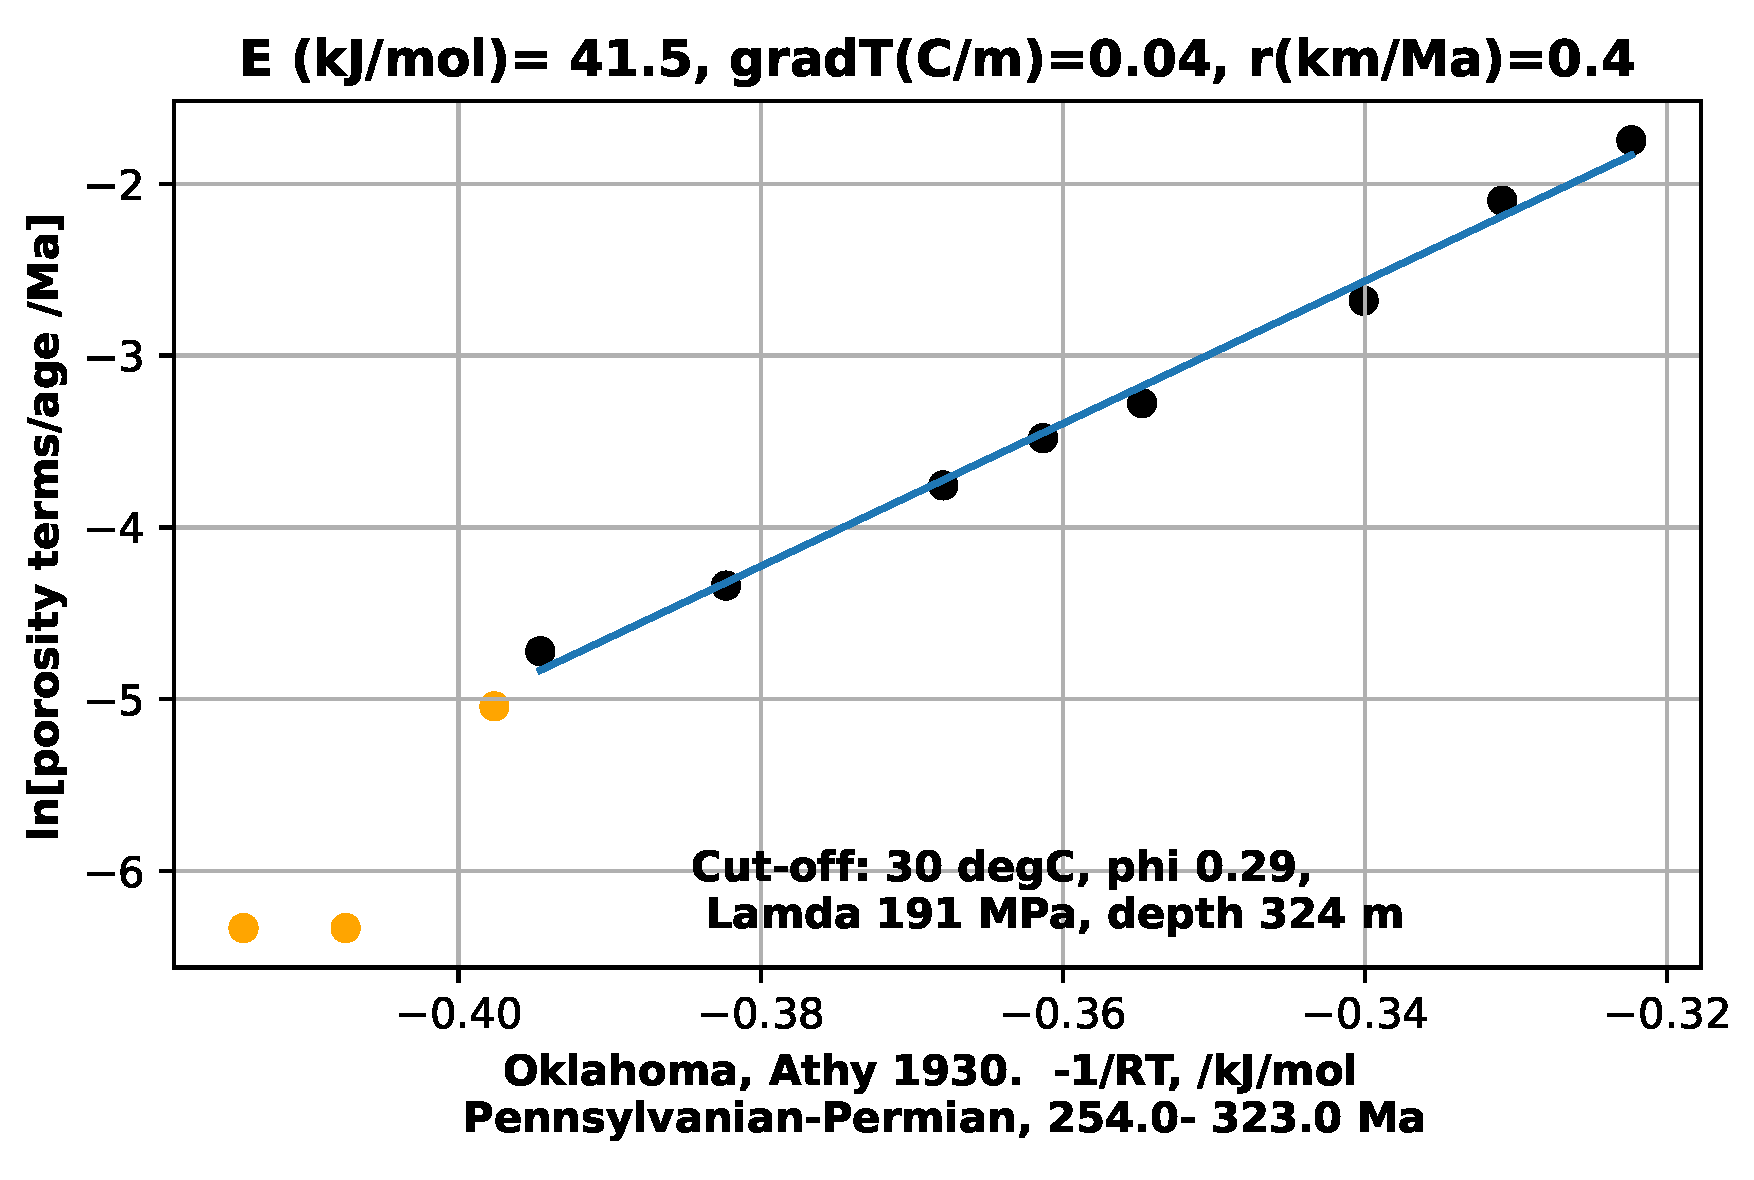
A problem with constructing such a depositional model occurs when transitioning from newly-deposited, uncemented sediments to sediments which are undergoing cementation. The combination of temperature, Lamda, composition and time for this to be expressed in the sediment porosity is not known. Also, the current model can be criticised for treating the sediments in a section as of uniform composition. Actual sediments change in composition and grain morphology rapidly with depth as sediment sources and volumes vary over time. This is seen below for Mactan1, Macran2, and Maracaibo. The other examples were read from trend lines through scattered data. The estimated mud-to-sediment transition cut-off is arbitrarily, Figure 4, Figure 5, Figure 6, Figure 7, Figure 8 and Figure 9
with the corresponding Lambda and depth also posted on the figures. The cut-off parameters in these last 6 figures are different from those chosen previously, so input and output parameters are different. The shallow, apparently unconsolidated data points at the left of the figures are in yellow, and terminated at the bottom of the y-axis.
Some of the six available porosity data sets derive from selected hand samples, and some were seismically derived, the latter representing massive units of mixed lithologies. Uniformity of model input data methodology is therefore lacking. Hand collected samples are probably selected as comparatively smooth and less friable. Original sources don’t give temperatures, sample compositions, nor indicate possible unconformaties. The present study has been able to proceed only by implicitly assuming an ensemble average of properties for each given section. The proposed foreward depositional model will have to assume such a limited view.
References
- Smith, J.E.; Smith-Rowland, E.M. Proposed method for shale compaction kinetics. Geosciences 2021, 11, 137. [Google Scholar] [CrossRef]
- Miyakawa, K.; Kawabe, I. Pressure solution of quartz aggregates under low effective stress(0.42-0.61 MPa) at 25-45 deg C.
- Palandri, J,L,Kharaka,Y.K. A compilation of rate parameters of water-mineral interaction kinetics for application to geochemical modeling. U. S. Geological Survey Open File Report 2004-1068.
- Manger, G.E. Porosity and bulk density of sedimentary rocks. Contributions to geochemistry. U. S. Geological Survey Bulletin 1144-E, 1963.
- <i>Miyazaki, H. Gravitational Compaction of the Neogene Muddy Sediments in Akita Oil Fields, Northeast Japan. J. of Geosciences Osaka City U. 1986, 9, 1–23. [Google Scholar]
- Fowler, S.R.; White, R.S.; Louden, K.E. Sediment dewatering in the Makran accretionary prism. Earth Planet. Sci. Lett. 1985, 75, 427–438. [Google Scholar] [CrossRef]
- Velde, B. Compaction trends of clay-rich deep sea sediments. Mar. Geol. 1996, 133, 193–201. [Google Scholar] [CrossRef]
- Athy, L.F. Density, porosity, and compaction of sedimentary rocks. Am. Assoc. Pet. Geol. Bull. 1930, 14, 1–24. [Google Scholar]
- Hedberg, H.D. Gravitational compaction of clays and shales. Am. J. Sci. 1936, 31, 241–287. [Google Scholar] [CrossRef]
- Smith, J.E. The dynamics of shale compaction and evolution of pore-fluid pressures. Int. Assoc. Math. Geol. 1971, 33, 239–263. [Google Scholar] [CrossRef]
- Fuchs, S., Förster, H. J., Norden, B., Balling, N., Miele, R., Heckenbach, E., Förster, A. The thermal diffusivity of sedimentary rocks: Empirical validation of a physically based αφ relation. Journal of Geophysical Research: Solid Earth 2021, 126(3), 1–14.
|
Disclaimer/Publisher’s Note: The statements, opinions and data contained in all publications are solely those of the individual author(s) and contributor(s) and not of MDPI and/or the editor(s). MDPI and/or the editor(s) disclaim responsibility for any injury to people or property resulting from any ideas, methods, instructions or products referred to in the content. |
© 2024 by the authors. Licensee MDPI, Basel, Switzerland. This article is an open access article distributed under the terms and conditions of the Creative Commons Attribution (CC BY) license (http://creativecommons.org/licenses/by/4.0/).
