1. Introduction
Edge detection is an important process in techniques, such as image analysis and processing, computer vision and pattern recognition, with the aim of detecting information about the shape of objects in an image [
1,
2,
3,
4,
5]. In the real world, there are four situations in which edges can be formed in an image: (1) discontinuities in depth, (2) discontinuities in surface orientation, (3) different materials of objects in an image and (4) different lighting in a scene. Edges often locate in an image where there are significant changes in grey scale, colour and texture [
6], so the edges of an object can be determined by detecting gradients. Commonly used algorithms for edge detection include Roberts, Prewitt, Sobel, Laplace and Canny. These detection methods are easy to implement, demonstrate many advantages when detecting images with relatively simple backgrounds and are widely used in many industries [
7,
8]. However, when dealing with images with complex backgrounds [
9], they are not sufficient recovering much high-level semantic information, which means they have some shortcomings.
The wavelet transform is a time-frequency domain analysis method that has the ability to characterize the local features of a signal. The singularities of the wavelet-transformed signal are closely related to the location where the signal apparently changes. A. Tjirkallis [
10] applied the wavelet transform modulus maxima method to image processing, which determined the damage of the object caused by external forces or environmental conditions in the image. Xiangxing Kong [
11] used this method to successfully denoise tunnel monitoring, providing a basis for tunnel health diagnosis; Yunting Gu [
12] used an improved wavelet transform mode maxima method to subdivide and fuse two edges obtaining the clearer and better connected edge information; and Mohammad Barr [
13] embedded a 1-bit watermark in wavelet transform mode maxima to achieve rotation, scaling and panning of the image, improving the robustness of the watermarking technique. Wensi Ding [
14] used wavelet transform modulus maxima based on Bayesian threshold estimation to effectively remove noise in MEMS. In an article by Shugar D H. [
15], he mentioned a huge disaster caused by a melting glacier, which greatly affected the livelihood of the local people. By using high-resolution images provided by commercial and government satellite constellations, the analysis of the disaster can be completed in a short period of time when manpower and technology are available, and if changes in glacier melting or mountain sliding are detected early through the monitoring of remote sensing images at an early stage, and timely warnings are given, unnecessary damage can likely be avoided. This demonstrates the importance of a range of image technologies such as edge detection in the field of remote sensing.
In the process of applying wavelet transform modulus maxima, thresholds need to be set to remove pseudo-edges in gradient images, but manual setting requires repeated debugging and is not efficient. OTSU method can use the maximum inter-class variance of the image to automatically calculate the threshold and improve the debugging efficiency. Using the OTSU, Ta Yang Goh [
16] carried out threshold segmentation on the real image data and predicted the segmentation results based on the Monte Carlo statistical method; Kishore Dutta [
17] used OTSU to segment plant images to discriminate between healthy leaves, unhealthy leaves and other backgrounds, and could identify the infected parts of leaves; Nidhi Gupta [
18] used OTSU to pre-process and segment brain MR images and extracted many important features from the segmented images; Assma Azeroual [
19] used OTSU to work out the FSW extrema coefficients and obtain the edges of the image by connecting the edge points using the predicted edges; and Noorhan M Sobhy [
20] used OTSU and watershed marker-controlled technique to distinguish between single cells and groups of cells. Muhuri A. [
21] used the OTSU method thresholding difference images to obtain a map of snow changes in the Indian Himalayan region, which sensitively detected snow changes and successfully distinguished snow-covered areas from unchanged snow-free forest areas, and which performed consistently and effectively in the validation of the results. Henley C. [
22], in solving the problem of imaging behind occluders for novel NLOS imaging problem, used either OTSU or manually adjusted thresholding methods to segment the image into illuminated and shadowed regions, ultimately reconstructing hidden scenes embedded in fairly complex visible scenes without the use of sophisticated, dedicated equipment or significant calibration.
In the process of applying the wavelet transform modulus maxima method for edge detection, this paper convolves a convolution kernel generated by a two-dimensional Gaussian function firstly with the target image, which is also the CWT (continuous wavelet transform). Based on the convolution result, the modulus value and magnitude angle of the image pixel have been calculated, and then the modulus maxima in the image pixel are determined according to the magnitude angle. Then, the threshold value is calculated automatically using OTUS. Comparing the threshold value and the modulus maxima, we can remove the pseudo-edges of the image to obtain the final edge image. The edge detection results of Canny algorithm and Laplace algorithm are shown, and detection results of the three were evaluated with information entropy and SSIM as the evaluation indexes. The results demonstrate that the detection quality and detection efficiency of the algorithm in this paper have been improved. To fully illustrate this, images with more complex backgrounds were processed by the three algorithms. The results still show that the information entropy and SSIM of the wavelet transform modulus maxima method are the highest, which demonstrates that this algorithm has obvious advantages when processing images with more complex backgrounds.
2. Study Area and Data
2.1. Study Area
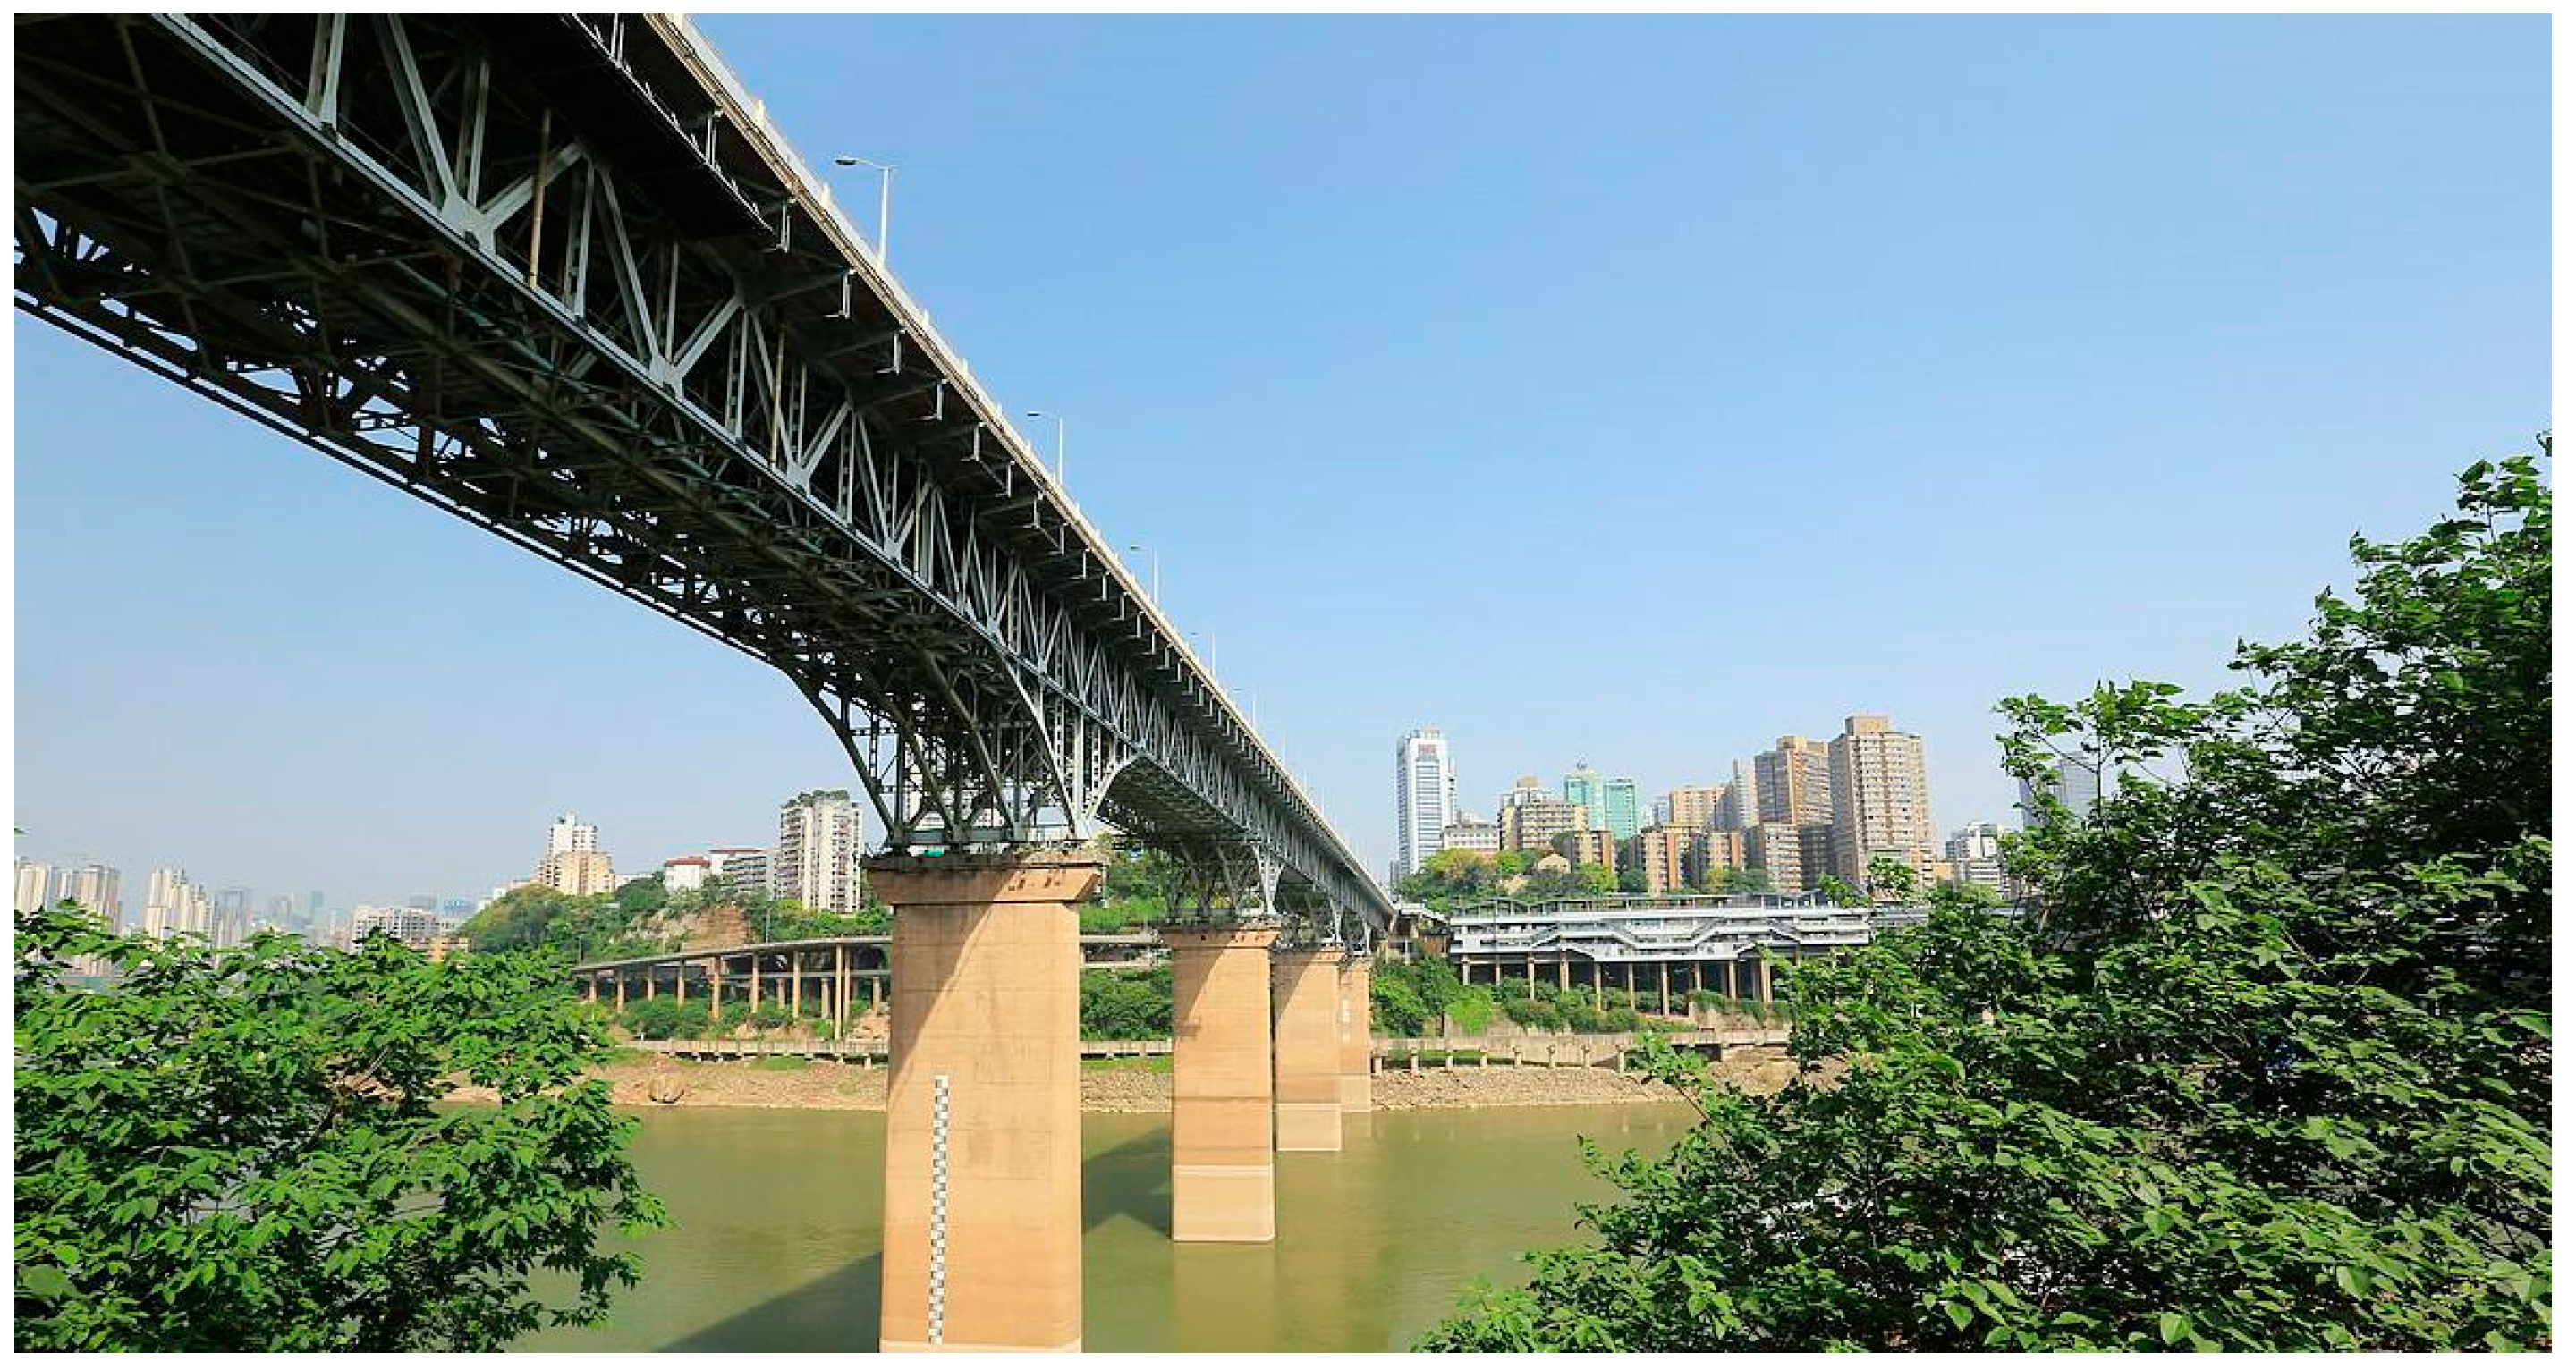
This paper selects the Jialing River Bridge in Chongqing, China, as the test area. The Jialing River Bridge is located between Shangqing Temple and Huaxin Street in Chongqing, China. The Jialing River Bridge is approximately 600 m long, with 5 main bridge holes, 384 m long, and 7 approach holes, 216.56 m long, with a deck width of 21.5 m, including 14 m for the carriageway and 3.75 m for the footpaths on each side. The bridge structure is a riveted steel truss double cantilever bridge, and the approach bridge is a reinforced concrete T-girder. The bridge was opened to traffic in the 1960s, putting an end to the history that residents on both sides of the river could only cross by ferry. In 2017, the bridge received a new round of renovations, bringing it back to life, and it is still an important travel route for local residents.
Figure 1 shows a partial image of the bridge taken from a side angle.
2.2. Data
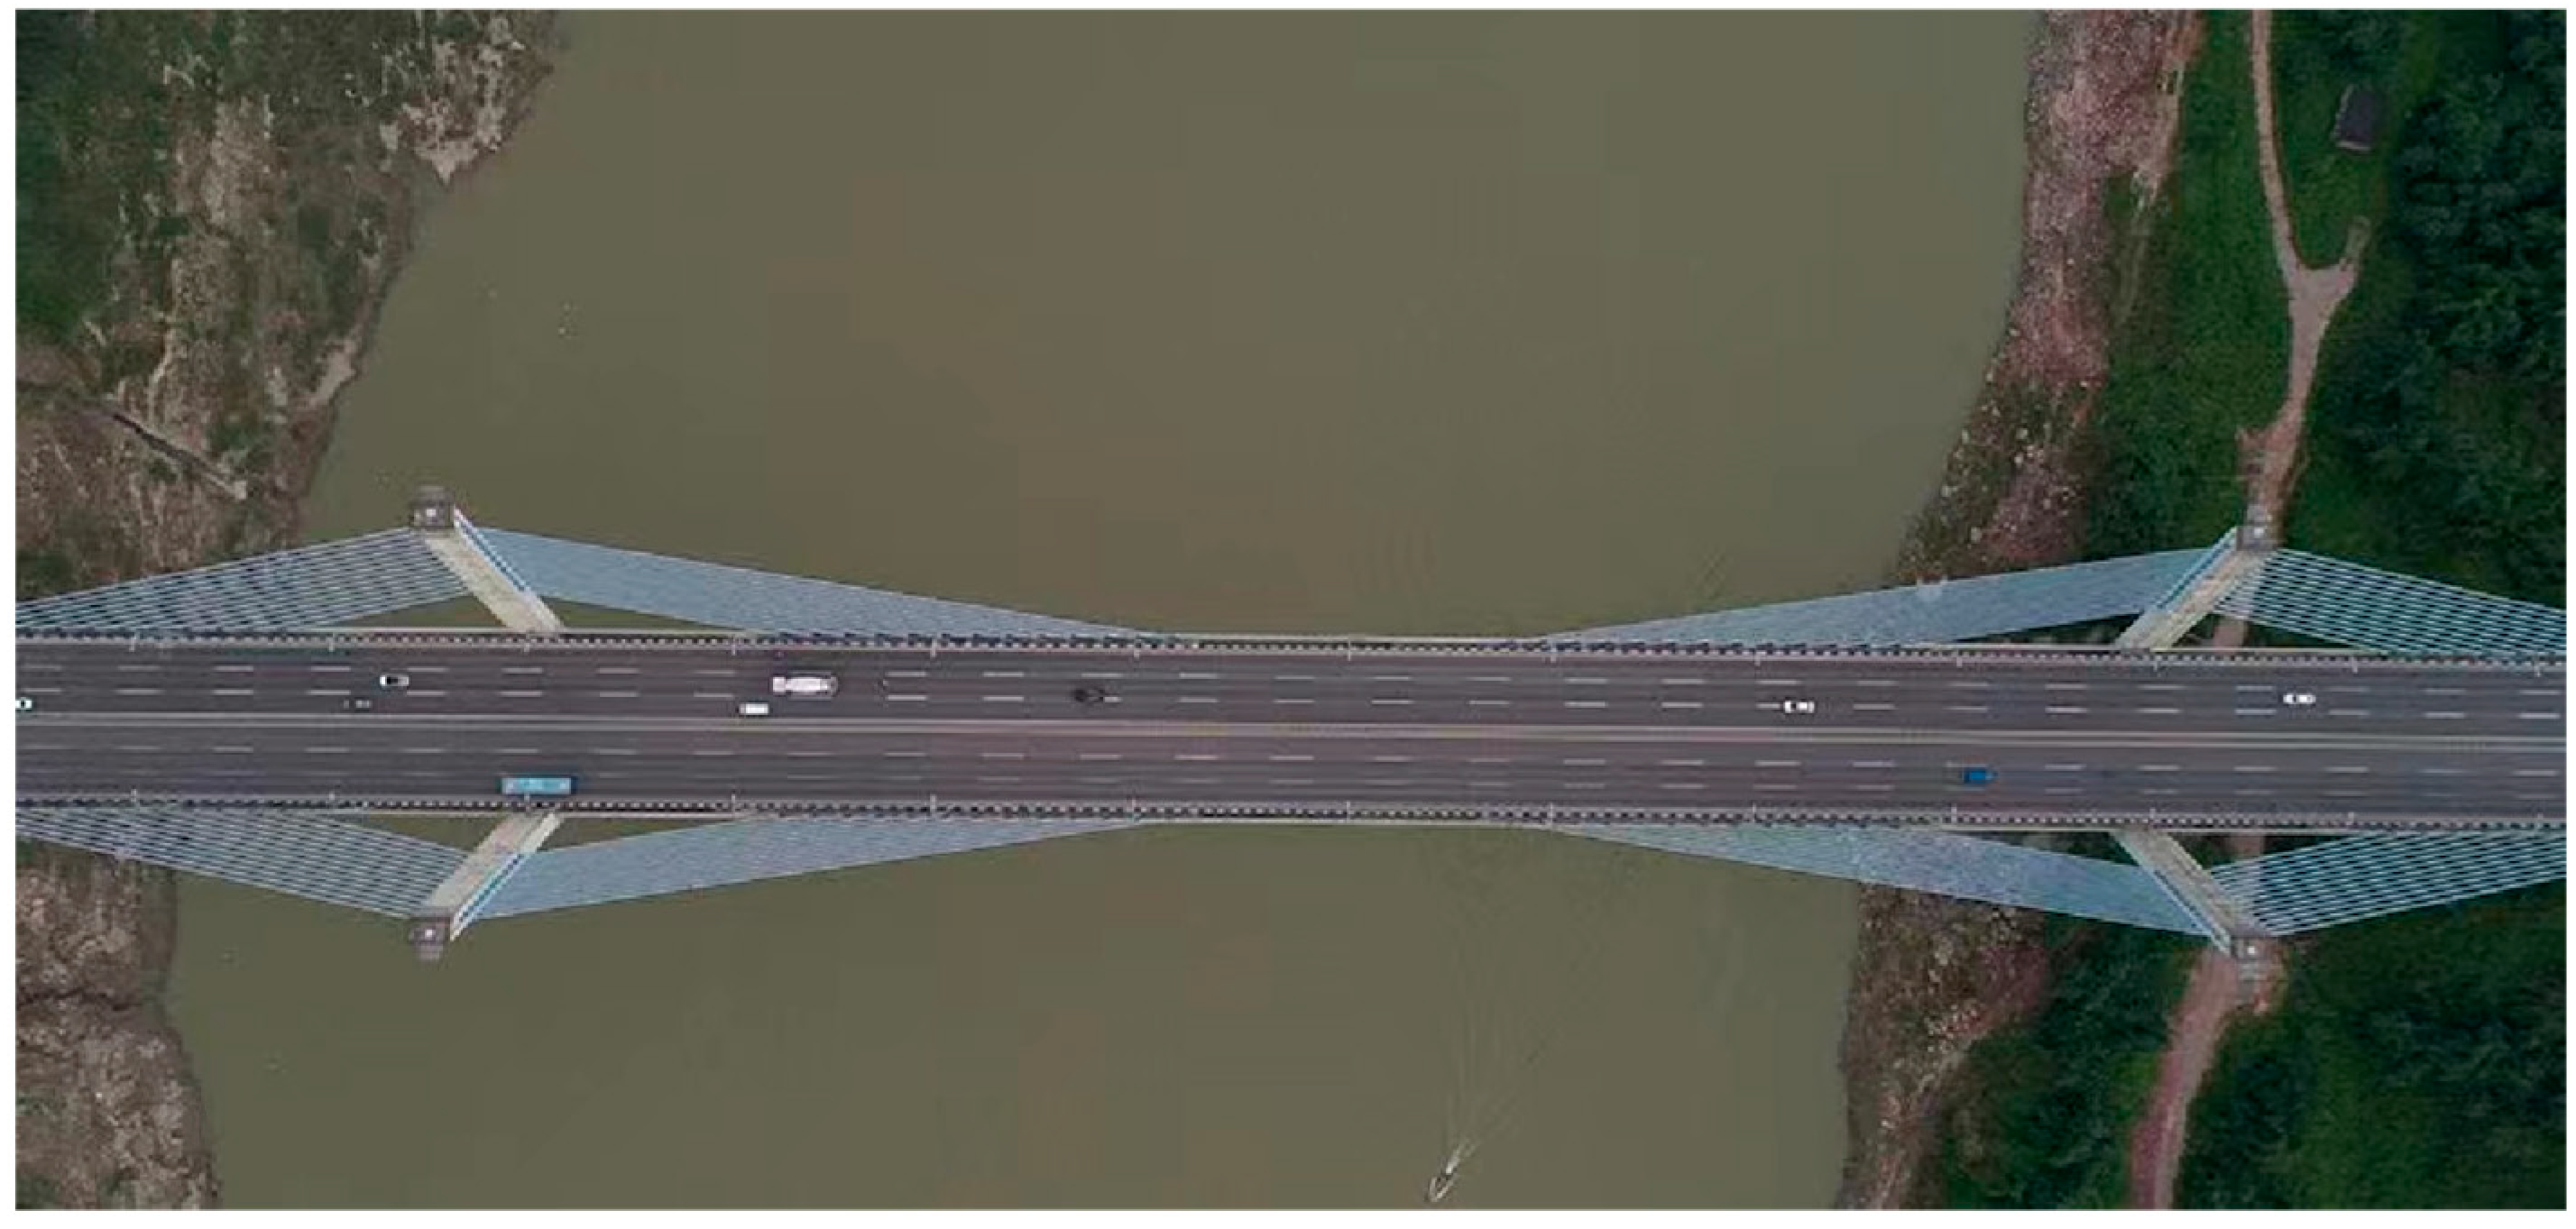
Figure 2 shows an overhead image of the Jialing River Bridge in Chongqing.
Figure 2 was chosen as the data for this study. The image was taken by an unmanned aerial vehicle (UAV) and appropriately shows the characteristics of the environment around the Jialing River Bridge. The content of the image is relatively feature-focused, with clear contours and a relatively homogeneous background in the middle part, which facilitates the removal of interference and is beneficial for subsequent edge detection and other related processing.
3. Materials and Methods
3.1. Theory
3.1.1. Wavelet Transform Modulus Maxima
The wavelet transform inherits and develops the idea of localization of the Fourier transform, while overcoming the disadvantages of the window size not varying with frequency. Its main feature is to highlight the characteristics of certain aspects of the signal after the transform, and to gradually refine the signal on multiple scales through the telescopic translation operation, eventually achieving time subdivision at high frequencies and frequency subdivision at low frequencies, which can automatically adapt to the requirements of time-frequency signal analysis and thus focus on arbitrary details of the signal [
23,
24,
25]. Therefore, wavelet transform has been successfully applied to many fields, especially the discrete numerical algorithm of wavelet transform, which is widely used in the study of many theoretical problems.
The modulus maximum Is defined as follow:
is the coefficient of the scale I of the wavelet transform of the signal
f(
t), and its modulus maximum is written as
,
l is the scale,
is the serial number of the modulus maximum on the scale l. The modulus maximums are located at the sudden changed points [
26]. The modulus maxima satisfies the 2 conditions in Equation (1).
If there is the equation must be satisfied as well; and if there is , the equation must be satisfied as well.
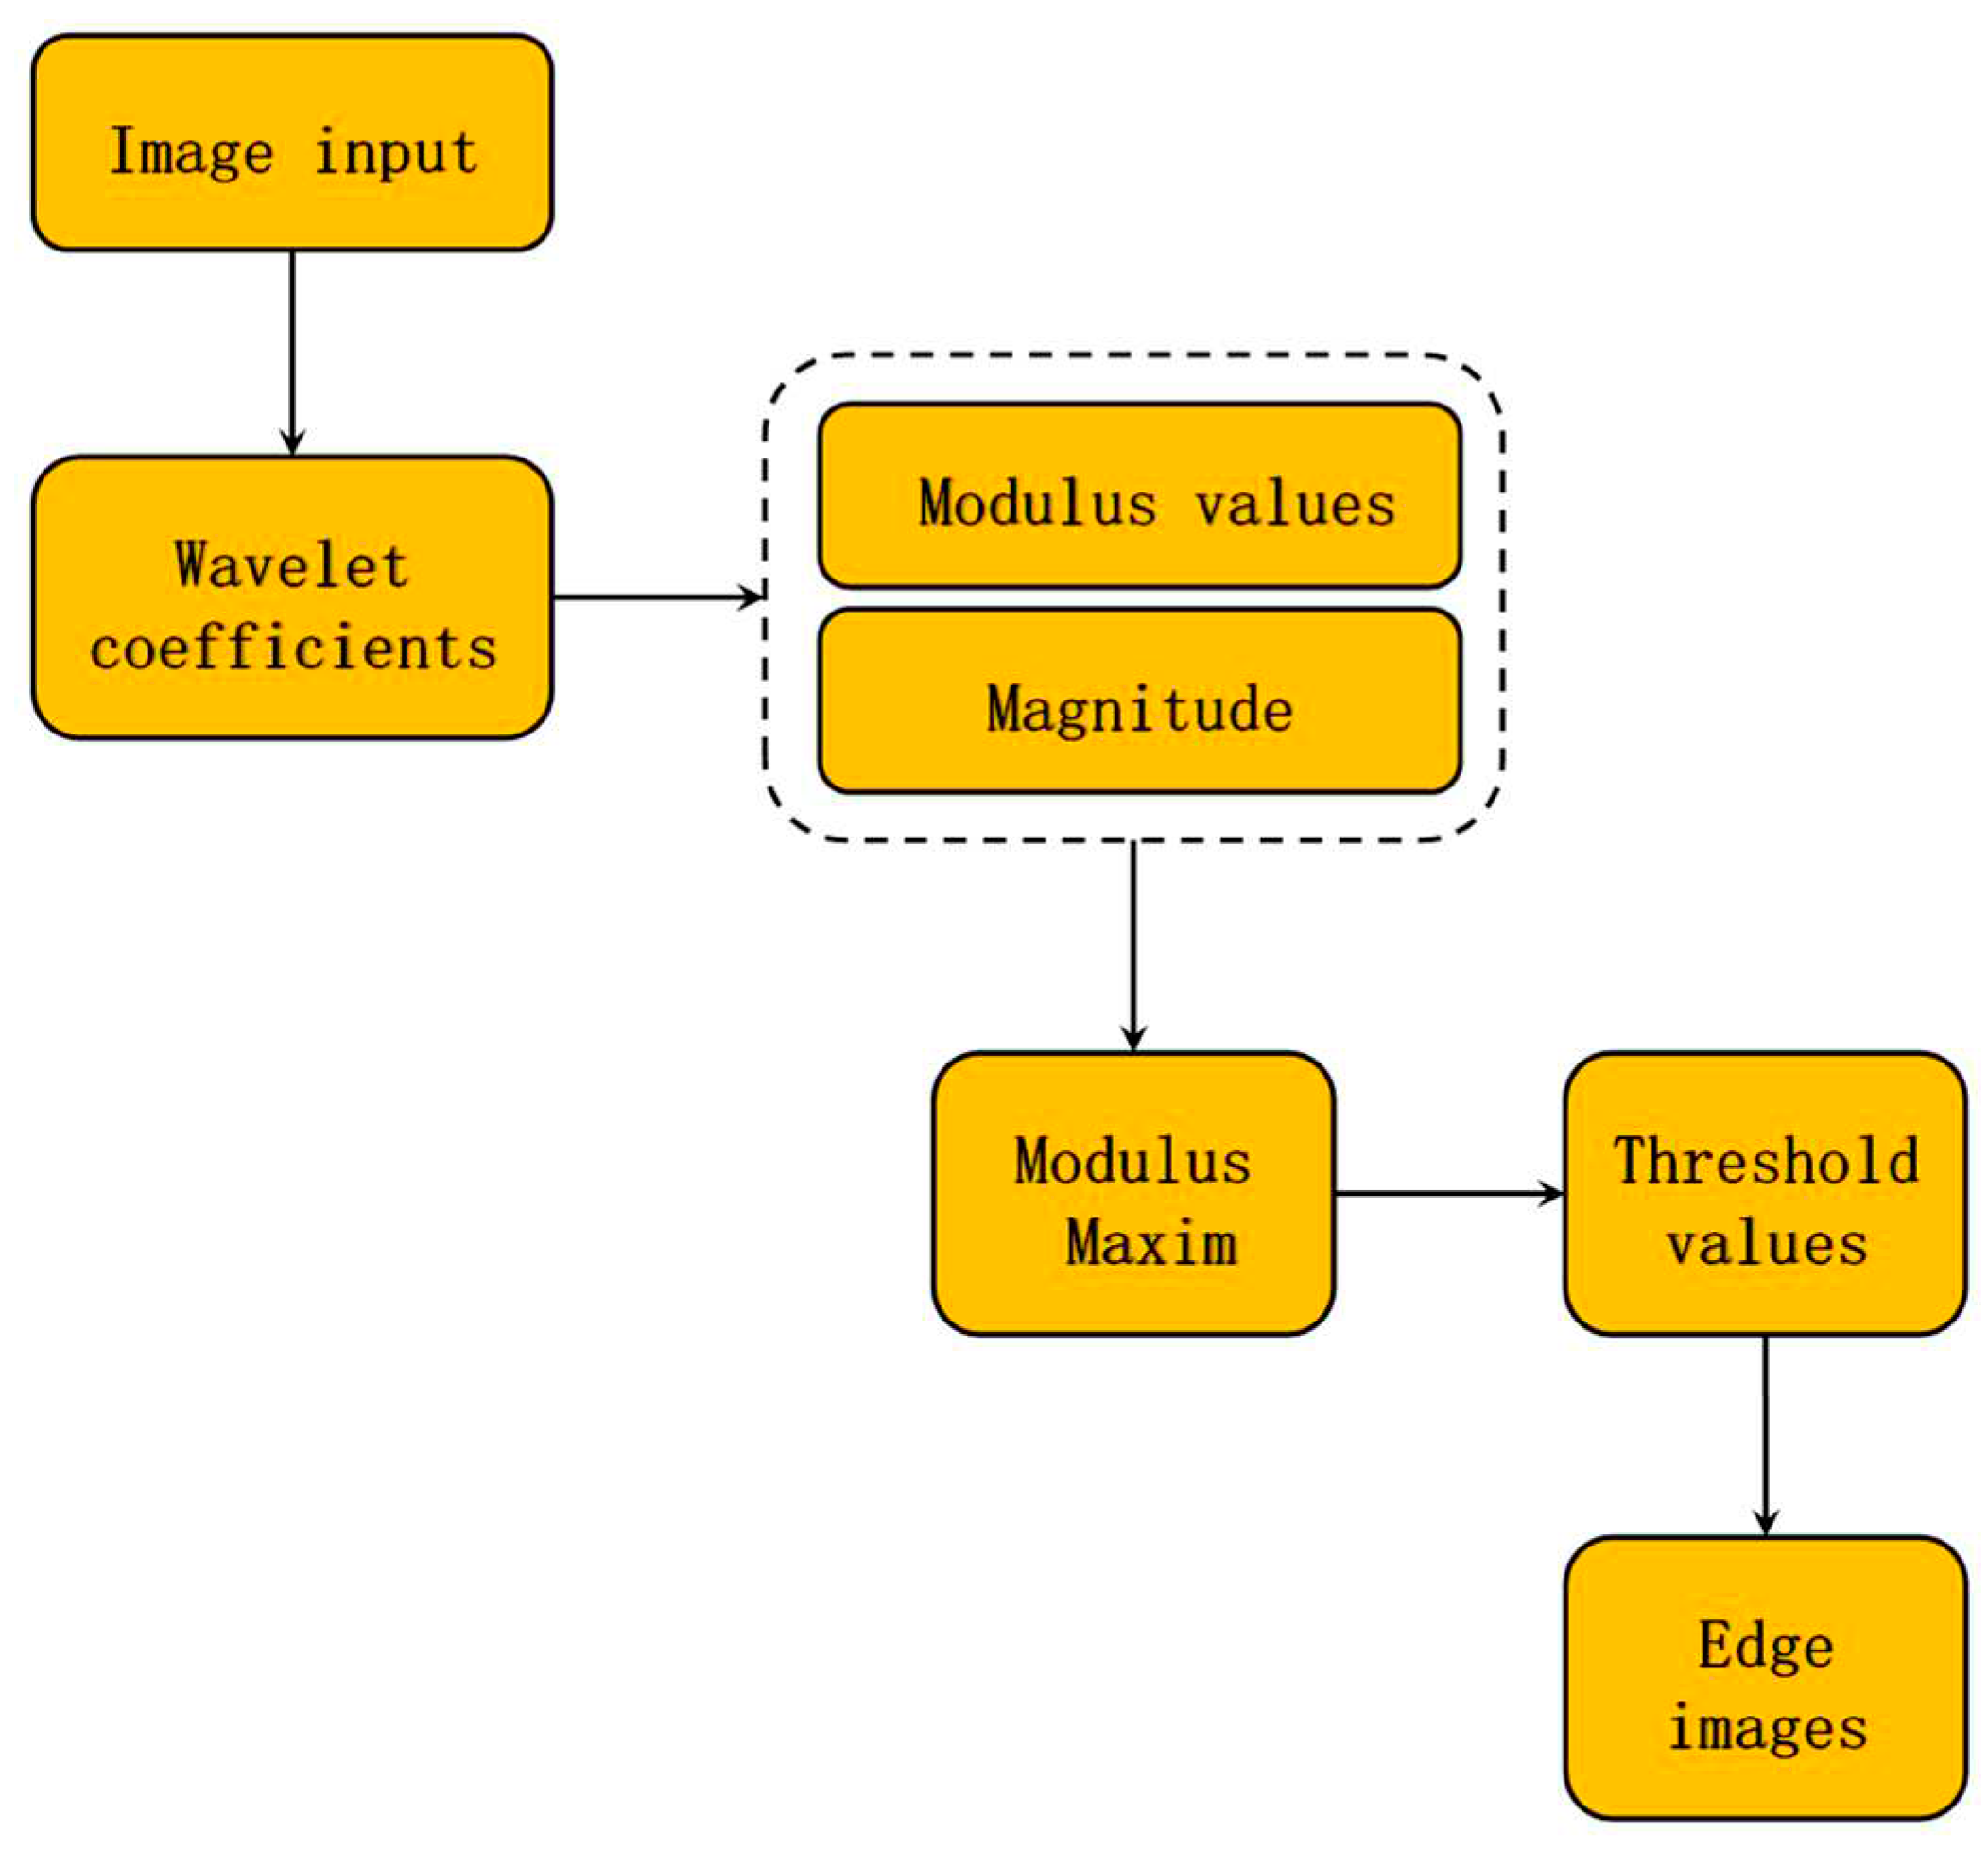
The general steps of the wavelet transform mode maxima method applied in edge detection [
27] are as follow: (1) use a fast algorithm, find the multi-scale wavelet coefficients of the image; (2) calculate the modulus and magnitude angle of each pixel, respectively; (3) calculate the mode maxima point after wavelet transform; (4) set the threshold, and where the modulus value is greater than the threshold is the edge point; and (5) output the multi-scale edge of the image. The specific workflow is shown in
Figure 3, where the modulus and magnitude angle in step 2 are calculated, as in Equations (2) and (3).
3.1.2. OTSU
The OTSU algorithm, also known as the Nobuyuki OTSU method, is considered the best algorithm for threshold selection in image segmentation. Because OTSU is simple to compute and is independent of image brightness and contrast, it has been widely used in digital image processing [
28,
29,
30,
31,
32]. It divides the image into two parts, background and foreground, according to the grey-scale characteristics of the image. The larger the interclass variance between the background and foreground, the greater the difference between the two parts that make up the image. When part of the foreground is divided into the background or part of the background is divided into the foreground, both result in a smaller difference between the two parts [
33]. Therefore, the segmentation that maximizes the interclass variance means the smallest probability of misclassification [
34]. Let the grey scale image grey level be L, then the grey scale range is [0,L-1]. The optimal threshold for calculating the image using the OTSU algorithm is shown in Equation (4).
The variables are stated as follow: when the threshold for segmentation is t, w0 is the background scale, u0 is the background mean, w1 is the foreground scale, u1 is the foreground mean and u is the mean of the whole image. The t that maximizes the value of the above equation is the optimal threshold for segmenting the image.
Where the mean value u of the whole image is calculated, as shown in Equation (5), and can be simplified to Equation (6) when Equation (4) is more computationally intensive:
3.1.3. Information Entropy and SSIM
Information entropy is a concept introduced by Claude Shannon, a famous American mathematician and founder of information theory. Information entropy is used as a measure of uncertainty—that is, the probability of discrete random events occurring. Briefly, the more chaotic things are, the higher the information entropy, and conversely, the lower the information entropy [
35,
36,
37,
38,
39].
For an image, random variable described by the information entropy is the pixel value of the image. The information entropy of an image is a statistical form of a feature and reflects the size of the average amount of information in the image. Typically, the greater the information entropy of an image, the more informative and detailed it is, and the better the image quality. The one-dimensional information entropy of an image can show the concentration characteristics of the grey-scale distribution in the image, but it cannot reflect the spatial characteristics of the grey-scale distribution. On the basis of the one-dimensional entropy, characteristic quantities which can reflect the spatial characteristics of the grey-scale distribution can be introduced to compose the two-dimensional entropy of an image [
40]. The neighborhood grey mean of the image is chosen as the spatial characteristic quantity of the grey scale distribution, and combated with the pixel grey scale of the image to form into the feature binary (
i,
j). Equations (7) and (8) are the calculation methods of image information entropy [
41].
f(
i,
j) is the frequency of occurrence of (
i,
j), N is the scale of the image.
SSIM (Structural Similarity Index Measure) is a measure of the degree of similarity between two images, and the structural similarity between the two can be seen as a quality measure of distorted images. Compared to traditional image quality measures, SSIM is more in line with the human eye’s judgment of images. Given two signals
x and
y, the structural similarity between the two is defined [
42,
43,
44] as shown in Equations (9) and (10).
where
l(
x,
y) is used to compare the brightness of
x and
y,
c(
x,
y) to compare the contrast of
x and
y, and
s(
x,
y) to compare the structure of
x and
y.
α,
β,
γ are parameters to adjust the relative stability of
l(
x,
y),
c(
x,
y), and
s(
x,
y).
μX and
μY are the mean values of
x and
y,
σx and
σy are the standard deviations of
x and
y, respectively, and
σxy is the covariance of
xy.
C1,
C2 and
C3 are all constants used to maintain the stability of
l(
x,
y),
c(
x,
y) and
s(
x,
y). In practice, it will generally default to,
α =
β =
γ = 1 and
C3 = 0.5 ×
C2, so Equation (9) can be simplified to Equation (11).
3.2. Data Processing
3.2.1. Pre-Treatment
In order to facilitate the edge detection on the target image, appropriate pre-treatment is necessary. The pre-treatment used in this paper is image enhancement. Image enhancement can improve the visual effects, highlight the useful information of an image and compress invalid information facilitating computer analysis. Image enhancement methods can be broadly classified into two categories: spatial domain methods and frequency domain methods. The spatial domain method is to directly perform linear or non-linear operations on the image to process on the pixel grey values of the image [
45]. The frequency domain method, on the other hand, considers an image as a two-dimensional signal and performs signal enhancement on it based on Fourier transform [
46].
In this paper an image frequency domain method is adopted based on the wavelet transform. With efficient scaling and translation capabilities, the wavelet transform can analyze signals at multiple scales [
47] and resolve some problems that cannot be solved by traditional frequency domain transforms. After the two-dimensional wavelet transform is applied to the image, some kinds of two-dimensional signal, the approximate signal and the detailed signal (horizontal, vertical and diagonal directions) can be obtained. The contour information of the image is mainly concentrated in the approximate signal [
46], and some details and noise are concentrated in the detailed signal. In order to promote the contrast of the target image and suppress the background, non-linear image enhancement can be applied to the approximate signal [
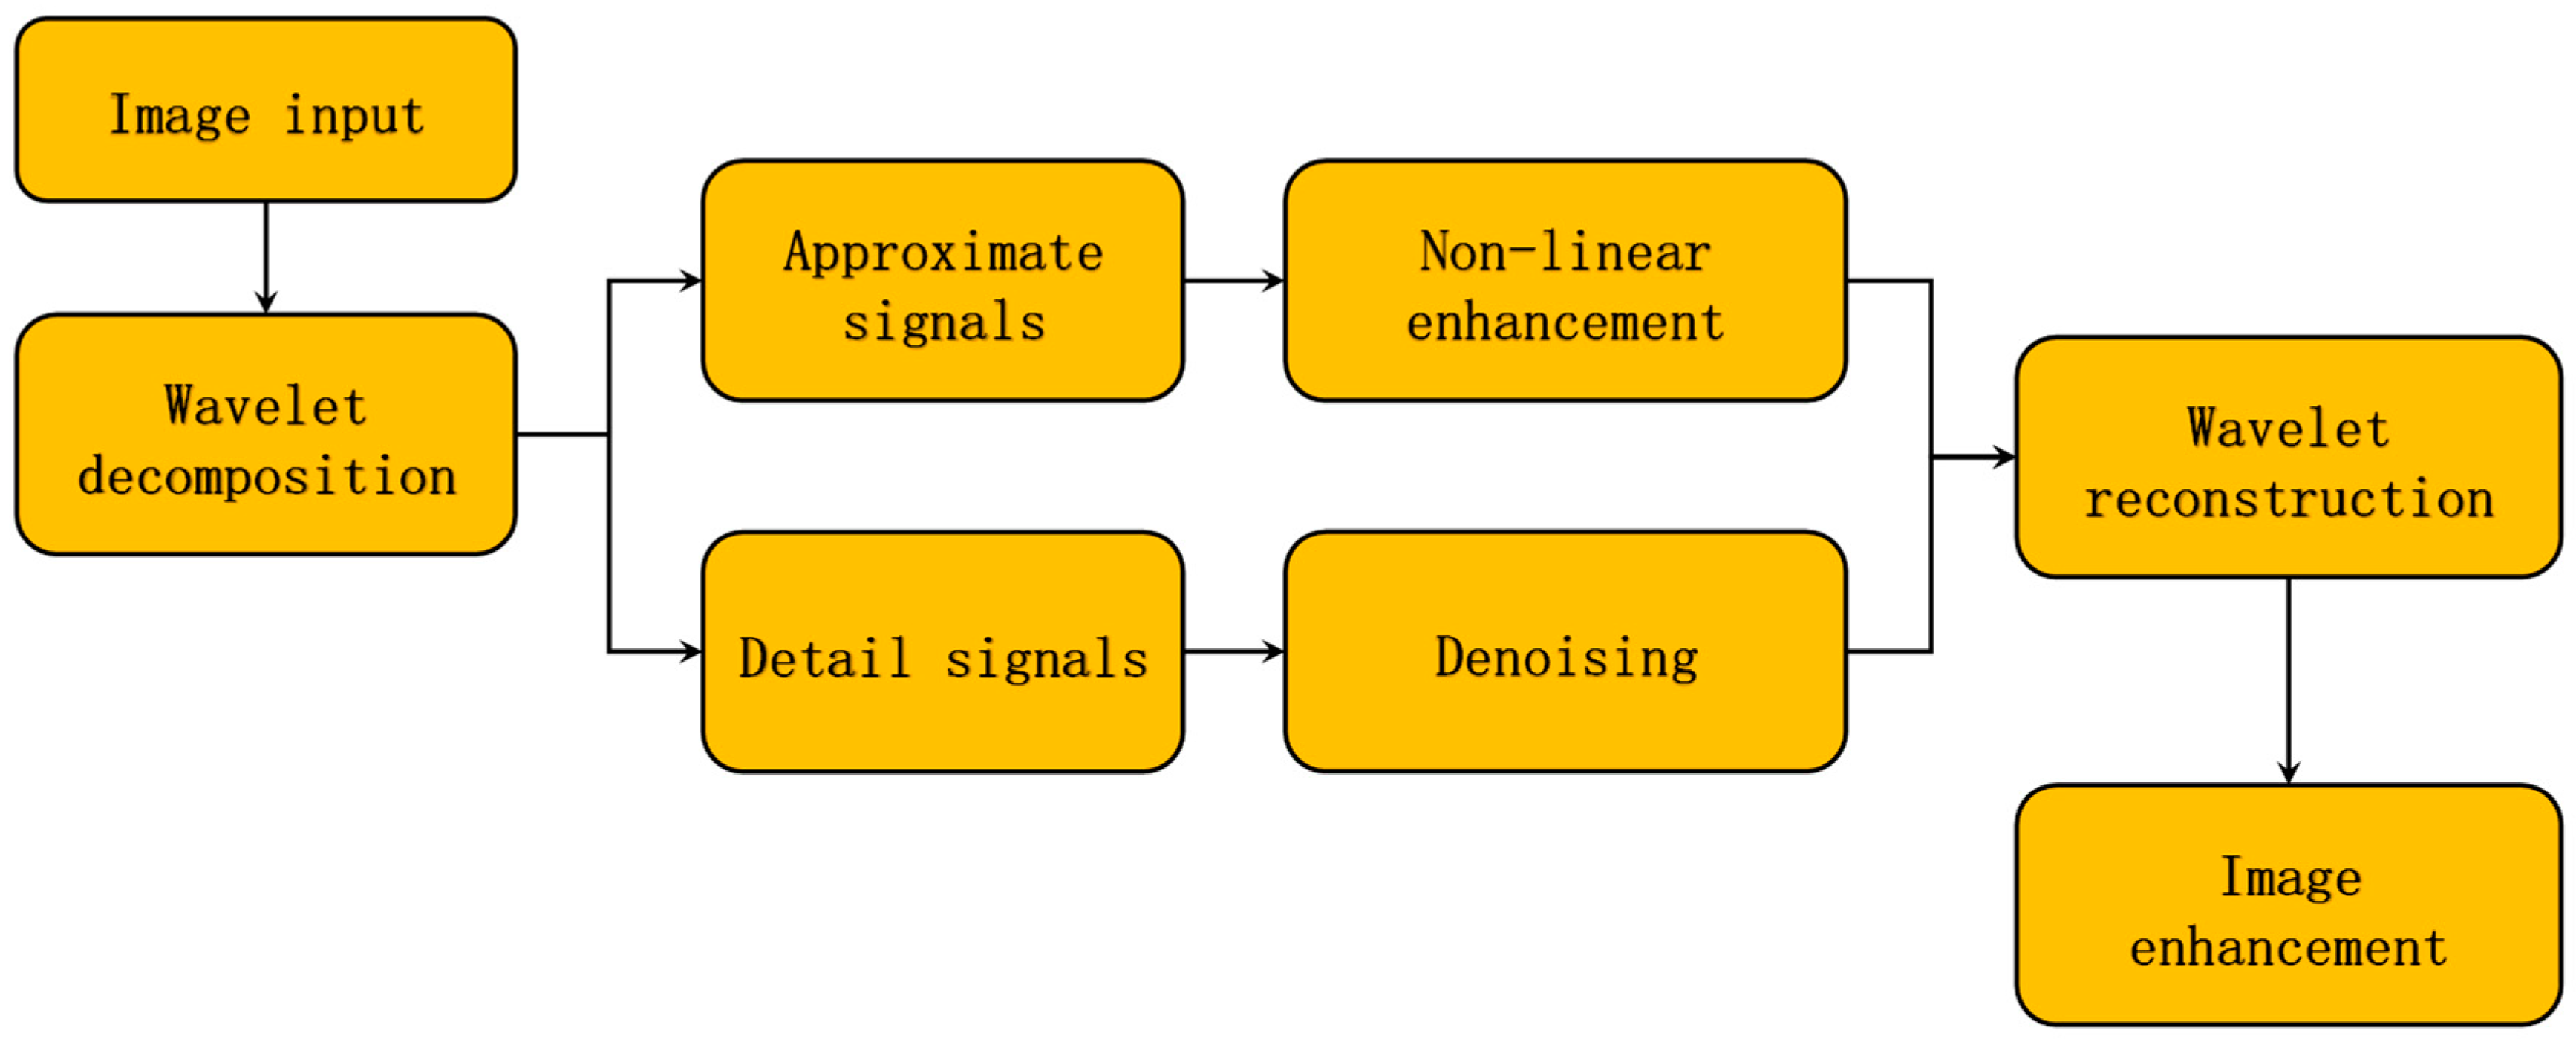
48]. Eventually, based on the processed approximate and detail signals, wavelet reconstruction is performed to obtain the enhanced image. The specific processing process [
49] is shown in
Figure 4, where wavelet decomposition, non-linear enhancement, denoising and wavelet reconstruction are the main operational steps.
When performing non-linear enhancement, histogram equalization can generally be used. Histogram equalization causes pixels with a high probability of grey values to be stretched, and in the process of stretching, the noise will be locally enhanced. After the wavelet transform, the noise information is concentrated in the detail signal and not in the approximate signal, so the histogram equalization for the approximate signal avoids the problem of amplifying the noise, which is the advantage of the wavelet transform.
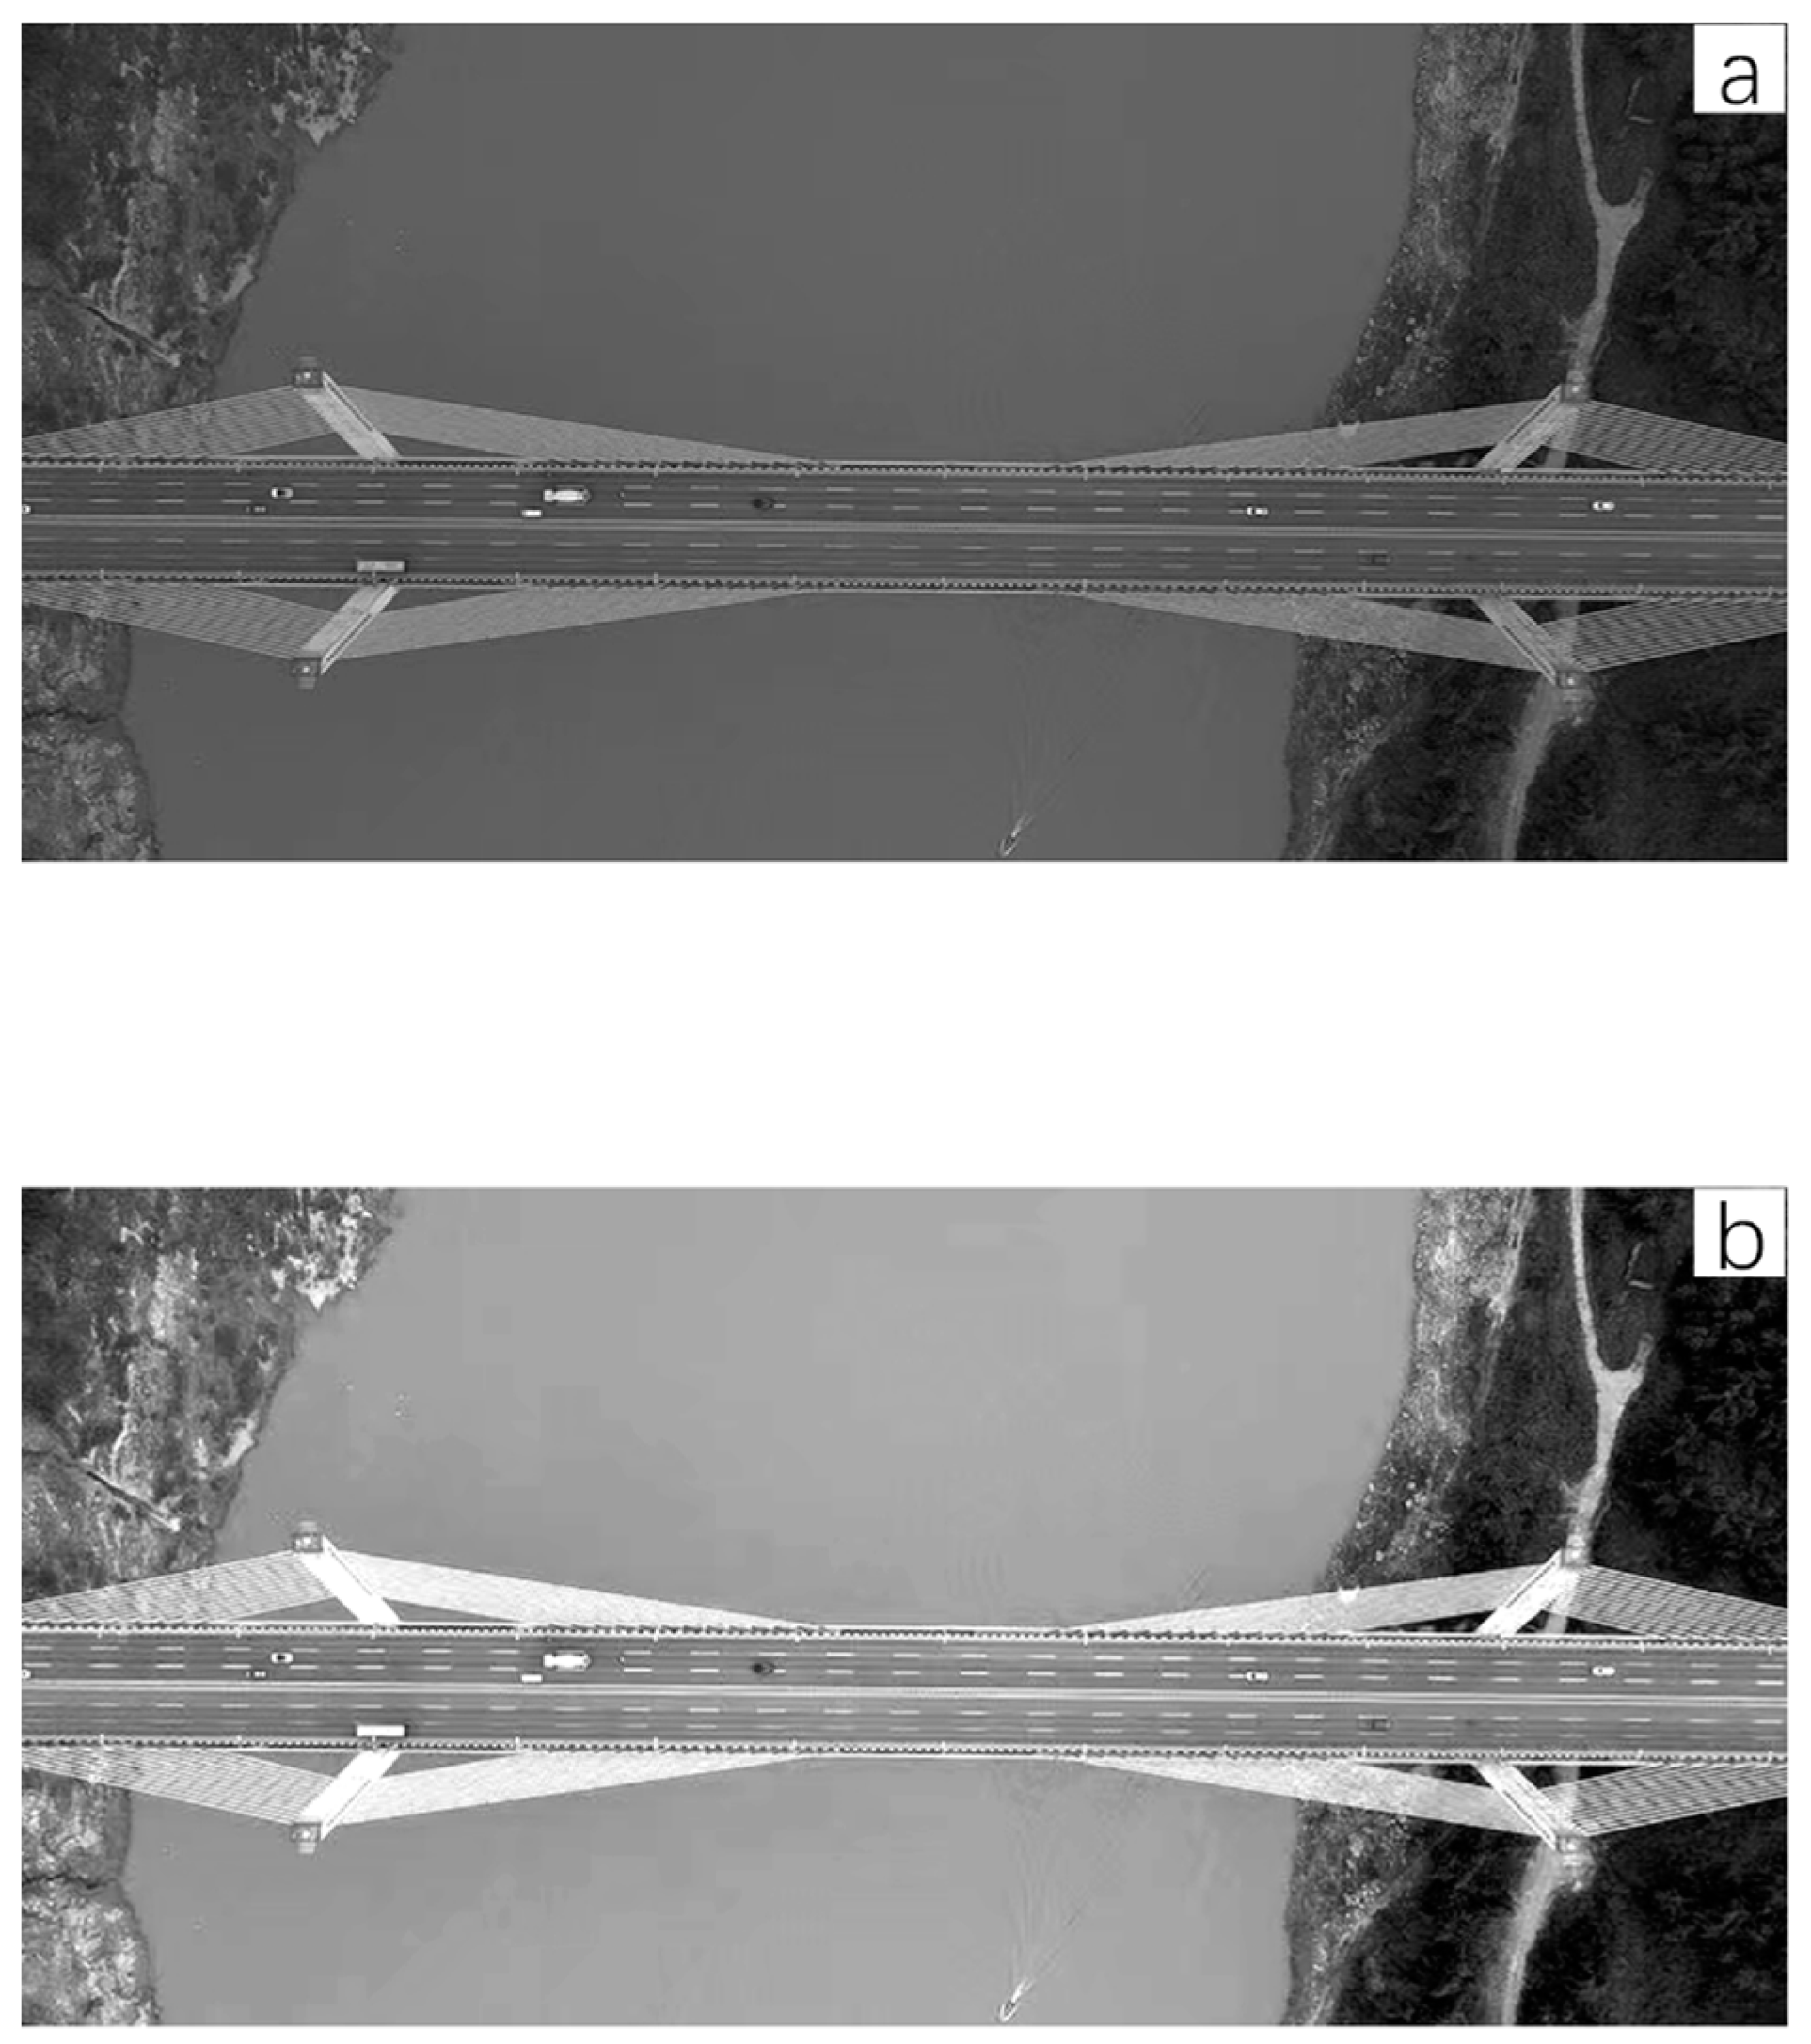
Now the image enhancement is carried out on the target image. Firstly, db4 (Daubechies) is selected as the wavelet function to decompose the target image in three levels to obtain the approximate signal and the detail signal; then, the histogram equalization is carried out on the approximate signal; and finally, the approximate signal and the detail signal are reconstructed again to obtain the enhanced image. The enhancement result is shown in
Figure 5b. From the comparison of (a) and (b) in
Figure 5, it can be seen that the image becomes brighter overall and the overall contour of the bridge is more prominent. Moreover, the contrast becomes greater and the features become more obvious, providing favorable conditions for edge detection in the next step.
3.2.2. Wavelet Transform Modulus Maxima Image
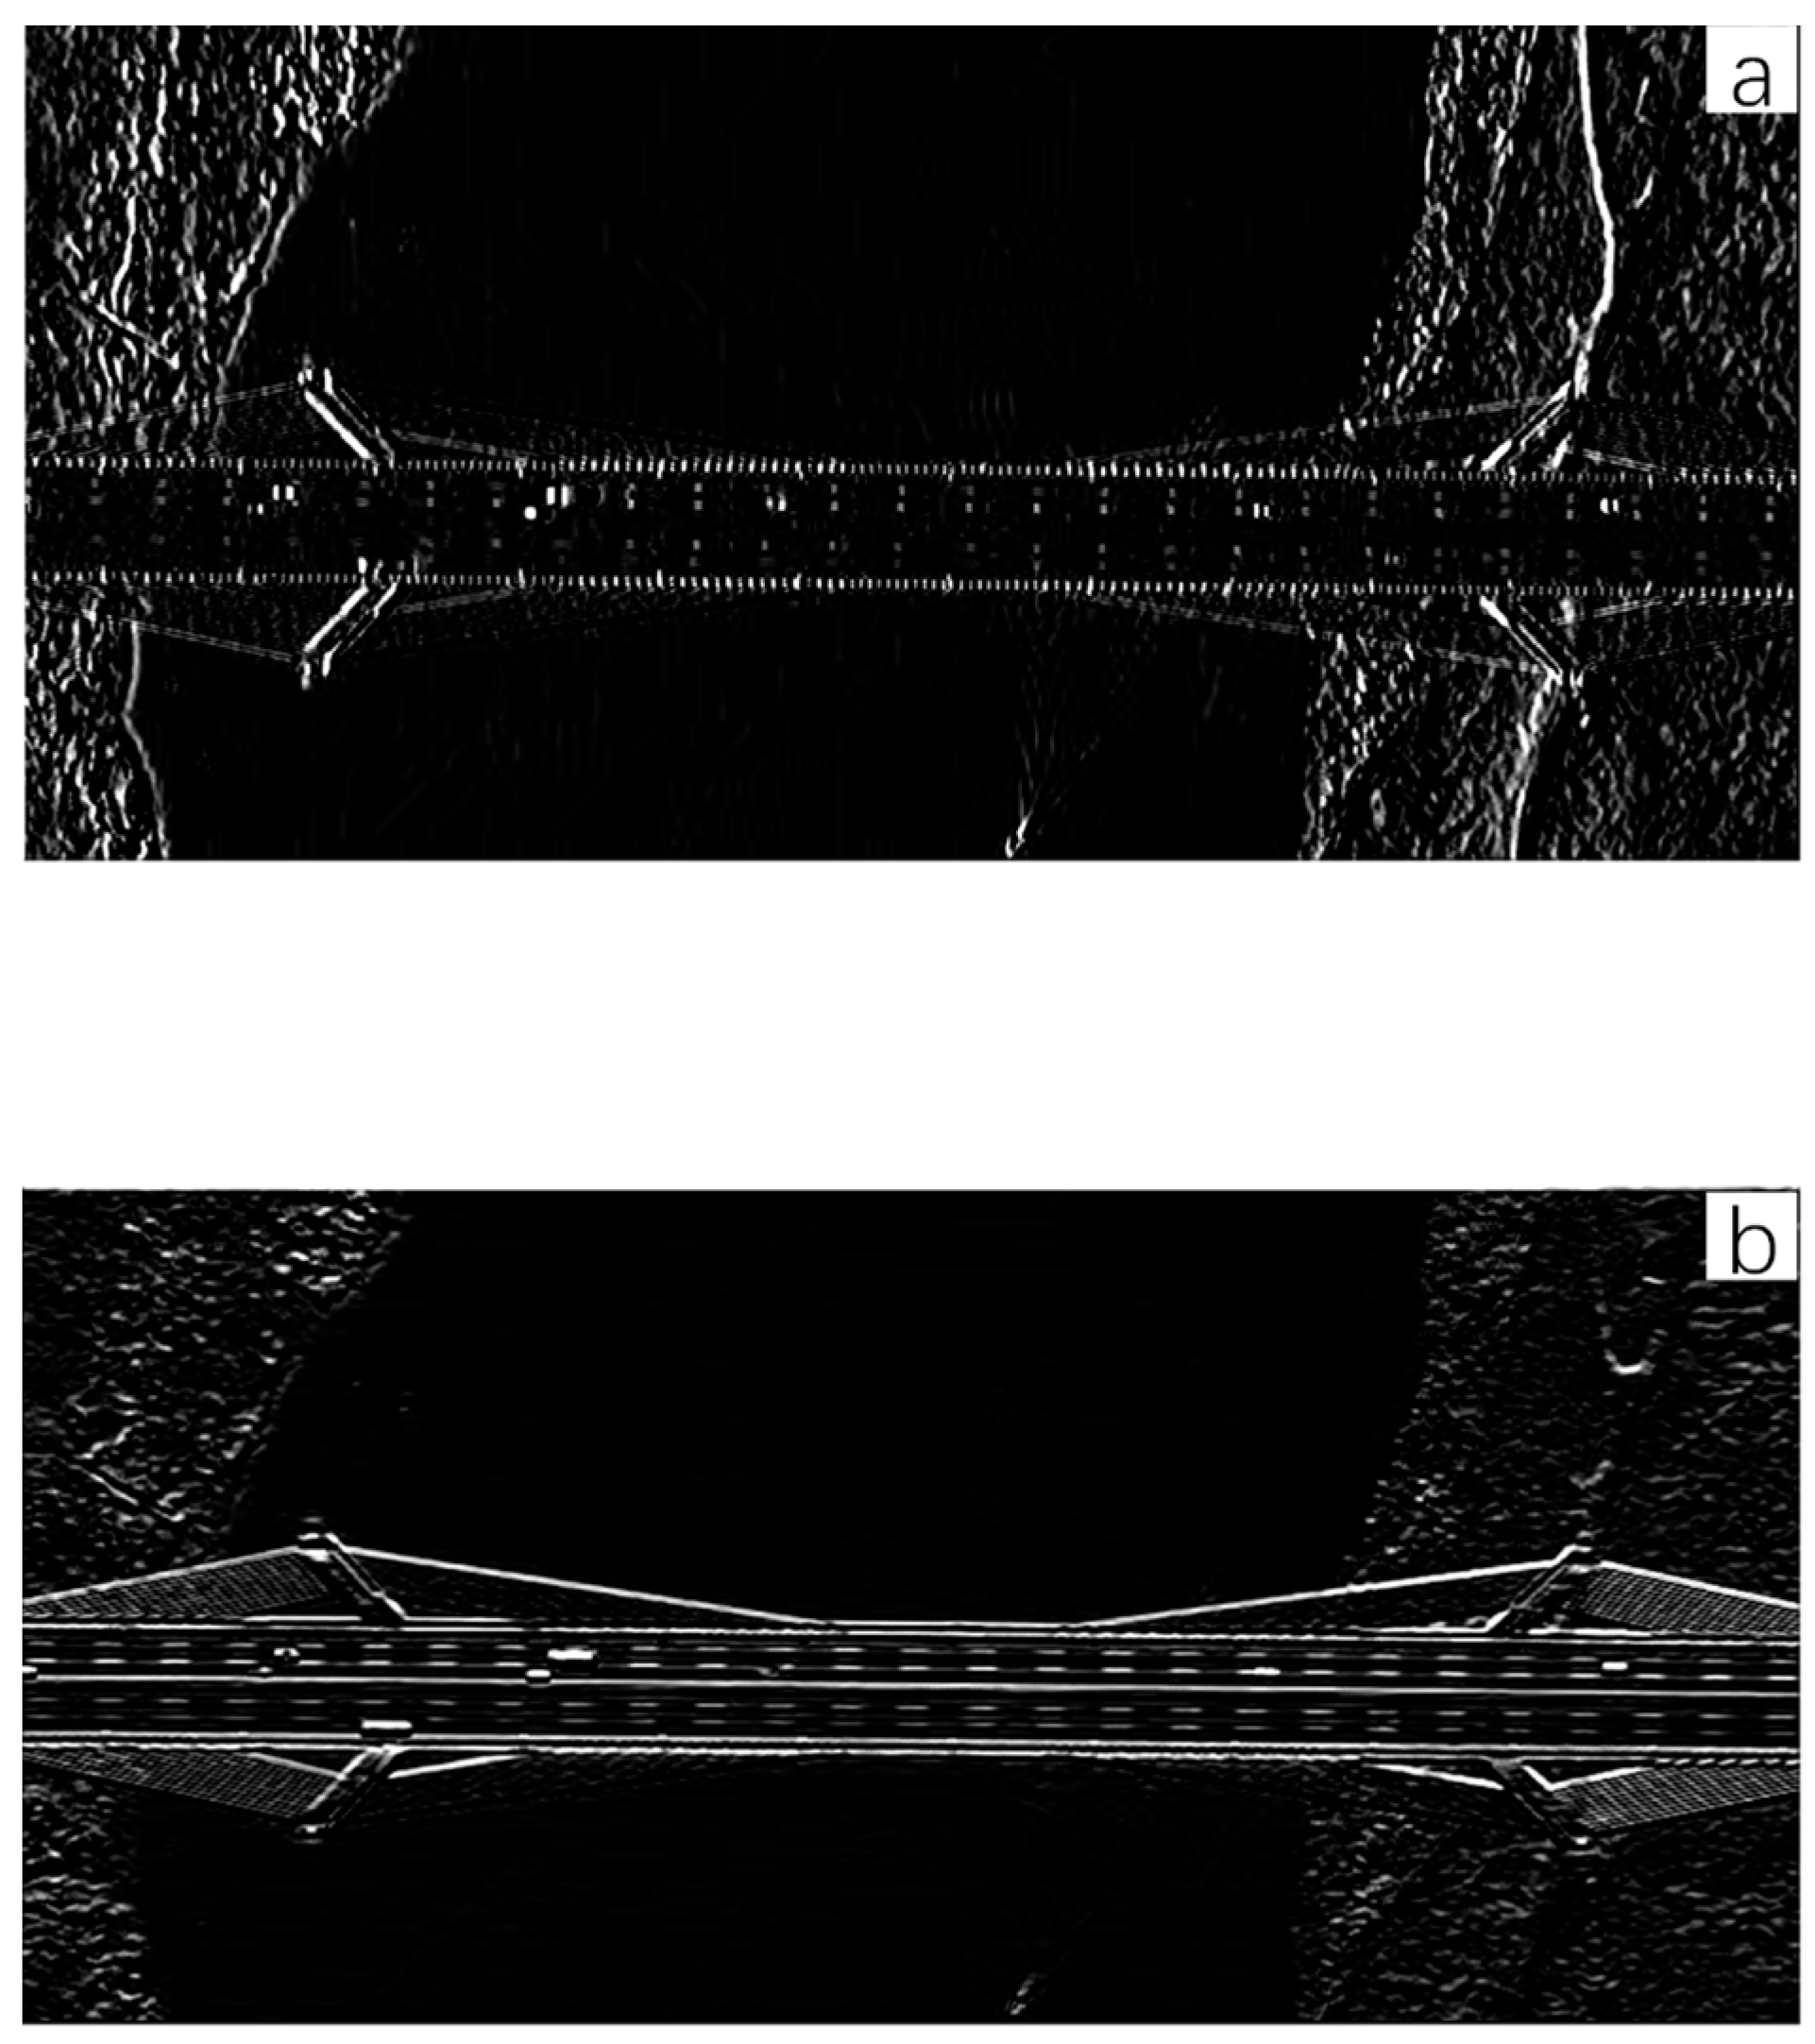
After pre-processing, the image is enhanced. The next step will be edge detection using the wavelet transform modulo maxima method. In the process, a convolution kernel, i.e., a wavelet function, is firstly generated from the image and the constructed two-dimensional Gaussian function. Then, the generated convolution kernel is used to convolve with the image to obtain the detail information, during which the continuous wavelet transform (CWT) is carried out, as shown in
Figure 6. Based on the wavelet transform results, the modulus and amplitude angles of the image are calculated. The resulting magnitude angle is divided into four directions: horizontal, vertical, positive diagonal and negative diagonal. Each pixel point is examined in turn to determine whether it is an extreme value in the direction to which it belongs, and if so, the gradient value is recorded, and if not, the gradient value is set to zero. The maximum value of the gradient is found and the value is normalized. Compare the normalized gradient value for each pixel and consider it a true edge when the gradient value is greater than the threshold, otherwise it is considered a pseudo-edge.
The results of the transformation of the image in both horizontal and vertical directions after the continuous wavelet transform have been shown in
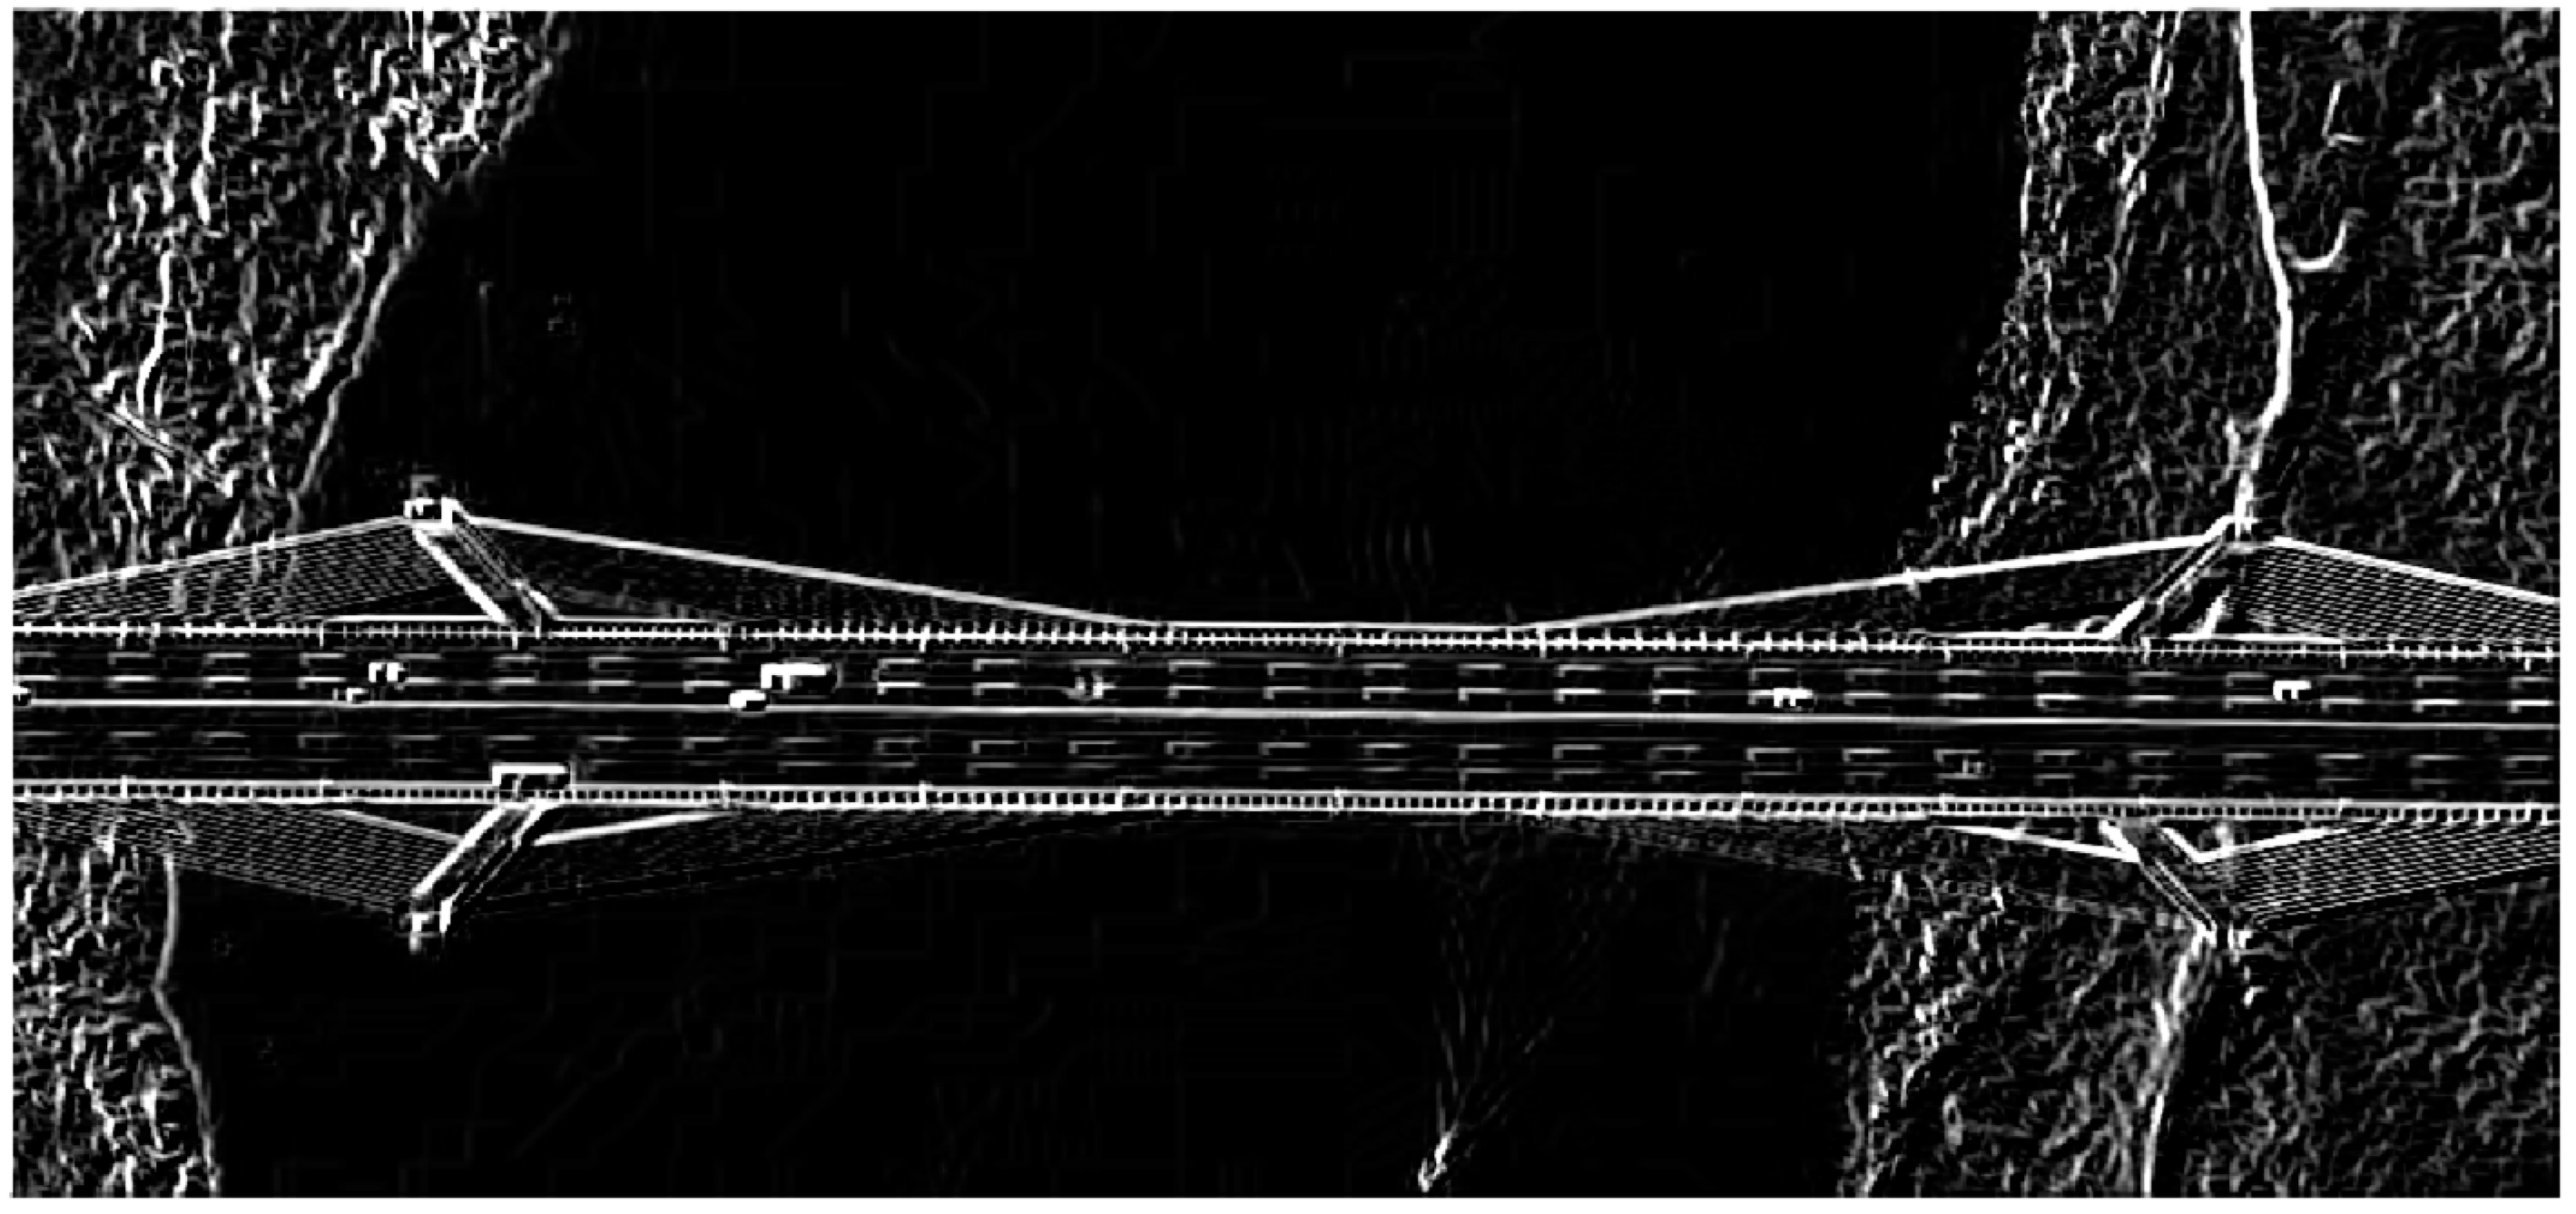
Figure 6. By taking the pixel values of the corresponding pixels of the two images, finding the sum of the squares of the two and performing a square root calculation, the overall modulus image can be obtained, as shown in
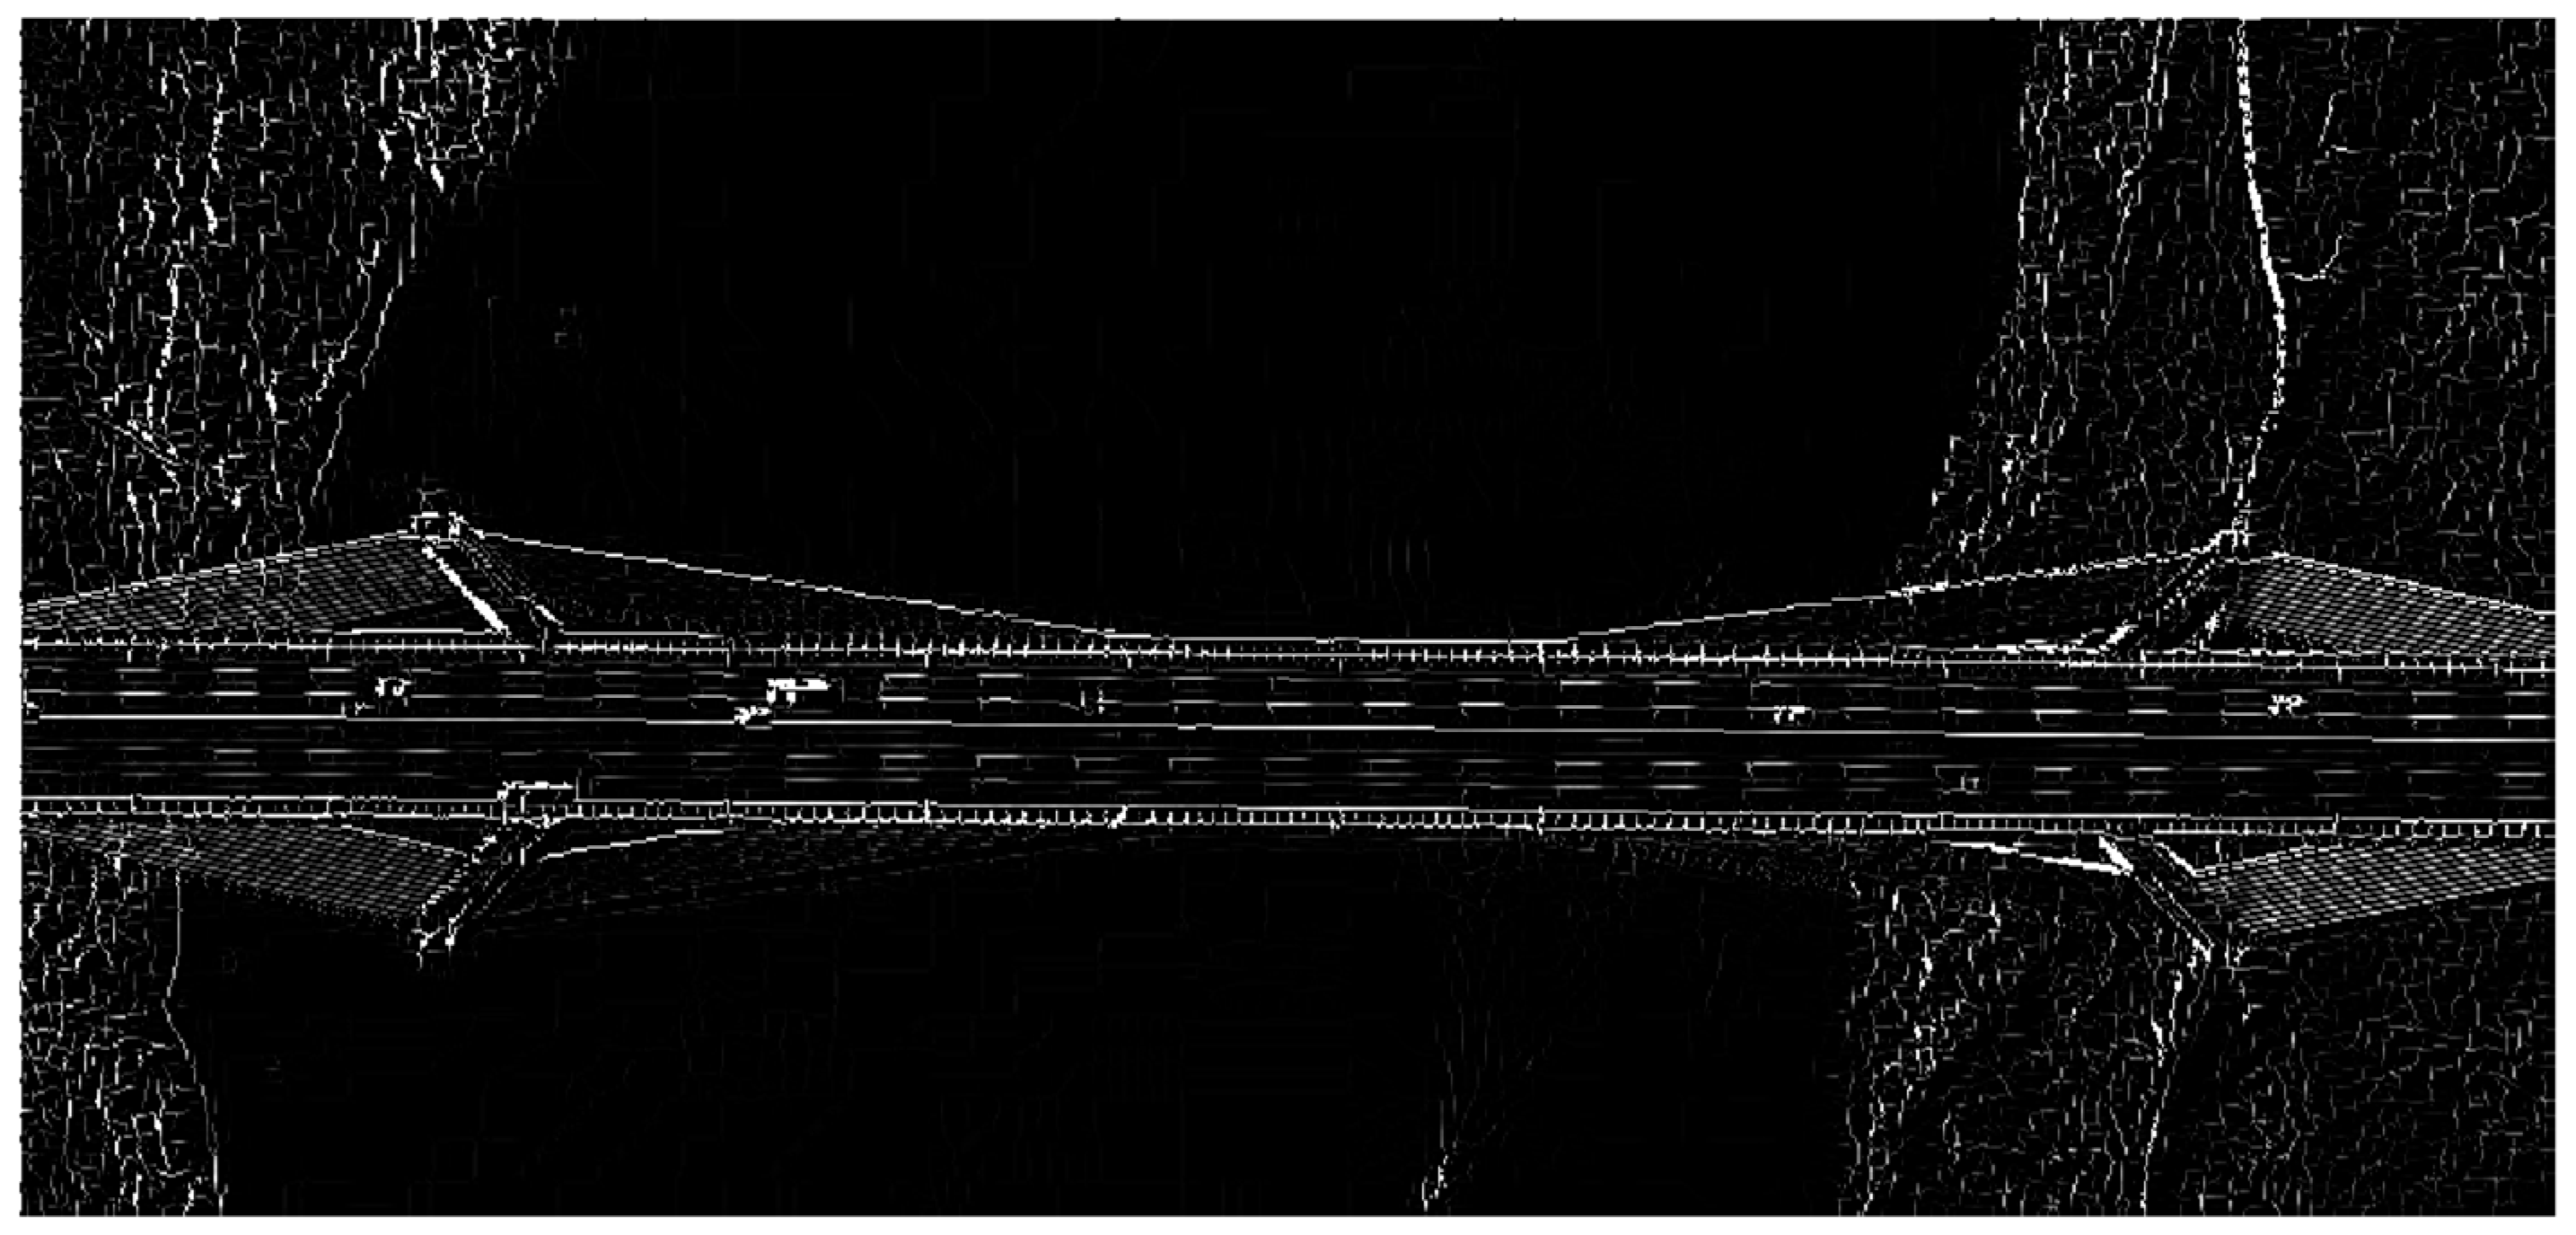
Figure 7. The modulus image is further processed, i.e., the extreme value of the pixel in the current image is found and retained, and the result is shown in
Figure 8.
The advantages of OTSU in calculating global thresholds are simple, fast and unaffected by brightness or contrast. The disadvantage is that it is sensitive to noise. It is not effective when the difference between the target and background areas is too large. With equal proportion of the target and background, modulus maxima images are suitable for the OTSU method to calculate thresholds. The result is 0.06.
4. Results and Verification
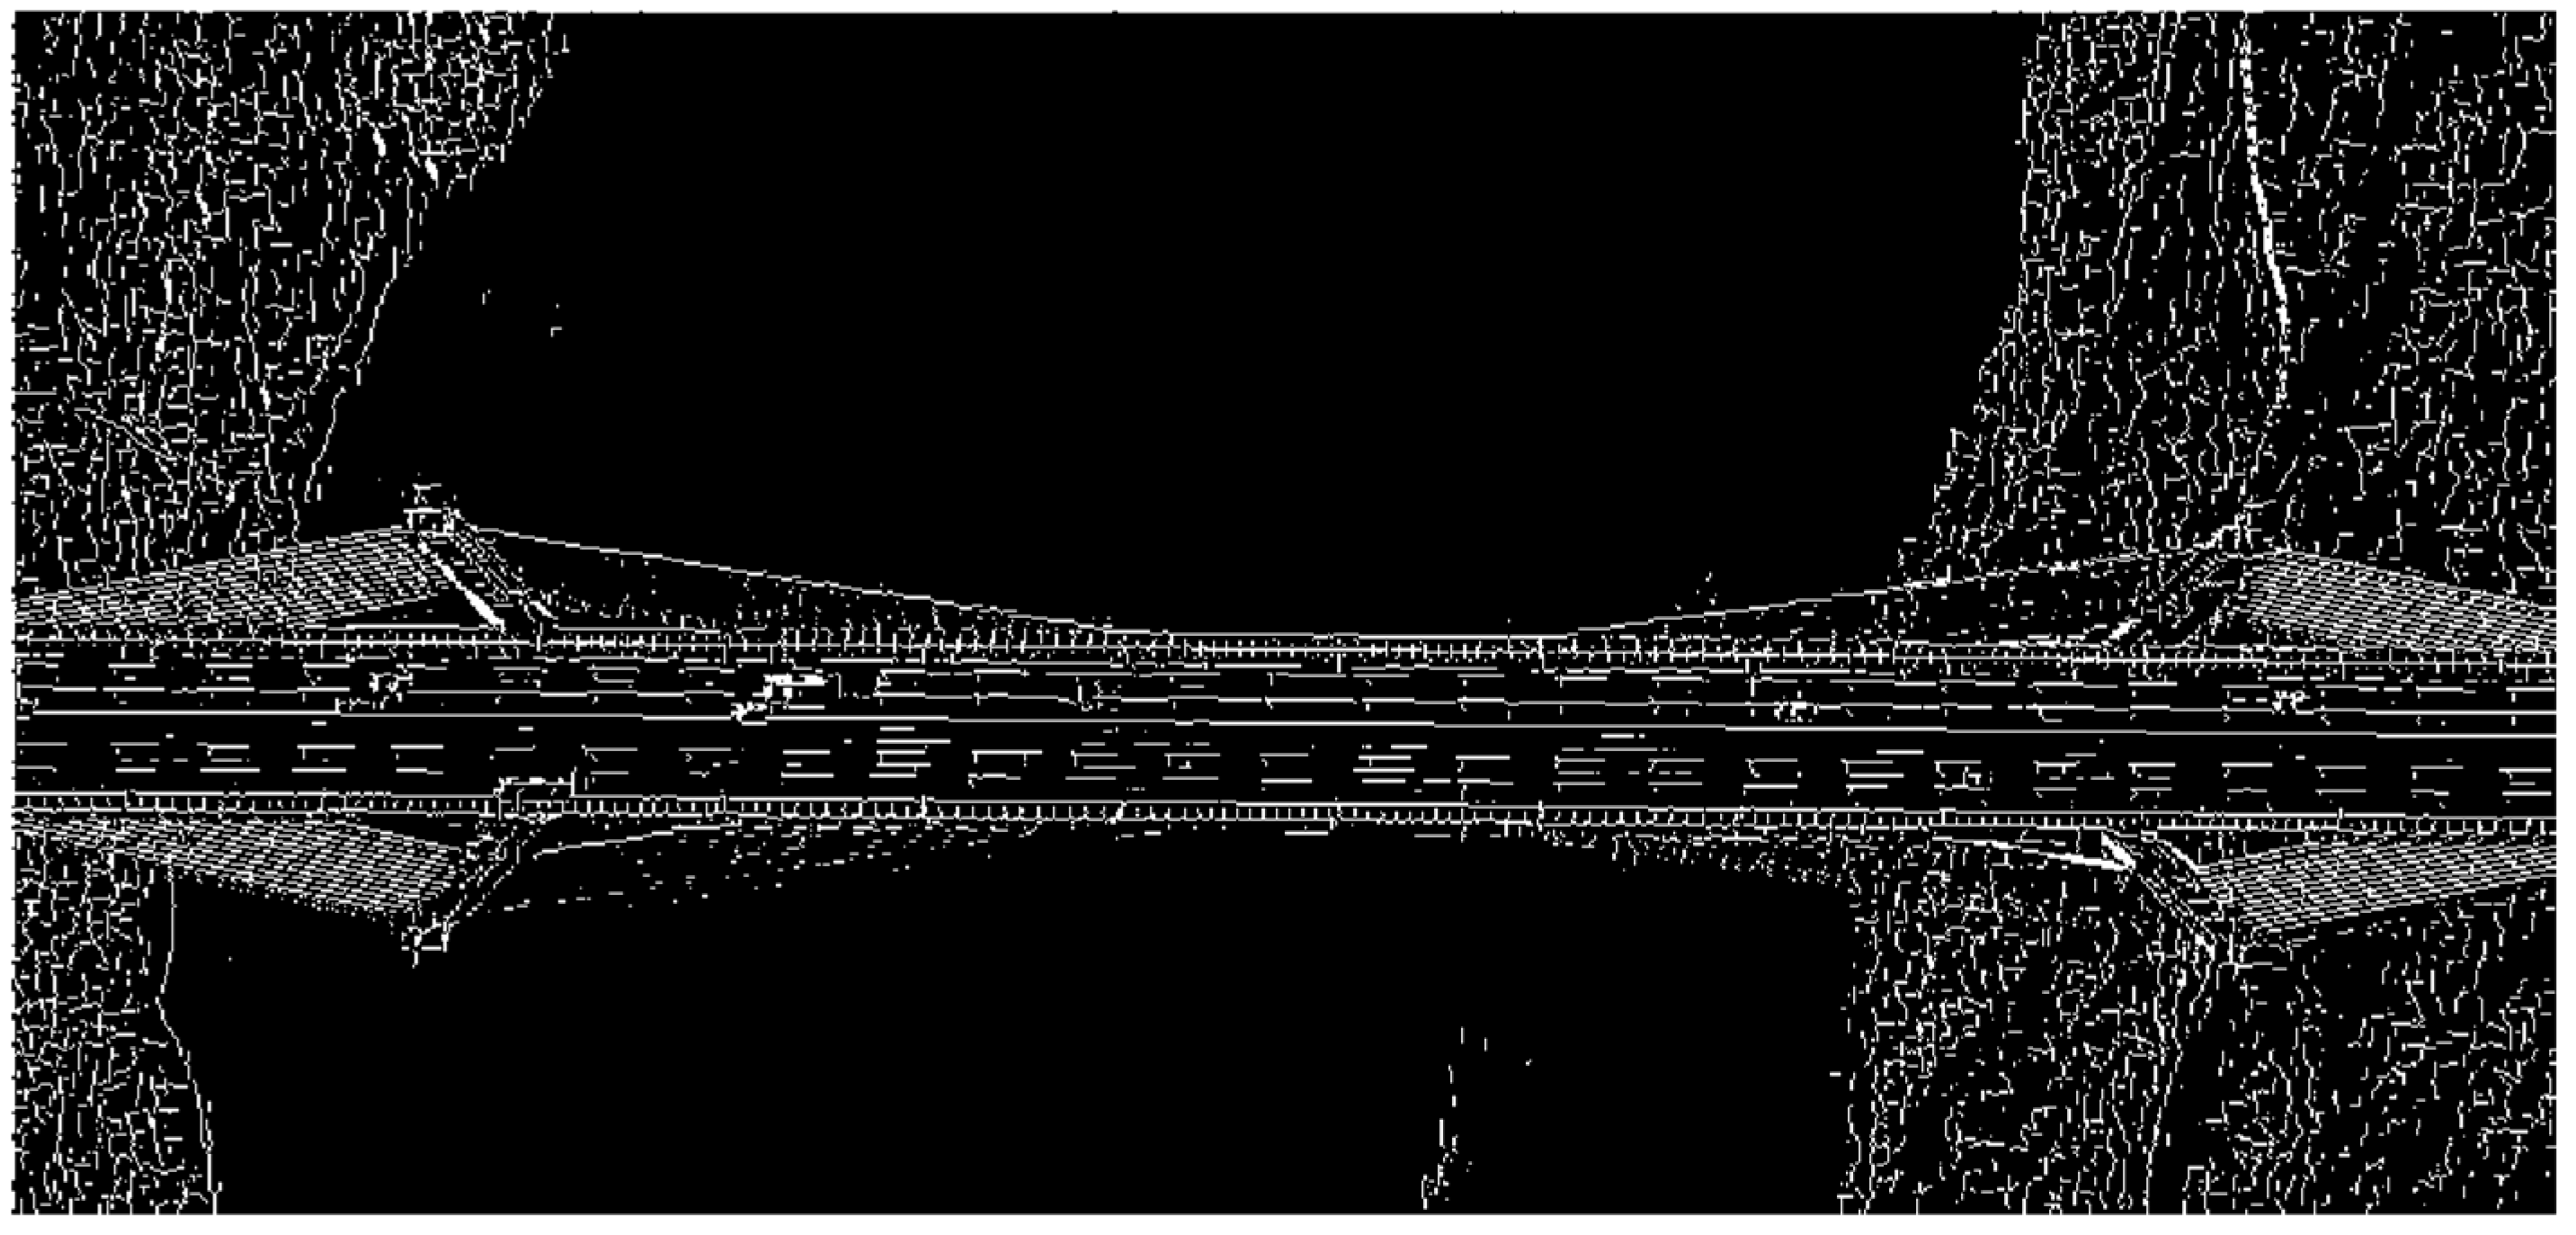
The modulus image is processed according to the threshold value calculated by the OTSU above. Pixel points that are larger than the threshold are retained; pixel points that are smaller than the threshold are deleted by setting their pixel values to zero. The final edge image is shown in
Figure 9. As can be seen in the figure, the overall shape of the bridge is basically detected. The steel cables on one side of the bridge are also clear, and even the white lane lines on the bridge deck can be shown regularly. The ground on both sides of the image is clearly divided from the water in the middle, and areas with and without coverage of vegetation are basically distinguished.
To further illustrate the advantages of the combined use of the wavelet mode maxima method and the OTSU, two other detection algorithms, the Canny algorithm and the Laplace algorithm, are used to detect the edge of the same image. Detection results are shown in
Figure 10. The information entropy and SSIM are also used as indicators to compare these three detection results.
Based on the test results, the information entropy and SSIM of the three were calculated, respectively, for a more intuitive comparison, as shown in
Table 1.
As can be seen from
Table 1, the edge images detected by the wavelet transform modulus maxima method have greater information entropy and SSIM compared to the other two algorithms, indicating that the images are richer in detailed information, provide more information and better detection results. The results demonstrate that the algorithm in this paper has relative advantages.
5. Analysis and Discussion
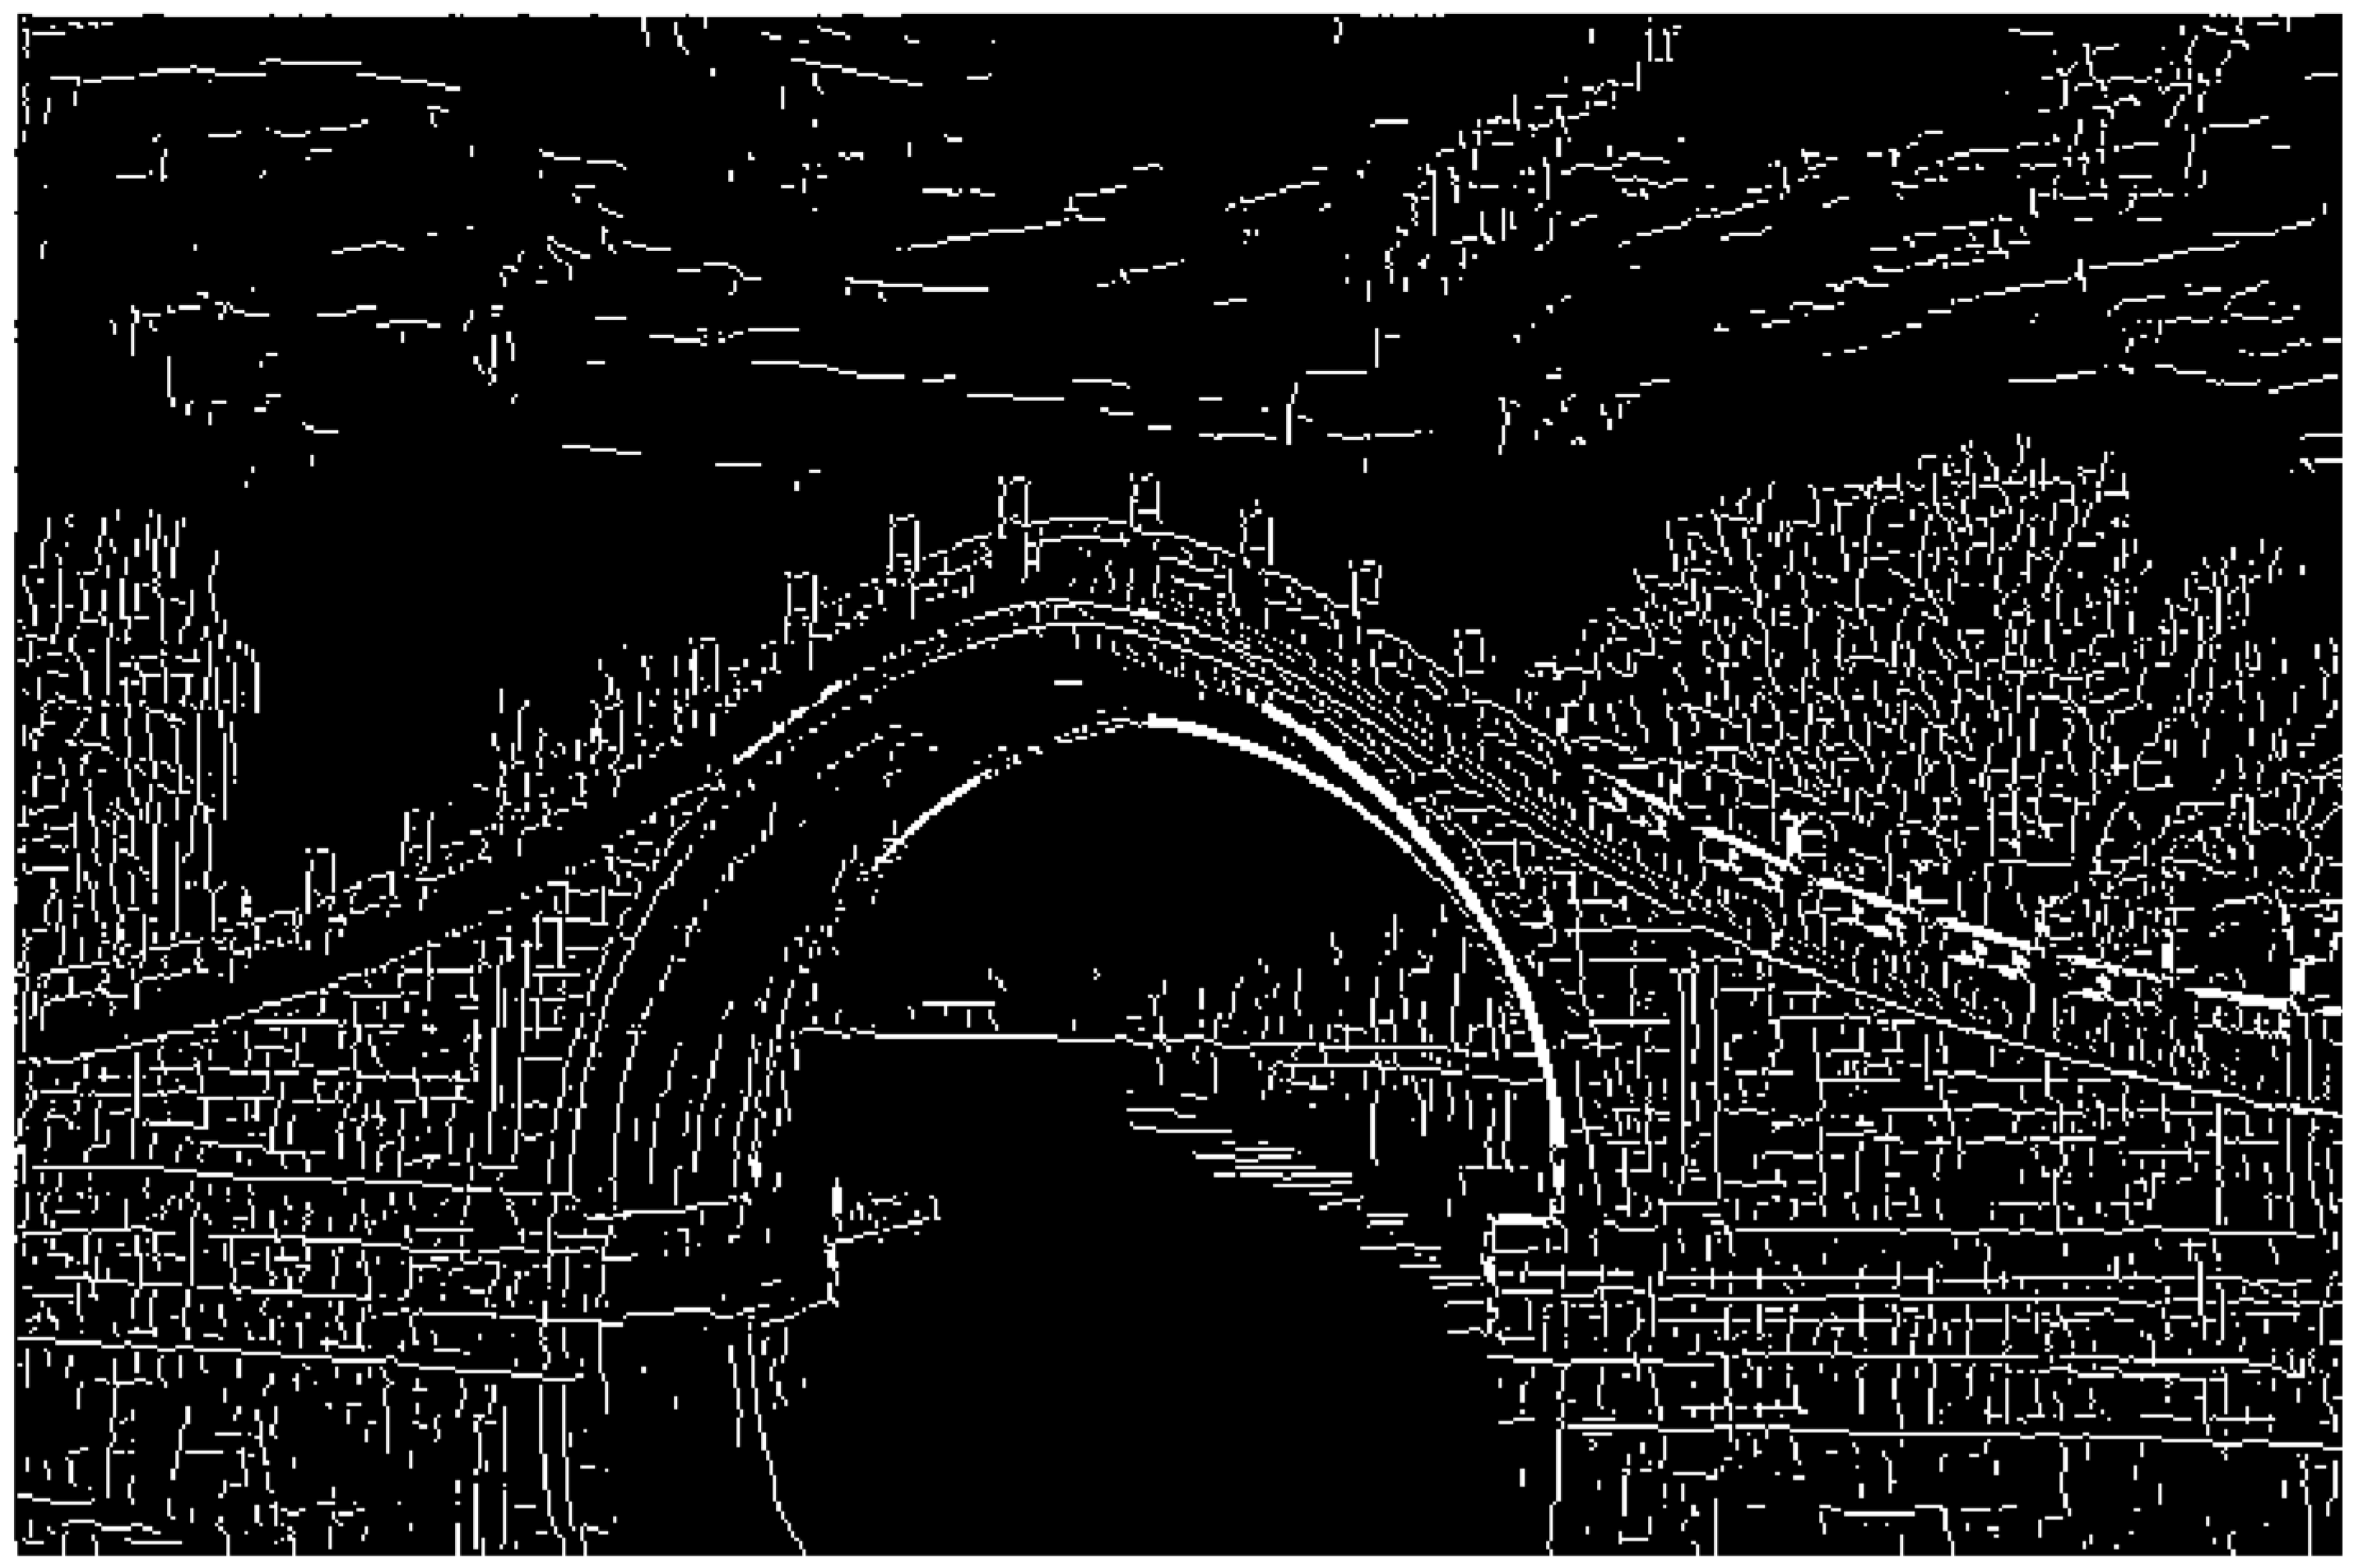
In the comparison above, the test area image was chosen with a relatively clear outline and homogeneous background in order to make the detection more effective. It is, then, worthwhile to illustrate whether the advantages of the wavelet transform modulo maxima method still exist in the case of a more complex background. Therefore, a bridge image with a more complex background is selected, as shown in
Figure 11. Edge detection using wavelet transform modulo maxima is performed, and the results are shown in
Figure 12.
To better illustrate the detection effect, the Canny algorithm and Laplace algorithm are still used again for edge detection, and the results are shown in
Figure 13. The information entropy and SSIM of each of the three are calculated for comparison, as shown in
Table 2.
As can be seen from
Table 2, the edge image detected by the wavelet transform modulus maxima method has the highest information entropy and SSIM, which means that its edge image quality is optimal. In other words, the advantage of the wavelet transform modulus maxima method is still present, and even more obvious, when edge detection is performed on images with more complex backgrounds.
The results in
Table 1 and
Table 2 show the results of three algorithms (wavelet transform modulo maxima, Canny and Laplace) for
Figure 2 and
Figure 11, respectively, demonstrating the effectiveness of the wavelet transform modulo maxima method. The background of
Figure 2 is mainly water, which is relatively homogeneous, while the background of
Figure 11 is trees, which is relatively more complex. The data from the processing results of this method for
Figure 2 and
Figure 11 are now brought together again in
Table 3 for full comparison. As can be seen from
Table 3, the information entropy obtained by the wavelet transform modal maxima method used in this paper is roughly at the same level as SSIM, and there is even some increase in the processing index for images with complex backgrounds, with more obvious advantages.
The process of edge detection is to find out grey-scale changes in an image, separate high-frequency signals from the image and accurately locate the edge position. The modulus maxima of the wavelet transform mirrors the sharply changing signals, i.e., the edges of the image. With the flexible scale, the wavelet transform has excellent local qualities in both the time and frequency domains. A small scale can distinguish between real edges and noisy signals, while a large scale can remove the influence of noise. A reasonable choice of the scale can optimize the combined performance of both and improve the overall detection effect of the method in this paper.
Although this paper demonstrates some of the advantages of the combined application of wavelet transform modulus maxima and OTSU, some shortcomings were found during the processing. After edge detection, the overall outline of the image is very clear, but the detail is not yet fine enough. For example, the cars on the bridge are still not fully detected, the connectivity of the edges still needs to be improved and the visual effect is not yet friendly enough. All need to be further optimized to meet the needs of engineering applications. Moreover, the situation reflected by information entropy sometimes does not exactly match human intuition, which more fully requires comprehensive metrics to evaluate image quality—and this is where the author of this paper continue to work.
6. Conclusions
Edge detection of images can be used for routine maintenance for bridges. When combined with drone photography technology, it not only especially saves a lot of manpower, but also allows people to focus on the areas that are not easily observed. However, there are many images with complex background in the inspection process. Conventional inspection algorithms do not perform satisfactorily.
The main contributions of the authors of this paper are:
(1) Facing images with more complex backgrounds, a combination of wavelet transform mode maxima and OTSU is used to perform edge detection on them, which improves the overall edge detection effect while replacing the traditional practice of manually debugging thresholds and improving the efficiency of edge detection;
(2) Information entropy and SSIM are used as evaluation metrics to quantitatively evaluate the detection effect when evaluating the merits of the detection effect. According to these two metrics, the difference between different processing results can be reflected more objectively, which is more convincing compared to the artificial subjective evaluation.
In summary, compared with the traditional method, the combination of wavelet transform mode maxima and OTSU has advantages in both efficiency and effectiveness in the process of image edge detection, and good prospects for engineering applications.
Author Contributions
Conceptualization, N.Y. and L.H.; data processing, N.Y. and L.H.; writing—original draft preparation, N.Y.; writing—review and editing, N.Y., L.H. and Y.L.; supervision and project administration, D.Z., X.Z. and W.S. All authors have read and agreed to the published version of the manuscript.
Funding
This research was funded by the Supported by Major scientific and technological projects of Yunnan Province; Research on Key Technologies of ecological environment monitoring and intelligent management of natural resources in Yunnan (202202AD080010).
Institutional Review Board Statement
Not applicable.
Informed Consent Statement
Not applicable.
Data Availability Statement
The data are not publicly available as they involve the subsequent application of other studies.
Acknowledgments
The authors would like to thank the editors and the anonymous reviewers for their valuable suggestions.
Conflicts of Interest
The authors declare no conflict of interest.
References
- Ansari, M.A.; Kurchaniya, D.; Dixit, M. A Comprehensive Analysis of Image Edge Detection Techniques. Int. J. Multimed. Ubiquitous Eng. 2017, 12, 1–12. [Google Scholar] [CrossRef]
- Hao, Z.; Wang, G.; Dang, X. Car-Sense: Vehicle Occupant Legacy Hazard Detection Method Based on DFWS. Appl. Sci. 2022, 12, 11809. [Google Scholar] [CrossRef]
- Wang, Y.; Fu, Q.; Lin, N.; Lan, H.; Zhang, H.; Ergesh, T. Identification and Classification of Defects in PE Gas Pipelines Based on VGG16. Appl. Sci. 2022, 12, 11697. [Google Scholar] [CrossRef]
- Lisowska, A. Efficient Edge Detection Method for Focused Images. Appl. Sci. 2022, 12, 11668. [Google Scholar] [CrossRef]
- Song, D.; Song I, S.; Kim, J.; Choi, J.; Lee, Y. Semantic Decomposition and Anomaly Detection of Tympanic Membrane Endoscopic Images. Appl. Sci. 2022, 12, 11677. [Google Scholar] [CrossRef]
- Nausheen, N.; Seal, A.; Khanna, P.; Halder, S. A FPGA based implementation of Sobel edge detection. Microprocess. Microsyst. 2018, 56, 84–91. [Google Scholar] [CrossRef]
- Masters, B.R.; Gonzalez, R.C.; Woods, R. Digital image processing. J. Biomed. Opt. 2009, 14, 029901. [Google Scholar]
- James, A.P.; Dimitrijev, S. Dimitrijev. Inter-image outliers and their application to image classification. Pattern Recognit. 2010, 43, 4101–4112. [Google Scholar] [CrossRef]
- Hu, X.; Liu, Y.; Wang, K.; Ren, B. Learning hybrid convolutional features for edge detection. Neurocomputing 2018, 313, 377–385. [Google Scholar] [CrossRef]
- Tjirkallis, A.; Kyprianou, A. Damage detection under varying environmental and operational conditions using Wavelet Transform Modulus Maxima decay lines similarity. Mech. Syst. Signal Process. 2016, 66–67, 282–297. [Google Scholar] [CrossRef]
- Kong, X. Analysis of Tunnel Monitoring Results Based on Modulus Maxima Method of Wavelet Transform. Int. Symp. Comput. Intell. Design. IEEE 2017, 1, 140–143. [Google Scholar]
- Gu, Y.; Lv, J.; Bo, J.; Zhao, B.; Zheng, K.; Zhao, Y.; Tao, J.; Qin, Y.; Wang, W.; Liang, J. An improved wavelet modulus algorithm based on fusion of light intensity and degree of polarization. Appl. Sci. 2022, 12, 3558. [Google Scholar] [CrossRef]
- Barr, M.; Serdean, C. Wavelet transform modulus maxima-based robust logo watermarking. IET Image Process. 2020, 14, 697–708. [Google Scholar] [CrossRef]
- Ding, W.; Li, Z. Research on adaptive modulus maxima selection of wavelet modulus maxima denoising. J. Eng. 2019, 2019, 175–180. [Google Scholar] [CrossRef]
- Shugar D, H.; Jacquemart, M.; Shean, D.; Bhushan, S.; Upadhyay, K.; Sattar, A.; Schwanghart, W.; McBride, S.; de Vries, M.V.W.; Mergili, M.; et al. A massive rock and ice avalanche caused the 2021 disaster at Chamoli, Indian Himalaya. Science 2021, 373, 300–306. [Google Scholar] [CrossRef]
- Goh, T.Y.; Basah, S.N.; Yazid, H.; Safar, M.J.A.; Saad, F.S.A. Performance analysis of image thresholding: Otsu technique. Measurement 2018, 114, 298–307. [Google Scholar] [CrossRef]
- Dutta, K.; Talukdar, D.; Bora, S.S. Segmentation of unhealthy leaves in cruciferous crops for early disease detection using vegetative indices and Otsu thresholding of aerial images. Measurement 2022, 189, 110478. [Google Scholar] [CrossRef]
- Gupta, N.; Khanna, P. A non-invasive and adaptive CAD system to detect brain tumor from T2-weighted MRIs using customized Otsu’s thresholding with prominent features and supervised learning. Signal Process. Image Commun. 2017, 59, 18–26. [Google Scholar] [CrossRef]
- Azeroual, A.; Afdel, K. Fast image edge detection based on faber schauder wavelet and otsu threshold. Heliyon 2017, 3, e00485. [Google Scholar] [CrossRef]
- Salem, N.; Sobhy N, M.; El Dosoky, M. A comparative study of white blood cells segmentation using otsu threshold and watershed transformation. J. Biomed. Eng. Med. Imaging 2016, 3, 15. [Google Scholar] [CrossRef]
- Muhuri, A.; Ratha, D.; Bhattacharya, A. Seasonal snow cover change detection over the Indian Himalayas using polarimetric SAR images. IEEE Geosci. Remote Sens. Lett. 2017, 14, 2340–2344. [Google Scholar] [CrossRef]
- Henley, C.; Maeda, T.; Swedish, T.; Raskar, R. Imaging behind occluders using two-bounce light. In Computer Vision–ECCV 2020: 16th European Conference, Glasgow, UK, 23–28 August 2020; Proceedings, Part XXIX 16; Springer International Publishing: Berlin/Heidelberg, Germany, 2020; pp. 573–588. [Google Scholar]
- Tan, C.; Elhattab, A.; Uddin, N. “Drive-by’’bridge frequency-based monitoring utilizing wavelet transform. J. Civ. Struct. Health Monit. 2017, 7, 615–625. [Google Scholar] [CrossRef]
- Huang, J.; Deng, T.; Cao, M.; Qian, X.; Bayat, M. A Feature of Mechanics-Driven Statistical Moments of Wavelet Transform-Processed Dynamic Responses for Damage Detection in Beam-Type Structures. Appl. Sci. 2022, 12, 11561. [Google Scholar] [CrossRef]
- Zhang, Y.; Han, J.; Jing, L.; Wang, C.; Zhao, L. Intelligent Fault Diagnosis of Broken Wires for Steel Wire Ropes Based on Generative Adversarial Nets. Appl. Sci. 2022, 12, 11552. [Google Scholar] [CrossRef]
- Mallat, S. , Hwang, W. Singularity detection and processing with wavelets. IEEE Trans. Inform. Theory 1992, 38, 617–643. [Google Scholar] [CrossRef]
- De Silva, D.D.N.; Fernando, S.; Piyatilake, I.T.S.; Karunarathne, A.V.S. Wavelet based edge feature enhancement for convolutional neural networks. In Proceedings of the Eleventh International Conference on Machine Vision (ICMV 2018), Munich, Germany, 1–3 November 2018; Volume 11041, pp. 751–760. [Google Scholar]
- Akagic, A.; Buza, E.; Omanovic, S.; Karabegovic, A. Pavement crack detection using Otsu thresholding for image segmentation. In Proceedings of the 2018 41st International Convention on Information and Communication Technology, Electronics and Microelectronics (MIPRO), Opatija, Croatia, 21–25 May 2018; pp. 1092–1097. [Google Scholar]
- Feng, Y.; Liu, Y.; Liu, Z.; Liu, W.; Yao, Q.; Zhang, X. A Novel Interval Iterative Multi-Thresholding Algorithm Based on Hybrid Spatial Filter and Region Growing for Medical Brain MR Images. Appl. Sci. 2023, 13, 1087. [Google Scholar] [CrossRef]
- Guo, L.; Wu, S. FPGA implementation of a real-time edge detection system based on an improved Canny algorithm. Appl. Sci. 2023, 13, 870. [Google Scholar] [CrossRef]
- Hong, S.; Jiang, Z.; Liu, L.; Wang, J.; Zhou, L.; Xu, J. Improved Mask R-CNN Combined with Otsu Preprocessing for Rice Panicle Detection and Segmentation. Appl. Sci. 2022, 12, 11701. [Google Scholar] [CrossRef]
- Qin, L.; Zhou, X.; Wu, X. Research on Wear Detection of End Milling Cutter Edge Based on Image Stitching. Appl. Sci. 2022, 12, 8100. [Google Scholar] [CrossRef]
- Oliva, D.; Abd Elaziz, M.; Hinojosa, S. Otsu’s between class variance and the tree seed algorithm. In Metaheuristic algorithms for Image Segmentation: Theory and Applications; 2019; pp. 71–83. [Google Scholar]
- Raja, N.S.M.; Sukanya, S.A.; Nikita, Y. Improved PSO based multi-level thresholding for cancer infected breast thermal images using Otsu. Procedia Comput. Sci. 2015, 48, 524–529. [Google Scholar] [CrossRef]
- Lin, C.H.; Ho, Y.K. Shannon information entropy in position space for two-electron atomic systems. Chem. Phys. Lett. 2015, 633, 261–264. [Google Scholar] [CrossRef]
- Vopson, M.M.; Robson, S.C. A new method to study genome mutations using the information entropy. Phys. A: Stat. Mech. Its Appl. 2021, 584, 126383. [Google Scholar] [CrossRef]
- Babichev, S.; Yasinska-Damri, L.; Liakh, I.; Škvor, J. Hybrid Inductive Model of Differentially and Co-Expressed Gene Expression Profile Extraction Based on the Joint Use of Clustering Technique and Convolutional Neural Network. Appl. Sci. 2022, 12, 11795. [Google Scholar] [CrossRef]
- Yu, Q.; Li, J.; Ji, S. Identity-Based and Leakage-Resilient Broadcast Encryption Scheme for Cloud Storage Service. Appl. Sci. 2022, 12, 11495. [Google Scholar] [CrossRef]
- Zhang, X.; Ouyang, T. Granular Description of Uncertain Data for Classification Rules in Three-Way Decision. Appl. Sci. 2022, 12, 11381. [Google Scholar] [CrossRef]
- Liu, W.; Yang, S.; Ye, Z.; Huang, Q.; Huang, Y. An image segmentation method based on two-dimensional entropy and chaotic lightning attachment procedure optimization algorithm. Int. J. Pattern Recognit. Artif. Intell. 2020, 34, 2054030. [Google Scholar] [CrossRef]
- Harte, J.; Newman, E.A. Maximum information entropy: A foundation for ecological theory. Trends Ecol. Evol. 2014, 29, 384–389. [Google Scholar] [CrossRef]
- Wang, Z.; Bovik, A.C.; Sheikh, H.R.; Simoncelli, E.P. Image Quality Assessment: From Error Visibility to Structural Similarity. IEEE Trans. Image Process. 2004, 13, 600–612. [Google Scholar] [CrossRef]
- Nilsson, J.; Akenine-Mller, T. Understanding SSIM. arXiv 2020, arXiv:2006.13846. [Google Scholar]
- Zheng, J.; Gao, Y.; Zhang, H.; Lei, Y.; Zhang, J. OTSU Multi-Threshold Image Segmentation Based on Improved Particle Swarm Algorithm. Appl. Sci. 2022, 12, 11514. [Google Scholar] [CrossRef]
- Vijayalakshmi, D.; Nath M, K.; Acharya, O.P. A comprehensive survey on image contrast enhancement techniques in spatial domain. Sens. Imaging 2020, 21, 40. [Google Scholar] [CrossRef]
- Verma, P.K.; Singh, N.P.; Yadav, D. Image enhancement: A review. Ambient. Commun. Comput. Syst. RACCCS 2019, 2020, 347–355. [Google Scholar]
- Dogra, A.; Goyal, B.; Agrawal, S. From multi-scale decomposition to non-multi-scale decomposition methods: A comprehensive survey of image fusion techniques and its applications. IEEE Access 2017, 5, 16040–16067. [Google Scholar] [CrossRef]
- Abderrahim, L.; Salama, M.; Abdelbaki, D. Novel design of a fractional wavelet and its application to image denoising. Bull. Electr. Eng. Inform. 2020, 9, 129–140. [Google Scholar] [CrossRef]
- Zhang, Q.; Shen, S.; Su, X.; Guo, Q. A novel method of medical image enhancement based on wavelet decomposition. Autom. Control. Comput. Sci. 2017, 51, 263–269. [Google Scholar] [CrossRef]
|
Disclaimer/Publisher’s Note: The statements, opinions and data contained in all publications are solely those of the individual author(s) and contributor(s) and not of MDPI and/or the editor(s). MDPI and/or the editor(s) disclaim responsibility for any injury to people or property resulting from any ideas, methods, instructions or products referred to in the content. |
© 2023 by the authors. Licensee MDPI, Basel, Switzerland. This article is an open access article distributed under the terms and conditions of the Creative Commons Attribution (CC BY) license (http://creativecommons.org/licenses/by/4.0/).
