Introduction
Uric acid, 7, 9-dihydro-1H-purine-2, 6, 8 (3H)-trione, is a heterocyclic organic compound possessing 168 Da molecular mass. It is the final oxidation product of purine metabolism and acts as an endogenous antioxidant. It scavenges hydroxyl radicals, singlet oxygen and peroxyl radicals (Sautin and Johnson, 2008). However, abnormally high concentration of uric acid in biological fluids is associated with hyperuricemia, gouty arthritis and urate crystals deposition in kidneys (Schumacher, 1996; Kramer and Curhan, 2002; Maiuolo et al., 2016). It is an important biomarker of various diseases. Furthermore, it has been reported that uric acid is used as API in anti-gout homeopathic medicines such as Acid Uric 3x Tablet. Such medicines are often much diluted tinctures that contain APIs in very low amount (Shaukat et al., 2020). This necessitates sensitive analytical methods that can quantify APIs in homeopathic medicines. The development of simple and sensitive analytical methods of homeopathic medicines may be helpful in their quality control and stability studies.
The literature review indicated several methods for the determination of uric acid using various analytical techniques. The reported methods included enzyme-catalyzed oxidation to induce chromophore, colorimetry involving various reagents, electrochemical detection utilizing electrodes and biosensors and reversed phase HPLC (Jelikic et al., 2003; Dai et al., 2007; Piermarini et al., 2013; Tanaka et al., 2013). Uric acid has been determined in serum (Trinder, 1968, Montaseri et al., 2014; Motshakeri et al., 2018), saliva (Inoue et al., 2003), wheat flour (Venkat et al., 1960) and milk as well as orange juice (Zuo et al., 2015). Most of the reported methods were laborious and involved the use reagents which were carcinogenic (Czauderna and Kowalczyk, 1997; Chen et al., 1998; Jelikic et al., 2003). Hence, there was a need to develop method using UV/Visible spectroscopy that could be used for quality control Acid Uric 3x Tablet in less equipped homeopathic manufacturing laboratories. Therefore, the present study aimed to develop colorimetric methods, that may be employed for the quality control of the selected homeopathic anti-gout medicine (Acid Uric 3X Tablet).
Material and methods
Uric acid (Difco Laboratories, USA), Acid Uric 3x Tablet (Batch No 25, BM Homeo Pakistan), Nitric acid (BDH Laboratory supplies, England), sodium dihydrogen phosphate, disodium hydrogen phosphate, analytical grade methanol, hexane (Sigma Aldrich, Gmbh), potassium ferrocyanide trihydrate, ferric chloride, butanol. Silica gel (mesh size 60 to 120) and silica gel TLC plates 60 F254 (20 × 20 cm) of Merck KGaA, Darmstadt, Germany. The solvents used included acetic acid (Merck, Germany) and double distilled water.
Double beam UV/Visible spectrophotometer (Model-2550, Shimadzu Scientific Instruments, USA, equipped with Operating system UV Probe 2.21), Fourier Transform Infrared Spectrophotometer (IR Tracer-100, Shimadzu Japan), were used in the current study. Other equipment used included pH meter (WTW series, Ino lab), ultrasonicator (Memmert, Germany).
Standard stock solution of uric acid having concentration of 5 mg/mL was prepared in 1% sodium acetate solution. Then, a range working standard solutions (5.0-240 µg/mL) was prepared from the standard stock solution.
Potassium ferrocyanide test solution was prepared by dissolving 100 mg potassium ferrocyanide in 50 mL distilled water. Ferric chloride test solution was prepared by dissolving 162 mg ferric chloride in 50 mL HCl (0.1N). Both the solutions were stored in tightly capped container and protected from light and heat.
Uric acid (20 mg) was moistened with 70% concentrated nitric acid (0.5 mL) in china dish. The resulting mixture was kept in an oven at 100ºC temperature for 20 min till the appearance of pink color. This acid-treated uric acid was then added in a test tube containing a mixture of 2 mL each of potassium ferrocyanide and ferric chloride solutions which gave a solution of uric acid (5 mg/mL). A blank was made by mixing equal volume of potassium ferrocyanide and ferric chloride test solutions. Ten Acid Uric 3x Tablets were powdered and an amount one tablet (250 mg) was taken in a china dish and treated as mentioned in standard solution derivatization.
Both derivatized and un-derivatized uric acid solutions were applied on TLC plates by glass capillary and allowed to dry. The plate was developed using a solvent mixture of methanol, hexane, butanol, acetic acid and water (6:1:1:1:1 v/v/v/v). Then, the plate was dried using hot-air chromoplate was visualized under UV light to confirm derivatization.
The derivatized uric acid solution was scanned in wavelength ranging 800-200 nm using blank. The spectrum was used to determine λmax and compare the absorption profile of un-derivatized sample.
One milliliter derivitized reaction mixture was eluted through column (2.8 cm long, 2.1 cm external diameter and 1.5 cm internal diameter) packed with slurry of activated silica gel (mesh size 70 µm) using the mobile phase (used for TLC). Eluted samples (1-2 mL) were collected separately in test tube, labelled and then spotted over TLC plate. The chromatogram is developed using mobile phase methanol: hexane: butanol: acetic acid: water (6:1:1:1:1 v/v/v/v) and calculated the Rf value of the developed spot. The fractions with the same Rf values were pooled together and scanned in wavelength range 800-200 nm. The spectrum obtained was used to determine λmax. The fraction was evaporated to dryness and subjected to IR analysis for comparison of spectra of underivitized and derivatized uric acid.
Method validation
Linearity
The standard solutions having concentration range of 5.0-240 µg/mL were analyzed in triplicates at 411 nm. The linearity was observed by visual observation of the calibration curve and correlation of the data points was evaluated by determining the correlation coefficient (R2).
Working standard solutions containing uric acid (5.0-80.0 µg/mL), were analyzed in quintuplicate and peak area of each standard was plotted against concentration. Mean slope and standard deviation of each plot were used to determine LOD and LOQ statistically using the following equations:
For recovery, lactose (10 mg) was spiked with 1 mL of each of the three mixed working standard solutions (10, 20 and 40 µg/mL). Un-spiked samples were treated in a similar procedure to prepare respective blanks. The spiked and un-spiked samples were analyzed in triplicate, and their concentrations were determined using calibration curve. The calculated amount was then compared with the spiked amount to assess recovery. For intra-day accuracy and precision, each of the three mixed standard solution (10, 20 and 40 µg/mL) was analyzed 6 times in the same day, while for inter-day accuracy and precision each of the solutions was analyzed once daily for 6 consecutive days. The amount of each standard was determined from calibration curves, constructed on each day, and was compared with the true value to determine accuracy, whereas the RSD of the six readings was taken to find precision.
The Acid Uric Tablet was derivitized as mentioned in uric acid derivitization section. The amount of uric acid in sample was determined from the linear regression equation, obtained from the standard calibration curve.
Results and Discussion
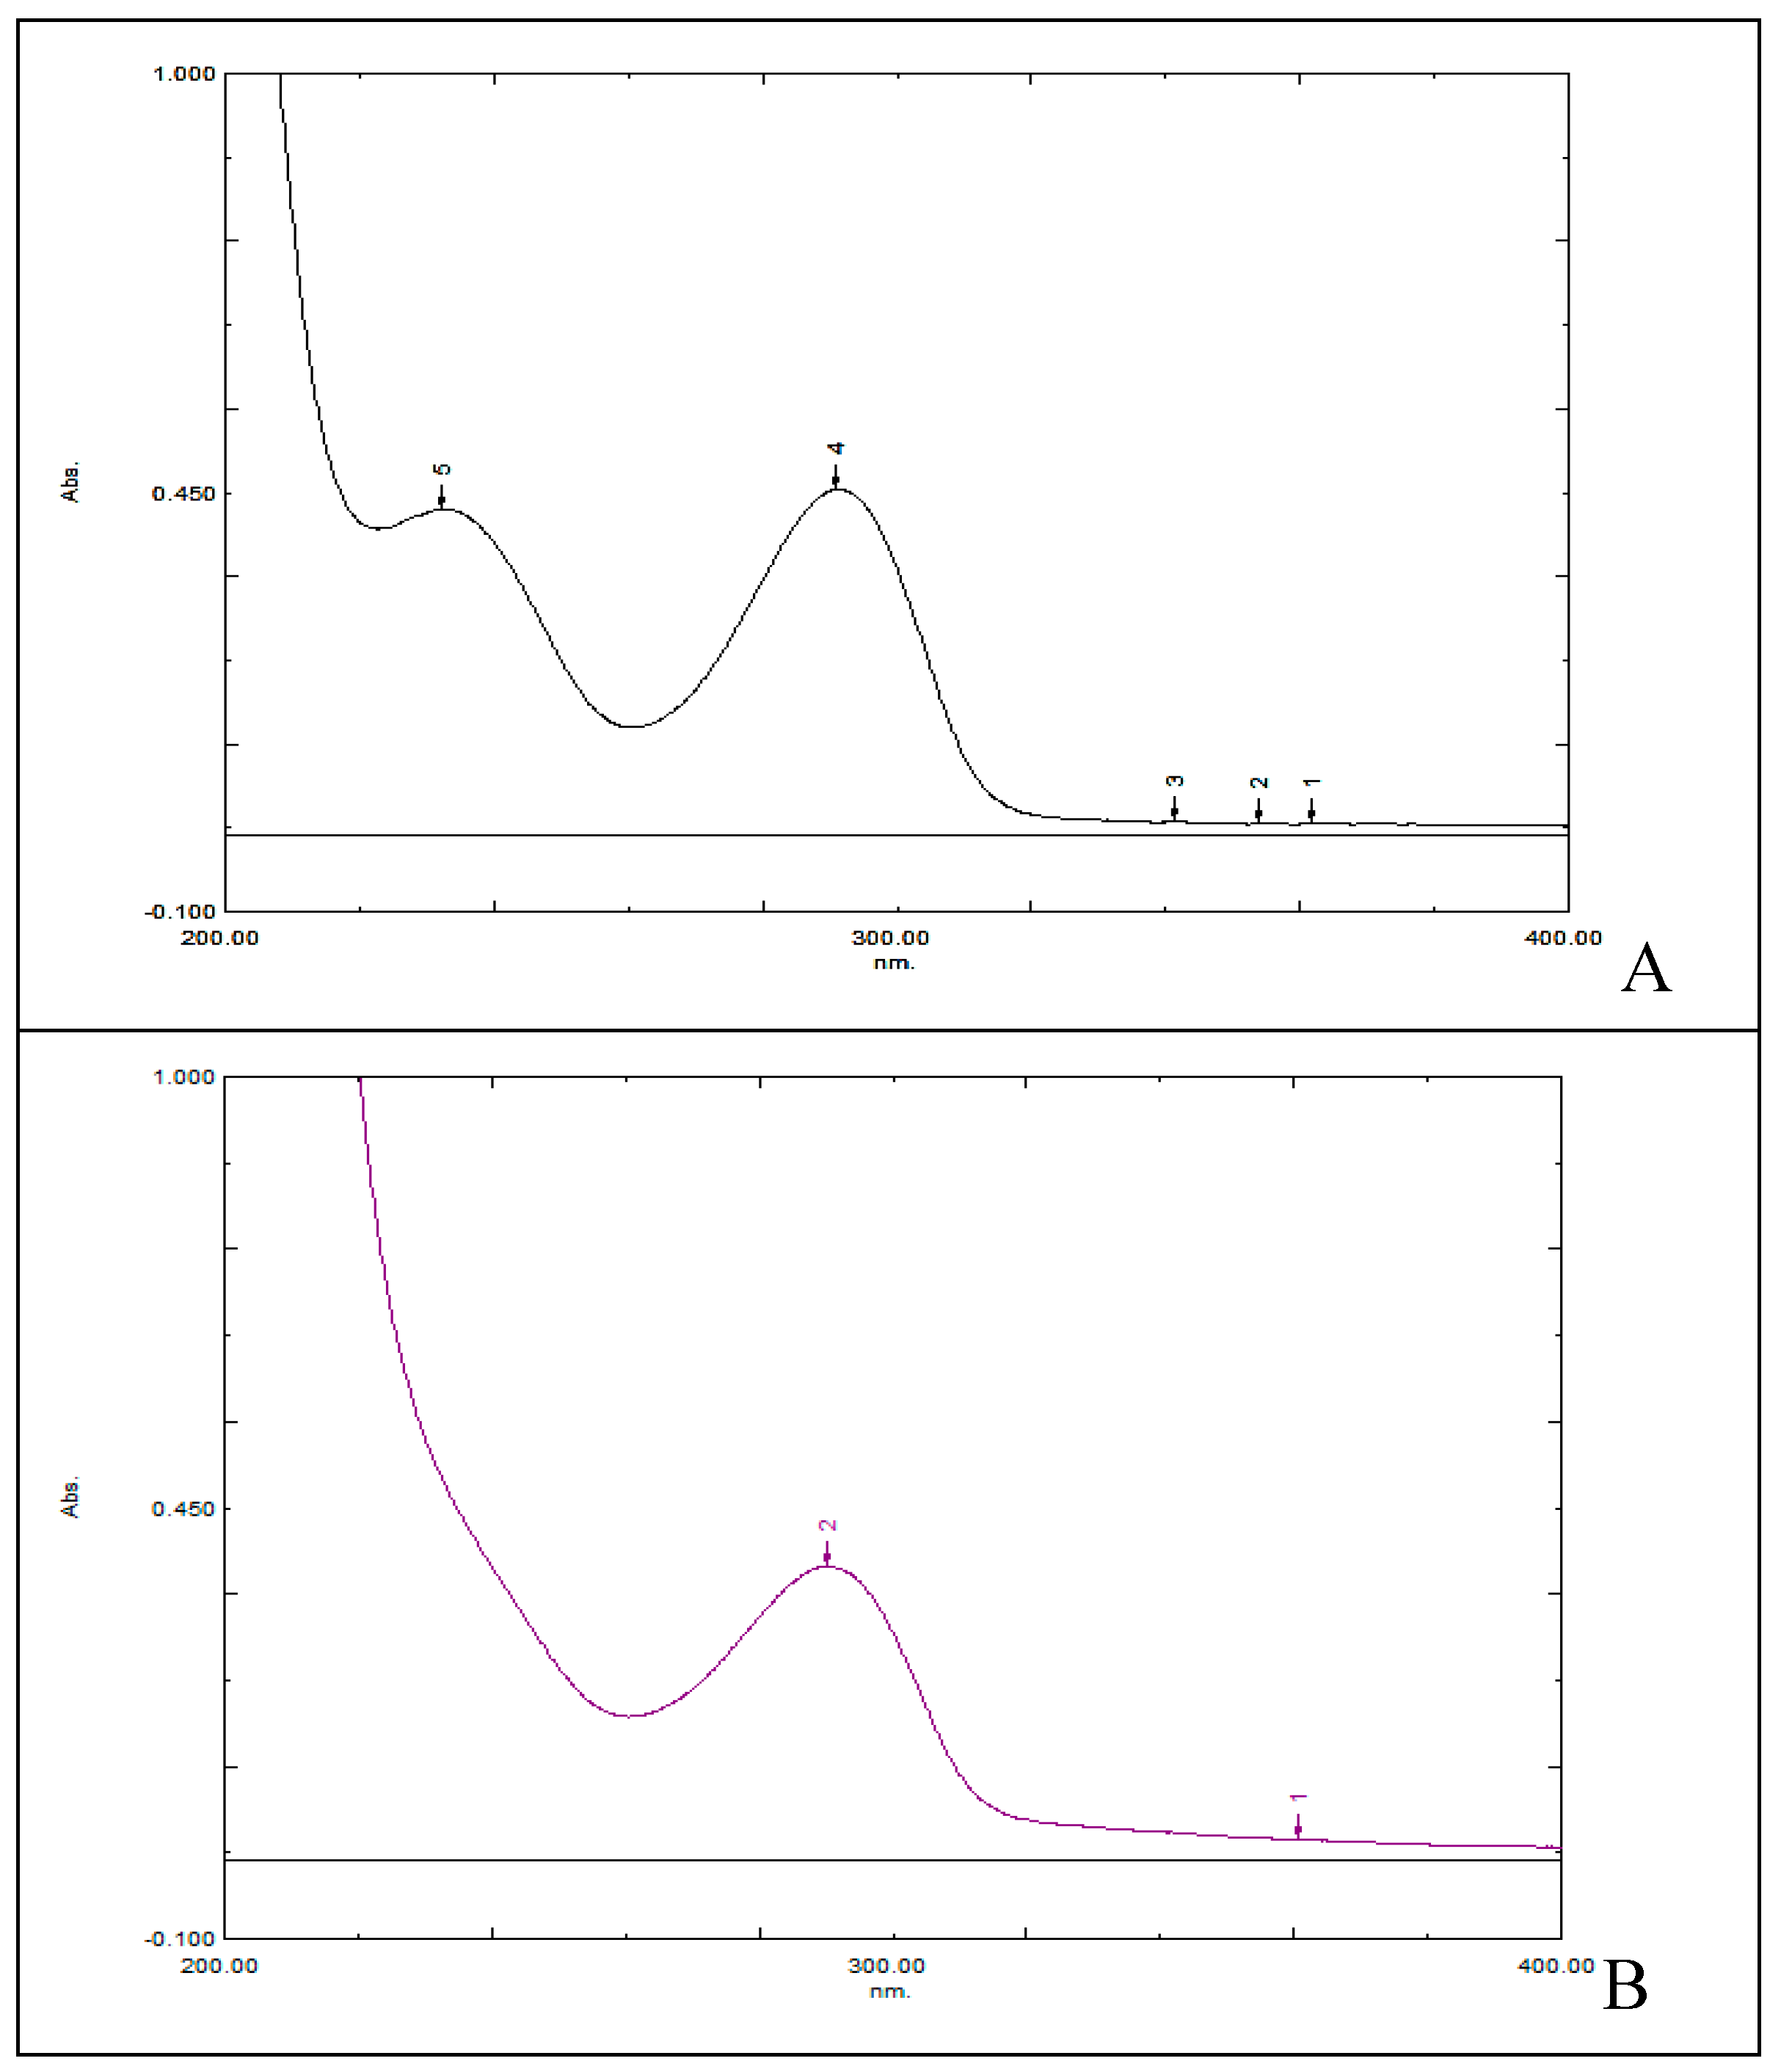
The spectrum of un-derivatized uric acid and Acid Uric 3x Tablet solutions are given in
Figure 1. These results indicated that uric acid absorbs maximum at 295 nm.
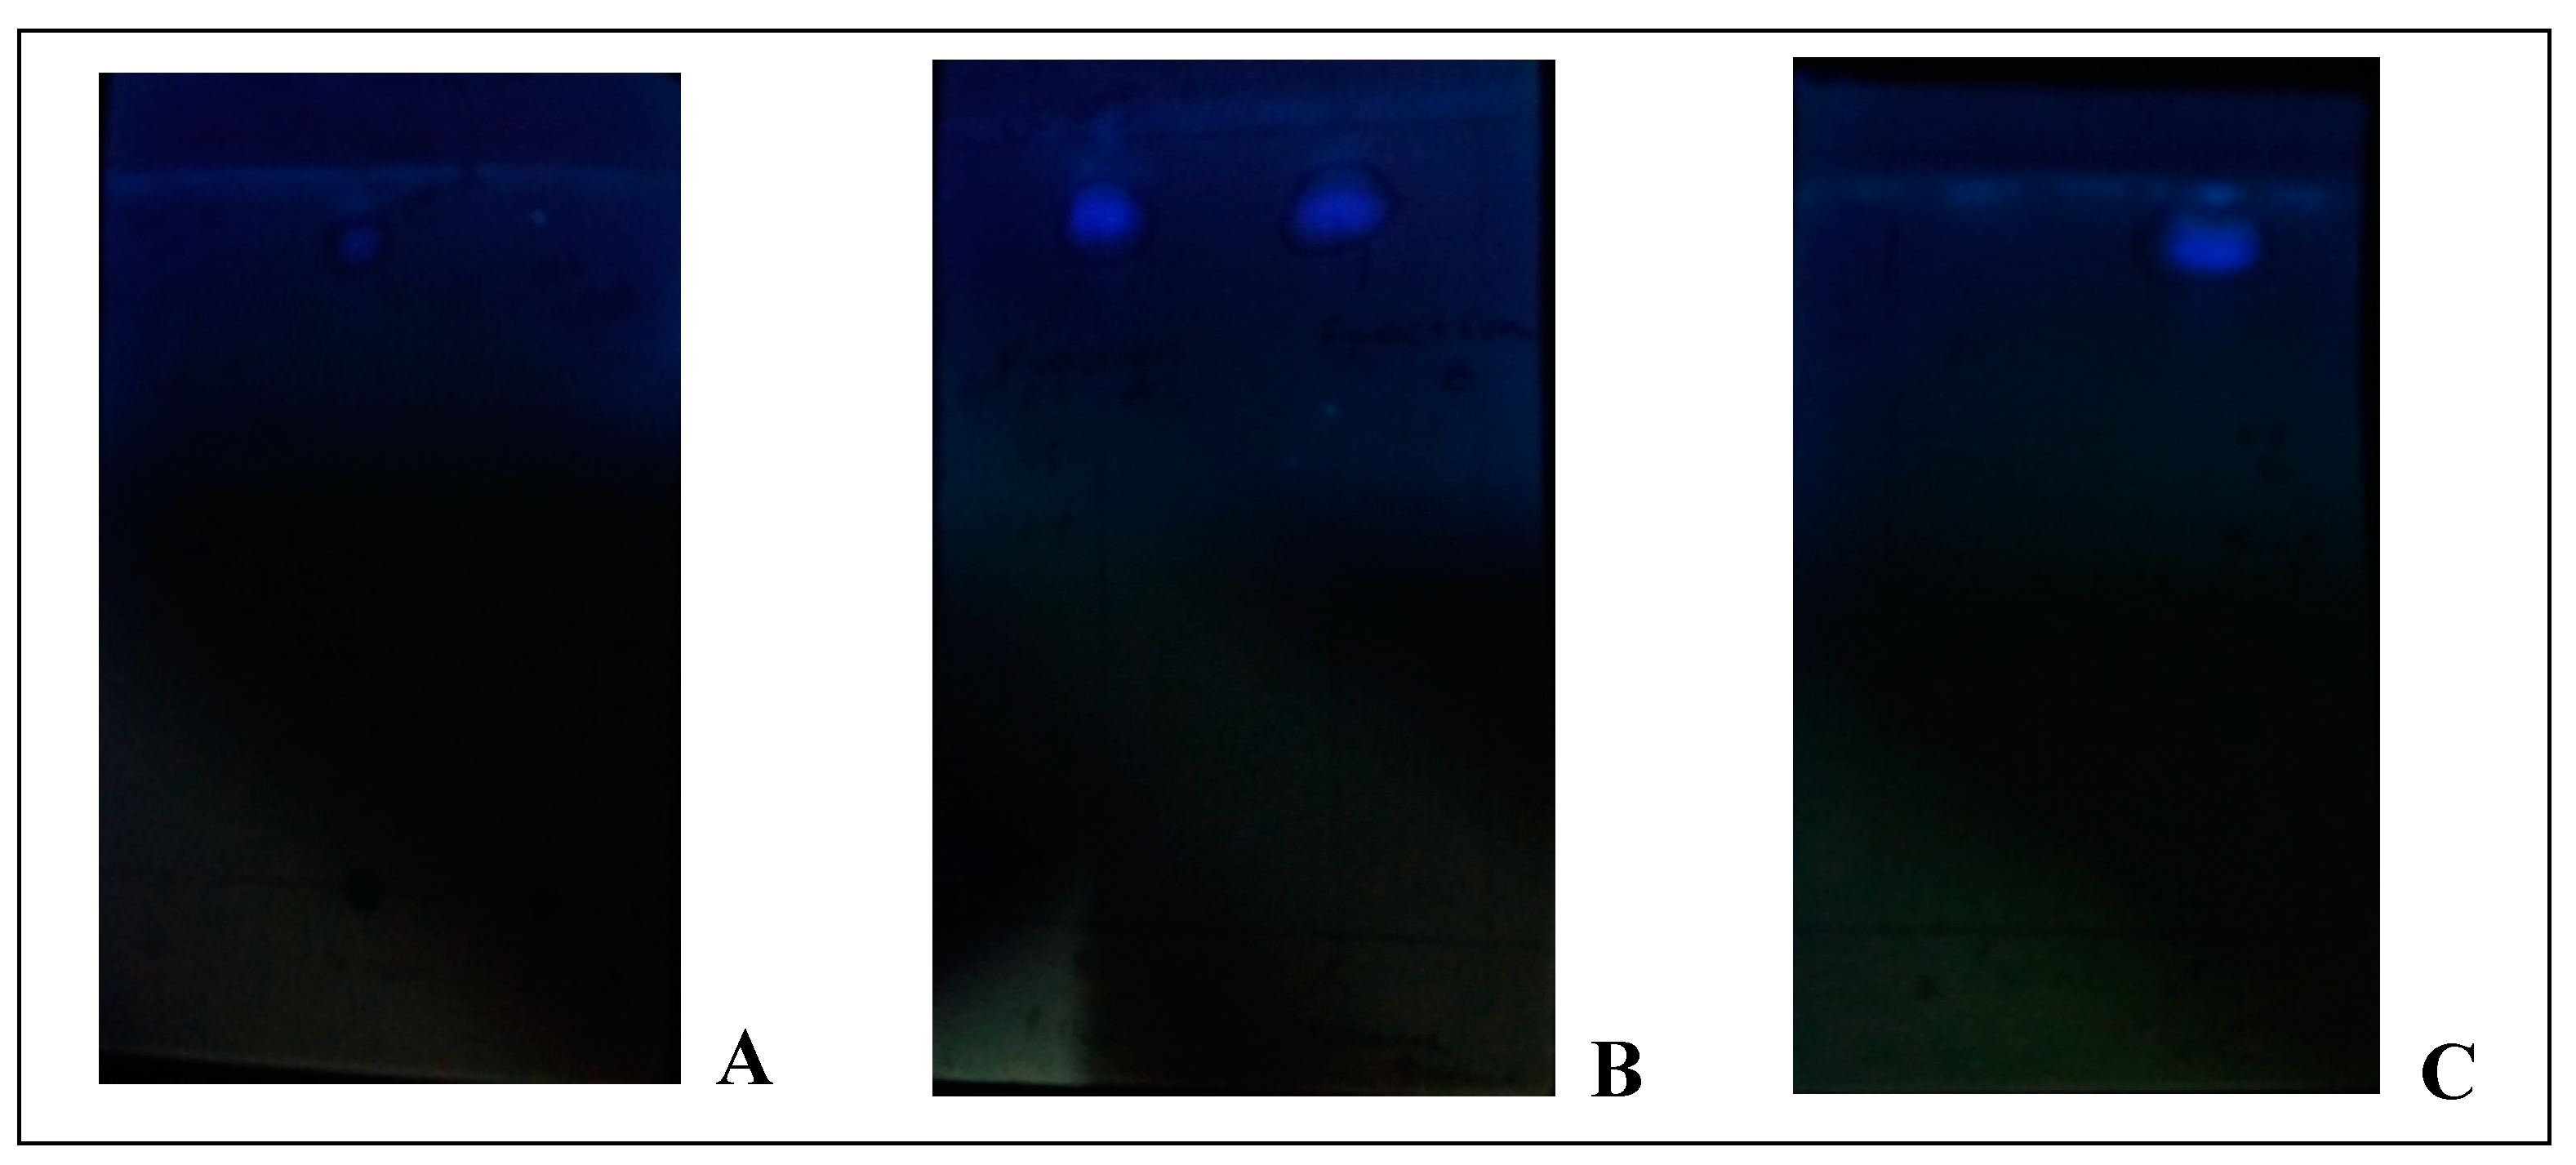
The derivitized sample gave single spot on TLC plate visible at 365 nm giving R
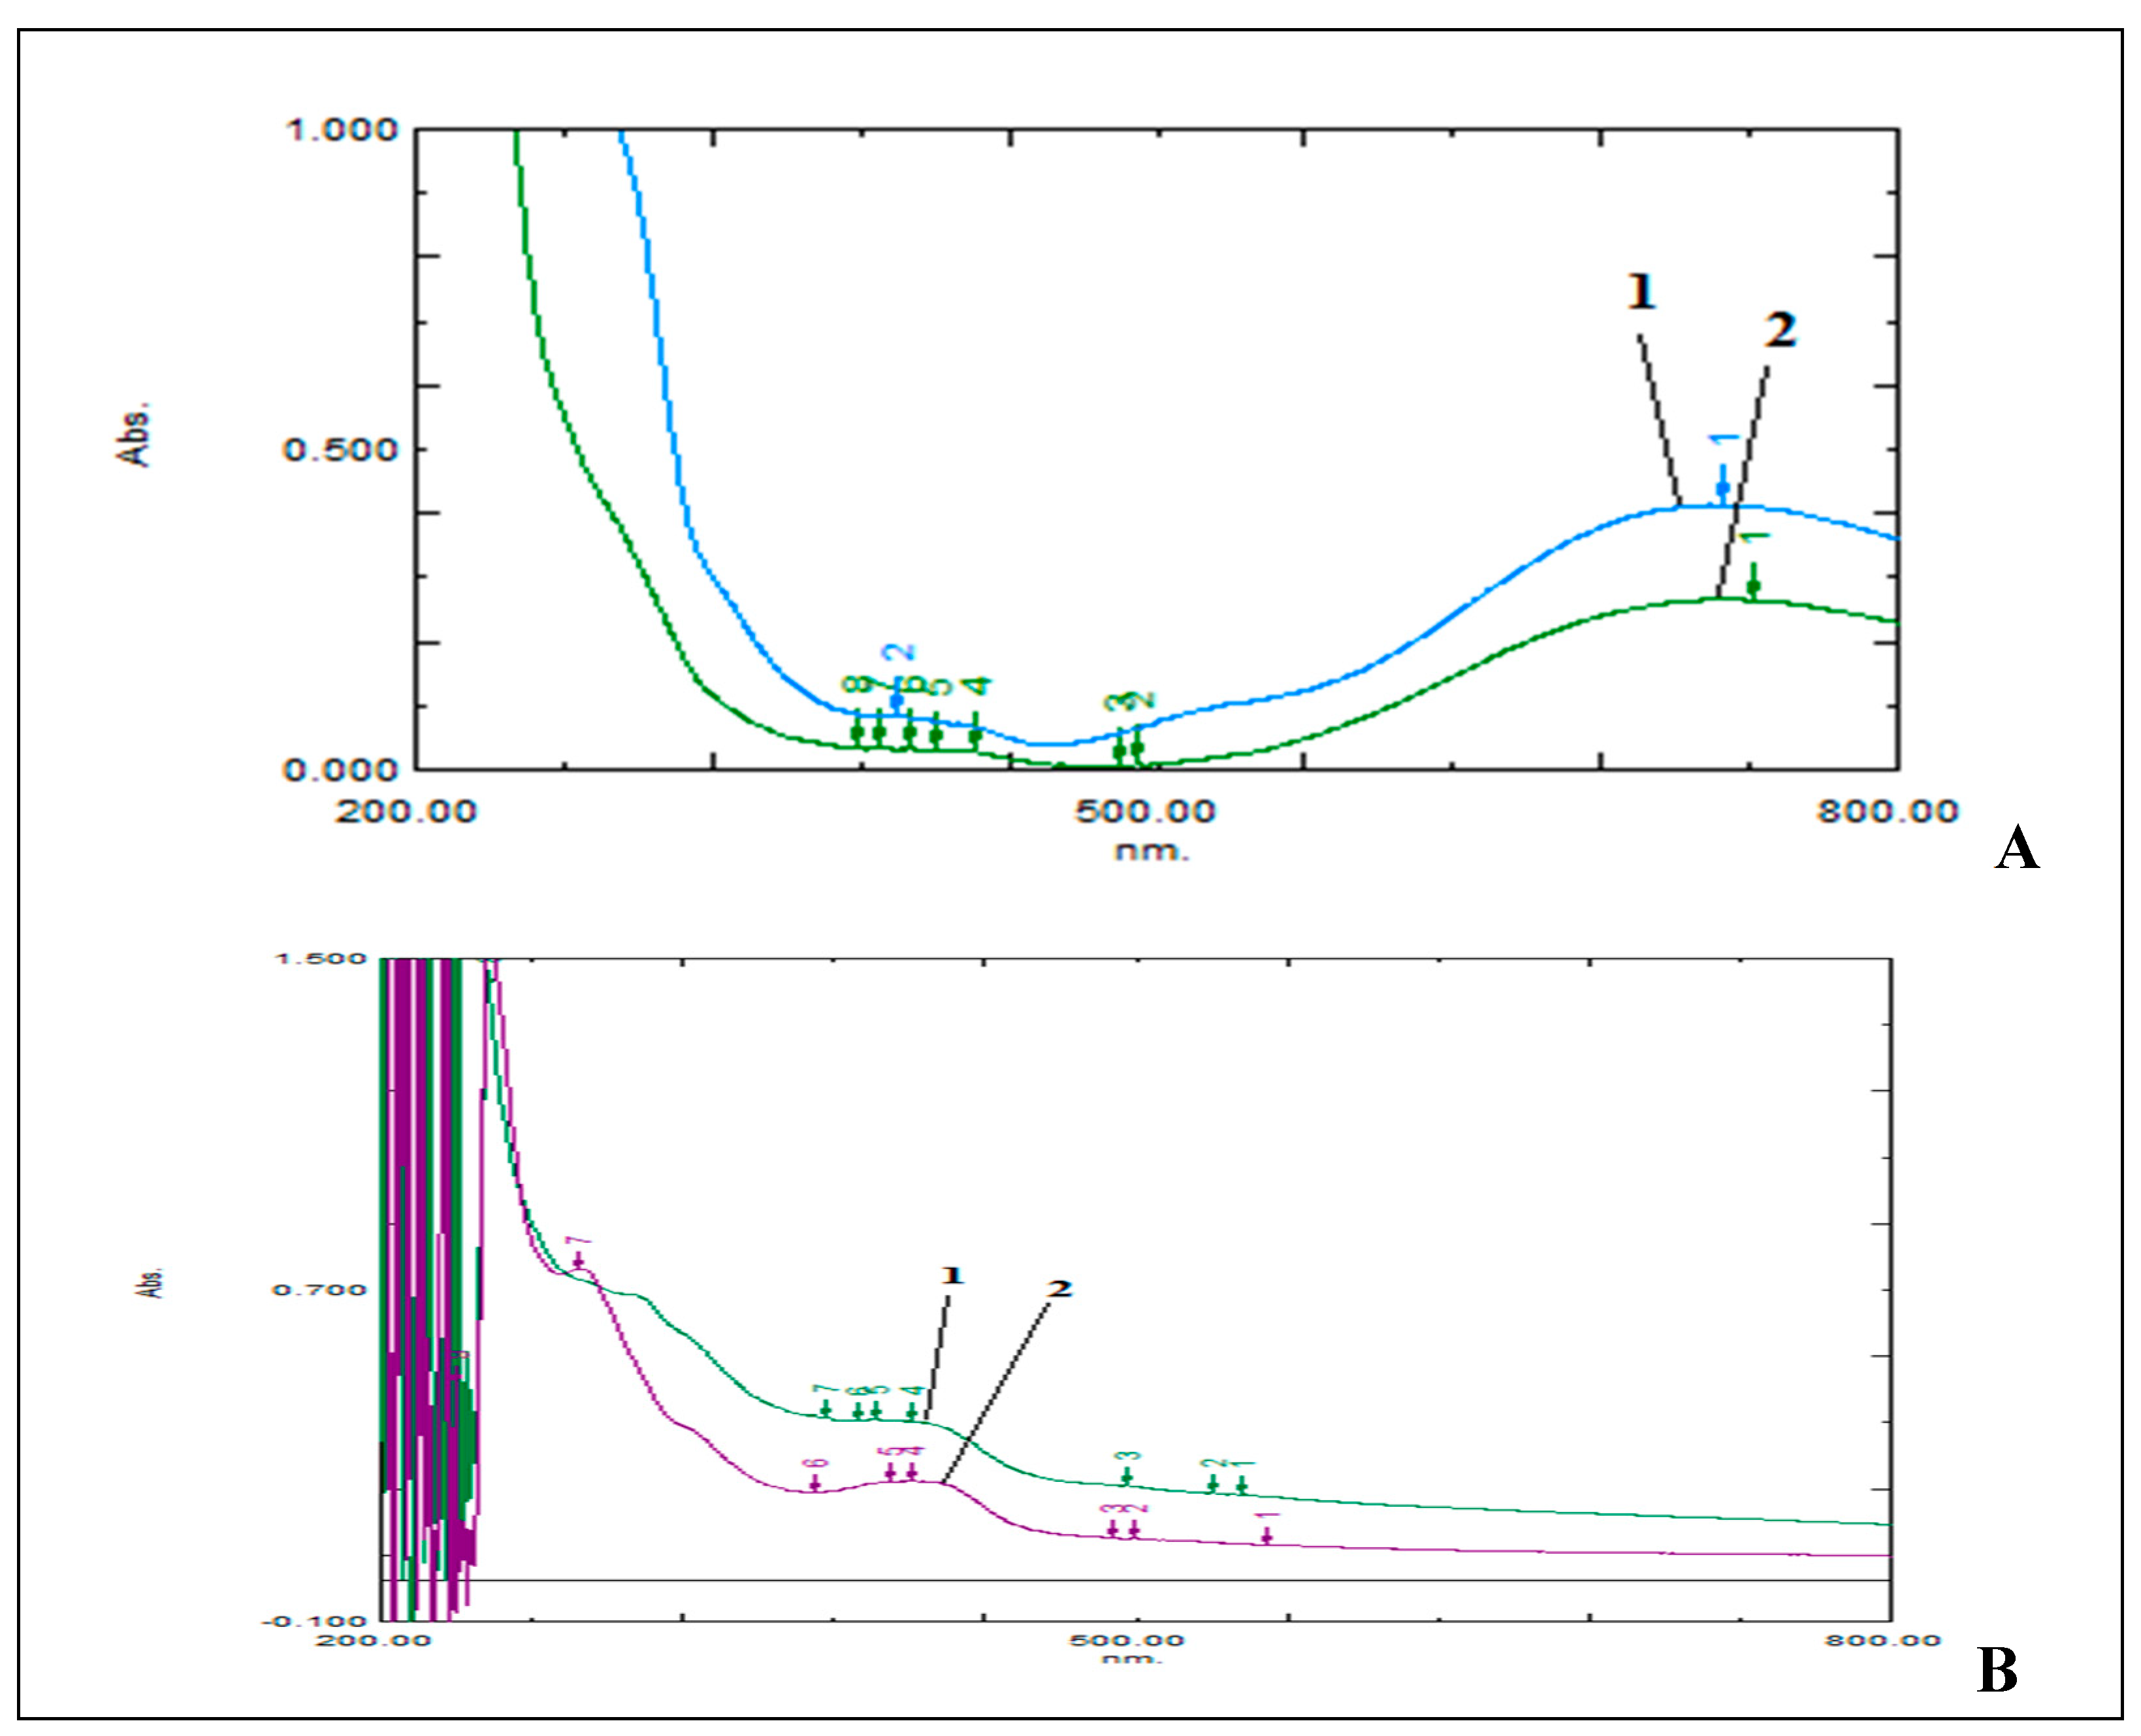
f value 0.8 while blank and standard solution gave no spot on TLC (Chromoplate 1), hence indicating that the reagent mixture derivitized the sample. This derivitized sample and blank reagent gave maximum absorbance at same wavelength 729 nm, hence indicating reagent interference (
Figure 2A). So, to remove reagent interference and isolate uric acid derivative, the sample was eluted through column of suitable dimension. The isolated fraction when scanned in wavelength range 800-200 nm gave maximum absorbance at 411 nm. Similarly procedure was followed for Acid Uric Tablet and sample derivative so formed gave scan at same wavelength as that of standard (
Figure 2B).
Chromoplate 1.
Flourescent spot of uric acid derivative at 365 nm and no spot of standard and reagent blank (right and left of chromplate A) (A), fluorescent spots of derivative in column fractions (B), fluorescent spot after pooling of column fractions having same Rf value (C).
Chromoplate 1.
Flourescent spot of uric acid derivative at 365 nm and no spot of standard and reagent blank (right and left of chromplate A) (A), fluorescent spots of derivative in column fractions (B), fluorescent spot after pooling of column fractions having same Rf value (C).
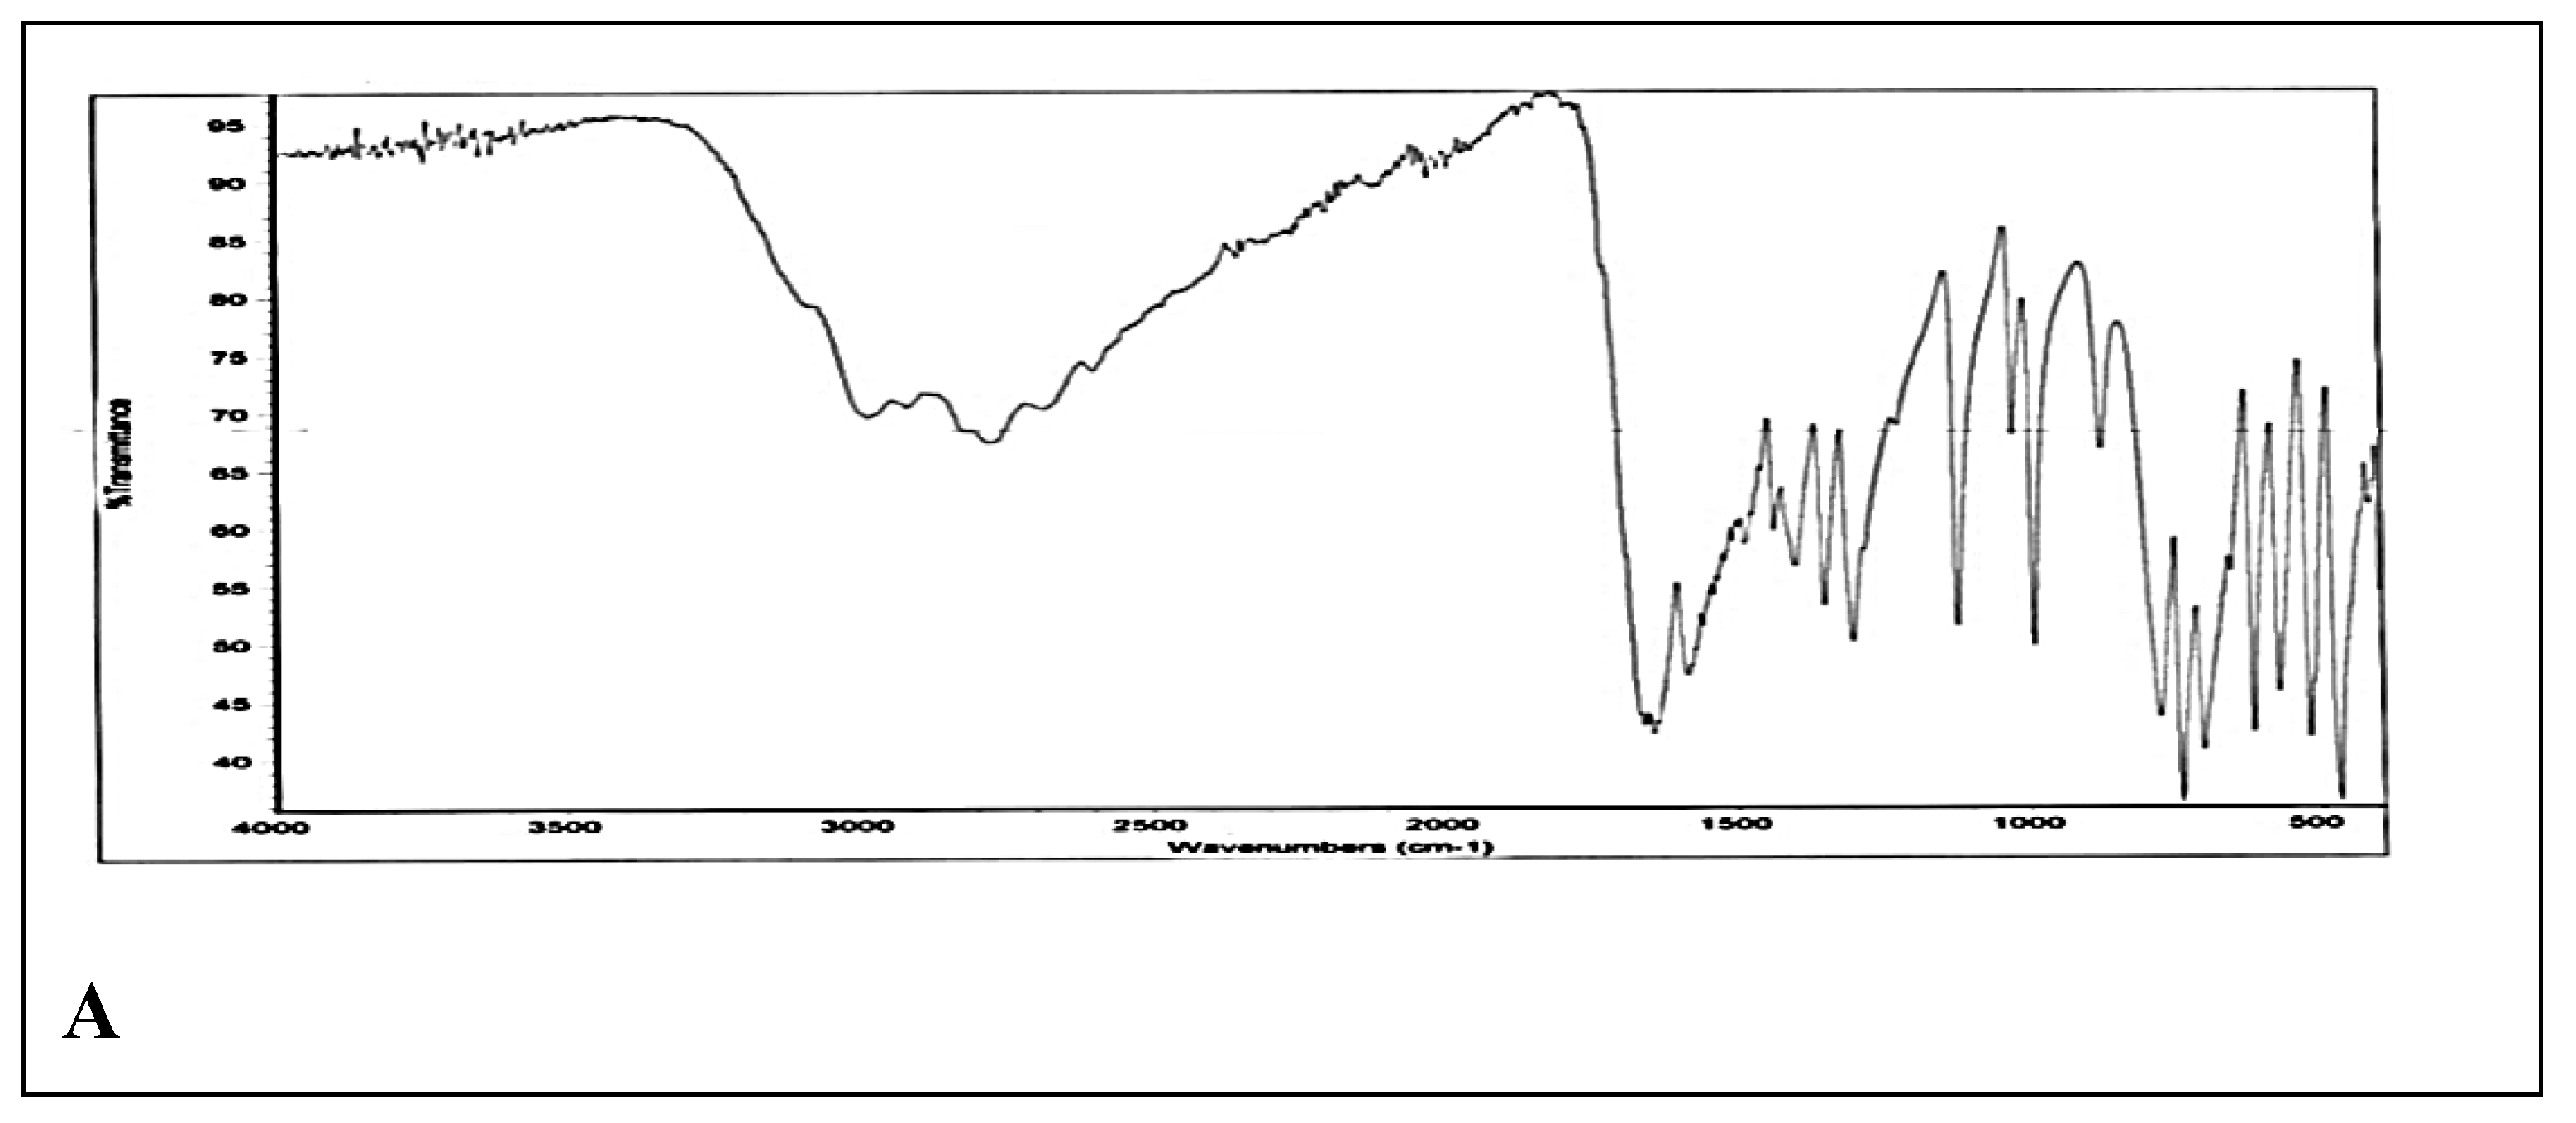
The FTIR spectra of standard uric acid and derivitized uric acid are compared and interpretated. The standard spectra showed C=O stretching vibrations between 1870-1550 cm
-1 thus indicating the presence of keto group in standard. OH stretching between 3700-3000 cm
-1 indicated the presence of OH group, thus this stretching frequency may be due to tautomeric (enol) form of uric acid. C=C stretching between 1600-1450 cm
-1 indicated presence of unsaturation in compound. NH stretching observed between 3400-3200 cm
-1 (
Figure 3A). On the other hand, spectra of derivitized uric acid showed the presence of primary amine depicted by two bands between 3500-3200 cm
-1. Moreover, transmittance peak at 1715 cm
-1 showed presence of keto group (
Figure 3B). Moreover there is C-N stretch at 1277 cm
-1 and C-O stretch between 1000-1300 cm
-1 (Socrates, 2004).
Validation of method
Linearity
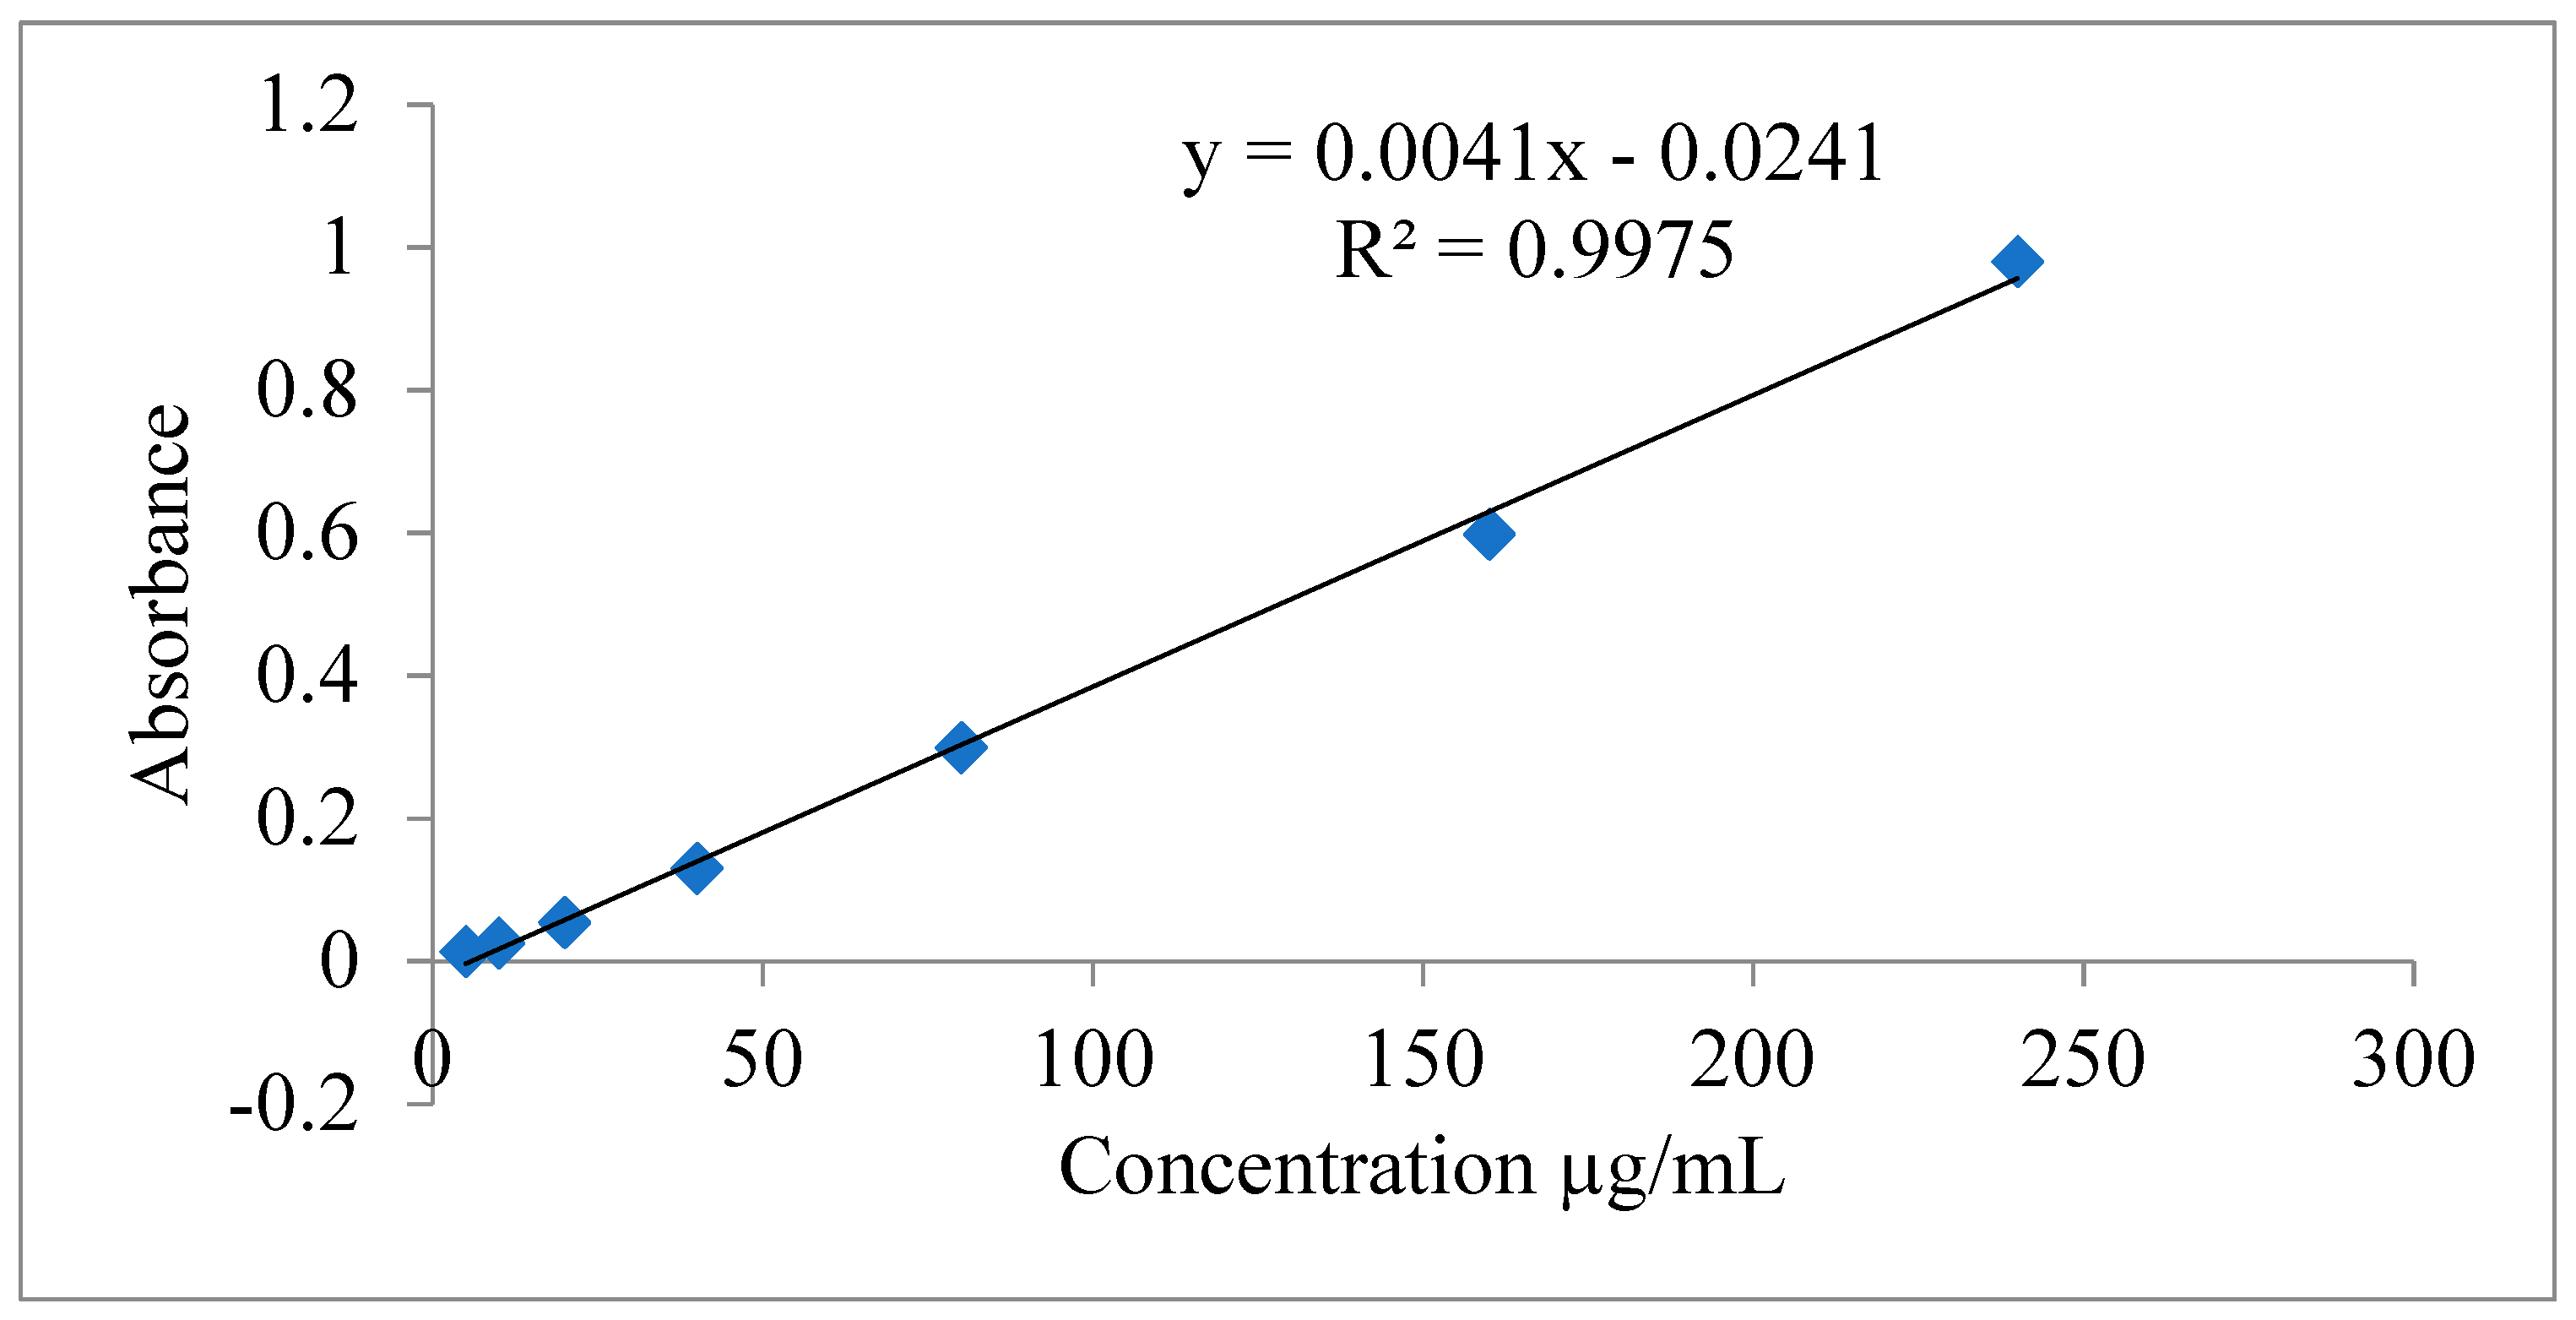
The plot of concentration versus absorbance is given in
Figure 4 which shows that the method linear over the whole range investigated (5.0-240.0 µg/mL). The linear regression equation was found to be Y=0.0041x - 0.0241 with (R
2 =0.9975). This indicated that method was linear and obeyed the Beer’s Law in a concentration range 5.0-240.0 µg/mL. Hence, the samples falling in this range can be quantified using the method.
The results of LOD and LOQ determination using the method are given in
Table 1. These results indicate that method is having reasonably good sensitivity (LOD = 0.75 µg/mL and LOQ = 2.5 µg/mL. Hence, the method can be used to quantify uric acid, if found at equal of higher to LOQ value.
The results of recovery, intraday and inter-days precision and accuracy of the developed method are given in
Table 2. The recovery was found to be 95.7-108.2% with relative standard deviation RSD less than 5% which indicated the method was reliable. Intra-day and inter-day accuracy values were 97.01-107.4% and 99.45-107.8% with relative standard deviation less than 5%, which indicated that the method is repeatable as well as reproducible.
The unknown concentration of uric acid in homeopathic tablet was determined from absorbance of sample and regression equation of standard calibration curve. Uric acid content calculated in homeopathic uric acid tablet (after derivitization) is calculated out to be 0.20 mg per tablet.
Conclusion
The described colorimetric method is a novel involving derivitization of uric acid in homeopathic tablet (Acid Uric 3x Tablet) and may be used in routine quality control in less equipped laboratories.
Acknowledgements
Corresponding author would like to acknowledge Punjab University College of Pharmacy, Punjab University, Pakistan for provision of necessary research facilities during the study.
Conflict of interest
There is no conflict of interest.
References
- Chen, X. B., Calder. Determination of 15N isotopic enrichment and concentrations of allantoin and uric acid in urine by gas chromatography/mass spectrometry. Journal of Mass Spectrometry 1998, 33, 130–137. [Google Scholar] [CrossRef]
- Czauderna, M., & Kowalczyk. Simultaneous determination of purine derivatives in urine by high-performance liquid chromatography. Journal of Animal and Feed Sciences 1996, 5, 433–439. [Google Scholar] [CrossRef]
- Dai, X., Fang. Determination of serum uric acid using high-performance liquid chromatography (HPLC)/isotope dilution mass spectrometry (ID-MS) as a candidate reference method. Journal of Chromatography B 2007, 857, 287–295. [Google Scholar] [CrossRef]
- Inoue, K., Namiki. Determination of uric acid in human saliva by high-performance liquid chromatography with amperometric electrochemical detection. Journal of Chromatography B 2003, 785, 57–63. [Google Scholar] [CrossRef] [PubMed]
- Jelikić-Stankov, M. D., Đurđević. Determination of uric acid in human serum by an enzymatic method using N-methyl-N-(4-aminophenyl)-3-methoxyaniline reagent. Journal of the Serbian Chemical Society 2003, 68, 691–698. [Google Scholar] [CrossRef]
- Kramer, H. M., & Curhan. The association between gout and nephrolithiasis: the National Health and Nutrition Examination Survey III, 1988-1994. American Journal of Kidney Diseases 2002, 40, 37–42. [Google Scholar] [CrossRef] [PubMed]
- Maiuolo, J., Oppedisano. Regulation of uric acid metabolism and excretion. 2016, 213, 8–14. [Google Scholar] [CrossRef] [PubMed]
- Montaseri, H., Khajehsharifi. UV determination of epinephrine, uric acid, and acetaminophen in pharmaceutical formulations and some human body fluids using multivariate calibration. Química Nova 2014, 37, 1404–1409. [Google Scholar] [CrossRef]
- Motshakeri, M., Travas-Sejdic. Rapid electroanalysis of uric acid and ascorbic acid using a poly (3, 4-ethylenedioxythiophene)-modified sensor with application to milk. Electrochimica Acta 2018, 265, 184–193. [Google Scholar] [CrossRef]
- Piermarini, S., Migliorelli. Uricase biosensor based on a screen-printed electrode modified with Prussian blue for detection of uric acid in human blood serum. Sensors and Actuators B: Chemical 2013, 179, 170–174. [Google Scholar] [CrossRef]
- Sautin, Y. Y., & Johnson. Uric acid: the oxidant-antioxidant paradox. Nucleosides, Nucleotides, and Nucleic Acids 2008, 27, 608–619. [Google Scholar] [CrossRef] [PubMed]
- Schumacher Jr, H. R. Crystal-induced arthritis: an overview. The American Journal of Medicine 1996, 100, 46S–52S. [Google Scholar] [CrossRef] [PubMed]
- Shaukat, A., Hussain. Acid Uric 3× Tablet: Standardization and pharmacological evidence of uric acid use as anti-gout medicine. Journal of Pharmacy and Pharmacognosy Research 2020, 8, 501–514. [Google Scholar] [CrossRef] [PubMed]
- Tanaka, R., Miyata. An improved, highly sensitive HPLC-based method for determining uric acid levels in microliter plasma volumes. Gout and Nucleic Acid Metabolism 2013, 37, 117–125. [Google Scholar] [CrossRef]
- Trinder, P. Determination of Uric Acid in Plasma Using UV Spectrophotometry without Uricase. Proceedings of the Association of Clinical Biochemists 1968, 5, 58. [Google Scholar] [CrossRef]
- Venkat Rao, S., Krishnamurthy. Determination of uric acid in wheat flour infested by Tribolium castaneum Duv. using paper chromatography. Cereal Chemistry 1960, 37, 93–96. [Google Scholar]
- Zuo, R., Zhou. Determination of creatinine, uric and ascorbic acid in bovine milk and orange juice by hydrophilic interaction HPLC. 2015, 182, 242–245. [Google Scholar] [CrossRef] [PubMed]
|
Disclaimer/Publisher’s Note: The statements, opinions and data contained in all publications are solely those of the individual author(s) and contributor(s) and not of MDPI and/or the editor(s). MDPI and/or the editor(s) disclaim responsibility for any injury to people or property resulting from any ideas, methods, instructions or products referred to in the content. |
© 2023 by the authors. Licensee MDPI, Basel, Switzerland. This article is an open access article distributed under the terms and conditions of the Creative Commons Attribution (CC BY) license (http://creativecommons.org/licenses/by/4.0/).
