Submitted:
27 February 2023
Posted:
27 February 2023
You are already at the latest version
Abstract
Keywords:
1. Introduction
2. Materials and Methods
2.1. Chemicals
2.2. Synthesis of Copper Ferrite Nanoparticles
2.3. Nanoparticles Characterization
3. Results and Discussion
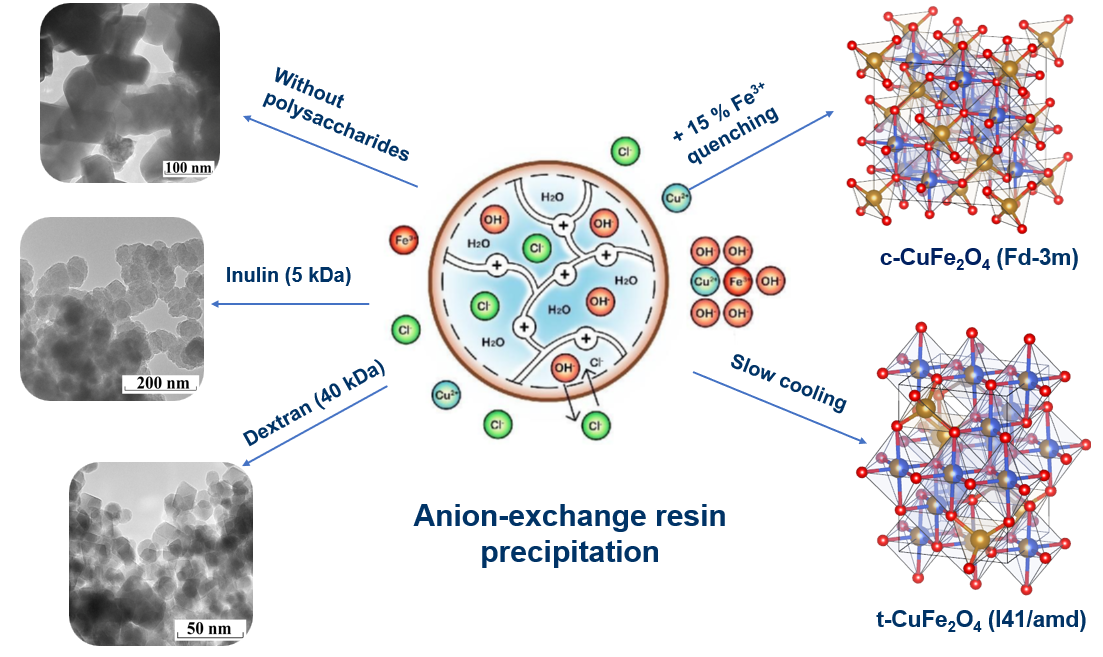
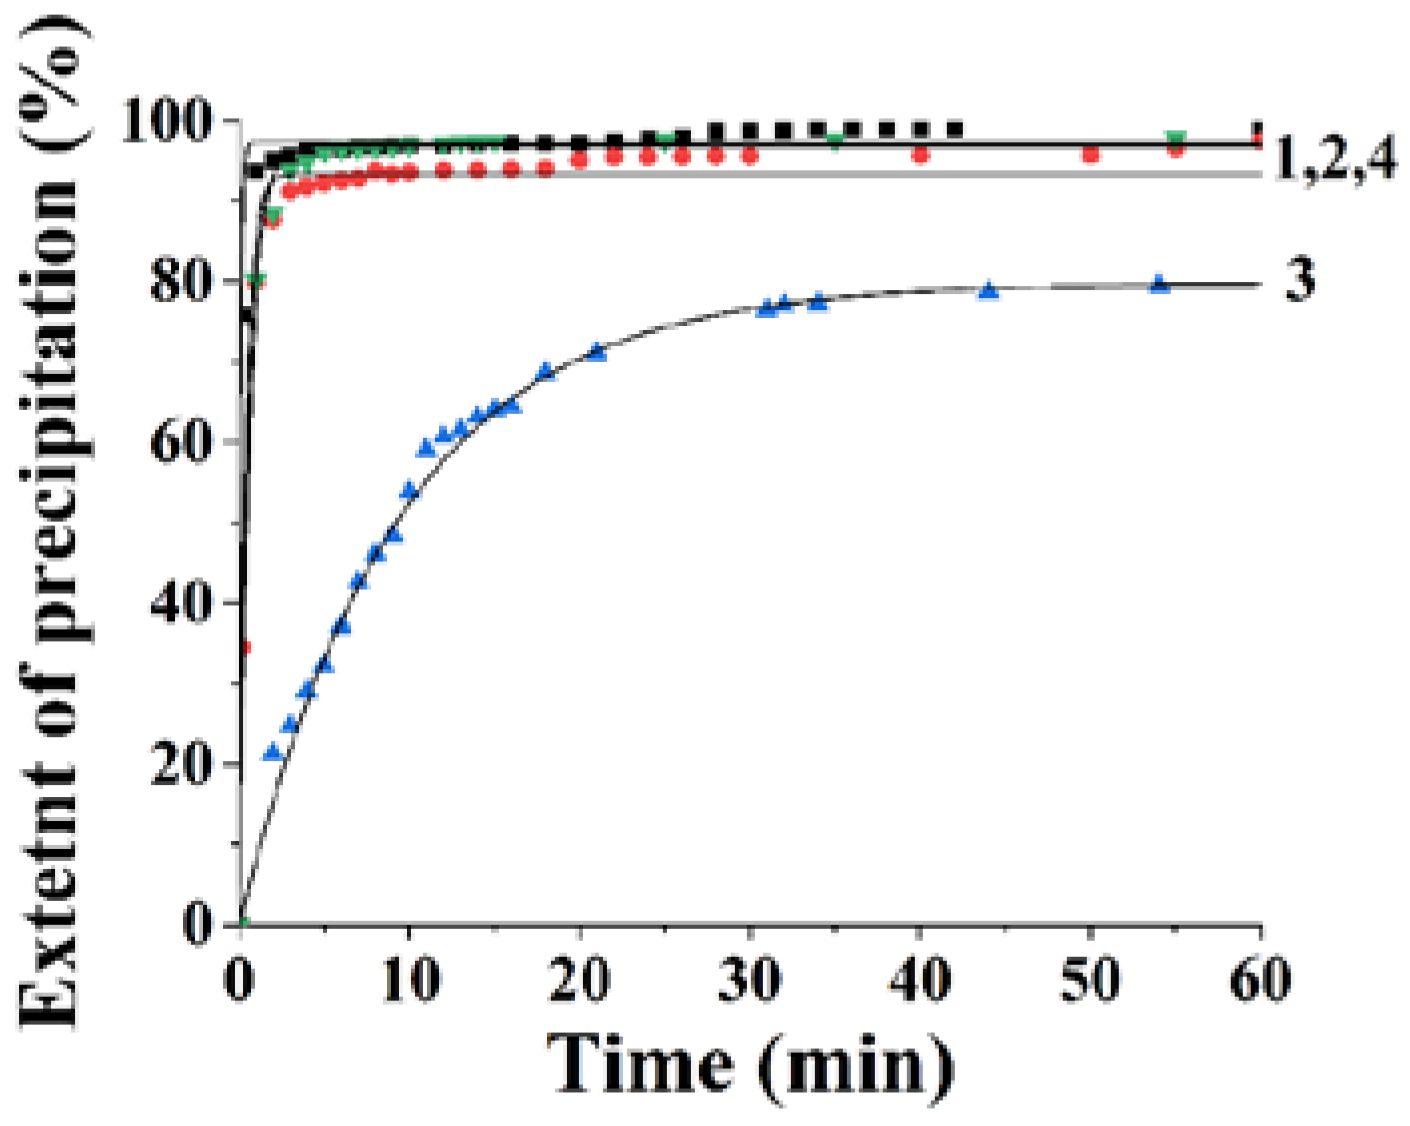
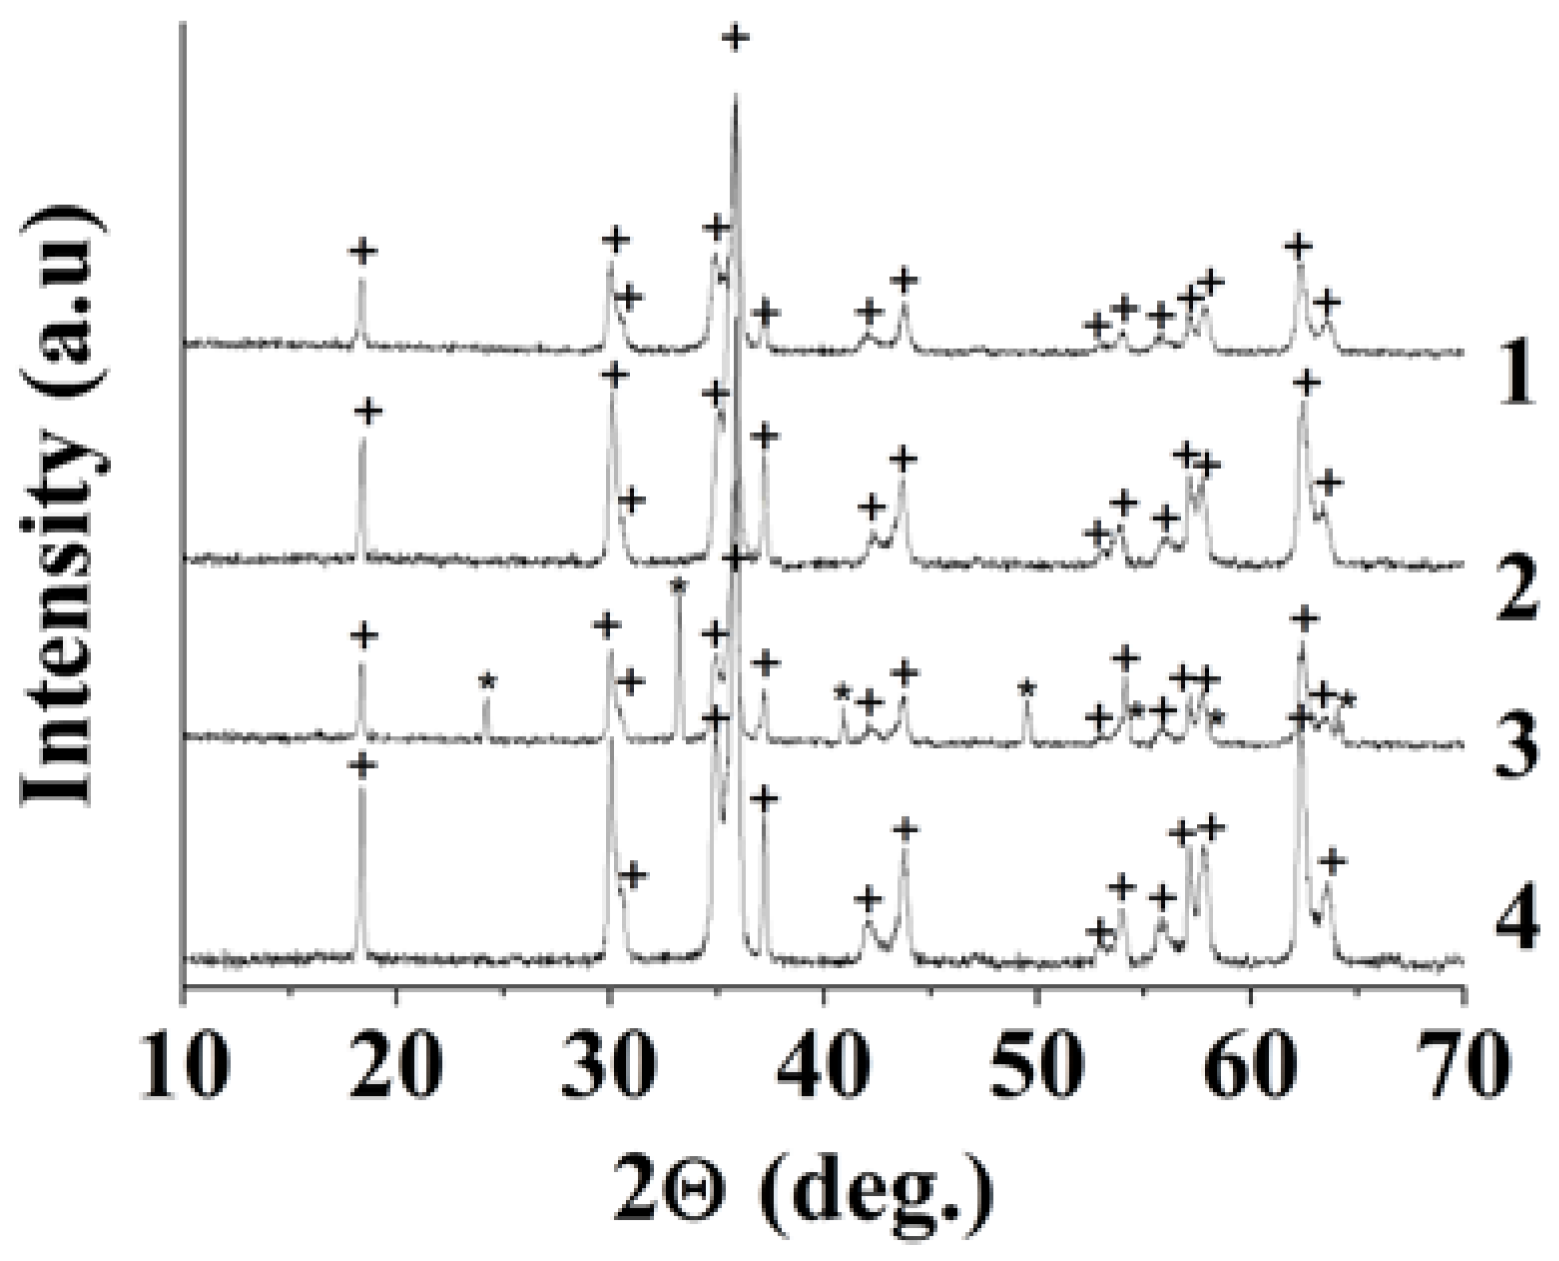
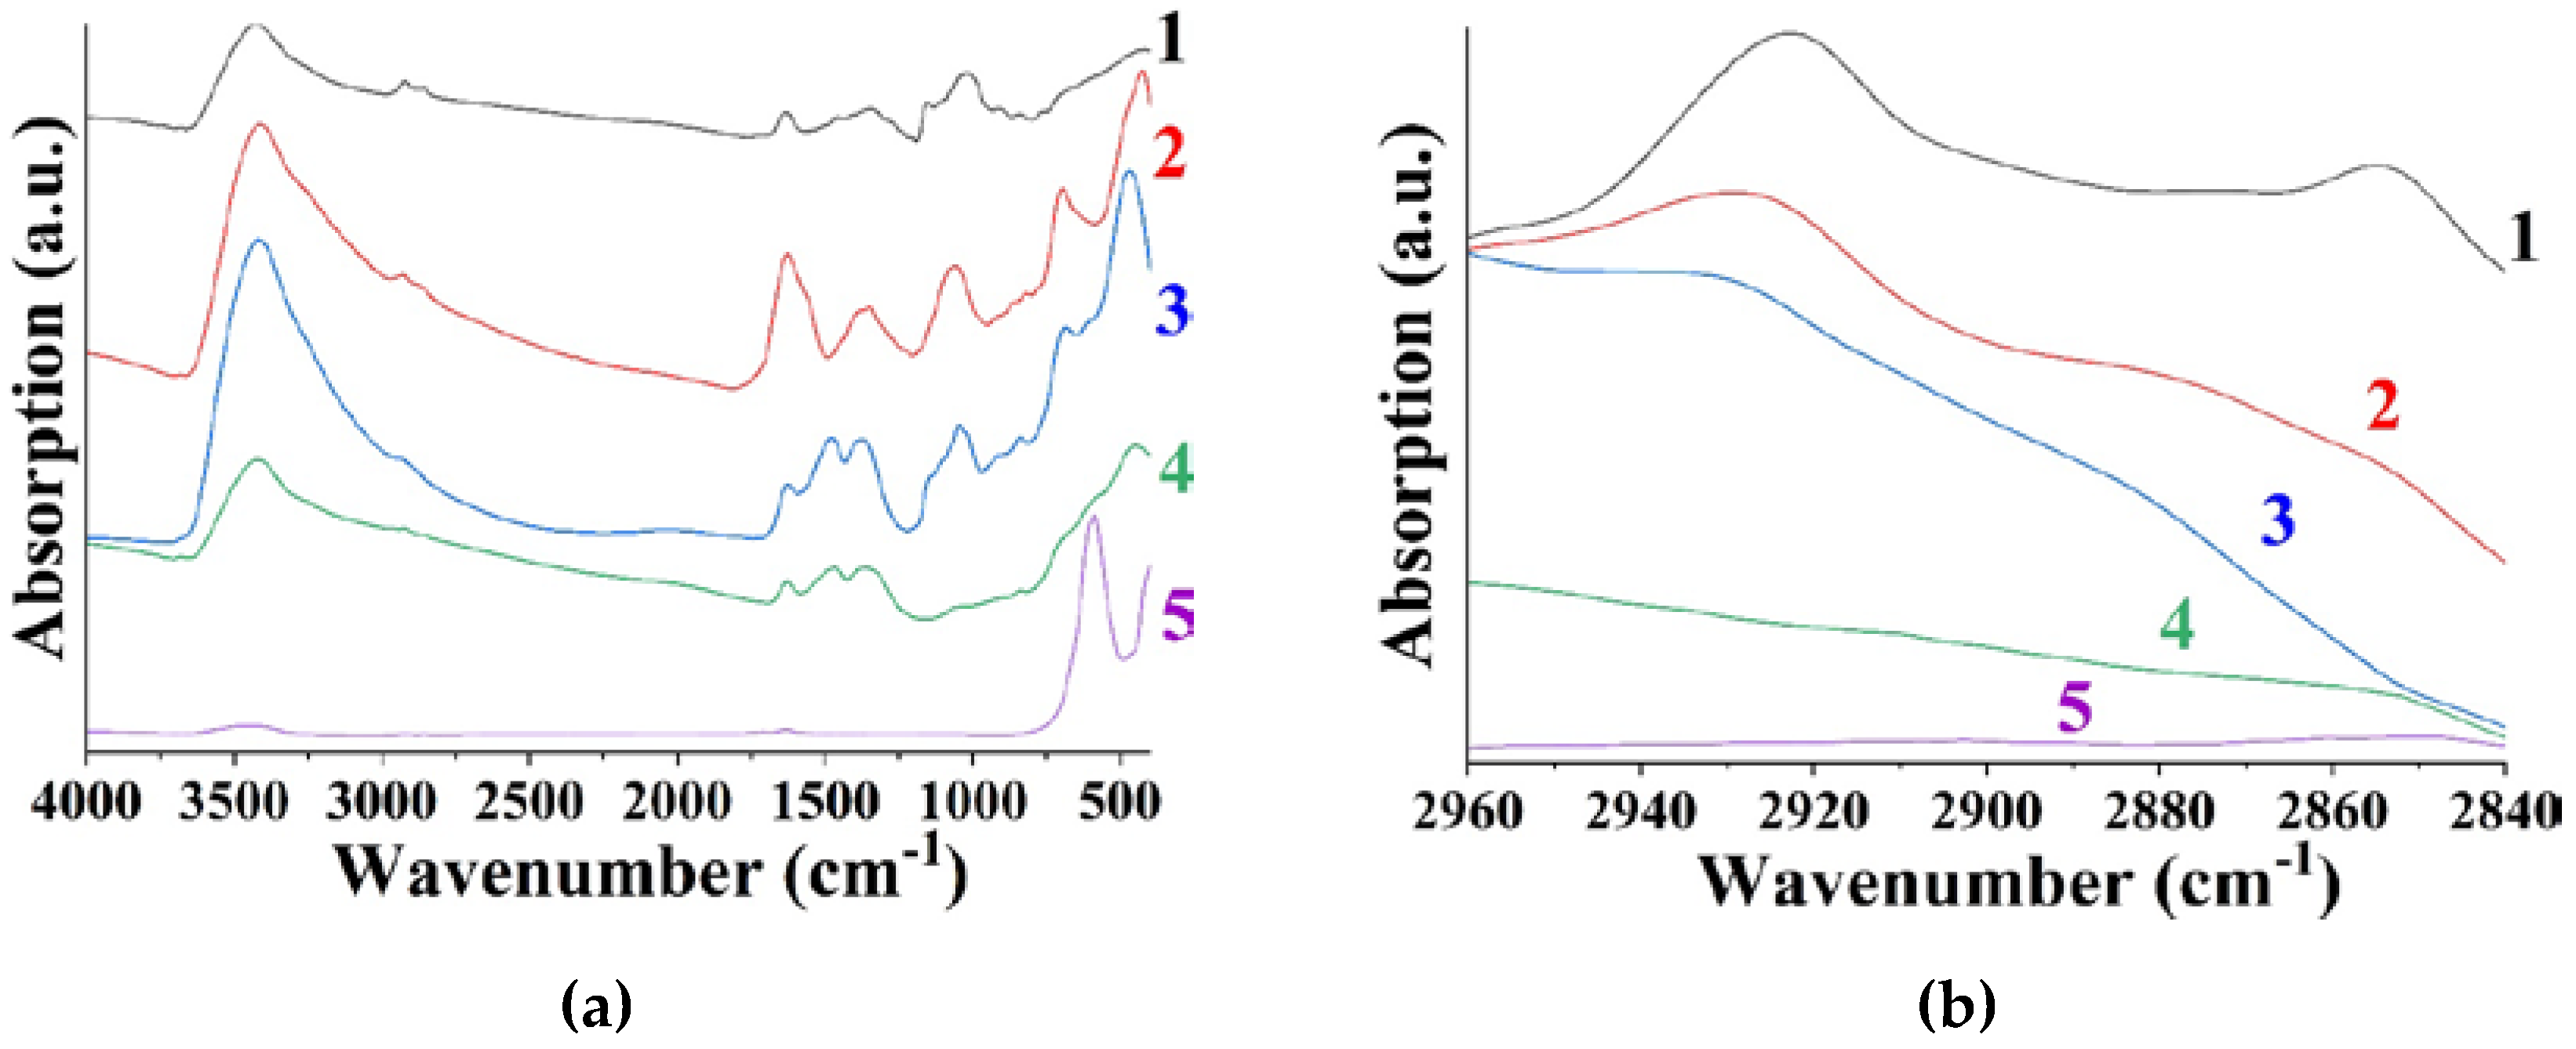
3.1. The Effects of Polysaccharides with Different Molar Masses on the Anion-Exchange Resin Precipitation Process
3.2. Control of Structural Parameters of Copper Ferrite
3.2.1. The Effect of Particle Size on the c-CuFe2O4 Stability
3.2.2. The Effect of the Annealing Temperature on c-CuFe2O4 Stability
3.2.3. The Effect of the Cooling Rate on the c-CuFe2O4 Stability
3.2.4. The Effect of Elemental Composition on the c-CuFe2O4 Stability
3.3. The effect of the CuFe2O4 nanoparticles structure on their magnetic properties
4. Conclusions
Supplementary Materials
Author Contributions
Funding
Institutional Review Board Statement
Informed Consent Statement
Data Availability Statement
Acknowledgments
Conflicts of Interest
References
- Mohamed, I.A.A.M.; Mohamed, M.G.; Ahmad, S.K.; Ramy, A.F.; Ahmed, I.O.; Al-M Ala’a, H.; David, W.R.; Mohamed, A.M.; Norhan, N.; Ahmed, H.A. Insights on magnetic spinel ferrites for targeted drug delivery and hyperthermia applications. Nanotechnol. Rev. 2022, 11, 372–413. [Google Scholar]
- Avasthi, A.; Caro, C.; Pozo-Torres, E.; Leal, M.P.; García-Martín, M.L. Magnetic Nanoparticles as MRI Contrast Agents. Topics in Current Chemistry. Surf.-Modif. Nanobiomaterials Electrochem. Biomed. Appl. 2020, 378, 49–91. [Google Scholar]
- Nam, J.-H.; Joo, Y.-H.; Lee, J.-H.; Chang, J.H.; Cho, J.H.; Chun, M.P.; Kim, B.I. Preparation of NiZn-ferrite nanofibers by electrospinning for DNA separation. J. Magn. Magn. Mater. 2009, 321, 1389–1392. [Google Scholar] [CrossRef]
- Raut, S.D.; Sangale, S.; Mane, R.S. Ferrites in energy. Spinel Ferrite Nanostructures for Energy Storage Devices. Elsevier 2020, 173–187. [Google Scholar] [CrossRef]
- Huang, W.; Zhu, J.; Zeng, H.Z.; Wei, X.H.; Zhang, Y.; Li, Y.R. Strain induced magnetic anisotropy in highly epitaxial CoFe2O4 thin films. Appl. Phys. Lett. 2006, 89, 262506. [Google Scholar] [CrossRef]
- Pardavi-Horvath, M. Microwave applications of soft ferrites. J. Magn. Magn. Mater. 2000, 215, 171–183. [Google Scholar] [CrossRef]
- Carey, M.J.; Maat, S.; Rice, P.; Farrow, R.F.C.; Marks, R.F.; Kellock, A.; Gurney, B.A. Spin valves using insulating cobalt ferrite exchange-spring pinning layers. Appl. Phys. Lett. 2002, 81, 1044–1046. [Google Scholar] [CrossRef]
- Kubacka, A.; Fernández-García, M.; Colón, G. Advanced Nanoarchitectures for Solar Photocatalytic Applications. Chem. Rev. 2011, 112, 1555–1614. [Google Scholar] [CrossRef]
- Shen, Y.; Wu, Y.; Xu, H.; Fu, J.; Li, X.; Zhao, Q.; Hou, Y. Facile preparation of sphere-like copper ferrite nanostructures and their enhanced visible-light-induced photocatalytic conversion of benzene. Mater. Res. Bull. 2013, 48, 4216–4222. [Google Scholar] [CrossRef]
- Vosoughifar, M. Preparation and application of copper ferrite nanoparticles for degradation of methyl orange. J. Mater. Sci. Mater. Electron. 2016, 27, 10449–10453. [Google Scholar] [CrossRef]
- Smyrnioti, M.; Ioannides, T. Dimethyl Ether Oxidation over Copper Ferrite Catalysts. Catalysts 2022, 12, 604. [Google Scholar] [CrossRef]
- Yang, Y.; Liu, J.; Wang, Z.; Ding, J.; Yu, Y. Charge-distribution modulation of copper ferrite spinel-type catalysts for highly efficient Hg0 oxidation. J. Hazard. Mater. 2020, 402, 123576. [Google Scholar] [CrossRef] [PubMed]
- Hou, C.; Zhao, D.; Chen, W.; Li, H.; Zhang, S.; Liang, C. Covalent Organic Framework-Functionalized Magnetic CuFe2O4/Ag Nanoparticles for the Reduction of 4-Nitrophenol. Nanomaterials 2020, 10, 426. [Google Scholar] [CrossRef] [PubMed]
- Dom, R.; Subasri, R.; Radha, K.; Borse, P.H. Synthesis of solar active nanocrystalline ferrite, MFe2O4 (M: Ca, Zn, Mg) photocatalyst by microwave irradiation. Solid State Commun. 2011, 151, 470–473. [Google Scholar] [CrossRef]
- Peymanfar, R.; Ramezanalizadeh, H. Sol-gel assisted synthesis of CuCr2O4 nanoparticles: An efficient visible-light driven photocatalyst for the degradation of water pollutions. Optik 2018, 169, 424–431. [Google Scholar] [CrossRef]
- Ziemniak, S.E.; Gaddipati, A.R.; Sander, P.C. Immiscibility in the NiFe2O4–NiCr2O4 spinel binary. J. Phys. Chem. Solids 2005, 66, 1112–1121. [Google Scholar] [CrossRef]
- Wang, Z.; Saxena, S.; Lazor, P.; O’Neill, H.S. An in situ Raman spectroscopic study of pressure induced dissociation of spinel NiCr2O4. J. Phys. Chem. Solids 2003, 64, 425–431. [Google Scholar] [CrossRef]
- Shaheen, W.M.; Ali, A.A. Thermal solid–solid interaction and physicochemical properties of CuO–Fe2O3 system. Int. J. Inorg. Mater. 2001, 3, 1073–1081. [Google Scholar] [CrossRef]
- Calvo-de la Rosa, J.; Segarra, M. Optimization of the Synthesis of Copper Ferrite Nanoparticles by a Polymer-Assisted Sol–Gel Method. ACS Omega 2019, 4, 18289–18298. [Google Scholar] [CrossRef]
- Calvo-de la Rosa, J.; Segarra Rubí, M. Influence of the Synthesis Route in Obtaining the Cubic or Tetragonal Copper Ferrite Phases. Inorg. Chem. 2020, 59, 8775–8788. [Google Scholar] [CrossRef]
- Salavati-Niasari, M.; Mahmoudi, T.; Sabet, M.; Hosseinpour-Mashkani, S.M.; Soofivand, F.; Tavakoli, F. Synthesis and Characterization of Copper Ferrite Nanocrystals via Coprecipitation. J. Clust. Sci. 2012, 23, 1003–1010. [Google Scholar] [CrossRef]
- Trofimova, T.V.; Saikova, S.V.; Panteleeva, M.V.; Pashkov, G.L.; Bondarenko, G.N. Anion-Exchange Synthesis of Copper Ferrite Powders. Glass Ceram. 2018, 75, 74–79. [Google Scholar] [CrossRef]
- Saikova, S.V.; Trofimova, T.V.; Pavlikov, A.Y.; Samoilo, A.S. Effect of Polysaccharide Additions on the Anion-Exchange Deposition of Cobalt Ferrite Nanoparticles. Russ. J. Inorg. Chem. 2020, 65, 291–298. [Google Scholar] [CrossRef]
- Ivantsov, R.; Evsevskaya, N.; Saikova, S.; Linok, E.; Yurkin, G.; Edelman, I. Synthesis and characterization of Dy3Fe5O12 nanoparticles fabricated with the anion resin exchange precipitation method. Mater. Sci. Eng. B 2017, 226, 171–176. [Google Scholar] [CrossRef]
- Evsevskaya, N.; Pikurova, E.; Saikova, S.V.; Nemtsev, I.V. Effect of the Deposition Conditions on the Anion Resin Exchange Precipitation of Indium(III) Hydroxide. ACS Omega 2020, 5, 4542–4547. [Google Scholar] [CrossRef]
- Nikolić, V.N.; Vasić, M.M.; Kisić, D. Observation of c-CuFe2O4 nanoparticles of the same crystallite size in different nanocomposite materials: The influence of Fe3+ cations. J. Solid State Chem. 2019, 275, 187–196. [Google Scholar] [CrossRef]
- Ponhan, W.; Maensiri, S. Fabrication and magnetic properties of electrospun copper ferrite (CuFe2O4) nanofibers. Solid State Sci. 2009, 11, 479–484. [Google Scholar] [CrossRef]
- Xiao, Z.; Jin, S.; Wang, X.; Li, W.; Wang, J.; Liang, C. Preparation, structure and catalytic properties of magnetically separable Cu–Fe catalysts for glycerol hydrogenolysis. J. Mater. Chem. 2012, 22, 16598. [Google Scholar] [CrossRef]
- Teraoka, Y.; Kagawa, S. Simultaneous catalytic removal of NOx and diesel soot particulates. Catal. Surv. Jpn. 1998, 2, 155–164. [Google Scholar] [CrossRef]
- Balagurov, A.M.; Bobrikov, I.A.; Maschenko, M.S.; Sangaa, D.; Simkin, V.G. Structural phase transition in CuFe2O4 spinel. Crystallogr. Rep. 2013, 58, 710–717. [Google Scholar] [CrossRef]
- Balagurov, A.M.; Bobrikov, I.A.; Pomjakushin, V.Y.; Sheptyakov, D.V.; Yushankhai, V.Y. Interplay between structural and magnetic phase transitions in copper ferrite studied with high-resolution neutron diffraction. J. Magn. Magn. Mater. 2015, 374, 591–599. [Google Scholar] [CrossRef]
- Yadav, R.S.; Havlica, J.; Masilko, J.; Kalina, L.; Wasserbauer, J.; Hajdúchová, M.; Enev, V.; Kuřitka, I.; Kožáková, Z. Cation Migration-Induced Crystal Phase Transformation in Copper Ferrite Nanoparticles and Their Magnetic Property. J. Supercond. Nov. Magn. 2015, 29, 759–769. [Google Scholar] [CrossRef]
- López-Ramón, M.V.; Álvarez, M.A.; Moreno-Castilla, C.; Fontecha-Cámara, M.A.; Yebra-Rodríguez, Á.; Bailón-García, E. Effect of calcination temperature of a copper ferrite synthesized by a sol-gel method on its structural characteristics and performance as Fenton catalyst to remove gallic acid from water. J. Colloid Interface Sci. 2018, 511, 193–202. [Google Scholar] [CrossRef] [PubMed]
- Saikova, S.V.; Kirshneva, E.A.; Panteleeva, M.V.; Pikurova, E.V.; Evsevskaya, N.P. Production of Gadolinium Iron Garnet by Anion Resin Exchange Precipitation. Russ. J. Inorg. Chem. 2019, 64, 1191–119. [Google Scholar] [CrossRef]
- Nikolic, G.S.; Cakic, M.D. Physical investigation of the colloidal iron-inulin complex. Colloid J. 2007, 69, 464–473. [Google Scholar] [CrossRef]
- Saikova, S.; Pavlikov, A.; Trofimova, T.; Mikhlin, Y.; Karpov, D.; Asanova, A.; Grigoriev, Y.; Volochaev, M.; Samoilo, A.; Zharkov, S.; Velikanov, D. Hybrid Nanoparticles Based on Cobalt Ferrite and Gold: Preparation and Characterization. Metals 2021, 11, 705. [Google Scholar] [CrossRef]
- Atacan, K. CuFe2O4/reduced graphene oxide nanocomposite decorated with gold nanoparticles as a new electrochemical sensor material for ʟ-cysteine detection. J. Alloy. Compd. 2019, 791, 391–401. [Google Scholar] [CrossRef]
- Jermy, B.R.; Ravinayagam, V.; Alamoudi, W.A.; Almohazey, D.; Dafalla, H.; Hussain Allehaibi, L.; Bayka, A.; Toprak, M.S.; Somanathan, T. Targeted therapeutic effect against the breast cancer cell line MCF-7 with a CuFe2O4/silica/cisplatin nanocomposite formulation. Beilstein J. Nanotechnol. 2019, 10, 2217–2228. [Google Scholar] [CrossRef]
- Ahamed, M.; Akhtar, M.J.; Alhadlaq, H.A.; Alshamsan, A. Copper ferrite nanoparticle-induced cytotoxicity and oxidative stress in human breast cancer MCF-7 cells. Colloids Surf. B Biointerfaces 2016, 142, 46–54. [Google Scholar] [CrossRef]
- Chatterjee, B.K.; Bhattacharjee, K.; Dey, A.; Ghosh, C.K.; Chattopadhyay, K.K. Influence of spherical assembly of copper ferrite nanoparticles on magnetic properties: orientation of magnetic easy axis. Dalton Trans. 2014, 43, 7930–7944. [Google Scholar] [CrossRef]
- Roy, S.; Ghose, J. Superparamagnetic nanocrystalline CuFe2O4. J. Appl. Phys. 2000, 87, 6226–6228. [Google Scholar] [CrossRef]
- Yokoyama, M.; Nakamura, A.; Sato, T.; Haneda, K. Jahn-Teller effect in ultrafine copper ferrite particles. J. Magn. Soc. Jpn. 1998, 22, 243–245. [Google Scholar] [CrossRef] [PubMed]
- Zhuravlev, V.A.; Minin, R.V.; Itin, V.I.; Lilenko, I.Y. Structural parameters and magnetic properties of copper ferrite nanopowders obtained by the sol-gel combustion. J. Alloy. Compd. 2017, 692, 705–712. [Google Scholar] [CrossRef]
- Prabhu, D.; Narayanasamy, A.; Shinoda, K.; Jeyadeven, B.; Greneche, J.-M.; Chattopadhyay, K. Grain size effect on the phase transformation temperature of nanostructured CuFe2O4. J. Appl. Phys. 2011, 109, 013532. [Google Scholar] [CrossRef]
- Dhyani, R.; Srivastava, R.C.; Rawat, P.S.; Dixit, G. Structural and elastic properties of tetragonal nano-structured copper ferrite. Int. J. Mater. Res. 2022, 113, 884–892. [Google Scholar] [CrossRef]
- Gingasu, D.; Mindru, I.; Patron, L.; Cizmas, C.-B. Tetragonal copper ferrite obtained by self-propagating combustion. J. Alloy. Compd. 2008, 460, 627–631. [Google Scholar] [CrossRef]
- Murthy, K.S.R.C.; Mahanty, S.; Ghose, J. Phase-transition studies on copper ferrite. Mater. Res. Bull. 1987, 22, 1665–1675. [Google Scholar] [CrossRef]
- Tang, X.-X.; Manthiram, A.; Goodenough, J. B. Copper ferrite revisited. J. Solid State Chem. 1989, 79, 250–262. [Google Scholar] [CrossRef]
- Tsoncheva, T.; Manova, E.; Velinov, N.; Paneva, D.; Popova, M.; Kunev, B.; Mitov, I. Thermally synthesized nanosized copper ferrites as catalysts for environment protection. Catal. Commun. 2010, 12, 105–109. [Google Scholar] [CrossRef]
- Tao, S.; Gao, F.; Liu, X.; Toft Sørensen, O. Preparation and gas-sensing properties of CuFe2O4 at reduced temperature. Mater. Sci. Eng. B 2000, 77, 172–176. [Google Scholar] [CrossRef]
- Desai, M.; Prasad, S.; Venkataramani, N.; Samajdar, I.; Nigam, A.K.; Krishnan, R. Cubic phase stabilization in sputter-deposited nanocrystalline copper ferrite thin films with large magnetization. IEEE Trans. Magn. 2002, 38, 3012–3014. [Google Scholar] [CrossRef]
- Caddeo, F.; Loche, D.; Casula, M.F.; Corrias, A. Evidence of a cubic iron sub-lattice in t-CuFe2O4 demonstrated by X-ray Absorption Fine Structure. Sci. Rep. 2018, 8, 797. [Google Scholar] [CrossRef] [PubMed]
- Kester, E.; Gillot, B. Cation distribution, thermodynamic and kinetics considerations in nanoscaled copper ferrite spinels. New experimental approach by XPS and new results both in the bulk and on the grain boundary. J. Phys. Chem. Solids 1998, 59, 1259–1269. [Google Scholar] [CrossRef]
- Ohbayashi, K.; Iida, S. Oxygen Content and Thermomagnetic Properties in Cu1-ξMgξFe2O4. J. Phys. Soc. Jpn. 1967, 23, 776–785. [Google Scholar] [CrossRef]
- Bergstein, A.; Červinka, L. To the structure and oxygen content of copper and copper-manganese ferrite. J. Phys. Chem. Solids 1961, 18, 264–265. [Google Scholar] [CrossRef]
- O’Bryan, H.M.; Levinstein, H.J.; Sherwood, R.C. Effect of Chemical Stoichiometry on the Copper Ferrite Phase Transition. J. Appl. Phys. 1966, 37, 1438–1439. [Google Scholar] [CrossRef]
- Phuruangrat, A.; Kuntalue, B.; Dumrongrojthanath, P.; Thongtem, T.; Thongtem, S. Microwave-assisted solvothermal synthesis of cubic ferrite (MFe2O4, M = Mn, Zn, Cu and Ni) nanocrystals and their magnetic properties. Dig. J. Nanomater. Biostruct 2018, 13, 563–568. [Google Scholar]
- Gabal, M.A.; Katowah, D.F.; Hussein, M.A.; Al-Juaid, A.A.; Awad, A.; Abdel-Daiem Saeed, A.; Hessien, M.M.; Asiri, A.M. Structural and Magnetoelectrical Properties of MFe2O4 (M = Co, Ni, Cu, Mg, and Zn) Ferrospinels Synthesized via an Egg-White Biotemplate. ACS Omega 2021, 6, 22180–22187. [Google Scholar] [CrossRef] [PubMed]
- Sung Lee, J.; Myung Cha, J.; Young Yoon, H.; Lee, J.-K.; Keun Kim, Y. Magnetic multi-granule nanoclusters: A model system that exhibits universal size effect of magnetic coercivity. Sci. Rep. 2015, 5. [Google Scholar] [CrossRef]
- Sumangala, T.P.; Mahender, C.; Barnabe, A.; Venkataramani, N. Prasad, Structural, magnetic and gas sensing properties of nanosized copper ferrite powder synthesized by sol gel combustion technique. J. Magn. Magn. Mater. 2016, 418, 48–53. [Google Scholar] [CrossRef]
- Mulud, F.H.; Dahham, N.A.; Waheed, I.F. Synthesis and Characterization of Copper Ferrite Nanoparticles. IOP Conf. Ser. Mater. Sci. Eng. 2020, 928, 072125. [Google Scholar] [CrossRef]

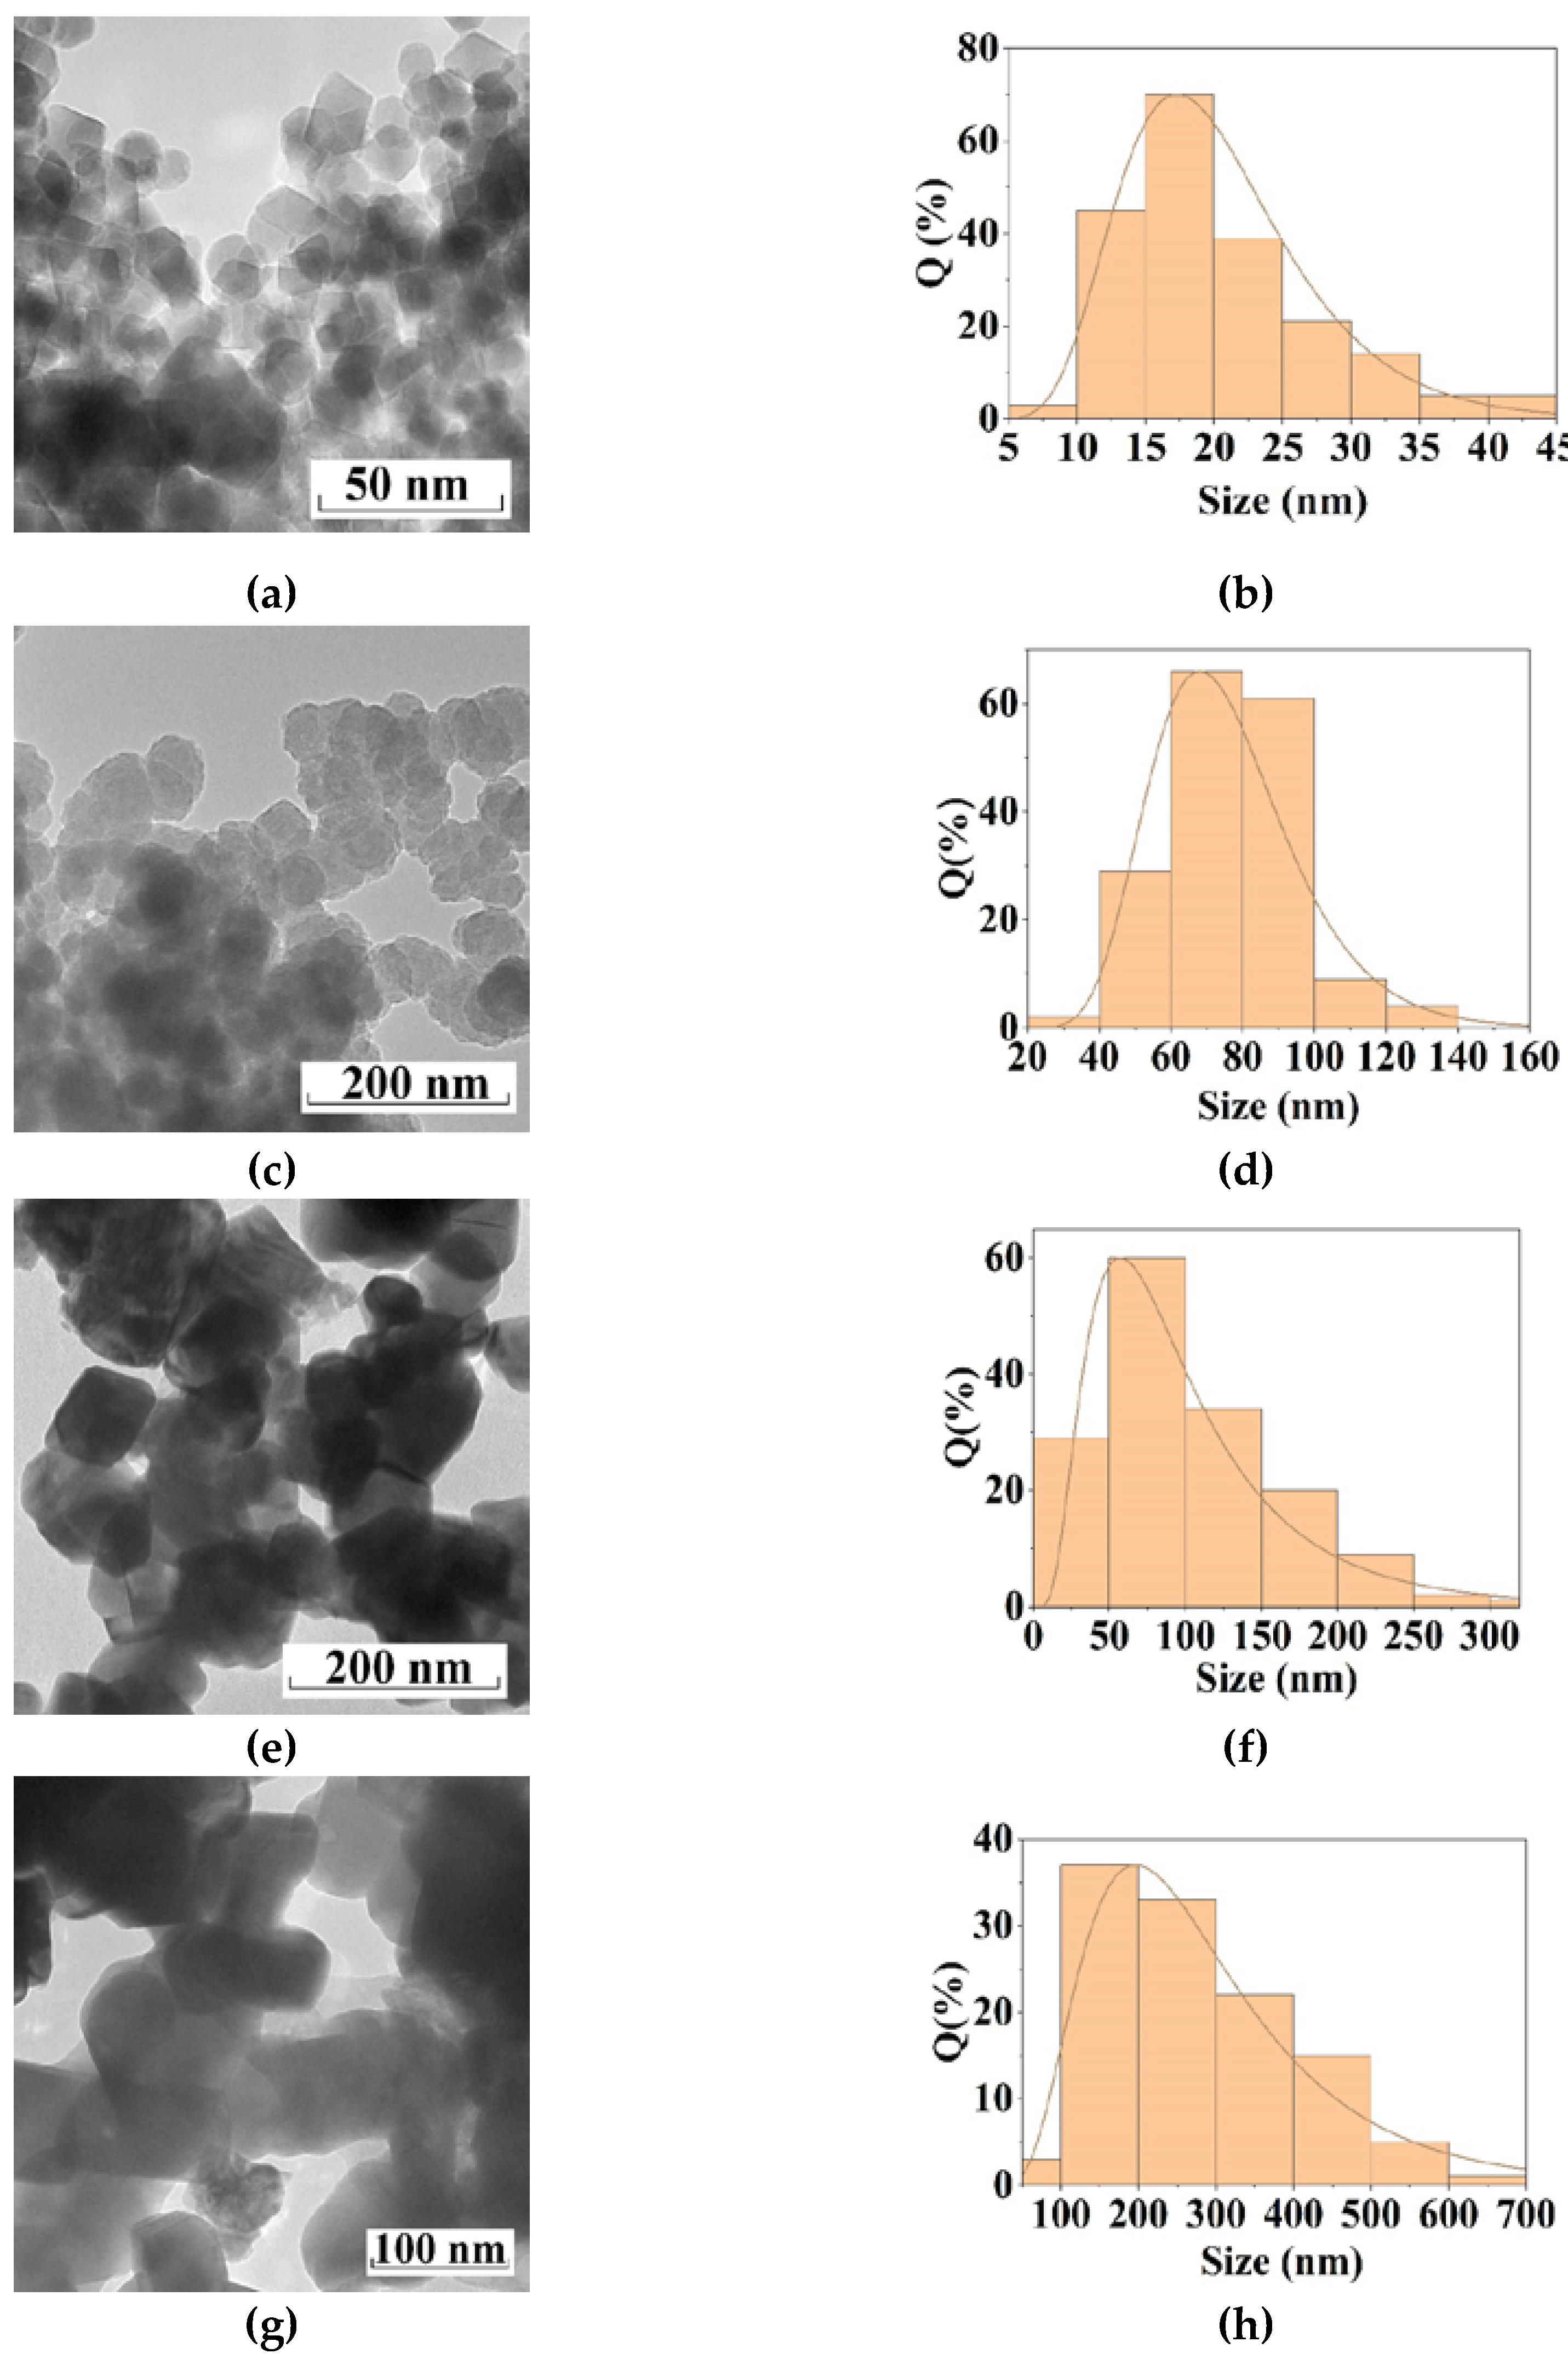
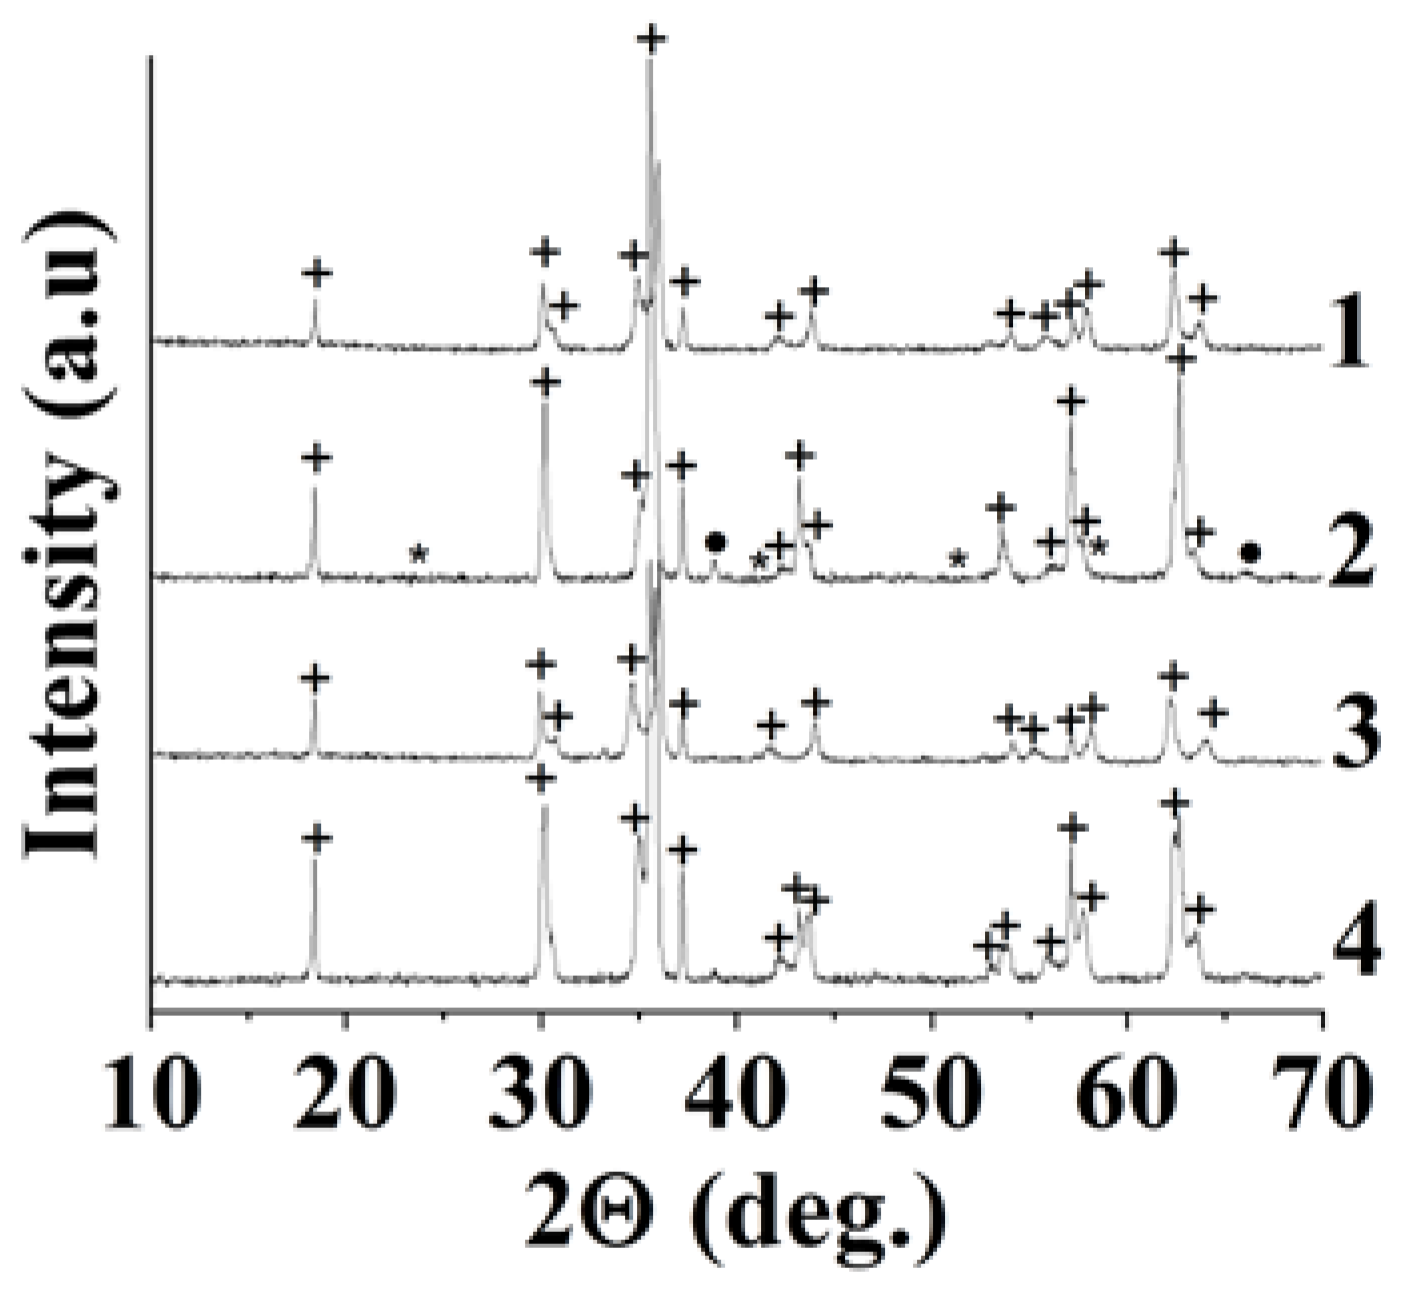
| Sample | Polysaccharide | The Mole Fraction of Metals in the Resin, % | The Mole Ratio of Cu to Fe in the Product (nСu/nFe) | Product Yield, % | Average Size of Nanoparticles (TEM), nm | Phases After Annealing |
|---|---|---|---|---|---|---|
| 1 | - | 3.0 | 0.51 | 96.0±0.6 | 134±23 | CuFe2O4 |
| 2 | Dextran-40 | 2.0 | 0.5 | 98.0±0.6 | 14±3 | CuFe2O4 |
| 3 | Dextran-70 | 9.8 | 0.4 | 80.0±1.0 | 87±24 | CuFe2O4, Fe2O3 |
| 4 | Inulin | 2.5 | 0.5 | 97.0±0.6 | 63±14 | CuFe2O4 |
| Sample | Polysaccharide | t-CuFe2O4 (I41/amd) |
c-CuFe2O4 (Fd-3m) |
Fe2O3 | χ2 | |||
|---|---|---|---|---|---|---|---|---|
| a | c | ω, wt% | a | ω, wt% | ω, wt% | |||
| 1 | - | 5.853±0.001 | 8.591±0.001 | 76±2 | 8.391±0.001 | 24±2 | - | 1.237 |
| 2 | Dextran-40 | 5.870±0.001 | 8.556±0.001 | 67±2 | 8.388±0.001 | 33±2 | - | 1.413 |
| 3 | Dextran-70 | 5.860±0.001 | 8.581±0.001 | 56±2 | 8.385±0.001 | 22±2 | 22±2 | 1.266 |
| 4 | Inulin | 5.857±0.001 | 8.585±0.001 | 75±2 | 8.385±0.001 | 25±2 | - | 1.582 |
| Sample | Polysaccharide | CuFe2O4 (I41/amd) |
CuFe2O4 (Fd-3m) |
Fe2O3 | CuO | χ2 | |||
|---|---|---|---|---|---|---|---|---|---|
| a | c | ω, wt% | a | ω, wt% | ω, wt% | ω, wt% | |||
| 1 | - | 5.851±0.001 | 8.596±0.001 | 78±3 | 8.390±0.001 | 22±2 | - | - | 1.322 |
| 2 | Dextran-40 | 5.876±0.001 | 8.545±0.001 | 33.6±0.9 | 8.387±0.001 | 62.7±0.9 | 2.3±0.7 | 1.4±0.3 | 1.232 |
| 3 | Dextran-70 | 5.824±0.001 | 8.673±0.001 | 79±1 | 8.385±0.001 | 21±1 | - | - | 1.391 |
| 4 | Inulin | 5.867±0.001 | 8.558±0.001 | 60.0±0.8 | 8.384±0.001 | 40.0±0.8 | - | - | 1.594 |
| Sample |
Mole Ratio n(Cu)/n(Fe) |
Cooling Mode |
ω(t-CuFe2O4), % | ω(c-CuFe2O4), % | ω(CuO), % | χ2 |
|---|---|---|---|---|---|---|
| 1f | 0,5 | In furnace | 81±2 | 16±2 | 3.0±0.2 | 1.449 |
| 1q | Quenching | 67±1 | 29±1 | 4.0±0.3 | 1.358 | |
| Сf | 0,6 | In furnace | 79 ±2 | 14±2 | 7.0±0.4 | 1.439 |
| Сq | Quenching | 68±1 | 23±1 | 9.0±0.4 | 1.339 | |
| Ff | 0,4 | In furnace | 84±2 | 16 ±1 | - | 1.506 |
| Fq | Quenching | 55±1 | 44 ±1 | 1.0±0.3 | 1.289 |
| Sample | Polysaccharide | c-CuFe2O4/ t-CuFe2O |
Ms, emu/g | Mr,emu/g | Hc, Oe | Size of Nanoparticles (TEM), nm |
|---|---|---|---|---|---|---|
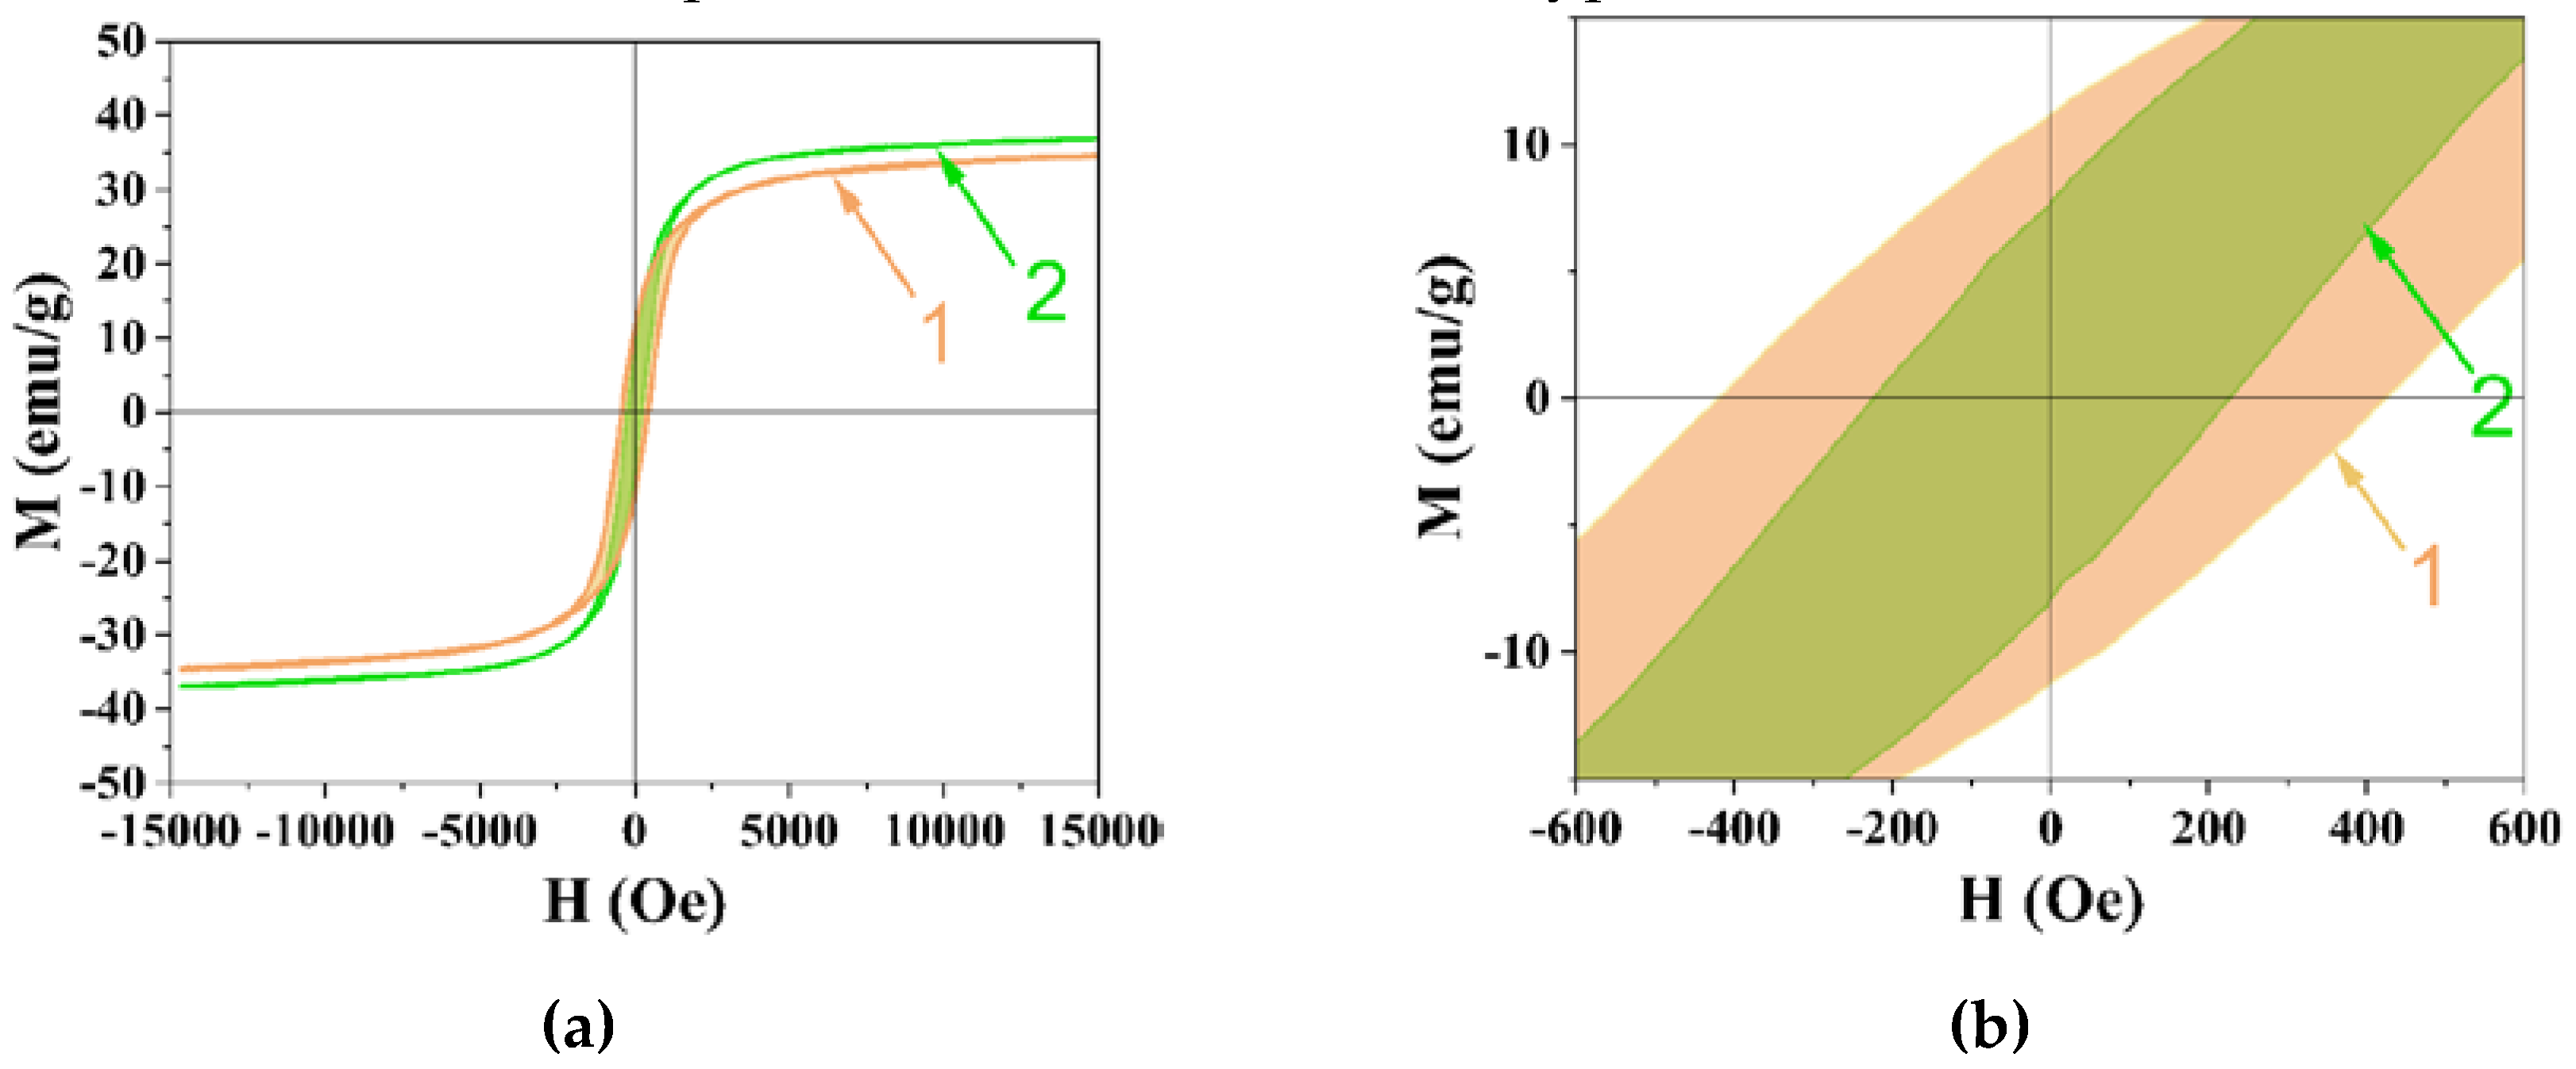
| 1 | - | 0.3 | 34.6 | 10.6 | 417.0 | 134±23 |
| 2 | Dextran-40 | 0.6 | 36.9 | 6.8 | 220.0 | 14±3 |
Disclaimer/Publisher’s Note: The statements, opinions and data contained in all publications are solely those of the individual author(s) and contributor(s) and not of MDPI and/or the editor(s). MDPI and/or the editor(s) disclaim responsibility for any injury to people or property resulting from any ideas, methods, instructions or products referred to in the content. |
© 2023 by the authors. Licensee MDPI, Basel, Switzerland. This article is an open access article distributed under the terms and conditions of the Creative Commons Attribution (CC BY) license (http://creativecommons.org/licenses/by/4.0/).


