Submitted:
27 February 2023
Posted:
28 February 2023
You are already at the latest version
Abstract

Keywords:
1. Introduction
2. Results and Discussion
2.1. Flavin@MIL-53 synthesis
2.2. Flavin@MOF-5 synthesis
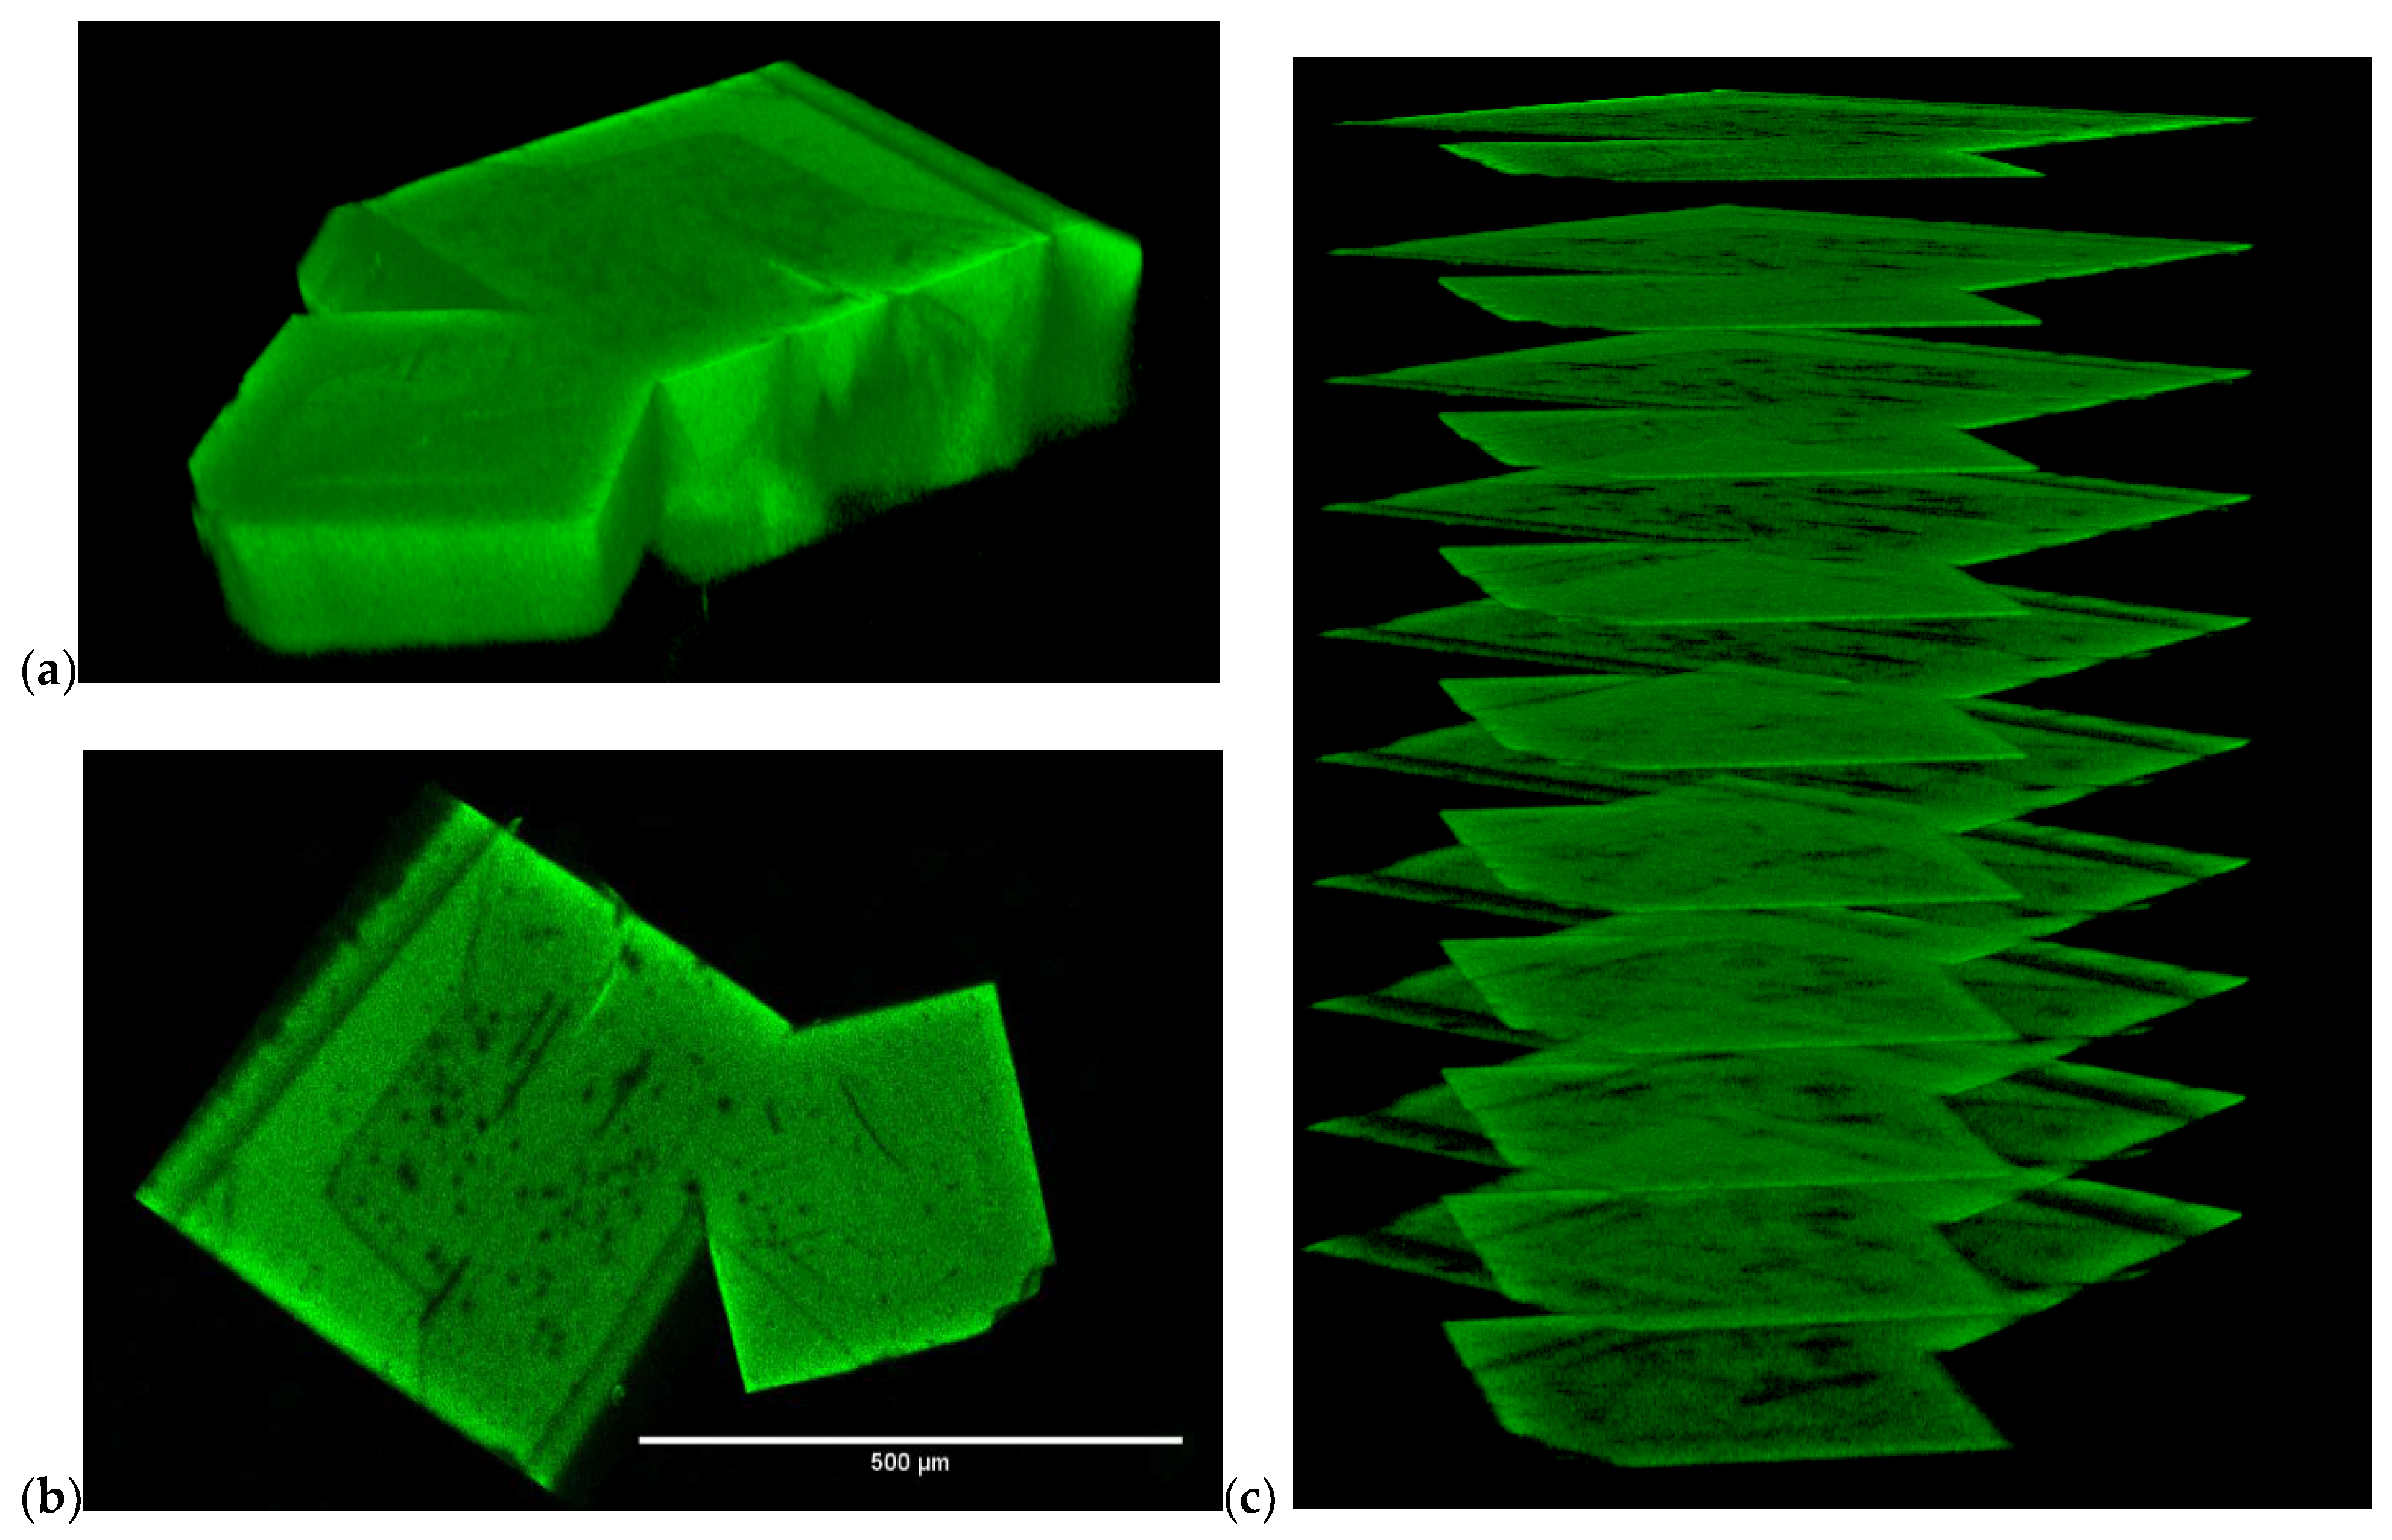
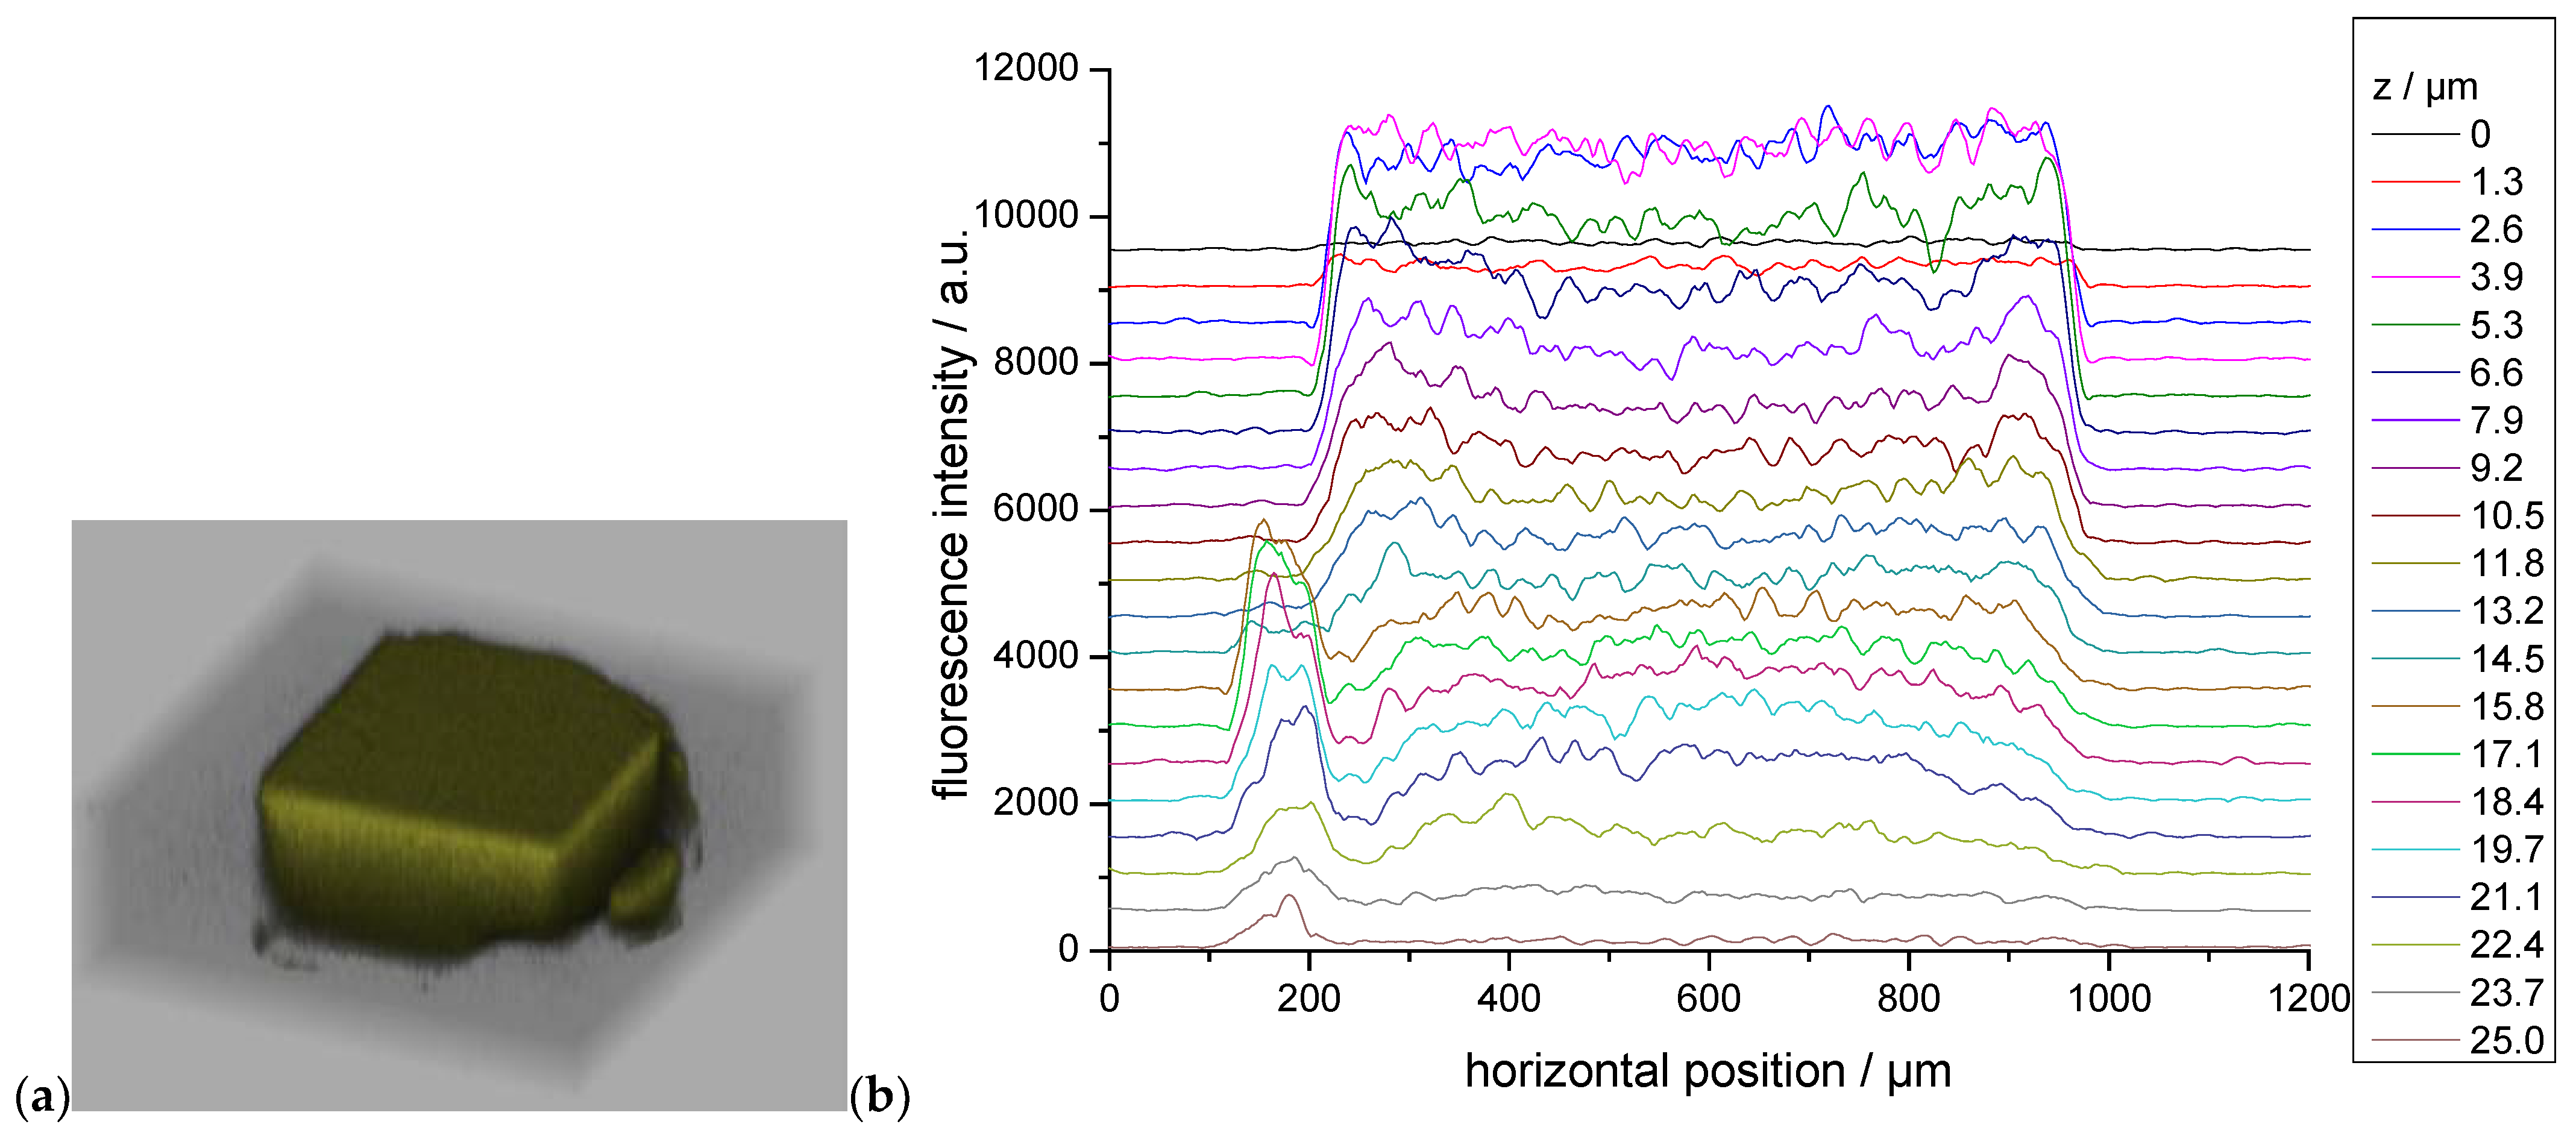
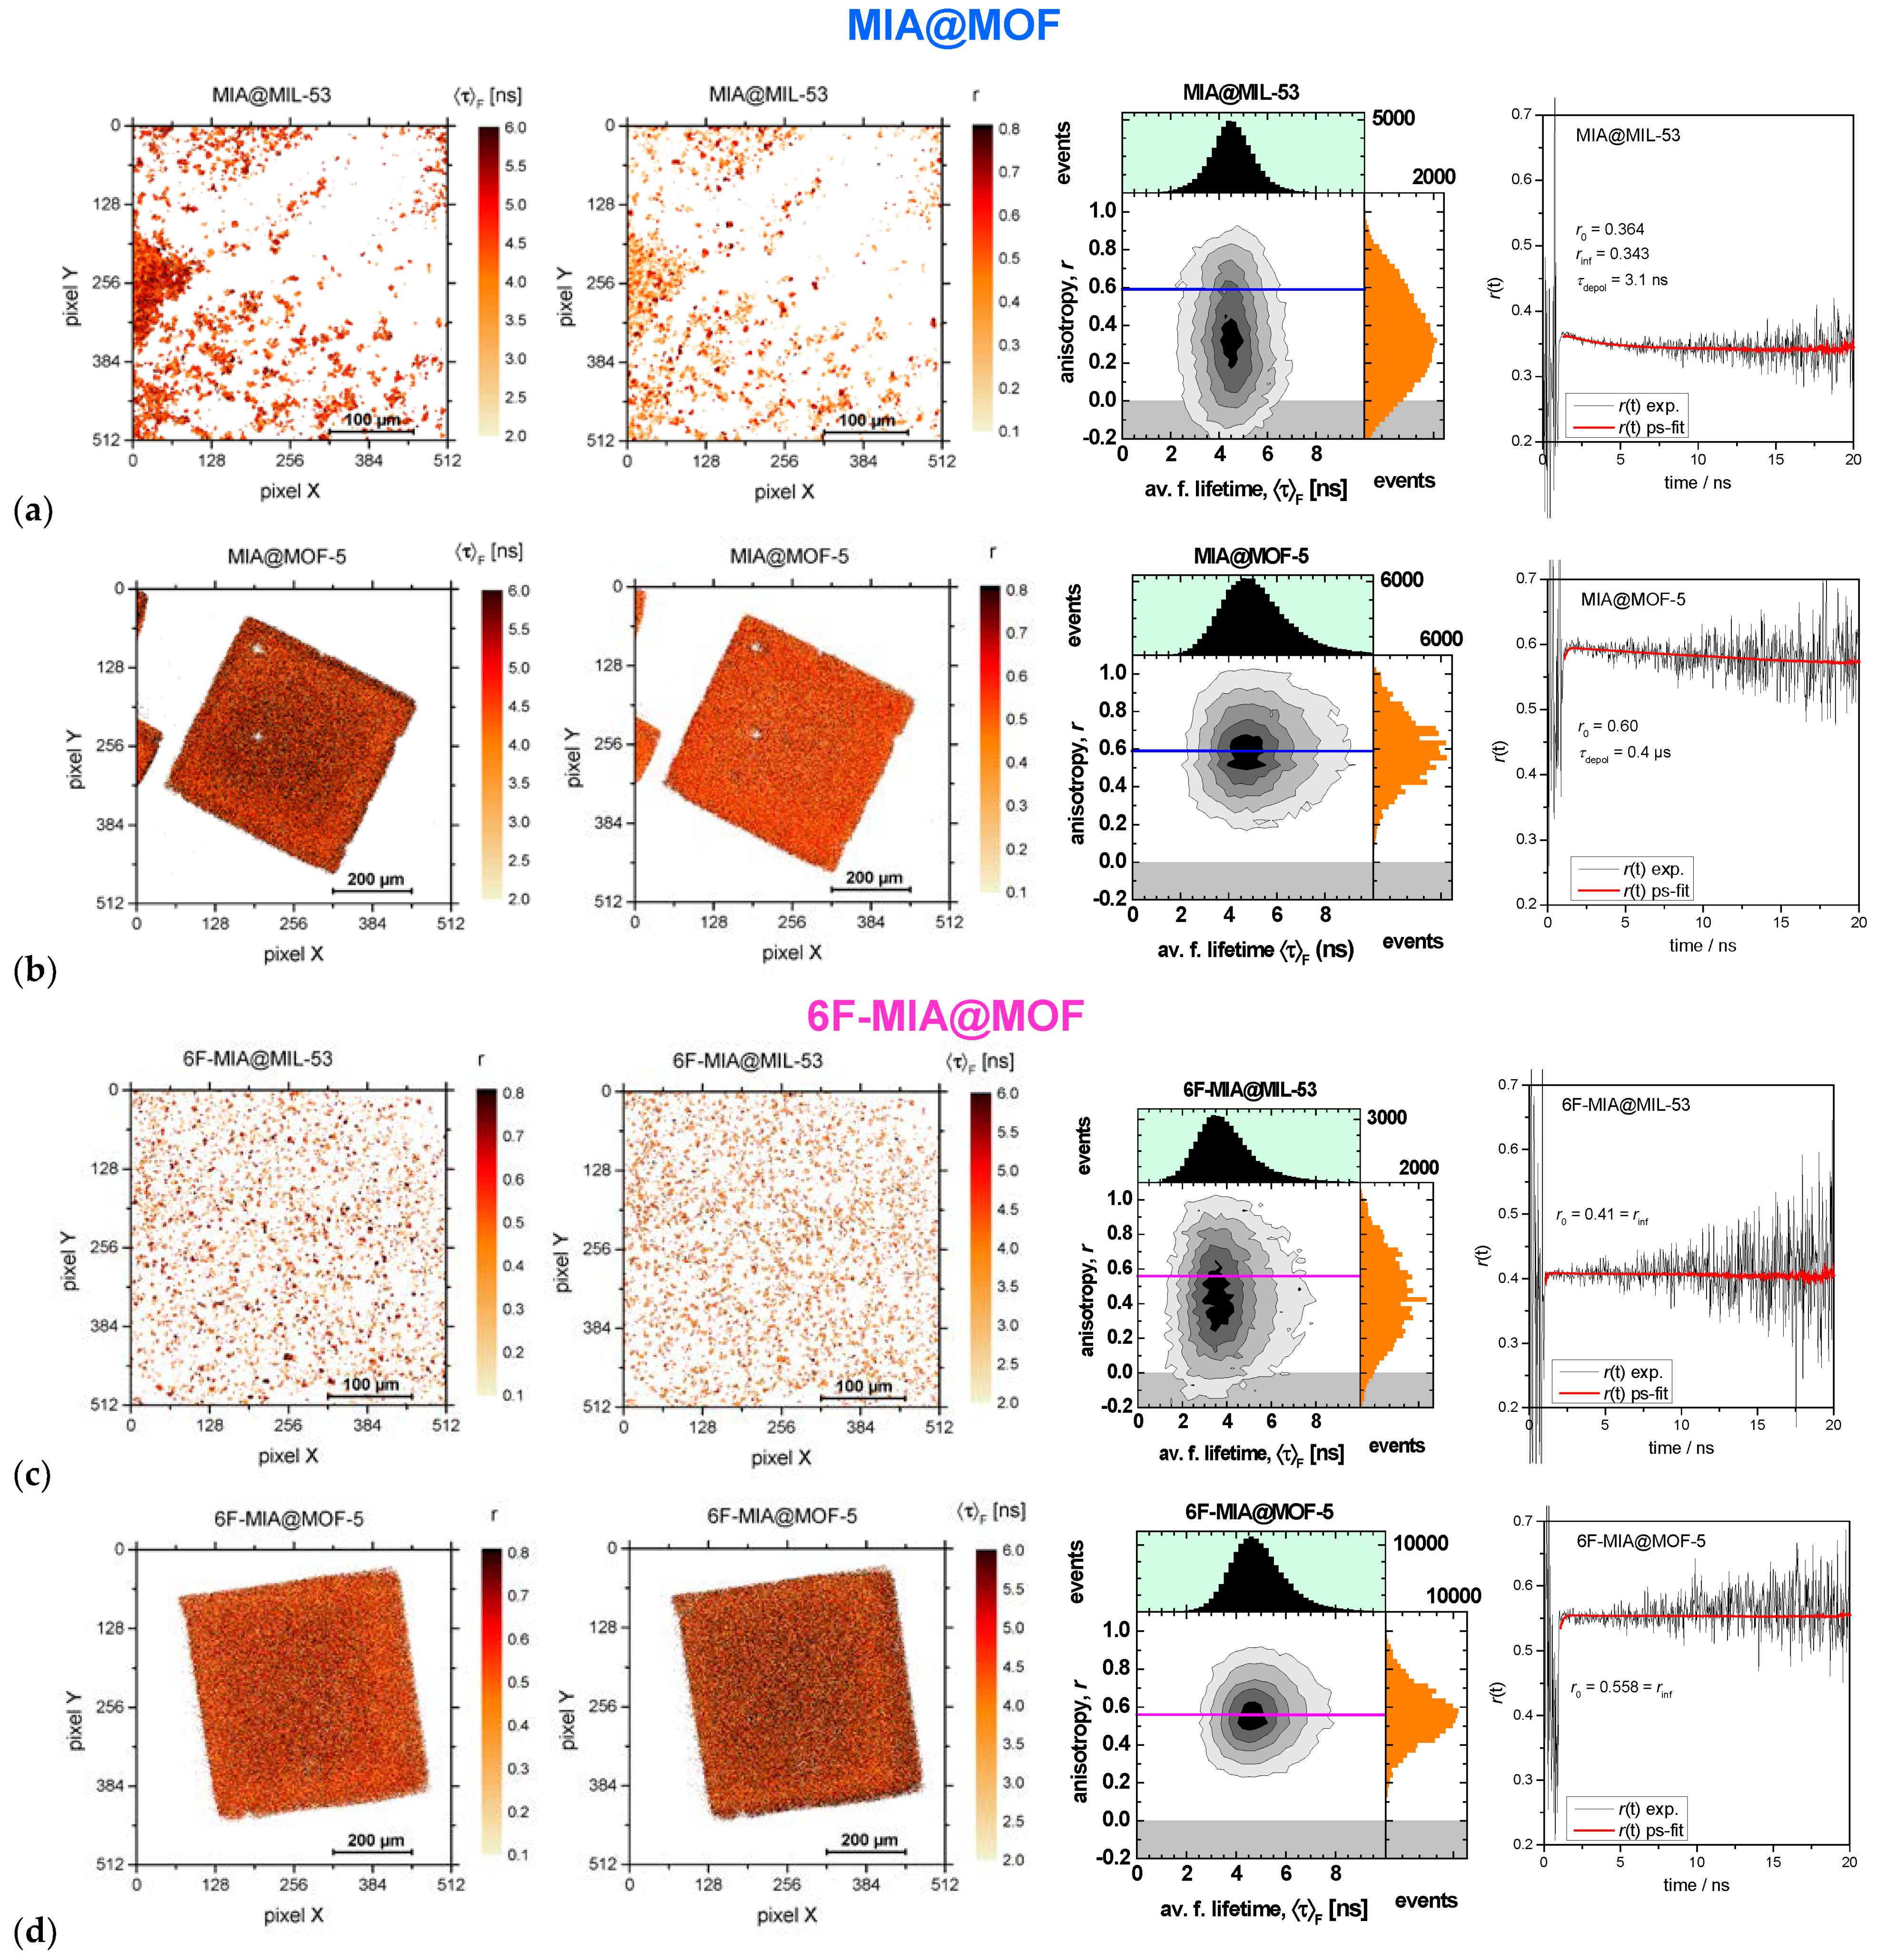
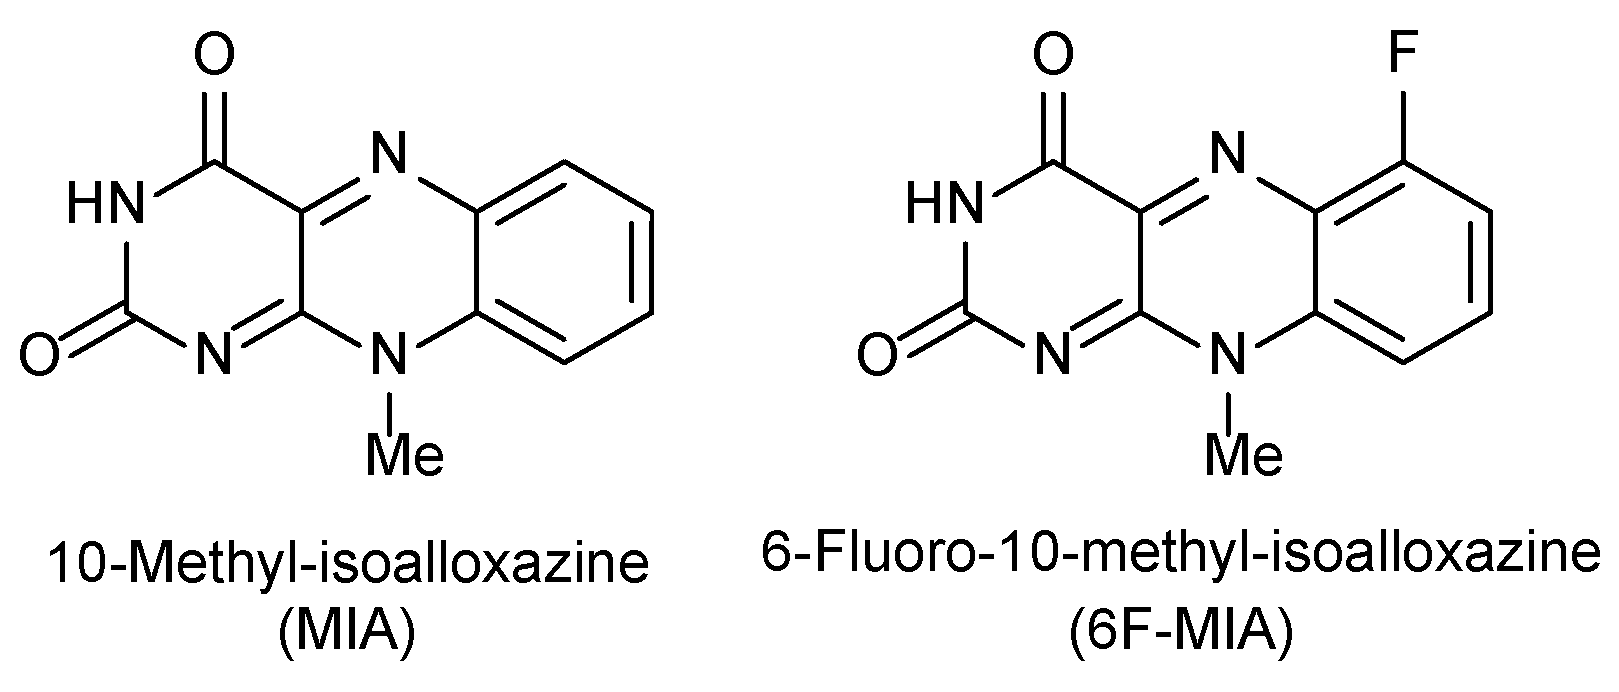
2.3. Fluorescence spectroscopy and photophysics
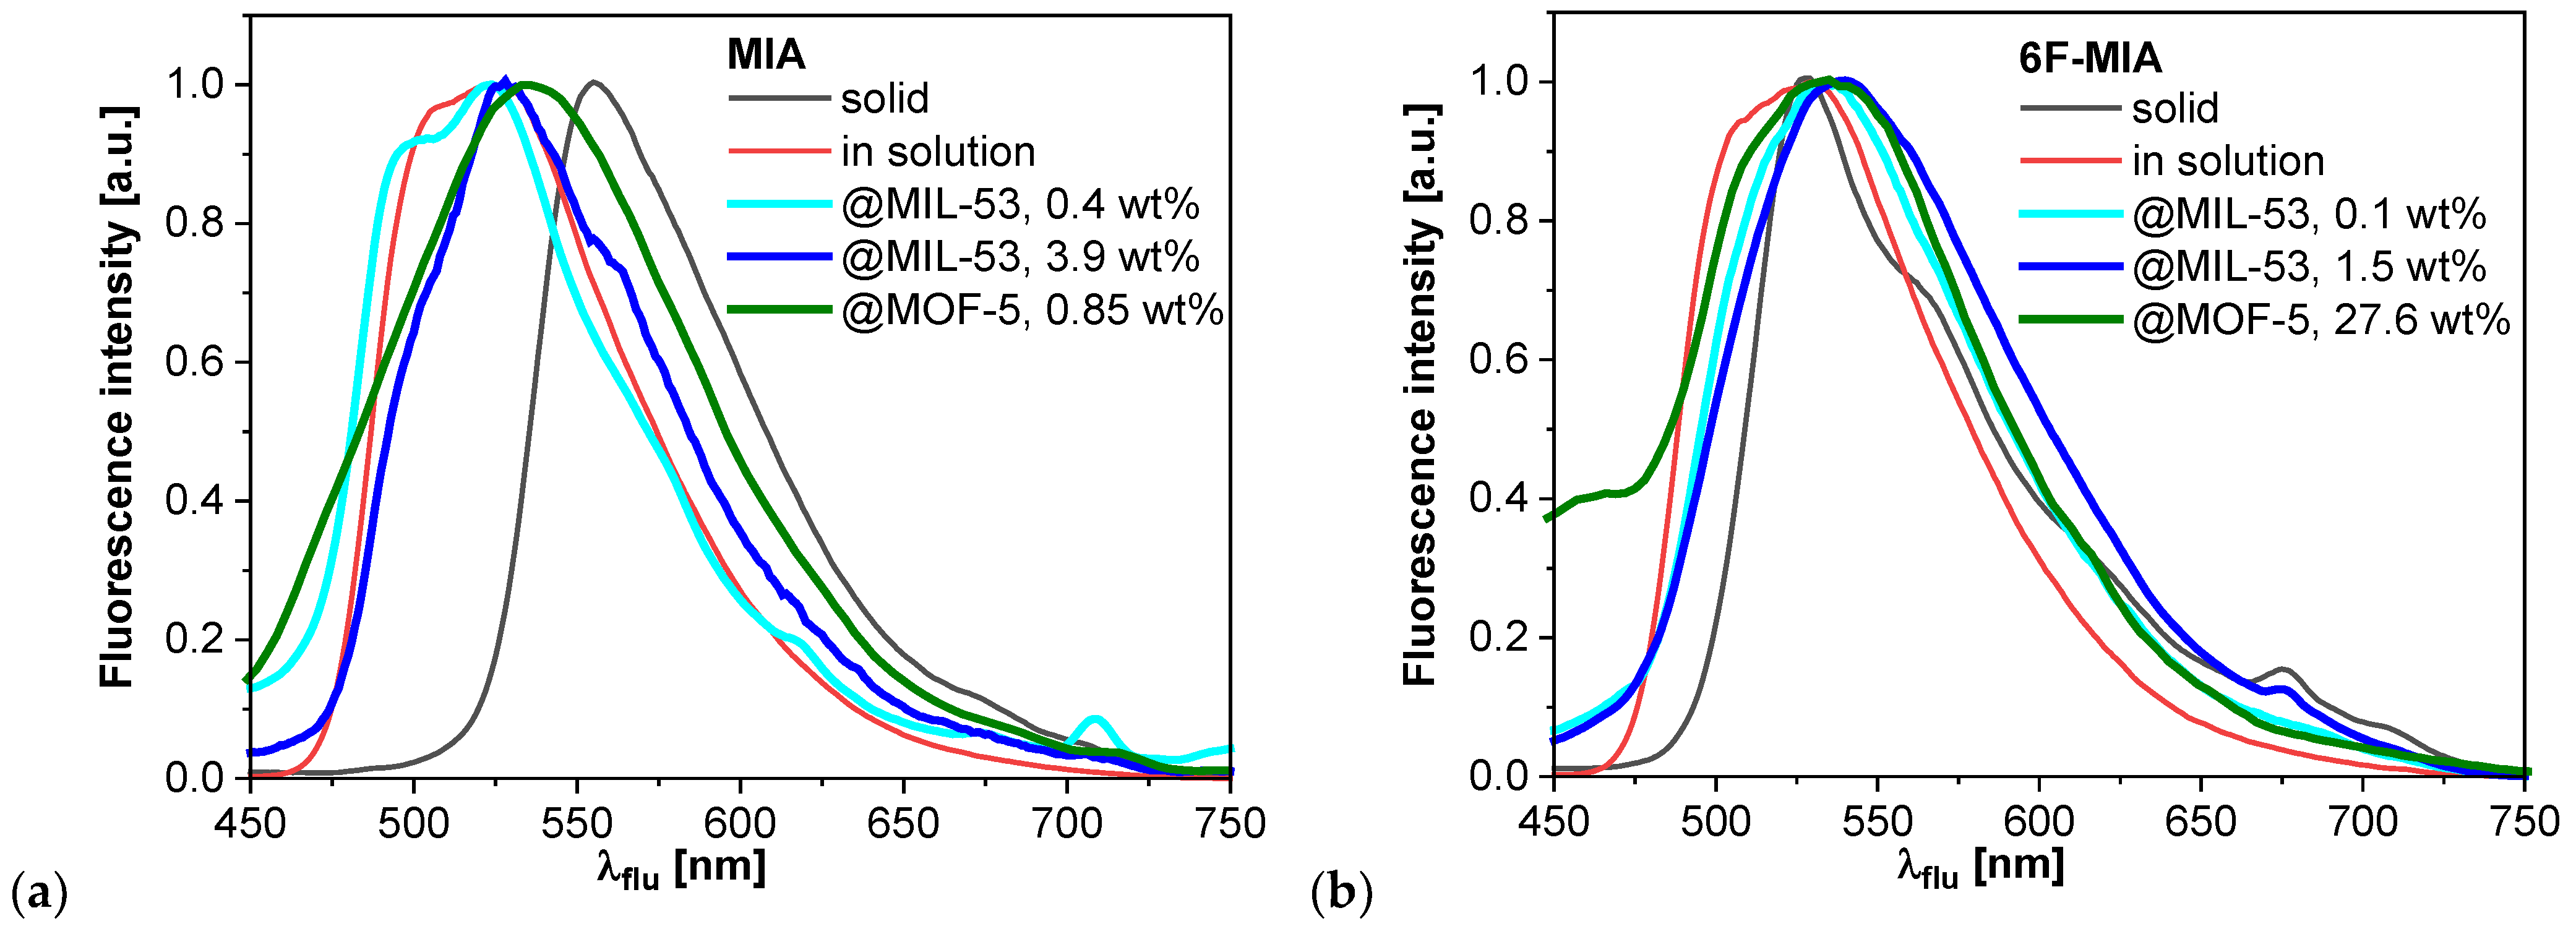
| Compound | λF,max [nm] a | τ1 (x1), τ2 (x2), τ3 (x3) [ns] b | τF [ns] b | τx [ns] b | xsq g | ΦF [%] c |
|---|---|---|---|---|---|---|
MIA in solution:
|
527 d 487/513 524 e |
10.2 (0.20), 6.1 (0.62), 2.9 (0.19) 7.5 (1) 5.0 (1) |
7.1 7.5 5.0 |
6.3 d 7.5 5.0 e |
28 d 54 22 e |
|
| MIA solid | 555, theo: 540 f | 3.5 (0.01), 0.8 (0.12), 0.2 (0.87) | 0.8 | 0.3 | < 2 | |
| 0.4 wt% MIA@MIL-53 | 523 | 7.2 (0.22), 4.0 (0.51), 1.7 (0.27) | 5.0 | 4.1 | 15 | |
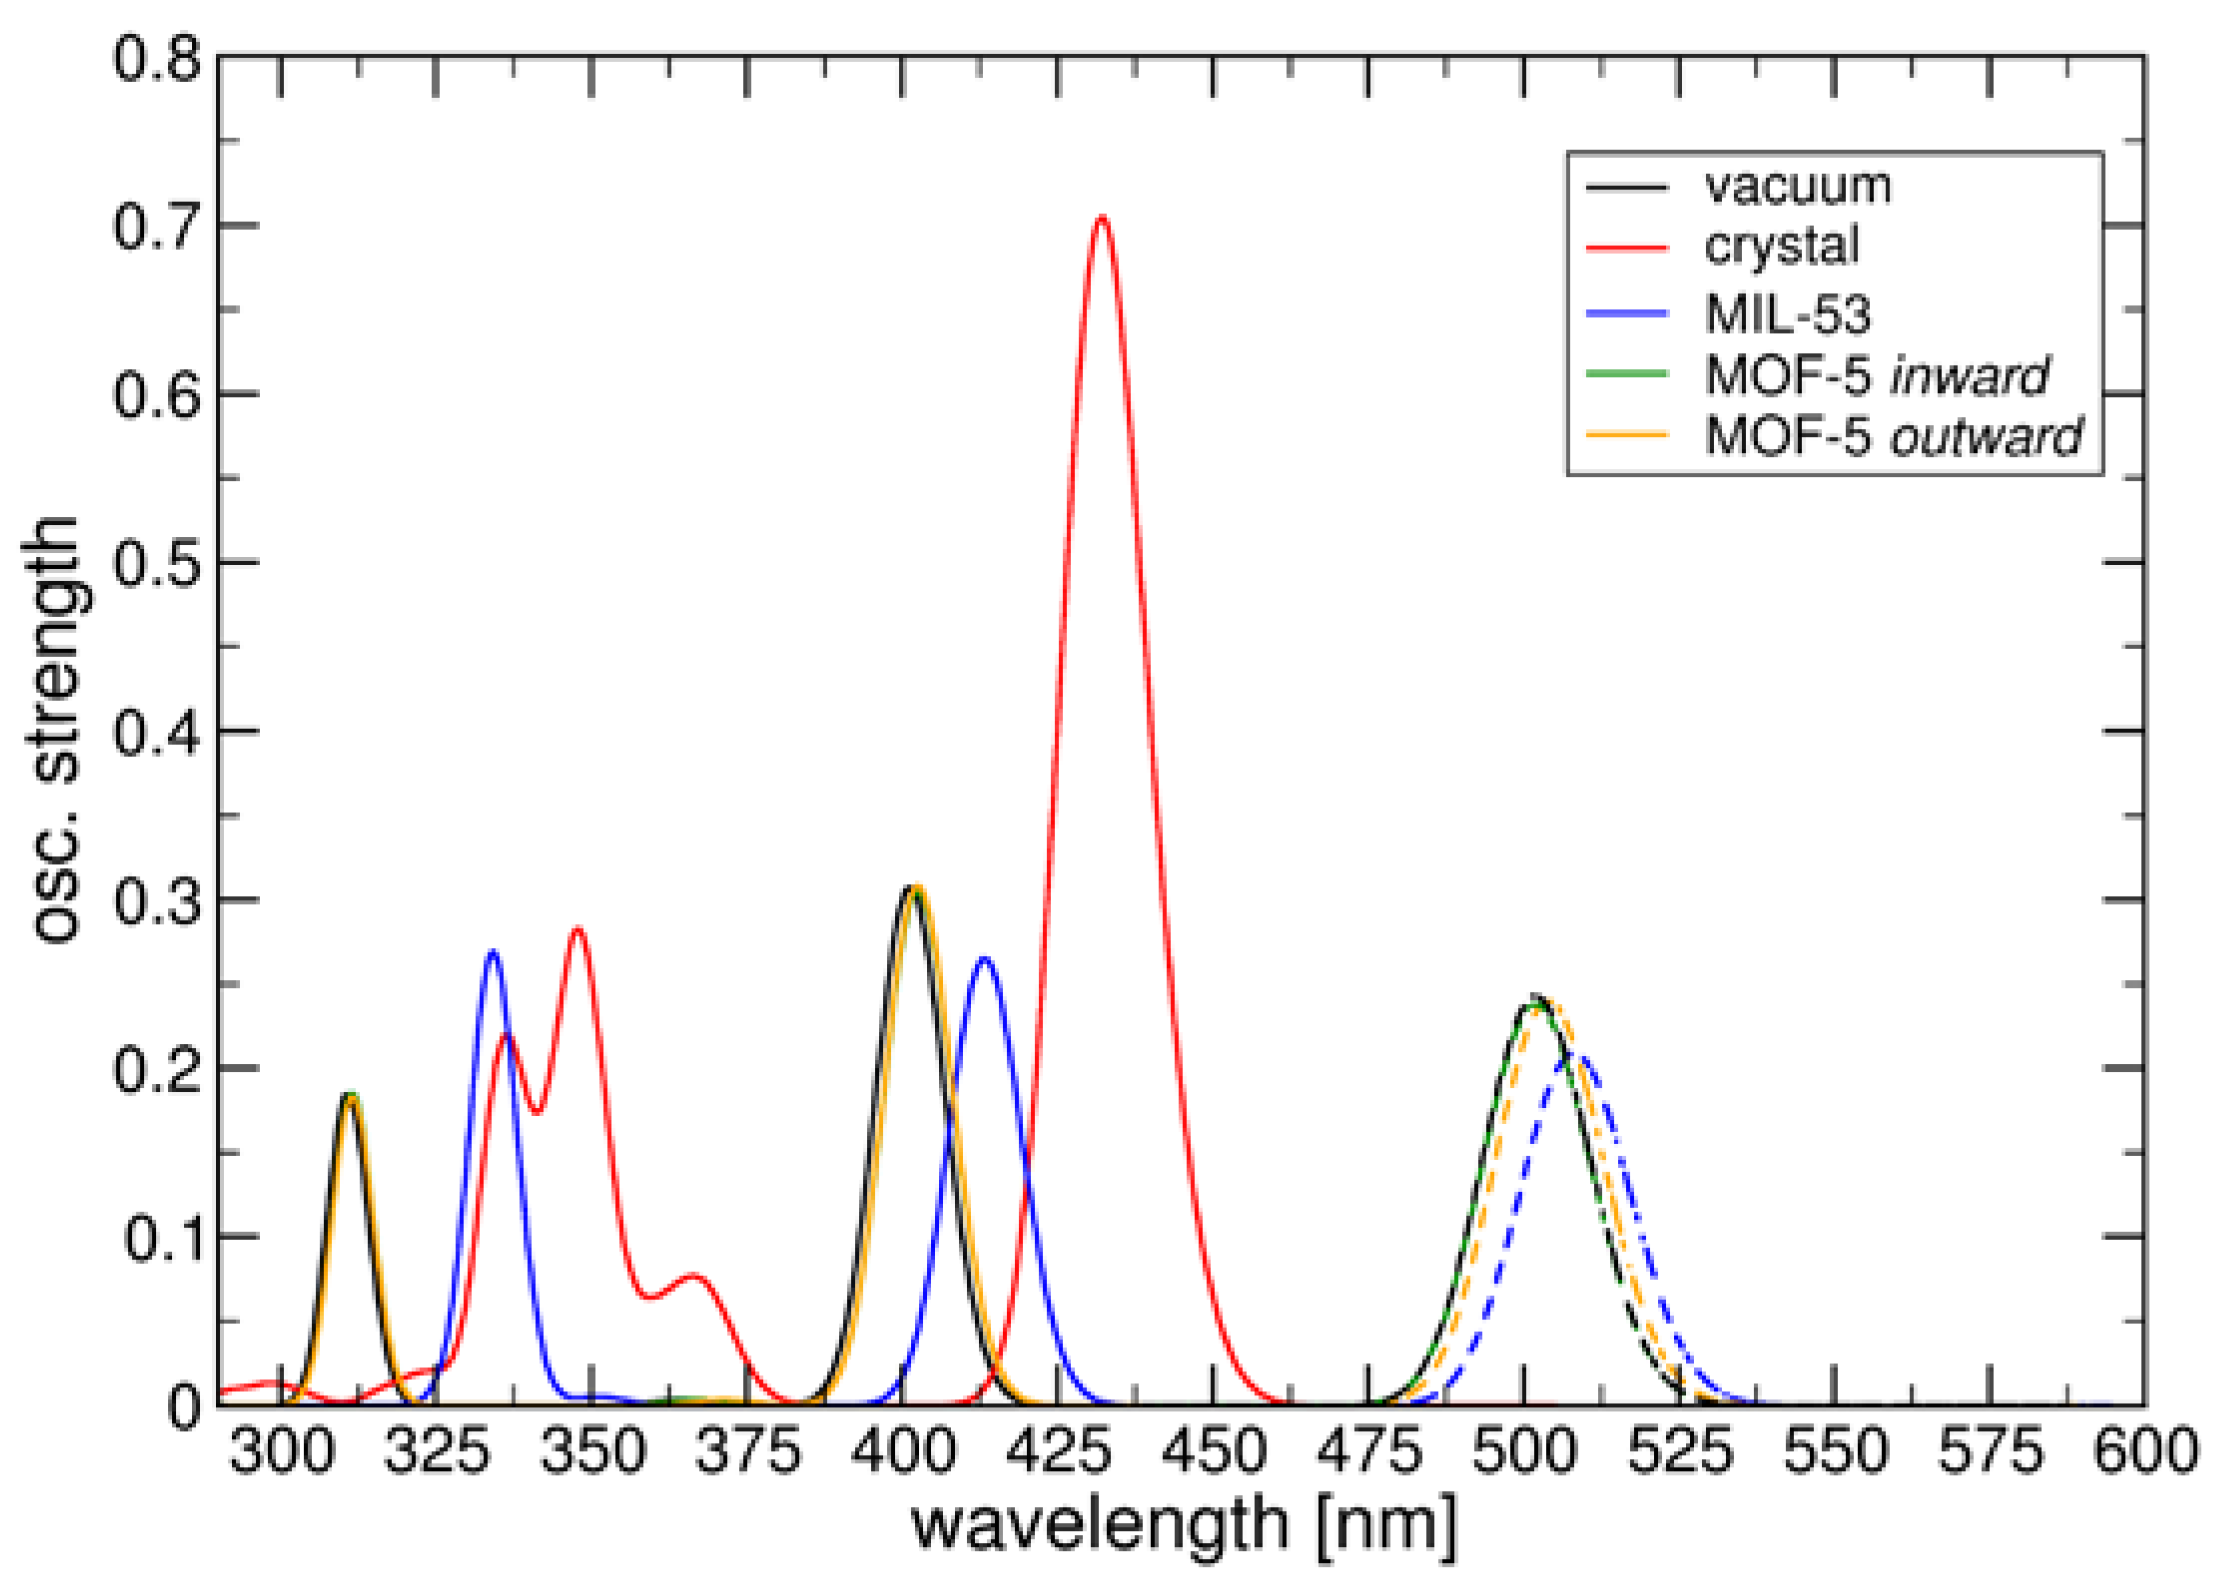
| 3.9 wt% MIA@MIL-53 | 527, theo: 509 f | 7.6 (0.17), 4.0 (0.51), 1.3 (0.32) 6.2 (0.13), 2.5 (0.33), 0.7 (0.53) g |
4.9 3.6 g |
3.7 2.1 g |
0.87 g |
11 |
| 0.85 wt% MIA@MOF-5 | 533, theo: 528 f | 9.5 (0.10), 4.2 (0.55), 1.3 (0.35) 8.6 (0.10), 3.2 (0.65), 1.3 (0.24) g |
5.1 4.7 g |
3.7 3.3 g |
0.79 g |
6 |
6F-MIA in solution:
|
530 d 486/514 533 e |
4.6 (0.17), 3.4 (0.83), -- 3.1 (0.59), 6.0 (0.41) 3.6 (1) e |
3.6 4.7 3.6 |
3.6 d 4.3 3.6 e |
13 d 26 12 e |
|
| 6F-MIA solid | 527 | 0.5 (0.01), 0.2 (0.05), 0.05 (0.94) | 0.1 | 0.06 | < 2 | |
| 0.1 wt% 6F-MIA@MIL-53 | 534 | 5.9 (0.13), 2.6 (0.46), 0.8 (0.41) | 3.4 | 2.3 | 5 | |
| 1.5 wt% 6F-MIA@MIL-53 | 538 | 6.7 (0.09), 2.5 (0.36), 0.6 (0.55) 6.7 (0.07), 2.4 (0.39), 0.8 (0.53) g |
3.5 3.2 g |
1.9 1.9 g |
0.87 g |
3 |
| 27.6 wt% 6F-MIA@MOF-5 | 510 | 7.0 (0.12), 3.2 (0.59), 0.8 (0.29) 6.2 (0.21), 2.6 (0.70), 1.1 (0.09) g |
4.1 4.0 g |
3.0 3.2 g |
0.79 g |
8 |
2.4. QM/MM excited state computations
3. Materials and Methods
3.1. Chemicals and Equipment
3.2. Flavin@MIL-53 synthesis (see also Section S1.2)
3.3. Flavin@MOF-5 synthesis (see also Section S1.2)
3.4. Computational methods
4. Conclusions
Supplementary Materials
Author Contributions
Funding
Institutional Review Board Statement
Informed Consent Statement
Data Availability Statement
Acknowledgments
Conflicts of Interest
References
- Van Berkel, W.J.H. Special Issue: Flavoenzymes. Molecules 2018, 23, 1957. [Google Scholar] [CrossRef]
- Romero, E.; Gómez Castellanos, J.R.; Gadda, G.; Fraaije, M.W.; Mattevi, A. Same Substrate, Many Reactions: Oxygen Activation in Flavoenzymes. Chem. Rev. 2018, 118, 1742–1769. [Google Scholar] [CrossRef] [PubMed]
- Edwards, A.M. Flavins and Flavoproteins. Methods in Molecular Biology; Weber, S., Schleicher, E., Eds.; Humana Press: New York, NY, USA, 2014; Volume 1146, pp. 3–13. [Google Scholar] [CrossRef]
- Penzer, G.R.; Radda, G.K. The chemistry and biological function of isoalloxazines (flavines). Q. Rev. Chem. Soc. 1967, 21, 43–65. [Google Scholar] [CrossRef]
- Penzkofer, A. Absorption and emission spectroscopic investigation of alloxazine in aqueous solutions and comparison with lumichrome, J. Photochem. Photobiol. A Chem. 2016, 314, 114–124. [Google Scholar] [CrossRef]
- Ramírez-Gamboa, D.; Díaz-Zamorano, A.L.; Meléndez-Sánchez, E.R.; Reyes-Pardo, H.; Villaseñor-Zepeda, K.R.; López-Arellanes, M.E.; Sosa-Hernández, J.E.; Coronado-Apodaca, K.G.; Gámez-Méndez, A.; Afewerki, S.; et al. Photolyase Production and Current Applications: A Review. Molecules 2022, 27, 5998. [Google Scholar] [CrossRef]
- Powers, H.J. Riboflavin (vitamin B-2) and health. Am. J. Clin. Nutr. 2003, 77, 1352–1360. [Google Scholar] [CrossRef] [PubMed]
- Liscum, E.; Hodgson, D.W.; Campbell, T.J. Blue Light Signaling through the Cryptochromes and Phototropins. So That’s What the Blues Is All About. Plant Physiol. 2003, 133, 1429–1436. [Google Scholar] [CrossRef]
- van der Horst, M.A.; Hellingwerf, K.J. Photoreceptor Proteins, “Star Actors of Modern Times”: A Review of the Functional Dynamics in the Structure of Representative Members of Six Different Photoreceptor Families. Acc. Chem. Res. 2004, 37, 13–20. [Google Scholar] [CrossRef]
- Silva, E.; Edwards, A.M. Flavins: Photochemistry and Photobiology. In Comprehensive Series in Photochemical & Photobiological Sciences; Royal Society of Chemistry: Cambridge, UK, 2006; pp. 1–338. [Google Scholar] [CrossRef]
- Mansoorabadi, S.O.; Thibodeaux, C.J.; Liu, H.-W. The diverse roles of flavin coenzymes--nature’s most versatile thespians. J. Org. Chem. 2007, 72, 6329–6342. [Google Scholar] [CrossRef] [PubMed]
- Galbán, J.; Sanz-Vicente, I.; Navarro, J.; de Marcos, S. The intrinsic fluorescence of FAD and its application in analytical chemistry: A review. Methods Appl. Fluoresc. 2016, 4, 042005. [Google Scholar] [CrossRef]
- Ahmad, I.; Vaid, F.H. Photochemistry of Flavins in Aqueous and Organic Solvents. In Comprehensive Series in Photochemical & Photobiological Sciences; Silva, E., Edwards, A.M., Eds.; Royal Society of Chemistry: Cambridge, UK, 2007; pp. 13–40. [Google Scholar] [CrossRef]
- Kotaki, A.; Yagi, K. Fluorescence Properties of Flavins in Various Solvents. J. Biochem. 1970, 68, 509–516. [Google Scholar] [CrossRef]
- Bracker, M.; Kubitz, M.K.; Czekelius, C.; Marian, C.M.; Kleinschmidt, M. Computer-Aided Design of Fluorinated Flavin Derivatives by Modulation of Intersystem Crossing and Fluorescence. ChemPhotoChem 2022, 6, e202200040. [Google Scholar] [CrossRef]
- Mukherjee, A.; Walker, J.; Weyant, K.B.; Schroeder, C.M. Characterization of flavin-based fluorescent proteins: An emerging class of fluorescent reporters. PLoS ONE 2013, 8, e64753. [Google Scholar] [CrossRef] [PubMed]
- Reiffers, A.; Ziegenbein, C.T.; Engelhardt, A.; Kühnemuth, R.; Gilch, P.; Czekelius, C. Impact of Mono-Fluorination on the Photophysics of the Flavin Chromophore. Photochem. Photobiol. 2018, 94, 667–676. [Google Scholar] [CrossRef]
- Ryu, U.; Lee, H.S.; Park, K.S.; Choi, K.M. The rules and roles of metal–organic framework in combination with molecular dyes. Polyhedron 2018, 154, 275–294. [Google Scholar] [CrossRef]
- Nguyen, T.N.; Ebrahim, F.M.; Stylianou, K.C. Photoluminescent, upconversion luminescent and nonlinear optical metal-organic frameworks: From fundamental photophysics to potential applications. Coord. Chem. Rev. 2018, 377, 259–306. [Google Scholar] [CrossRef]
- Li, H.; Zhang, L.; He, H.; Yang, Y.; Cui, Y.; Qian, G. Tunable nonlinear optical responses based on hostguest MOF hybrid materials. Sci. China Mater. 2020, 64, 698–705. [Google Scholar] [CrossRef]
- Xing, S.; Janiak, C. Design and properties of multiple-emitter luminescent metal-organic frameworks. Chem. Commun. 2020, 56, 12290–12306. [Google Scholar] [CrossRef]
- Wan, Y.; Li, Y.; Yue, D. Dye-Encapsulated Metal–Organic Frameworks for the Multi-Parameter Detection of Temperature. Molecules 2023, 28, 729. [Google Scholar] [CrossRef]
- Sun, Z.; Khurshid, A.; Sohail, M.; Qiu, W.; Cao, D.; Su, S.-J. Encapsulation of Dyes in Luminescent Metal-Organic Frameworks for White Light Emitting Diodes. Nanomaterials 2021, 11, 2761. [Google Scholar] [CrossRef]
- Janiak, C.; Vieth, J.K. MOFs, MILs and more: Concepts, properties and applications for porous coordination networks (PCNs). New J. Chem. 2010, 34, 2366–2388. [Google Scholar] [CrossRef]
- Yuan, S.; Feng, L.; Wang, K.; Pang, J.; Bosch, M.; Lollar, C.; Sun, Y.; Qin, J.; Yang, X.; Zhang, P.; et al. Stable Metal-Organic Frameworks: Design, Synthesis, and Applications. Adv. Mater. 2018, 30, e1704303. [Google Scholar] [CrossRef] [PubMed]
- Lu, W.; Wei, Z.; Gu, Z.-Y.; Liu, T.-F.; Park, J.; Park, J.; Tian, J.; Zhang, M.; Zhang, Q.; Gentle, T.; et al. Tuning the structure and function of metal-organic frameworks via linker design. Chem. Soc. Rev. 2014, 43, 55615593. [Google Scholar] [CrossRef]
- Ebrahimi, A.; Krivosudský, L. Metalloporphyrin Metal–Organic Frameworks: Eminent Synthetic Strategies and Recent Practical Exploitations. Molecules 2022, 27, 4917. [Google Scholar] [CrossRef] [PubMed]
- Woschko, D.; Millan, S.; Ceyran, M.-A.; Oestreich, R.; Janiak, C. Synthesis of a Chiral 3,6T22-Zn-MOF with a T-Shaped Bifunctional Pyrazole-Isophthalate Ligand Following the Principles of the Supramolecular Building Layer Approach. Molecules 2022, 27, 5374. [Google Scholar] [CrossRef] [PubMed]
- Qin, L.; Liang, F.; Li, Y.; Wu, J.; Guan, S.; Wu, M.; Xie, S.; Luo, M.; Ma, D. A 2D Porous Zinc-Organic Framework Platform for Loading of 5-Fluorouracil. Inorganics 2022, 10, 202. [Google Scholar] [CrossRef]
- Zheng, M.; Chen, J.; Zhang, L.; Cheng, Y.; Lu, C.; Liu, Y.; Singh, A.; Trivedi, M.; Kumar, A.; Liu, J. Metal organic frameworks as efficient adsorbents for drugs from wastewater. Mater. Today Commun. 2022, 31, 103514. [Google Scholar] [CrossRef]
- Dong, X.; Li, Y.; Li, D.; Liao, D.; Qin, T.; Prakash, O.; Kumar, A.; Liu, J. A new 3D 8-connected Cd(II) MOF as a potent photocatalyst for oxytetracycline antibiotic degradation. CrystEngComm 2022, 24, 6933–6943. [Google Scholar] [CrossRef]
- Chen, Y.; Yu, B.; Cui, Y.; Xu, S.; Gong, J. Core–Shell Structured Cyclodextrin Metal–Organic Frameworks with Hierarchical Dye Encapsulation for Tunable Light Emission. Chem. Mater. 2019, 31, 1289–1295. [Google Scholar] [CrossRef]
- Pramanik, S.; Zheng, C.; Zhang, X.; Emge, T.J.; Li, J. New microporous metal-organic framework demonstrating unique selectivity for detection of high explosives and aromatic compounds. J. Am. Chem. Soc. 2011, 133, 4153–4155. [Google Scholar] [CrossRef]
- Pramanik, S.; Hu, Z.; Zhang, X.; Zheng, C.; Kelly, S.; Li, J. A Systematic Study of Fluorescence-Based Detection of Nitroexplosives and Other Aromatics in the Vapor Phase by Microporous Metal–Organic Frameworks. Chem. Eur. J. 2013, 19, 15964–15971. [Google Scholar] [CrossRef] [PubMed]
- Hu, Z.; Pramanik, S.; Tan, K.; Zheng, C.; Liu, W.; Zhang, X.; Chabal, Y.J.; Li, J. Selective, Sensitive, and Reversible Detection of Vapor-Phase High Explosives via Two-Dimensional Mapping: A New Strategy for MOF-Based Sensors. Cryst. Growth Des. 2013, 13, 4204–4207. [Google Scholar] [CrossRef]
- Hu, Z.; Deibert, B.J.; Li, J. Luminescent metal–organic frameworks for chemical sensing and explosive detection. Chem. Soc. Rev. 2014, 43, 5815–5840. [Google Scholar] [CrossRef]
- Zheng, J.-P.; Ou, S.; Zhao, M.; Wu, C.-D. A Highly Sensitive Luminescent Dye@MOF Composite for Probing Different Volatile Organic Compounds. ChemPlusChem 2016, 81, 758–763. [Google Scholar] [CrossRef]
- Miller, S.E.; Teplensky, M.H.; Moghadam, P.Z.; Fairen-Jimenez, D. Metal-organic frameworks as biosensors for luminescence-based detection and imaging. Interface Focus 2016, 6, 20160027. [Google Scholar] [CrossRef] [PubMed]
- Zhao, D.; Yu, S.; Jiang, W.-J.; Cai, Z.-H.; Li, D.-L.; Liu, Y.-L.; Chen, Z.-Z. Recent Progress in Metal-Organic Framework Based Fluorescent Sensors for Hazardous Materials Detection. Molecules 2022, 27, 2226. [Google Scholar] [CrossRef] [PubMed]
- Li, L.; Zou, J.; Han, Y.; Liao, Z.; Lu, P.; Nezamzadeh-Ejhieh, A.; Liu, J.; Peng, Y. Recent advances in Al(III)/In(III)-based MOFs for the detection of pollutants. New J. Chem. 2022, 46, 19577–19592. [Google Scholar] [CrossRef]
- Loiseau, T.; Serre, C.; Huguenard, C.; Fink, G.; Taulelle, F.; Henry, M.; Bataille, T.; Férey, G. A Rationale for the Large Breathing of the Porous Aluminum Terephthalate (MIL-53) Upon Hydration Chem. Eur. J. 2004, 10, 1373–1382. [Google Scholar] [CrossRef]
- Ashling, C.W.; Johnstone, D.N.; Widmer, R.N.; Hou, J.; Collins, S.M.; Sapnik, A.F.; Bumstead, A.M.; Midgley, P.A.; Chater, P.A.; Keen, D.A.; et al. Synthesis and Properties of a Compositional Series of MIL-53(Al) Metal–Organic Framework Crystal-Glass Composites. J. Am. Chem. Soc. 2019, 141, 15641–15648. [Google Scholar] [CrossRef]
- Millange, F.; Walton, R.I. MIL-53 and its Isoreticular Analogues: A Review of the Chemistry and Structure of a Prototypical Flexible Metal-Organic Framework. Isr. J. Chem. 2018, 58, 1019–1035. [Google Scholar] [CrossRef]
- eilikhov, M.; Yusenko, K.; Fischer, R.A. The adsorbate structure of ferrocene inside [Al(OH)(bdc)]x (MIL-53): A powder X-ray diffraction study. Dalton Trans. 2009, 600–602. [Google Scholar] [CrossRef]
- Millange, F.; Serre, C.; Férey, G. Synthesis, structure determination and properties of MIL-53as and MIL-53ht: The first CrIII hybrid inorganic–organic microporous solids: CrIII(OH)·{O2C-C6H4-CO2}·{HO2C-C6H4-CO2H}x. Chem. Commun. 2002, 822–823. [Google Scholar] [CrossRef]
- Millange, F.; Guillou, N.; Walton, R.I.; Grenèche, J.-M.; Margiolaki, I.; Férey, G. Effect of the nature of the metal on the breathing steps in MOFs with dynamic frameworks. Chem. Commun. 2008, 4732–4734. [Google Scholar] [CrossRef] [PubMed]
- Serre, C.; Millange, F.; Thouvenot, C.; Noguès, M.; Marsolier, G.; Louër, D.; Férey, G. Very Large Breathing Effect in the First Nanoporous Chromium(III)-Based Solids: MIL-53 or CrIII(OH)·{O2C-C6H4-CO2}·{HO2C-C6H4-CO2H}x·H2Oy. J. Am. Chem. Soc. 2002, 124, 13519–13526. [Google Scholar] [CrossRef] [PubMed]
- Millange, F.; Serre, C.; Guillou, N.; Férey, G.; Walton, R.I. Structural Effects of Solvents on the Breathing of Metal-Organic Frameworks: An In Situ Diffraction Study. Angew. Chem. Int. Ed. 2008, 47, 4100–4105. [Google Scholar] [CrossRef]
- Couck, S.; Gobechiya, E.; Kirschhock, C.E.A.; Serra-Crespo, P.; Juan-Alcañiz, J.; Martinez Joaristi, A.; Stavitski, E.; Gascon, J.; Kapteijn, F.; Baron, G.V.; et al. Adsorption and Separation of Light Gases on an Amino-Functionalized Metal–Organic Framework: An Adsorption and In Situ XRD Study. ChemSusChem, 2012, 5, 740–750. [Google Scholar] [CrossRef]
- Salles, F.; Bourrelly, S.; Jobic, H.; Devic, T.; Guillerm, V.; Llewellyn, P.; Serre, C.; Ferey, G.; Maurin, G. Molecular Insight into the Adsorption and Diffusion of Water in the Versatile Hydrophilic/Hydrophobic Flexible MIL-53(Cr) MOF. J. Phys. Chem. C 2011, 115, 21–10764. [Google Scholar] [CrossRef]
- Kaye, S.S.; Dailly, A.; Yaghi, O.M.; Long, J.R. Impact of Preparation and Handling on the Hydrogen Storage Properties of Zn4O(1,4-benzenedicarboxylate)3 (MOF-5). J. Am. Chem. Soc. 2007, 129, 14176–14177. [Google Scholar] [CrossRef]
- Li, H.; Eddaoudi, M.; O’Keeffe, M.; Yaghi, O.M. Design and synthesis of an exceptionally stable and highly porous metal-organic framework. Nature 1999, 402, 276–279. [Google Scholar] [CrossRef]
- Zhang, L.; Li, H.; Yang, Y.; Yang, D.; Cui, Y.; Quia, G. Aligned chromophores in a host–guest MOF crystal for switchable polarized nonlinear optical response. J. Mater. Chem. C 2022, 10, 14915–14920. [Google Scholar] [CrossRef]
- Haldar, R.; Mazel, A.; Krstić, M.; Zhang, Q.; Jakoby, M.; Howard, I.A.; Richards, B.S.; Jung, N.; Jacquemin, D.; Diring, S. A de novo strategy for predictive crystal engineering to tune excitonic coupling. Nat. Commun. 2019, 10, 2048. [Google Scholar] [CrossRef]
- Mópez Arbeloa, F.; Martínez Martínez, V.; Arbeloa, T.; López Arbeloa, I. Photoresponse and anisotropy of rhodamine dye intercalated in ordered clay layered films. J. Photochem. Photobiol. C Photochem. Rev. 2007, 8, 85–108. [Google Scholar] [CrossRef]
- Lartínez Martínez, V.; López Arbeloa, F.; Bañuelos Prieto, J.; López Arbeloa, I. Orientation of Adsorbed Dyes in the Interlayer Space of Clays. 1. Anisotropy of Rhodamine 6G in Laponite Films by Vis-Absorption with Polarized Light. Chem. Mater. 2005, 17, 4134–4141. [Google Scholar] [CrossRef]
- Brandenburg, K. Diamond (Version 4.6), Crystal and Molecular Structure Visualization, Crystal Impact; K. Brandenburg & H. Putz Gbr: Bonn, Germany, 2009–2022. [Google Scholar]
- Li, H.; Eddaoudi, M.; O’Keeffe, M.; Yaghi, O.M. CCDC 256966: Experimental Crystal Structure Determinatio; Cambridge Crystallographic Data Centre: Cambridge, UK, 2005. [Google Scholar] [CrossRef]
- Ma, M.; Gross, A.; Zacher, D.; Pinto, A.; Noei, H.; Wang, Y.; Fischer, R.A.; Metzler-Nolte, N. Use of confocal fluorescence microscopy to compare different methods of modifying metal–organic framework (MOF) crystals with dyes. CrystEngComm 2011, 13, 2828–2832. [Google Scholar] [CrossRef]
- Wang, M. , Fritchie Jr., C.J. Geometry of the Unperturbed Flavin Nucleus. The Crystal Structure of 10-Methylisoalloxazine. Acta Cryst. 1973, B29, 2040–2045. [Google Scholar] [CrossRef]
- Taheri, A.; Babakhani, E.G.; Towfighi, J. Study of synthesis parameters of MIL-53(Al) using experimental design methodology for CO2/CH4 separation. Adsorption Science Technology 2018, 36, 247–269. [Google Scholar] [CrossRef]
- Han, S.; Wei, Y.; Valente, C.; Lagzi, I.; Gassensmith, J.J.; Coskun, A.; Stoddart, J.F.; Grzybowski, B.A. Chromatography in a Single Metal−Organic Framework (MOF) Crystal. J. Am. Chem. Soc. 2010, 132, 16358–16361. [Google Scholar] [CrossRef]
- Alaerts, L.; Maes, M.; Giebeler, L.; Jacobs, P.A.; Martens, J.A.; Denayer, J.F.M.; Kirschhock, C.E.A.; De Vos, D.E. Selective Adsorption and Separation of ortho-Substituted Alkylaromatics with the Microporous Aluminum Terephthalate MIL-53. J. Am. Chem. Soc. 2008, 130, 14170–14178. [Google Scholar] [CrossRef]
- Llewellyn, P.L.; Horcajada, P.; Maurin, G.; Devic, T.; Rosenbach, N.; Bourrelly, S.; Serre, C.; Vincent, D.; Loera-Serna, S.; Filinchuk, Y.; et al. Complex Adsorption of Short Linear Alkanes in the Flexible Metal-Organic-Framework MIL-53(Fe). J. Am. Chem. Soc. 2009, 131, 13002–13008. [Google Scholar] [CrossRef]
- Rosenbach, N.J.; Jobic, H.; Ghoufi, A.; Salles, F.; Maurin, G.; Bourrelly, S.; Llewellyn, P.L.; Devic, T.; Serre, C.; Férey, G. Quasi-Elastic Neutron Scattering and Molecular Dynamics Study of Methane Diffusion in Metal Organic Frameworks MIL-47(V) and MIL-53(Cr). Angew. Chem. Int. Ed. 2008, 47, 6611–6615. [Google Scholar] [CrossRef]
- Brown, S.A.; Rizzo, C.J. A “One-Pot” Phase Transfer Alkylation/Hydrolysis of o-Nitrotrifluoroacetanilides. A Convenient Route to N-Alkyl o-Phenylenediamines. Synth. Commun. 1996, 26, 4065–4080. [Google Scholar] [CrossRef]
- Imada, Y.; Iida, H.; Ono, S.; Masui, Y.; Murahashi, S.-I. Flavin-Catalyzed Oxidation of Amines and Sulfides with Molecular Oxygen: Biomimetic Green Oxidation. Chem. Asian J. 2006, 136–147. [Google Scholar] [CrossRef]
- Eddaoudi, M.; Kim, J.; Rosi, N.; Vodak, D.; Wachter, J.; O’Keeffe, M.; Yaghi, O.M. Systematic Design of Pore Size and Functionality in Isoreticular MOFs and Their Application in Methane Storage. Science 2002, 295, 469–472. [Google Scholar] [CrossRef] [PubMed]
- Weidtkamp-Peters, S.; Felekyan, S.; Bleckmann, A.; Simon, R.; Becker, W.; Kühnemuth, R.; Seidel, C.A.M. Multiparameter Fluorescence Image Spectroscopy to study molecular interactions. Photochem. Photobiol. Sci. 2009, 8, 470–480. [Google Scholar] [CrossRef] [PubMed]
- Koshioka, M.; Sasaki, K.; Masuhara, H. Time-Dependent Fluorescence Depolarization Analysis in Three-Dimensional Microspectroscopy. Appl. Spectrosc. 1995, 49, 224–228. [Google Scholar] [CrossRef]
- Giannozzi, P.; Baroni, S.; Bonini, N.; Calandra, M.; Car, R.; Cavazzoni, C.; Ceresoli, D.; Chiarotti, G.L.; Cococcioni, M.; Dabo, I.; et al. QUANTUM ESPRESSO: A modular and open-source software project for quantum simulations of materials. J. Phys. Condens. Matter 2009, 21, 395502. [Google Scholar] [CrossRef]
- Rappe, A.M.; Rabe, K.M.; Kaxiras, E.; Joannopoulos, J.D. Optimized pseudopotentials. Phys. Rev. B 1990, 41, 1227–1230. [Google Scholar] [CrossRef]
- Perdew, J.P.; Ernzerhof, M. Rationale for mixing exact exchange with density functional approximations. J. Chem. Phys. 1996, 105, 9982–9985. [Google Scholar] [CrossRef]
- Grimme, S.; Antony, J.; Ehrlich, S.; Krieg, H. A consistent and accurate ab initio parametrization of density functional dispersion correction (DFT-D) for the 94 elements H-Pu. J. Chem. Phys. 2010, 132, 154104. [Google Scholar] [CrossRef]
- Frisch, M.J.; Trucks, G.W.; Schlegel, H.B.; Scuseria, G.E.; Robb, M.A.; Cheeseman, J.R.; Scalmani, G.; Barone, V.; Petersson, G.A.; Nakatsuji, H.; et al. Gaussian 16, Revision C.01; Gaussian, Inc.: Wallingford, CT, USA, 2016. [Google Scholar]
- Singh, U.C.; Kollman, P.A. An approach to computing electrostatic charges for molecules. J. Comp. Chem. 1984, 5, 129–145. [Google Scholar] [CrossRef]
- Campañá, C.; Mussard, B.; Woo, T.K. Electrostatic Potential Derived Atomic Charges for Periodic Systems Using a Modified Error Functional. J. Chem. Theory Comput. 2009, 5, 2866–2878. [Google Scholar] [CrossRef]
- Kühne, T.D.; Iannuzzi, M.; Del Ben, M.; Rybkin, V.V.; Seewald, P.; Stein, F.; Laino, T.; Khaliullin, R.Z.; Schütt, O.; Schiffmann, F. CP2K: An electronic structure and molecular dynamics software package-Quickstep: Efficient and accurate electronic structure calculations. J. Chem. Phys. 2020, 152, 194103. [Google Scholar] [CrossRef]
- Goedecker, S.; Teter, M.; Hutter, J. Separable dual-space Gaussian pseudopotentials. Phys. Rev. B 1996, 54, 1703–1710. [Google Scholar] [CrossRef]
- Vanduyfhuys, L.; Vandenbrande, S.; Verstraelen, T.; Schmid, R.; Waroquier, M.; Van Speybroeck, V. QuickFF: A program for a quick and easy derivation of force fields for metal-organic frameworks from ab initio input. J. Comput. Chem. 2015, 36, 1015–1027. [Google Scholar] [CrossRef]
- Mayne, C.G.; Saam, J.; Schulten, K.; Tajkhorshid, E.; Gumbart, J.C. Rapid parameterization of small molecules using the force field toolkit. J. Comput. Chem. 2013, 34, 2757–2770. [Google Scholar] [CrossRef]
- Weingart, O.; Nenov, A.; Altoè, P.; Rivalta, I.; Segarra-Martí, J.; Dokukina, I.; Garavelli, M. COBRAMM 2.0 — A software interface for tailoring molecular electronic structure calculations and running nanoscale (QM/MM) simulations. J. Mol. Model. 2018, 24, 271. [Google Scholar] [CrossRef]
- Case, D.A.; Cheatham, T.E., III; Darden, T.; Gohlke, H.; Luo, R.; Merz, K.M., Jr.; Onufriev, A.; Simmerling, C.; Wang, B.; Woods, R. The Amber biomolecular simulation programs. J. Computat. Chem. 2005, 26, 1668–1688. [Google Scholar] [CrossRef]
- Grimme, S.; Waletzke, M. A combination of Kohn–Sham density functional theory and multi-reference configuration interaction methods. J. Chem. Phys. 1999, 111, 5645–5655. [Google Scholar] [CrossRef]
- Lyskov, I.; Kleinschmidt, M.; Marian, C.M. Redesign of the DFT/MRCI Hamiltonian. J. Chem. Phys. 2016, 144, 034104. [Google Scholar] [CrossRef]
- Balasubramani, S.G.; Chen, G.P.; Coriani, S.; Diedenhofen, M.; Frank, M.S.; Franzke, Y.J.; Furche, F.; Grotjahn, R.; Harding, M.E.; Hättig, C. TURBOMOLE: Modular program suite for ab initio quantum-chemical and condensed-matter simulations. J. Chem. Phys. 2020, 152, 184107. [Google Scholar] [CrossRef]
- Bauer, S.; Serre, C.; Devic, T.; Horcajada, P.; Marrot, J.; Férey, G.; Stock, N. High-Throughput Assisted Rationalization of the Formation of Metal Organic Frameworks in the Iron(III) Aminoterephthalate Solvothermal System. Inorg. Chem. 2008, 47, 7568–7576. [Google Scholar] [CrossRef] [PubMed]
- Lock, N.; Wu, Y.; Christensen, M.; Cameron, L.J.; Peterson, V.K.; Bridgeman, A.J.; Kepert, C.J.; Iversen, B.B. Elucidating Negative Thermal Expansion in MOF-5. J. Phys. Chem. C 2010, 114, 16181–16186. [Google Scholar] [CrossRef]


| Compound | Flavin loading [wt%]a |
SBET [m2/g] |
Vpore(total) [cm3/g]b |
Vpore(micro;NLDFT) [cm3/g]c |
|---|---|---|---|---|
| MIL-53-lp literature | - - |
1150 [61] 1140 [41] |
0.53 n.a. |
0.53 n.a. |
| MIL-53-lp synthesized | - | 1130 | 0.45 | 0.43 |
| MIA@MIL-53 | 0.4 | 1290 | 0.52 | 0.50 |
| 0.8 | 1130 | 0.47 | 0.46 | |
| 1.6 | 1000 | 0.43 | 0.43 | |
| 2.0 | 890 | 0.41 | 0.42 | |
| 2.7 | 340 | 0.17 | 0.20 | |
| 3.9 | 80 | 0.05 | 0.09 | |
| 6F-MIA@MIL-53 | 0.1 | 1150 | 0.49 | 0.49 |
| 0.5 | 890 | 0.41 | 0.42 | |
| 1.0 | 600 | 0.28 | 0.30 | |
| 1.5 | 40 | 0.02 | 0.04 |
| MIA@MOF-5 0.85 wt% |
6F MIA@MOF-5 27.6 wt% |
MIA@MIL-53 3.9 wt% |
6F MIA@MIL-53 1.5 wt% |
|
|---|---|---|---|---|
| nav(flavins / site) | 0.029 | 1.2 | 0.3 | 0.1 |
| p(one) | 98.7% | 52.6% | 86.9% | 95.5% |
| p(two) | 1.3% | 32.3% | 12.1% | 4.3% |
| p(three) | 0.0% | 11.7% | 1.0% | 0.1% |
Disclaimer/Publisher’s Note: The statements, opinions and data contained in all publications are solely those of the individual author(s) and contributor(s) and not of MDPI and/or the editor(s). MDPI and/or the editor(s) disclaim responsibility for any injury to people or property resulting from any ideas, methods, instructions or products referred to in the content. |
© 2023 by the authors. Licensee MDPI, Basel, Switzerland. This article is an open access article distributed under the terms and conditions of the Creative Commons Attribution (CC BY) license (http://creativecommons.org/licenses/by/4.0/).


