1. Introduction
The industry and research have widely disseminated the use of composite steel-concrete beams over the past decades. Recent studies show advances in the use of this type of structural element. Lin et al. [
1] studied the fatigue behavior of composite steel-concrete beams, finding that several residual cracks occurred when repeated loads equaled stabilized cracking ones, making the beam less rigid as load cycles increased.
Yu-Hang et al. [
2] studied the fatigue in shear connectors of composite steel-concrete beams. At first, in a fatigue test conducted on seven specimens, failure occurred due to fatigue stemming from shearing the connectors in specimens with good ductility. The study also proposed a displacement calculation method, which showed effective results.
Xing et al. [
3] studied the behavior of composite steel-concrete beams with elastic concrete, which can improve beam ductility and reduce the width of concrete cracks. Hassanin et al. [
4] experimentally studied how composite steel-concrete beams externally stiffened by post-tensioned tendons behaved under cyclic loading. Strengthened specimens showed greater ultimate capacity and residual stiffness than unstrengthened specimens due to significant loss of composite action between concrete flanges and steel beams under cyclic load testing.
Despite the growing use of composite steel-concrete beams over the last few years, research has scarcely explored prestressing in these beams, although it has done so for reinforced concrete beams. The literature has few experimental studies, such as Ayyub, Sohn, and Saadatmanesh [
5], which explore the use of prestressed steel-concrete composite beams for their potential application in structures.
Prestressing composite steel-concrete beams can overcome larger spans with slender structures. Thus, studies must analyze the slenderness of structural elements and the environmental impacts they cause to generate more sustainable structures.
The IPCC [
6] claims that reducing greenhouse gases is one of the great challenges facing humanity. Its Sixth Assessment Report [
7] estimates that human activities currently cause approximately 1.1
oC of global warming when compared to the pre-industrial period. The global COVID-19 pandemic reduced economic and industrial activities, but construction alone emitted 3.2 gigatons of CO
2, contributing with 10% of all greenhouse gas emissions worldwide. (UEIEA [
8]).
Given this scenario, several studies have aimed at minimizing CO
2 emissions for several civil construction structures, such as Arpini et al. [
9], Santoro and Kripka [
10], and Tormen et al. [
11]. However, research analyzing CO
2 emissions in prestressed composite steel-concrete beams are yet to be found.
Research has employed several methodologies to measure the environmental impact of buildings, among them, the life cycle assessment (LCA), a method that studies environmental inputs and outputs related to a product or their service lifecycle — i.e., since its production until the end of its service life (Khasreen, Banfill and Menzies [
12]). CO
2 emission constitutes a common parameter to evaluate this impact on the structural optimization of various structures, as per Payá-Zaforteza et al. [
13], García-Segura and Yepes [
14], and Santoro and Kripka [
10].
Among the existing optimization algorithms, the genetic algorithm (GA) proposed by Holland [
15] and the particle swarm algorithm (PSO), originally proposed by Kennedy and Eberhart [
16], stand out for their scope and wide use. In recent years, several structural optimization studies with GA and PSO have been developed, such as Netto, Calenzani, and Alves [
17], which assessed prestressed steel beams; Breda, Pietralonga, and Alves [
18], which evaluated composite beams with flat web profiles; Erdal, Doan, and Saka [
19], which analyzed composite cellular steel beams; Senouci and Al-Ansari [
20] and Govindaraj and Ramasamy [
21], which aimed at optimizing a large range of structures; and Arpini and Alves [
22] and Poitras, Lefrançois and Cormier [
23], which appraised composite floor systems.
Steel structure specifications and design standards usually include composite steel-concrete beams. In turn, publications and studies on reinforced concrete structures address prestressing. Thus, the literature lacks studies directed to prestressed composite steel-concrete systems, as is the case of composite beams prestressed with straight tendons. Furthermore, optimization studies applicable to this type of structure are also scarce. Therefore, this study aims to propose a solution to the problem of optimizing the CO2 emissions during the manufacturing of composite steel-concrete beams with doubly symmetrical steel profiles and external prestressing via straight tendons. We solved the optimization problem via the AG and PSO algorithms to evaluate their effectiveness in finding the solution for this problem.
2. Optimization problem formulation
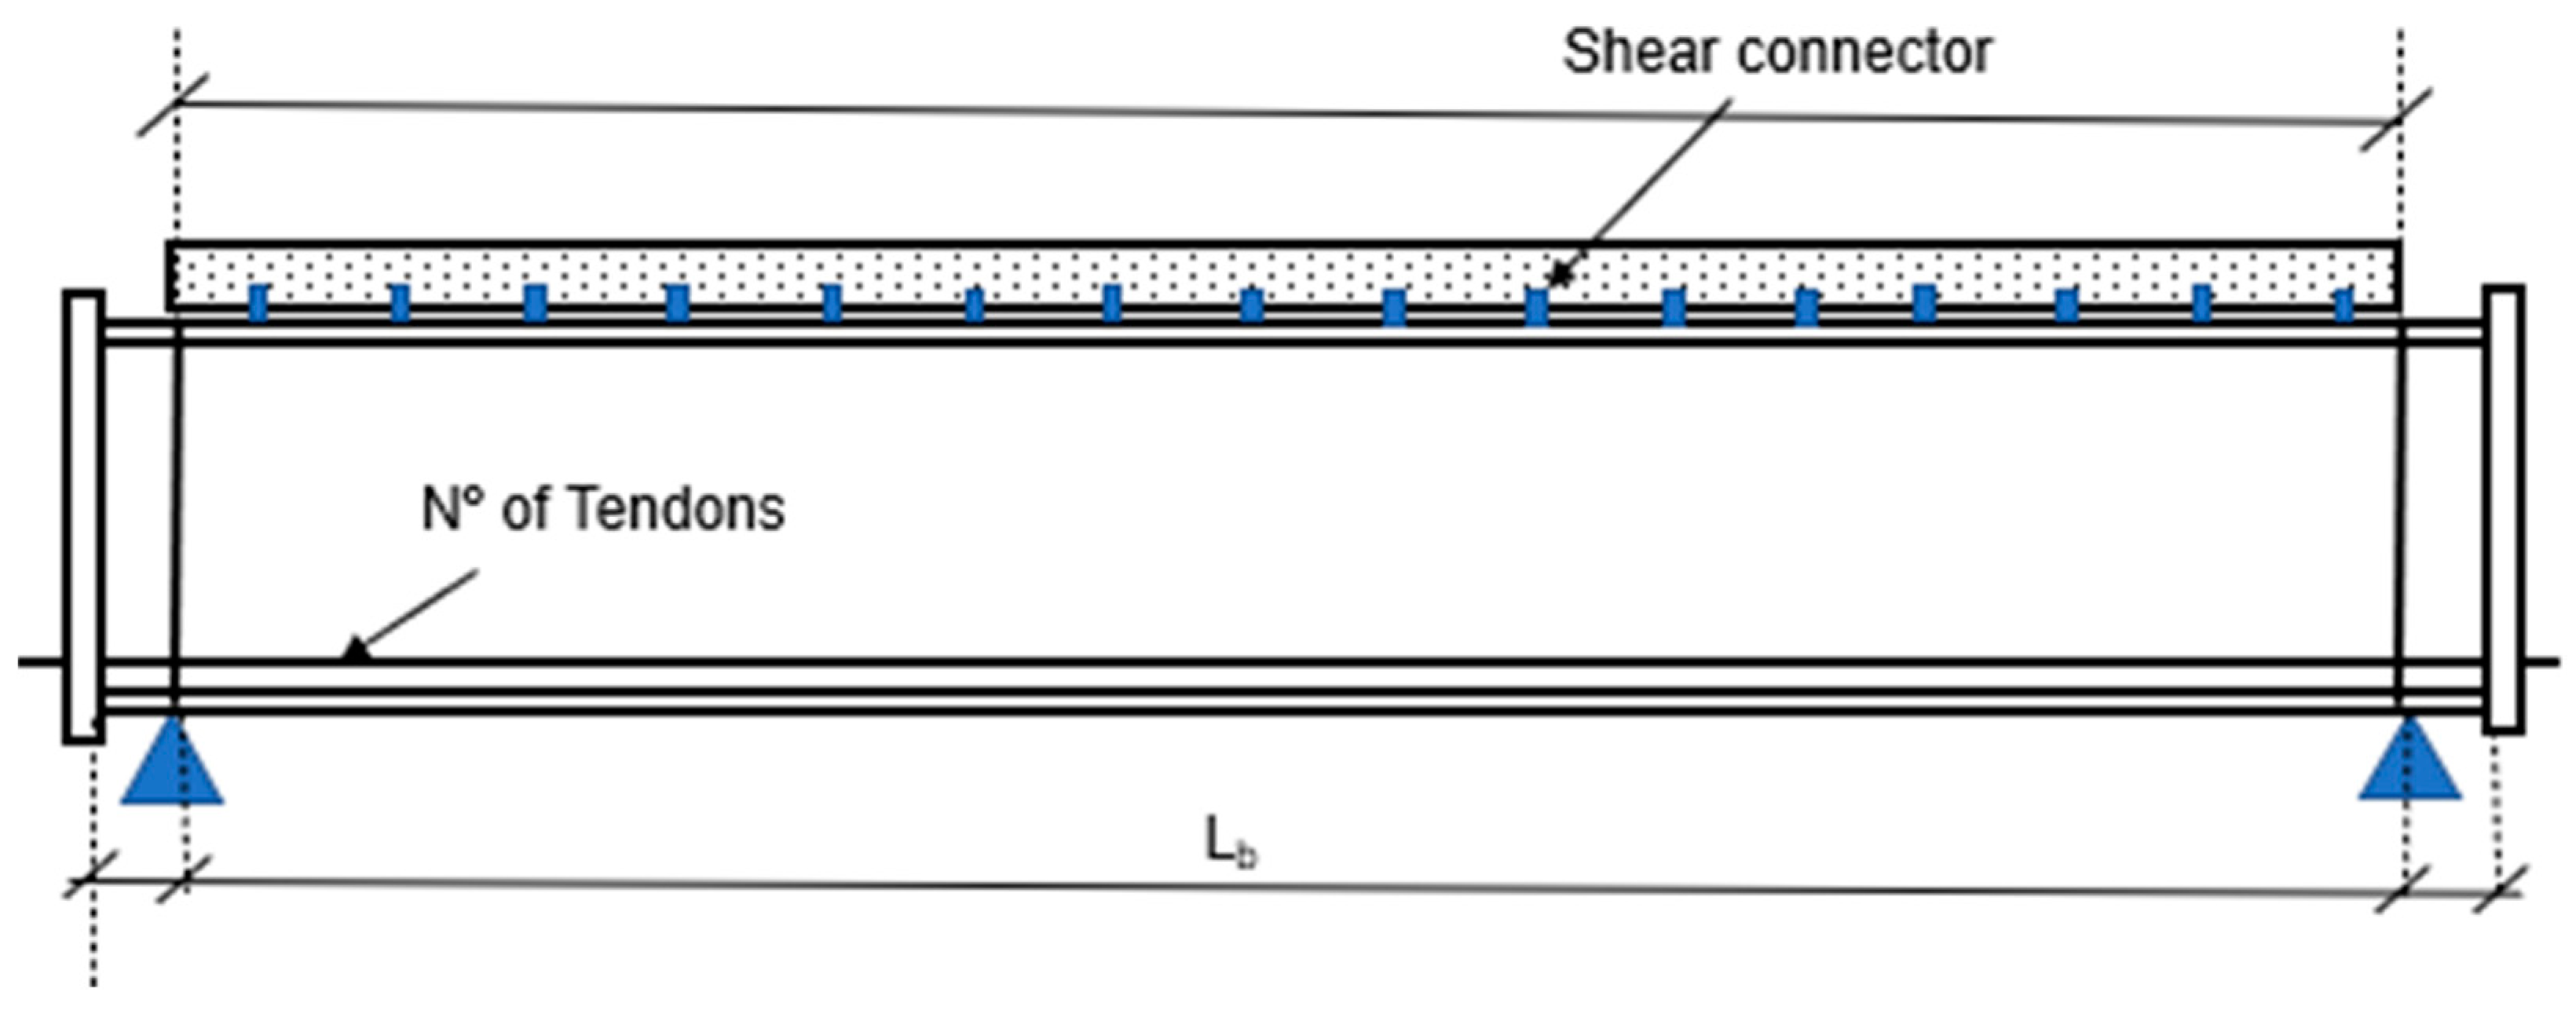
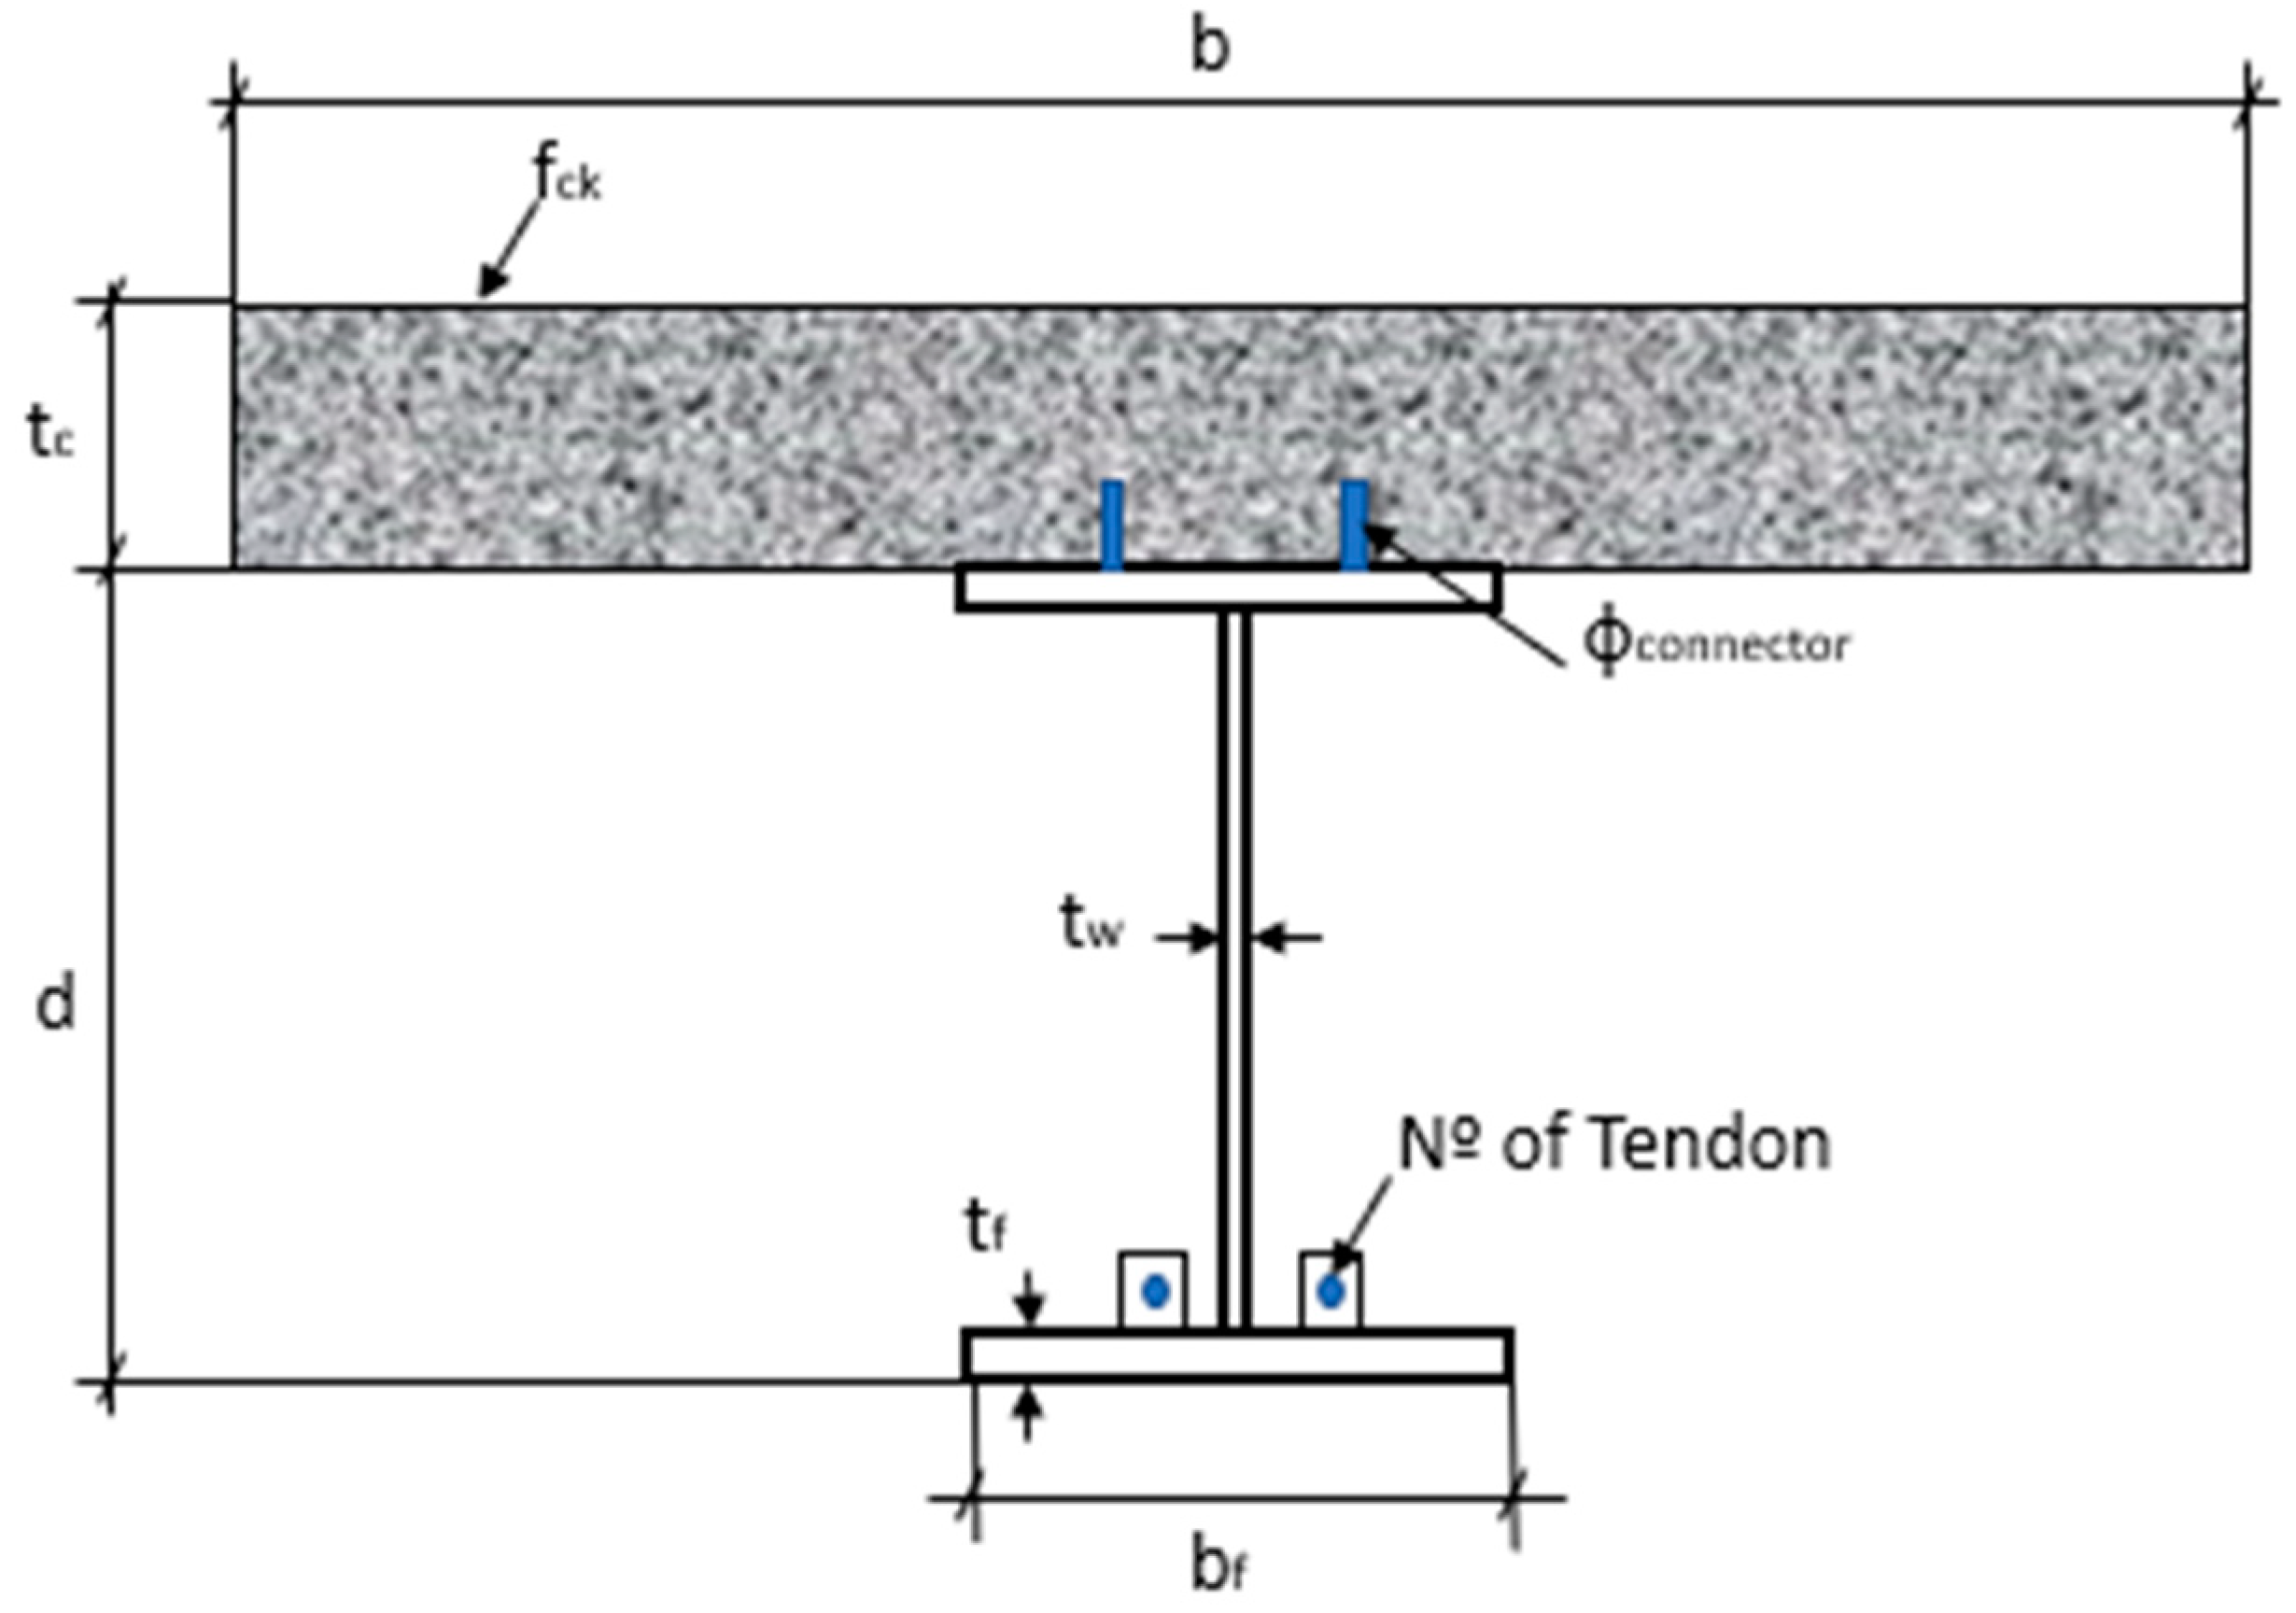
To formulate the optimization problem, the design variables in longitudinal (
Figure 1) and cross sections (
Figure 2) were considered.
A steel profile with its respective dimensions was directly selected from the laminated profile in the manufacturer’s table (Gerdau [
24]). In the case of welded profiles, each variable, i.e., profile height (d), flange width (b
f), flange thickness (t
f), and web thickness (t
w) are chosen within a practical range. Slab concrete height (t
c) was limited between 10 and 30 cm and the compressive strength of the concrete used in the slab (f
ck) ranges from 20 to 50 MPa, in 5 MPa steps. The number of tendons is selected by area according to the manufacturer’s catalog (Protende [
25]). In total, two diameter options, 19 and 22 mm, can be chosen for stud bolt connectors.
2.1. Objective Function
Our objective function — Equation (1) — seeks to minimize CO
2 emissions in the manufacturing process of prestressed steel-concrete composite beams.
The parts of Equation (1) represent the emissions of each beam component. The first part refers to the steel profile, in which represents the emission of in kgCO2 per kilogram of steel profile; , the volume of the steel profile given by the product of its area by the length of the beam L; and , the specific mass of steel. The second part represents the emission of from the prestressing reinforcement tendons, in which refers to the emission of CO2 per kilogram of tendon and , the volume of the tendons given by the product of its area by the length of the bar L. The contribution of the composite slab concrete is considered by the third installment, in which refers to the CO2 emission of the concrete slab given in kgCO2 per volume unit and , to the volume of concrete, in , contained within the slab width.
Furthermore, Equation (1) describes the last portion referring to the emission of
due to weld composition in welded profiles, calculated as the product of
, in which
represents the weld length and
the emission of
in kgCO
2 due to welding the composite steel-concrete beam. To determine the potential contribution to global warming, in kgCO
2 (Equation 2), a 3.3 kgCO
2-Equiv./m value was adopted, adjusted by the ratio between the actual cross-section of the weld chord (
) and the reference cross-sectional area of the weld chord for a 20-mm plate, i.e.,158 mm² (Sproesser et al. [
26]).
Figure 3 describes the variables considered to analysis weld emissions.
in which:
The CO
2 emissions for each material considered in Equation 1 are shown in
Table 1.
2.1. Constraints
Constraints are used to assess the safety and performance of structures in the different stages of its useful life: (1) analysis of the steel section during pretension; (2) analysis of the steel section during concrete curing; (3) identification of the ultimate limit states of the composite section during its service phase; and (4) verification of the deflection limit state of a composite section during its service phase, considering their long-term effects. The criteria of the Brazilian standards for steel (NBR 8800:2008 [
28]) and concrete (NBR 6118:2014 [
29]) were used to establish the constraints in
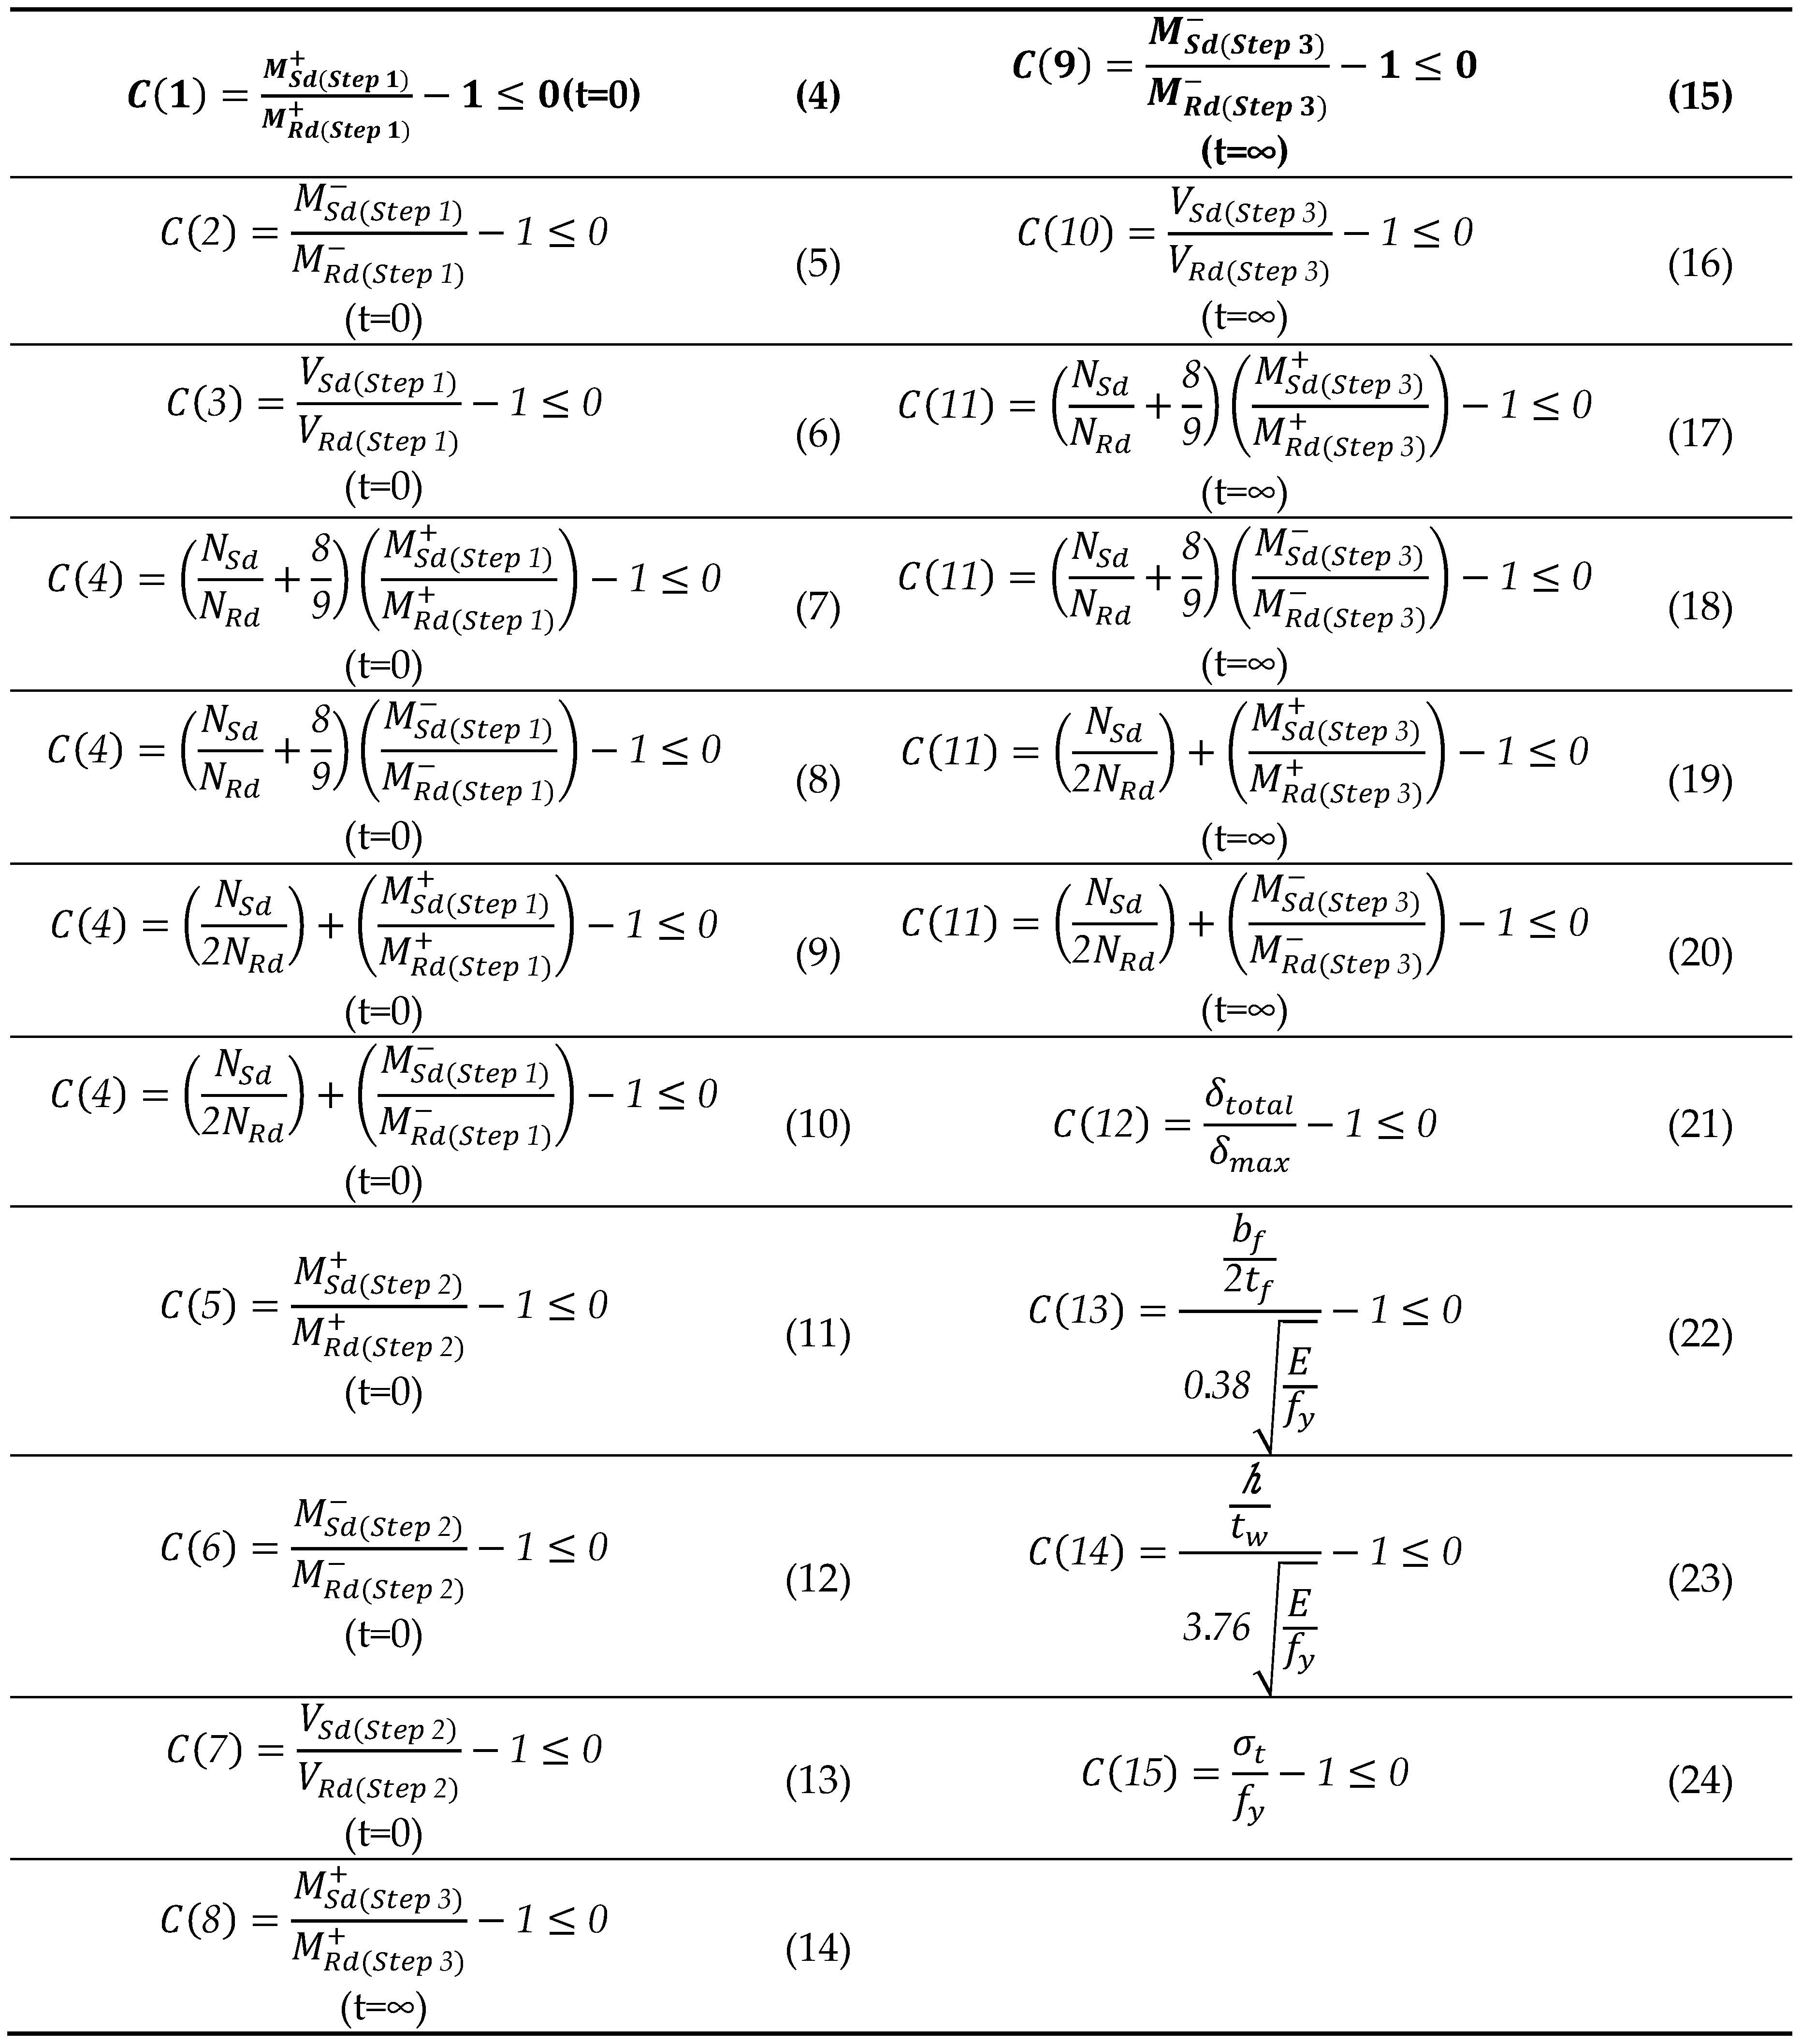
Table 2.
Constraints C(1), C(2), C(3), and C(4) are used to assess positive bending moment, negative bending moment, shear force, and combined bending, respectively, in step 1. Constraints C(5), C(6), and C(7) are related to the evaluation of the positive bending moment, negative bending moment, and shear, respectively, in step 2. Constraints C(8), C(9), C(10), and C(11) are related to the verification of the positive bending moment, negative bending moment, shear force, and combined bending, respectively, in step 3. Constraint C(12) is related to the verification of the deflection in step 4. Constraints C(13) and C(14) impose the use of compact profiles, a requirement of NBR 8800:2008 [
28] for beams subject to negative moments. Finally, constraint C(15) refers to the limitation of the tensile stress in the steel profile since the tension in the lower fiber of the steel profile lower flange must be lower than the yield strength of steel for the use of elastic analysis to determine deflections.
This study considers composite beams with external prestressing by pretension. therefore, to calculate the required structure, in step 1 of pretension, the considered loads refer to the weight of the beam itself and its construction loads and the resistant section, a section of the steel profile. In step 2, after tendon pretension and slab execution, the resistant cross-section includes that of the steel profile and its loads refer the weight of the beam and the slab in addition to construction loads. In step 3, after the concrete is cured, the resistant cross-section includes the composite section and its loads refer to the weight of the composite beam and of the construction and utilization loads. Finally, in step 4, long-term effects are added to estimate deflection.
Our optimization problem solution was obtained via the Matlab [
30] native genetic algorithm and PSO implemented within Matlab [
30] with the adaptive penalties method (APM) proposed by Barbosa and Lemonge [
31] to analyze the constraints of the problem. A population of 100 individuals was considered for the PSO, along with 75 iteration steps and a tolerance of 10
-6 as a stopping criterion and solution convergence. The initial GA population contained 120 individuals, a 0.05 and 0.8 rate of elite individuals and crossing of intermediate types, respectively, and a random mutation rate.
3. Numerical Results
Numerical analysis was carried out in three stages. The first one aimed to evaluate the proposed design formulation by relating it to the experimental results in the literature and compare the deviations in our formulation to the real behavior of a structure regarding its resistance and rigidity. For this, the experiment in Ayyub, Sohn, and Saadatmanesh [
5], which tested a full-scale pre-stressed composite beam, was selected and numerically implemented. The second stage aimed to analyze our optimization technique. As in Netto, Calenzani, and Alves [
17], prestressed steel beams were used as reference to compare optimizations by analyzing their CO
2 emissions. Although the selected example is not a prestressed composite beam, we managed to validate the selected optimization technique.
Finally, in the third stage, a parametric analysis was developed to evaluate the impacts of using external prestressing on prestressed composite beams for spans of varying lengths and fixed loading. The span ranged from 5 to 40 m in 2.5-m steps. For each span, the optimized solution is shown with its CO2 emission percentage for each component and material of the evaluated composite beam.
3.1. Example 1 – The Composite Stressed Beam in Ayub, Sohne, and Saadatmanesh [5]
The example we chose to validate our design formulation refers to a prestressed composite beam with straight tendons, which was tested by Ayyub, Sohn, and Saadatmanesh [
5] as shown in
Figure 4.
For this test, seven low-relaxation steel wire strands with a 15 mm diameter and yield strength (
fpyk) and ultimate tensile strength (
fptk) equal to 1620 and 2017MPa, respectively, were considered. The beam is formed by a W 360x45 steel profile with a yield strength equal to 411MPa, a 9-cm thick solid concrete slab, and concrete with an average compressive strength equal to 40 MPa with a standard deviation of 0.63 MPa. Using ABNT NBR 12655:2015 [
32], the characteristic compressive strength of concrete equal to 36.7 MPa is obtained. The modulus of elasticity of steel equals 200 GPa and that of concrete, 30.25 MPa.
As shown by Ayyub, Sohn, and Saadatmanesh [
5], the collapse load for the beam equaled 780kN, corresponding to a bending moment of 713.31kNm.
Using the proposed design methodology, the resistant moment determined for the beam totals 679.19kNm, 5.02% lower than the experimentally obtained one, suggesting that the proposed methodology favors safety.
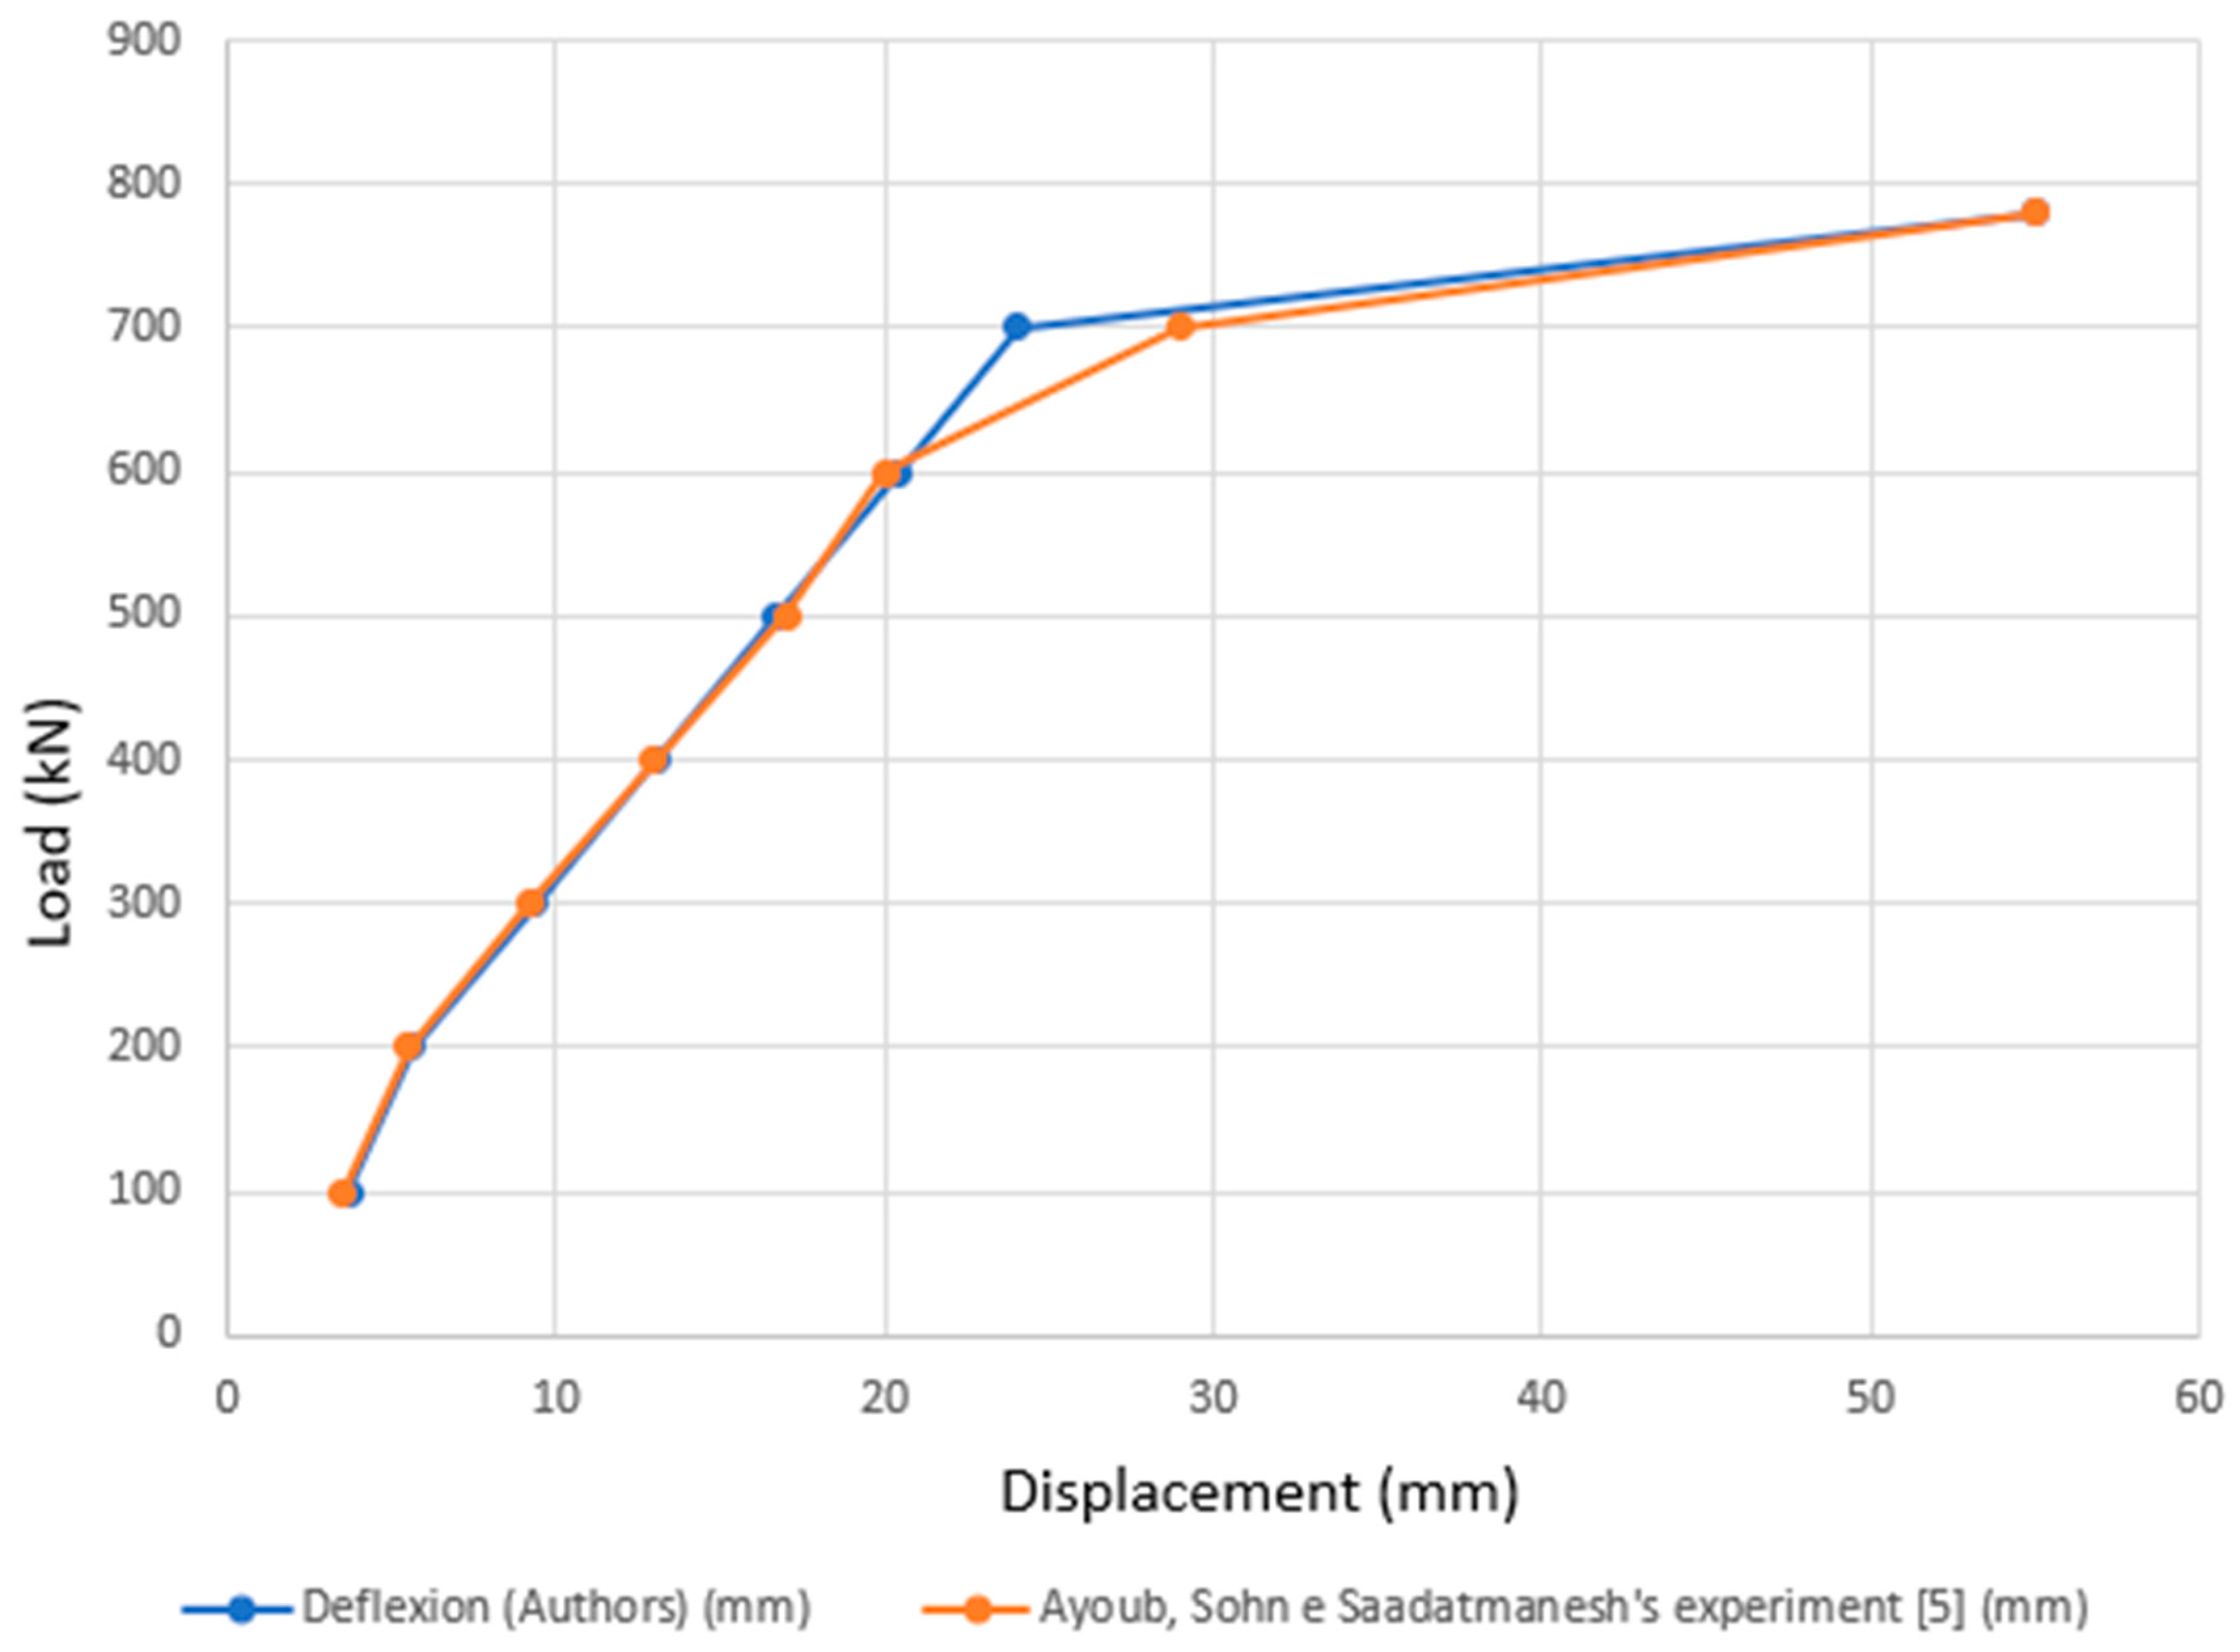
Figure 5 shows the load versus displacement graph with test curves and the proposed methodology.
Regarding stiffness, since the dimensioning methodology considers elastic linear analysis to estimate maximum displacements, it was observed, as expected, that experimental and analytical deflection values in the elastic phase agree with each other, corroborating the validation of our proposed methodology. The maximum deflection obtained by Ayyub, Sohn, and Saadatmanesh [
5] was 5.29 cm whereas, with our proposed formulation, we obtained a maximum deflection equal to 5.52 cm, resulting in a difference of 4.2% between studies.
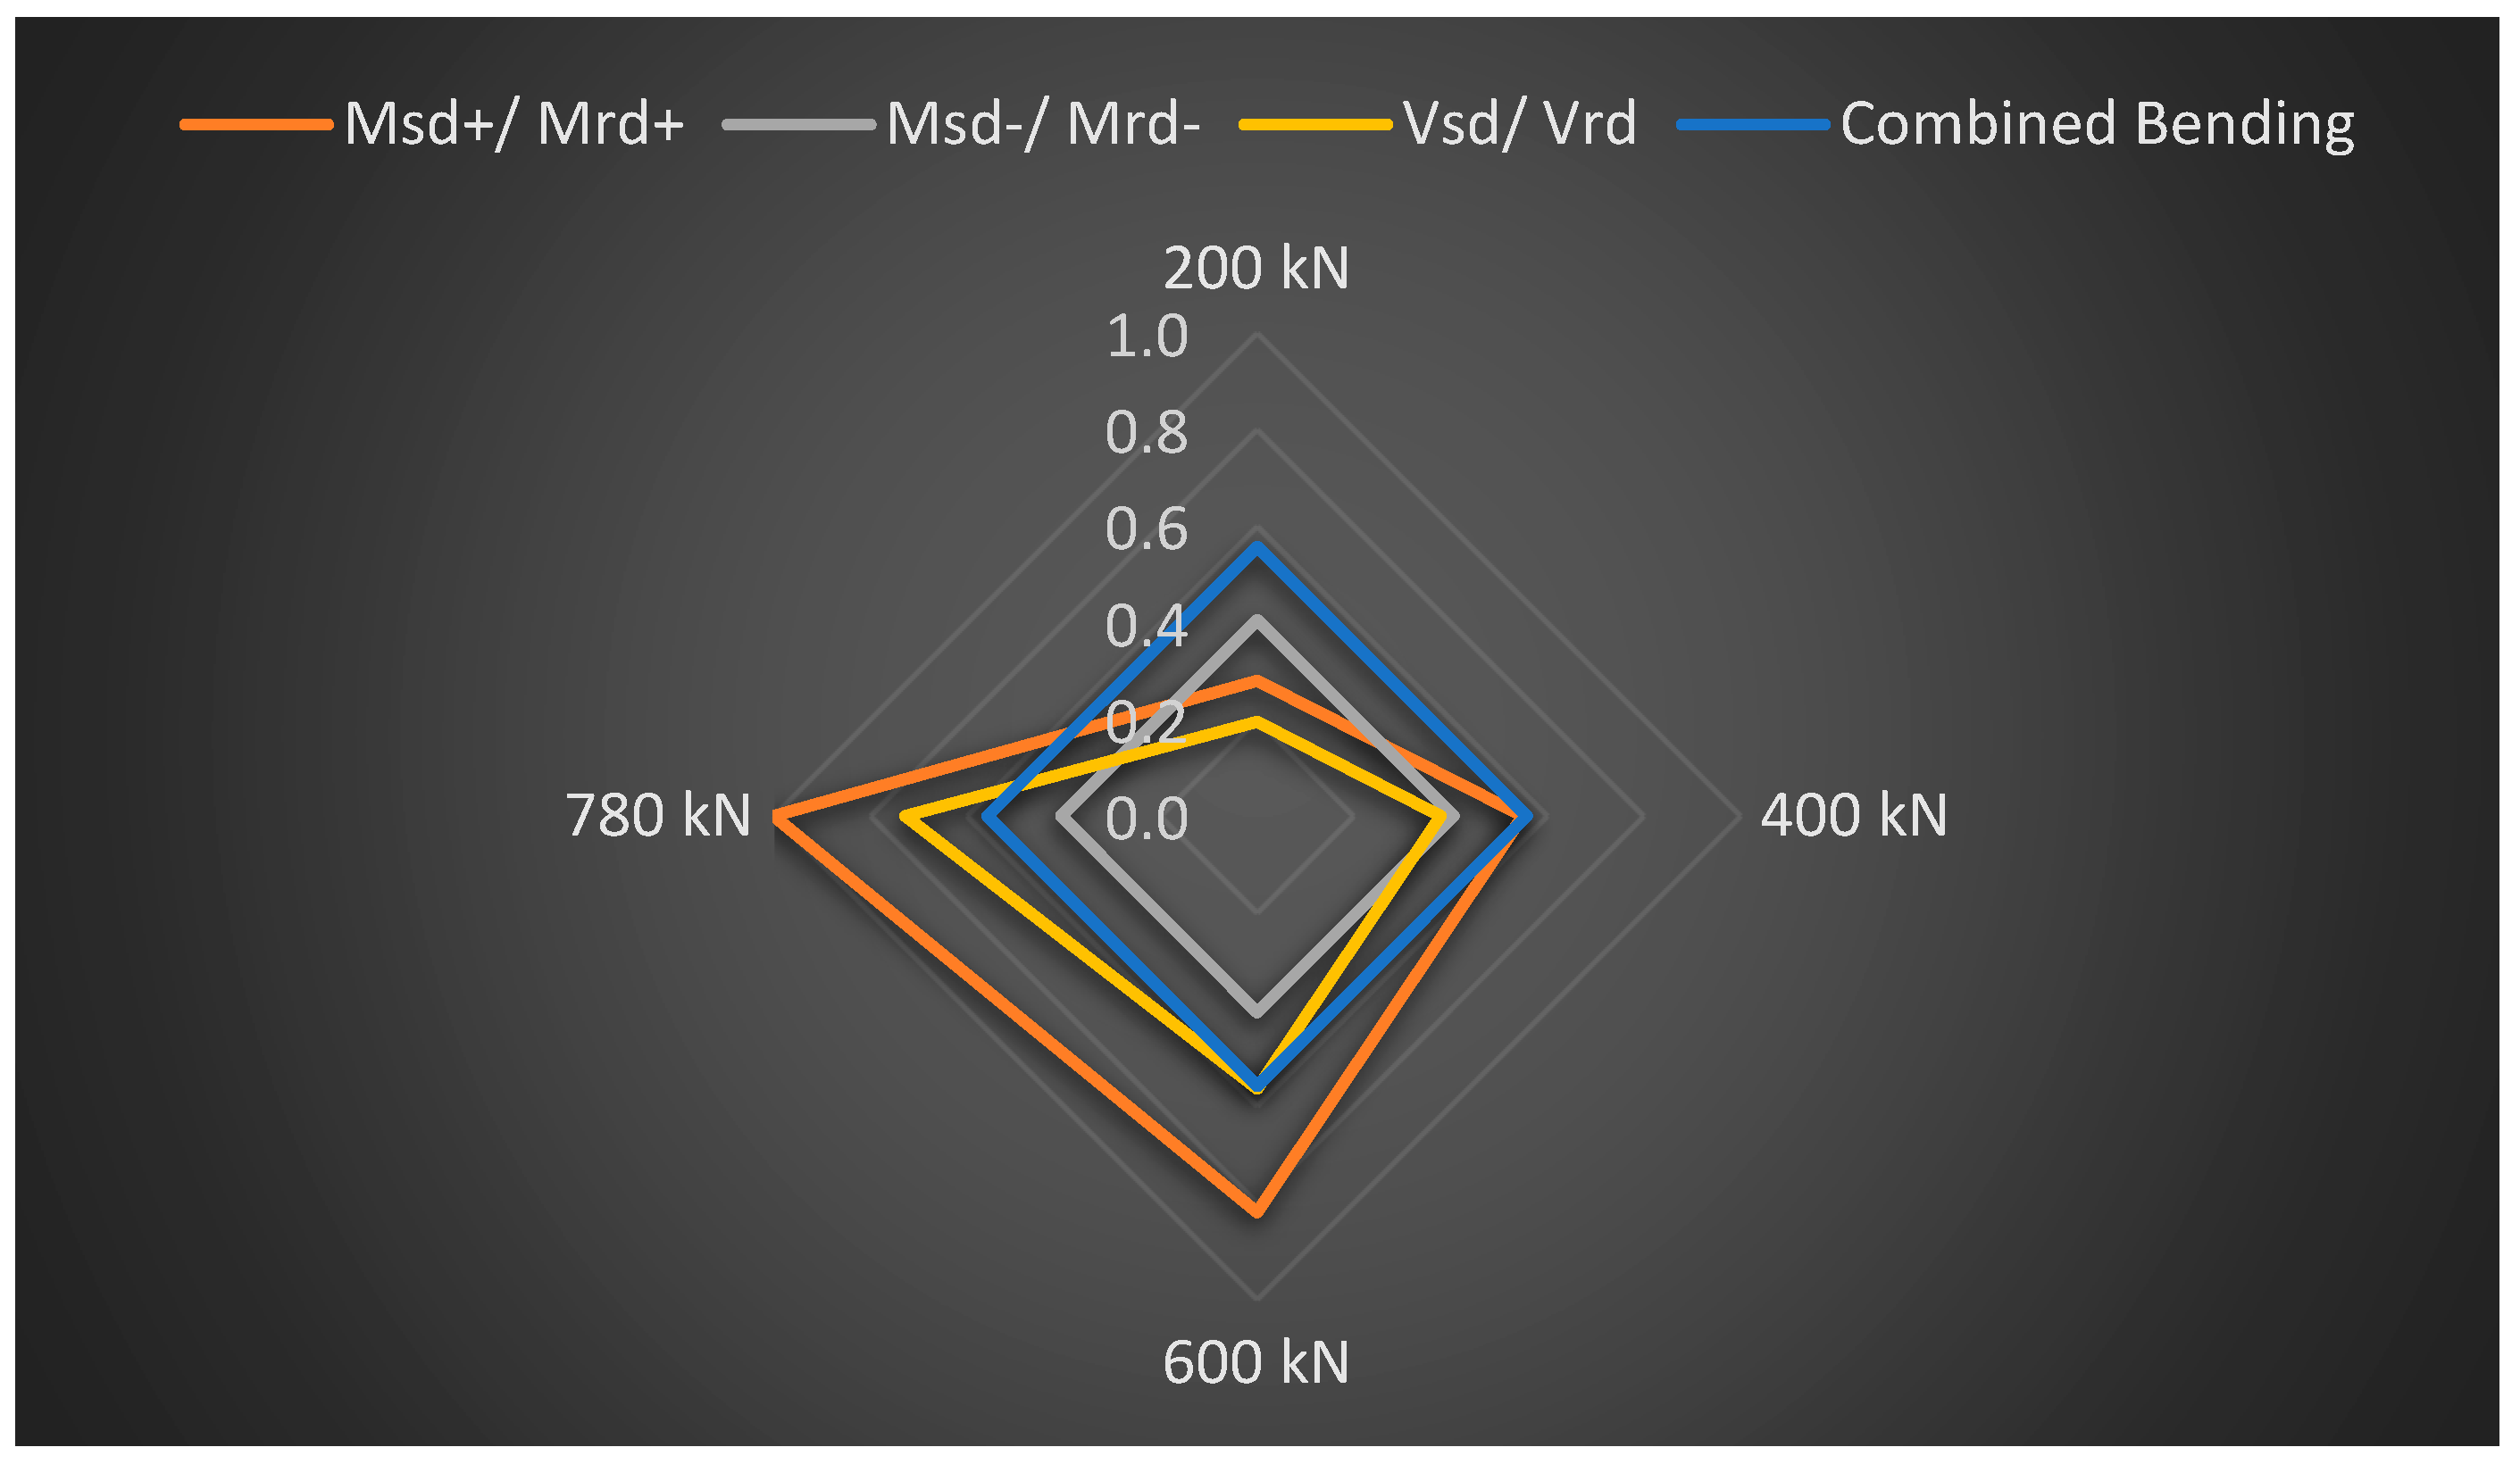
Figure 6 offers an analysis of the collapse modes that govern designs according to the proposed methodology: resistant moments and shears in relation to the loads and the stresses generated in the beam for different load stages up to the collapse of the load.
Figure 6 describes the bending due to the positive moment in the middle of the span, which is the mode that governs the problem for a 780-kN failure load, followed by the shear in the beam.
3.2. Example 2 – Optimization Comparative Analysis
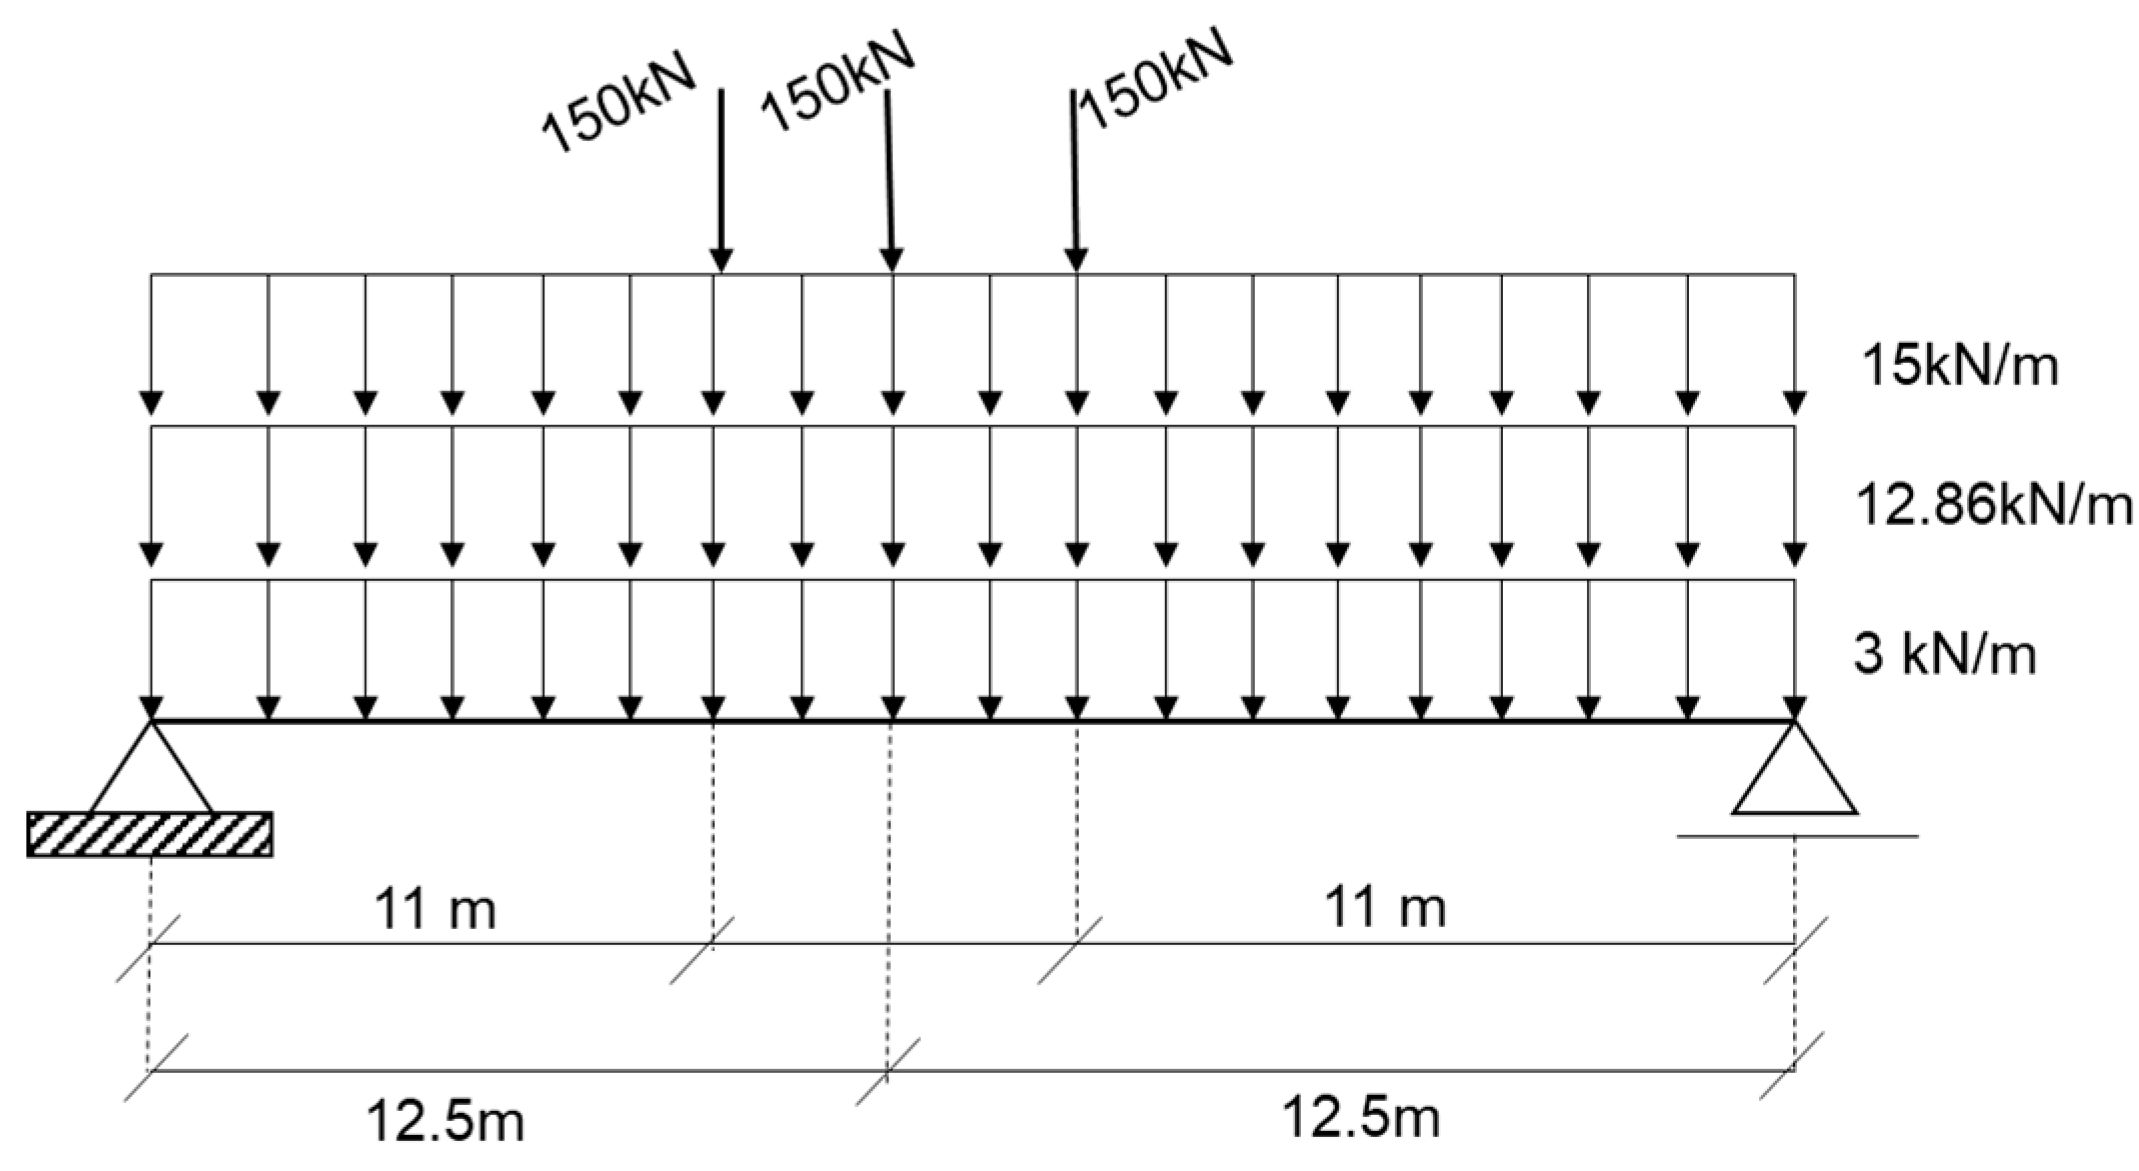
For a comparative analysis of the optimization process, the prestressed steel beam (
Figure 7) optimized by Netto, Calenzani, and Alves [
17] was analyzed as a prestressed steel-concrete composite beam; In this study, we re-optimized the steel beam. The input data considered were 150-kN 3-point loads applied at 11, 12.5, and 14 meters from the left support; with a 3-kN/m overload; a 12.86-kN/ permanent load m; a 15-kN/m serviceability overload; a 25-m
L; 15.2-mm tendons set 100 mm below the inferior flange bottom; a 345-MPa
fy; and a 205000-MPa
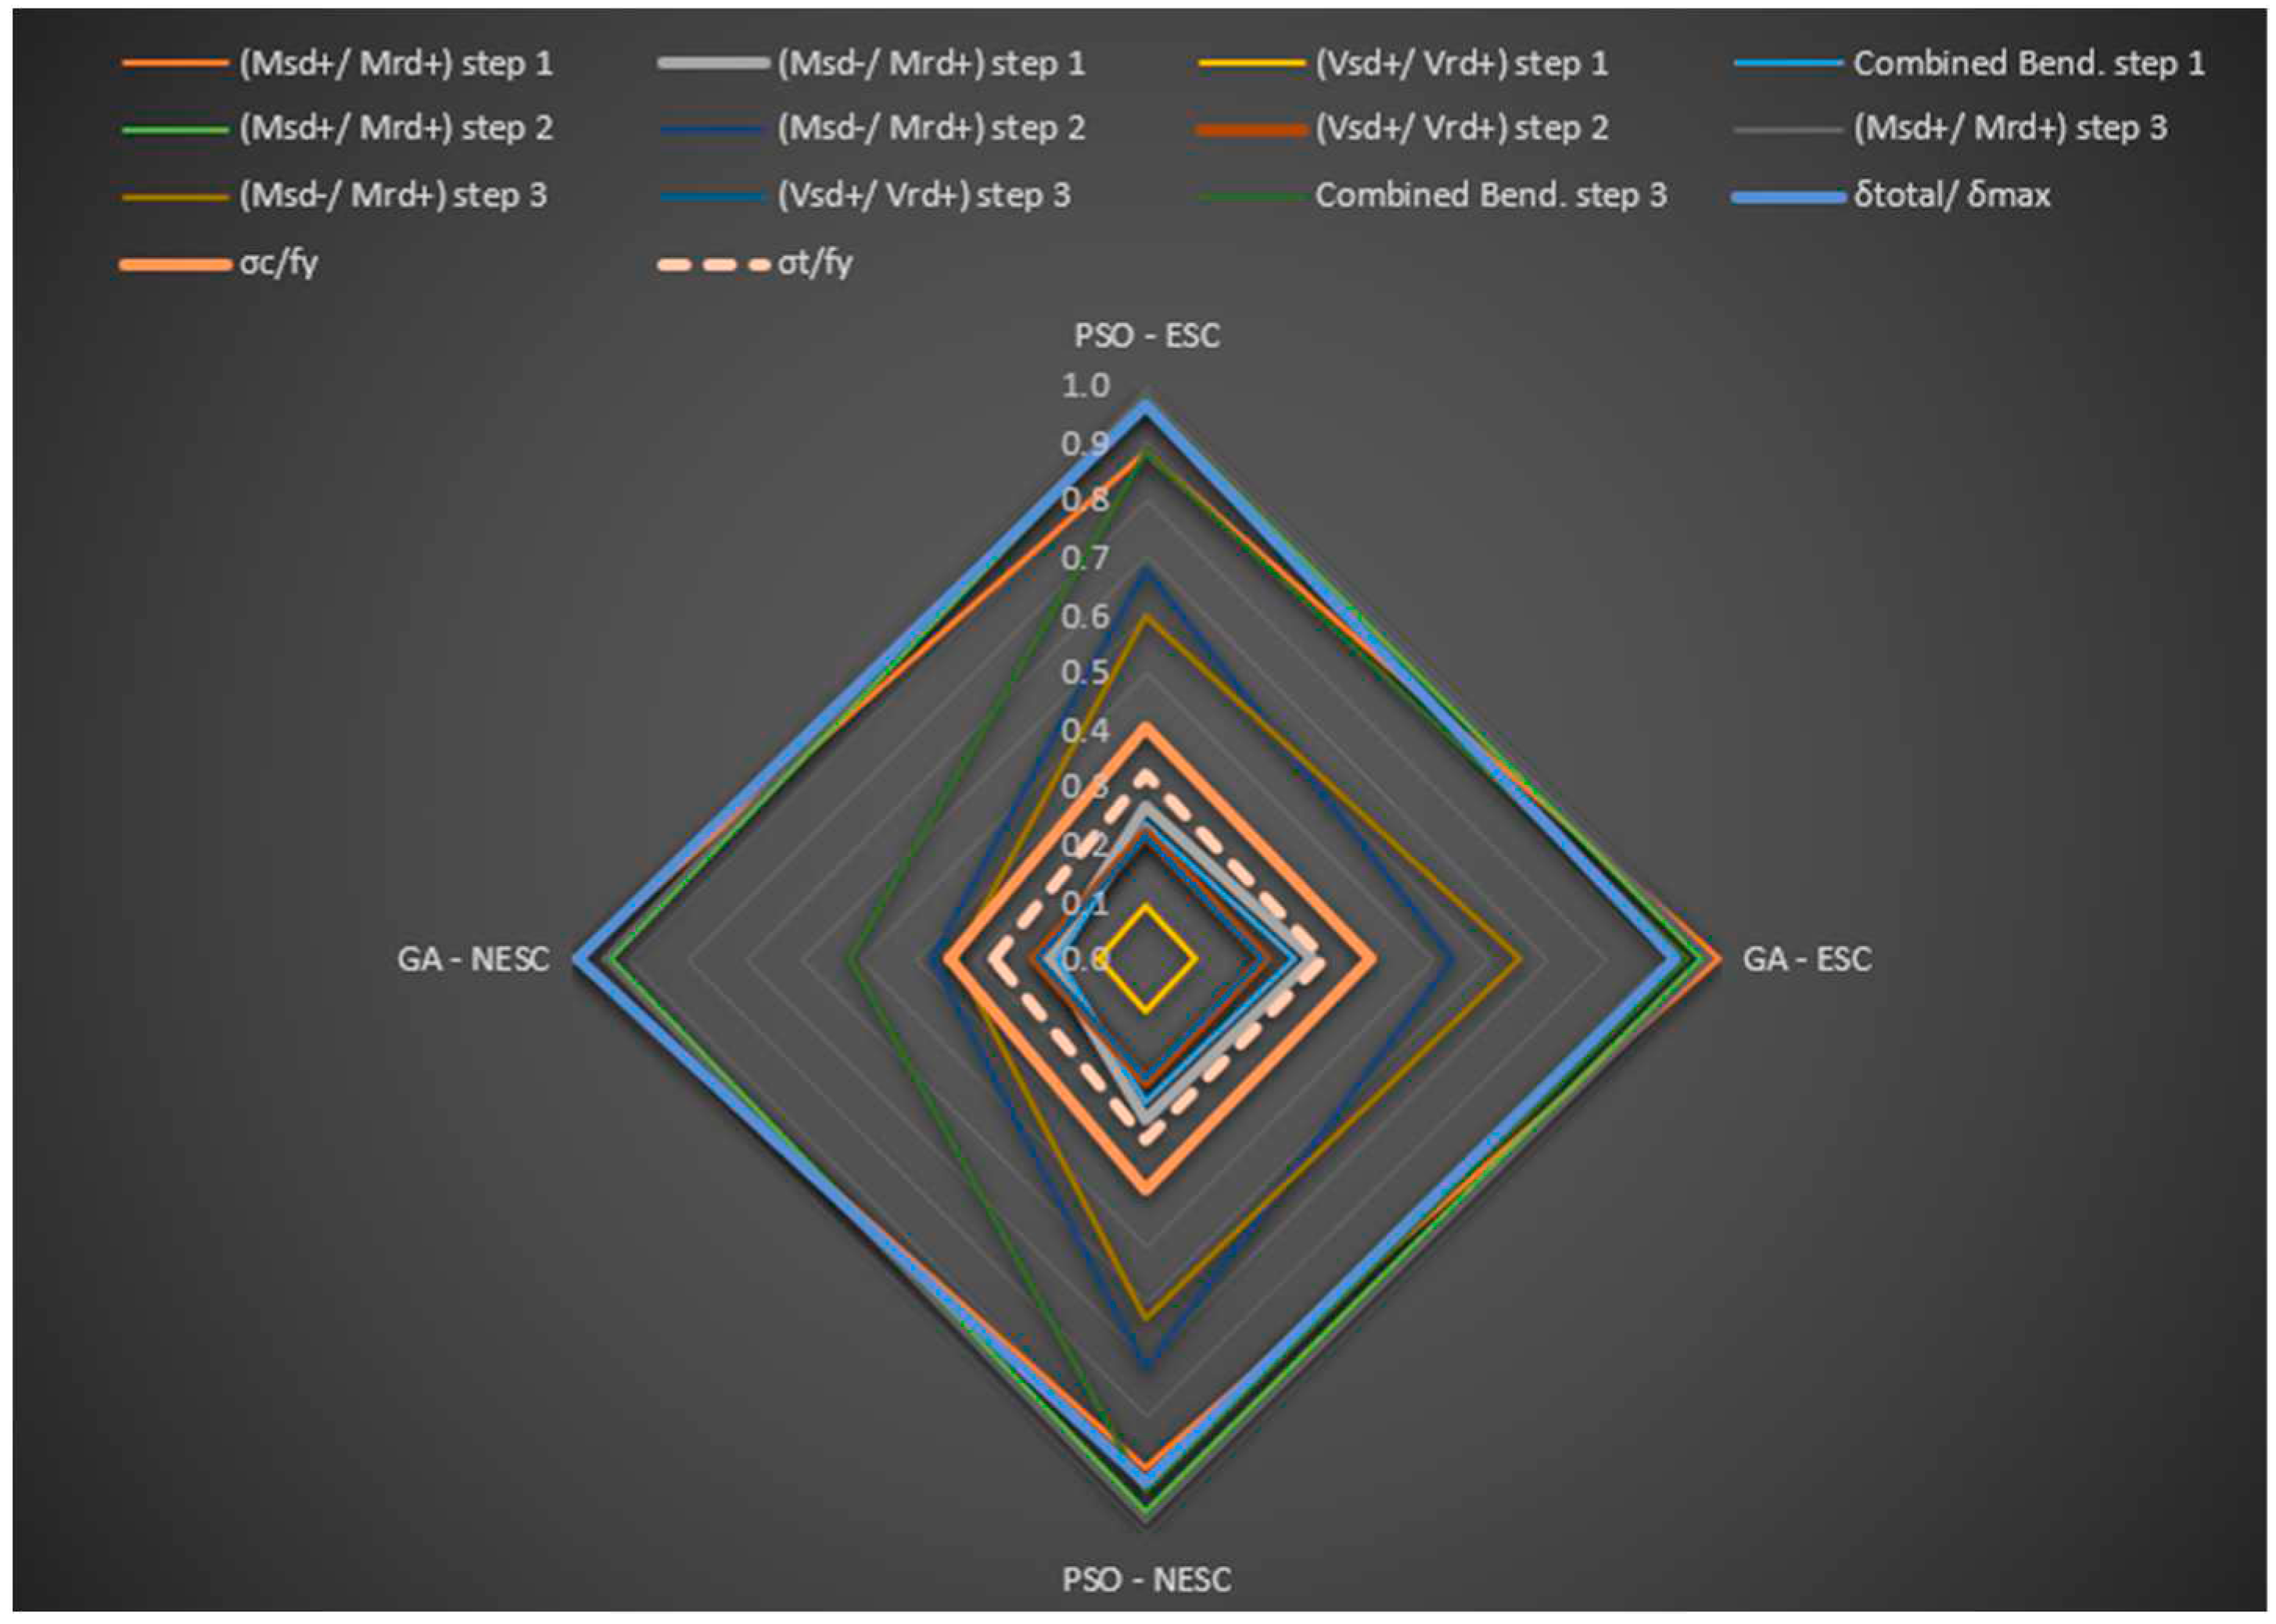
E. The analysis in this study considered that the load corresponding to the weight of the slab would be included in the 12.86-kN/m value of the permanent load. Moreover, both a shored and unbolted structure were analyzed; in which the abbreviations of the models were identified as AG and PSO, i.e., the genetic algorithm and particle swarm algorithm, respectively; and ESC and NESC, referring to shored and unshored structures, respectively.
To solve the optimization problem, Netto, Calenzani, and Alves [
17] used the native GA of Matlab and obtained results for doubly symmetrical and monosymmetric welded steel profiles.
The best result for the doubly symmetric profile consisted of a profile with a 1580-mm height, 410-mm upper and lower flanges, whose thickness and web equaled 22.4mm and 12.5mm, respectively, and nine 15-mm diameter tendons.
Table 3 shows a comparative analysis of the optimization result of the prestressed composite beam in relation to the result by Netto, Calenzani, and Alves [
17] for a pure steel beam.
Table 4 shows the obtained emission, displacement, compression, and traction stresses values.
The use of a prestressed composite beam reduced 63.1% of CO2 emissions from the steel profile. It also reduced the sag by 16.7%, the maximum compressive stress by 56.6%, and tensile stress by 51.8%, increasing the safety of the structure.
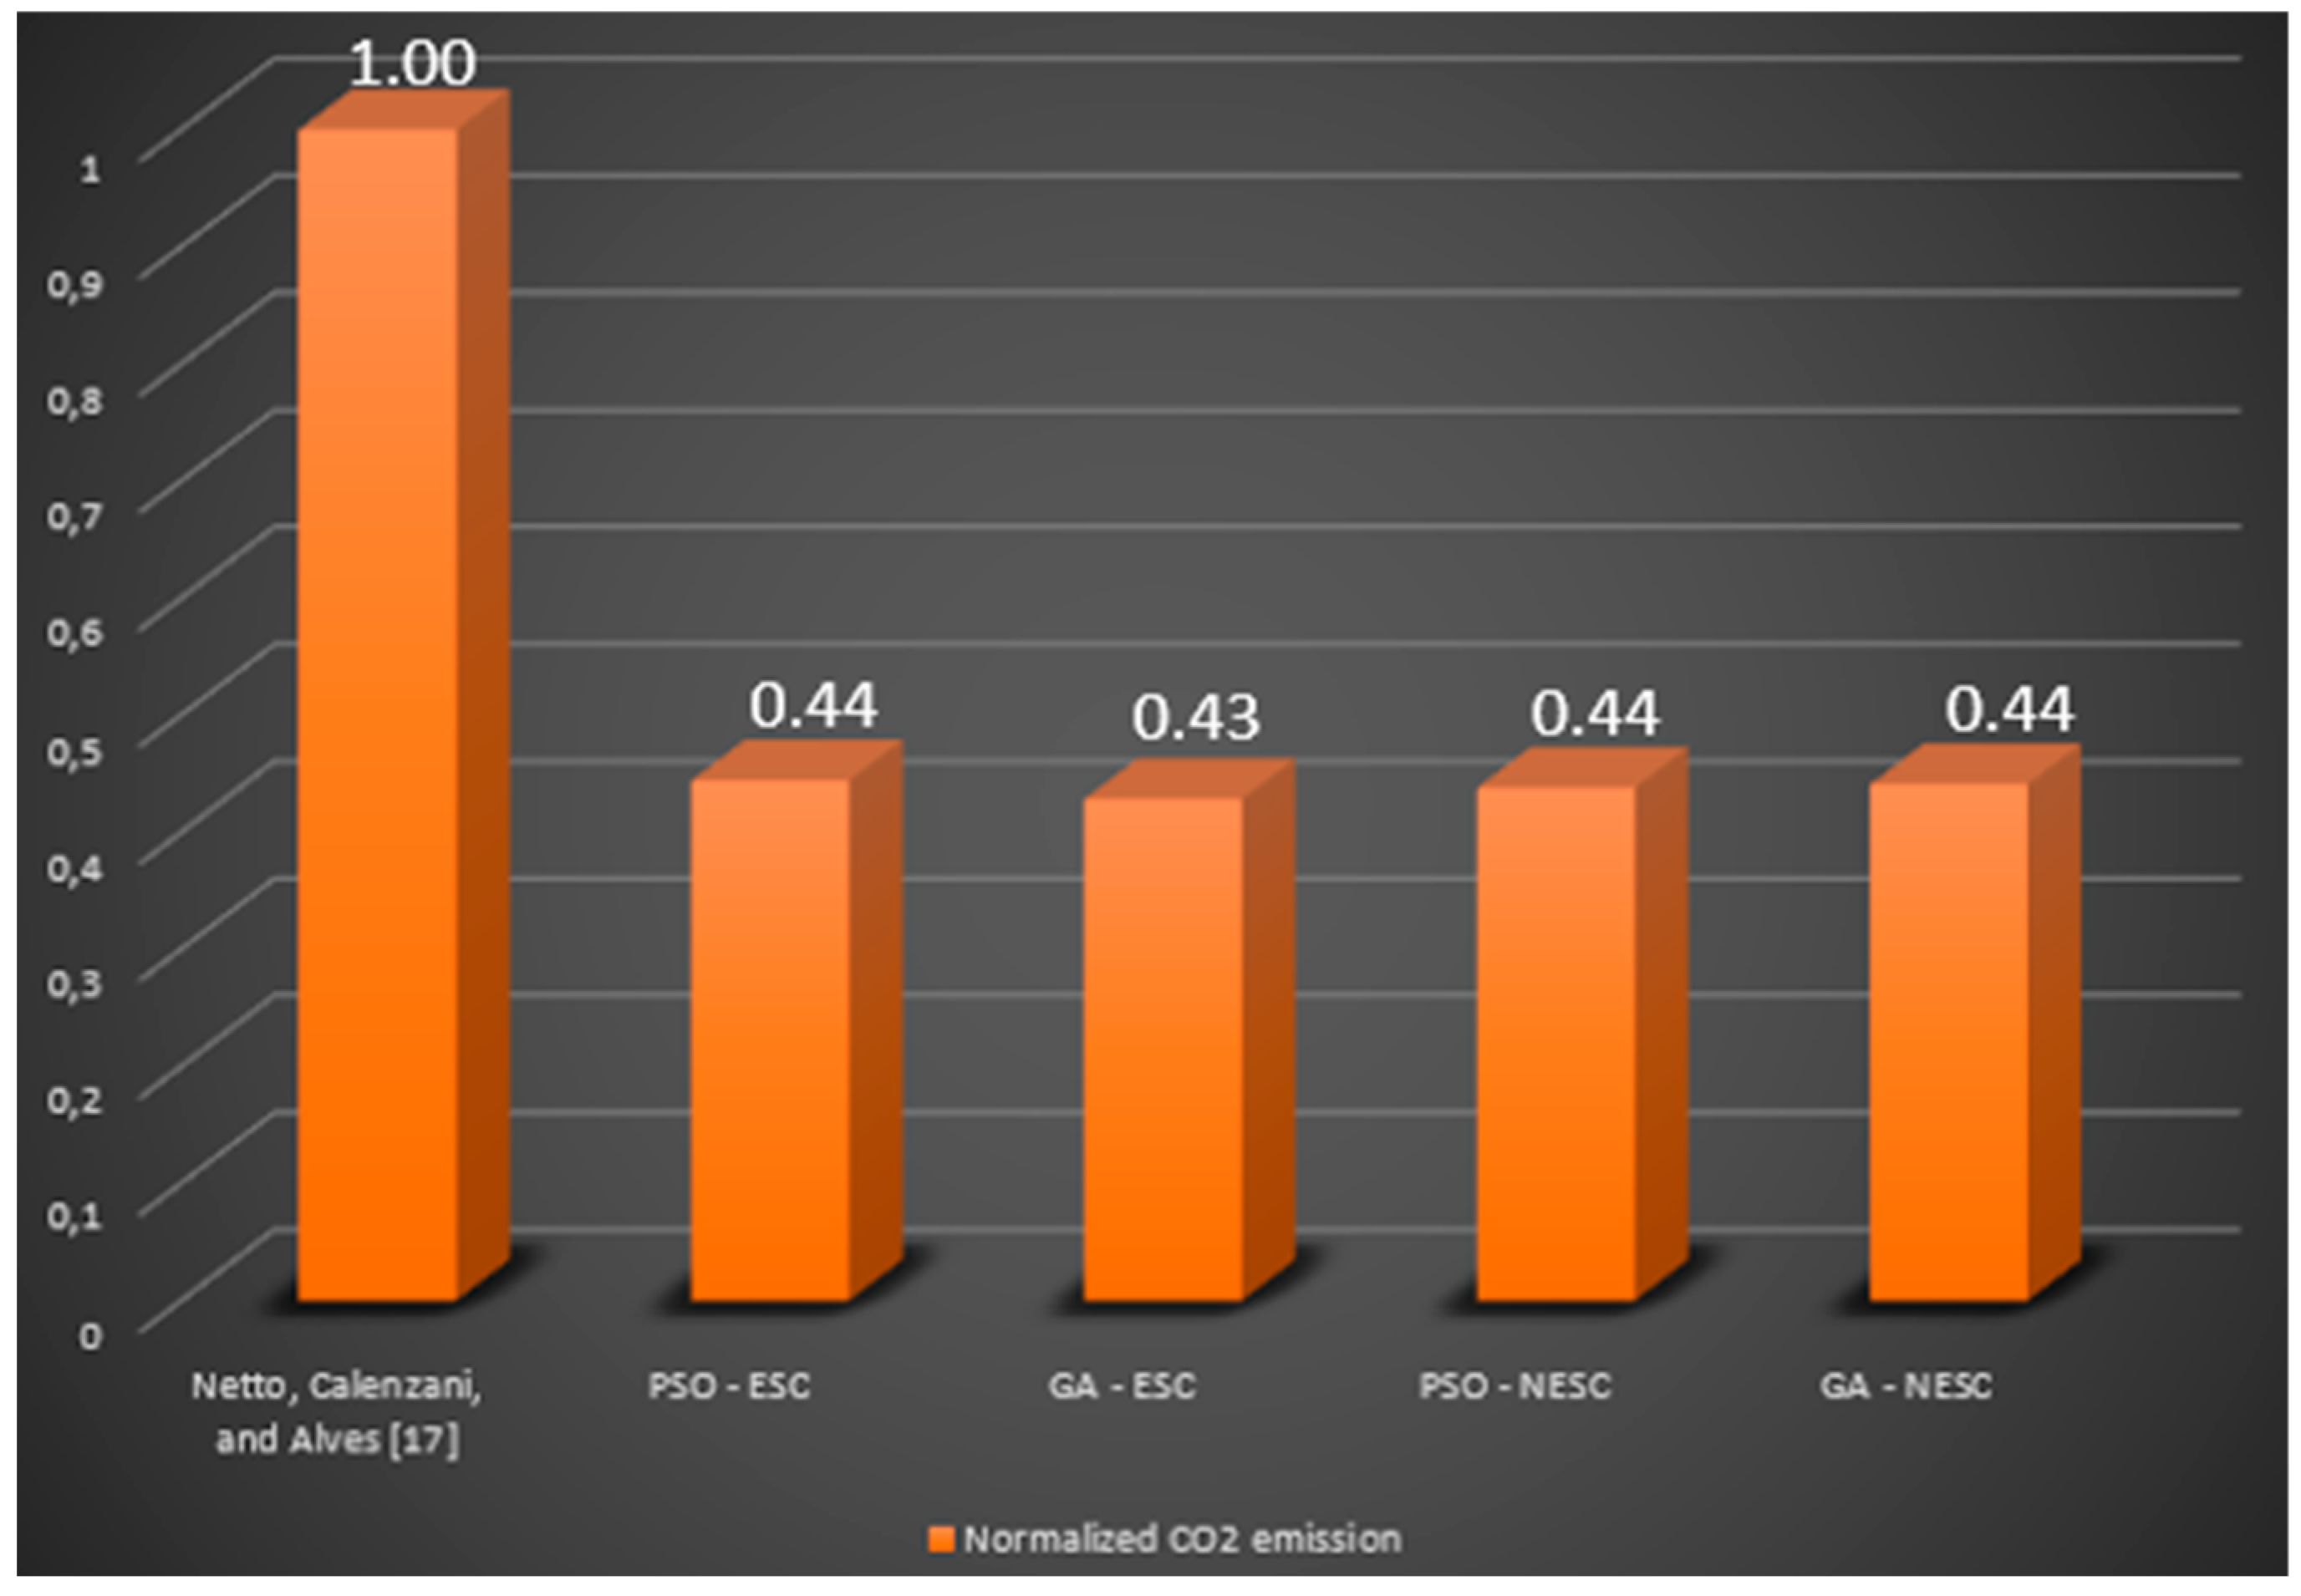
Figure 8 shows the total emission normalized in relation to the result by Netto, Calenzani, and Alves [
17]. The genetic algorithm with an unshored structure was the model that generated the best solution, reducing total emissions by 57.2%.
Figure 9 shows the constraints used to analyze the models, in which the governing constraints were the positive moment constraints in all three phases and deflection and combined bending in step 3.
3.3. Example 3 – Parametric Analysis
With the aim of analyzing the impacts of CO
2 emissions on prestressed composite beams and evaluate which composition and factors most influence emissions, a parametric analysis of the prestressed composite beam was performed, varying the spam from 5 to 40 m in 2.5-m steps. Our analysis considered several factors, including a 3-m distance between beams, a 345-Mpa steel yield strength, and, as optimization variables, the section of the steel profile, its number of tendons, the thickness of the concrete slab, and the compressive strength of the used concrete. For loading, in addition to the weight of the beam, 2kN/m
2 were considered for the dead load; 5kN/m
2, for the live load; and 1kN/m
2, for the construction load. Optimization problem solutions were evaluated via both GA and PSO.
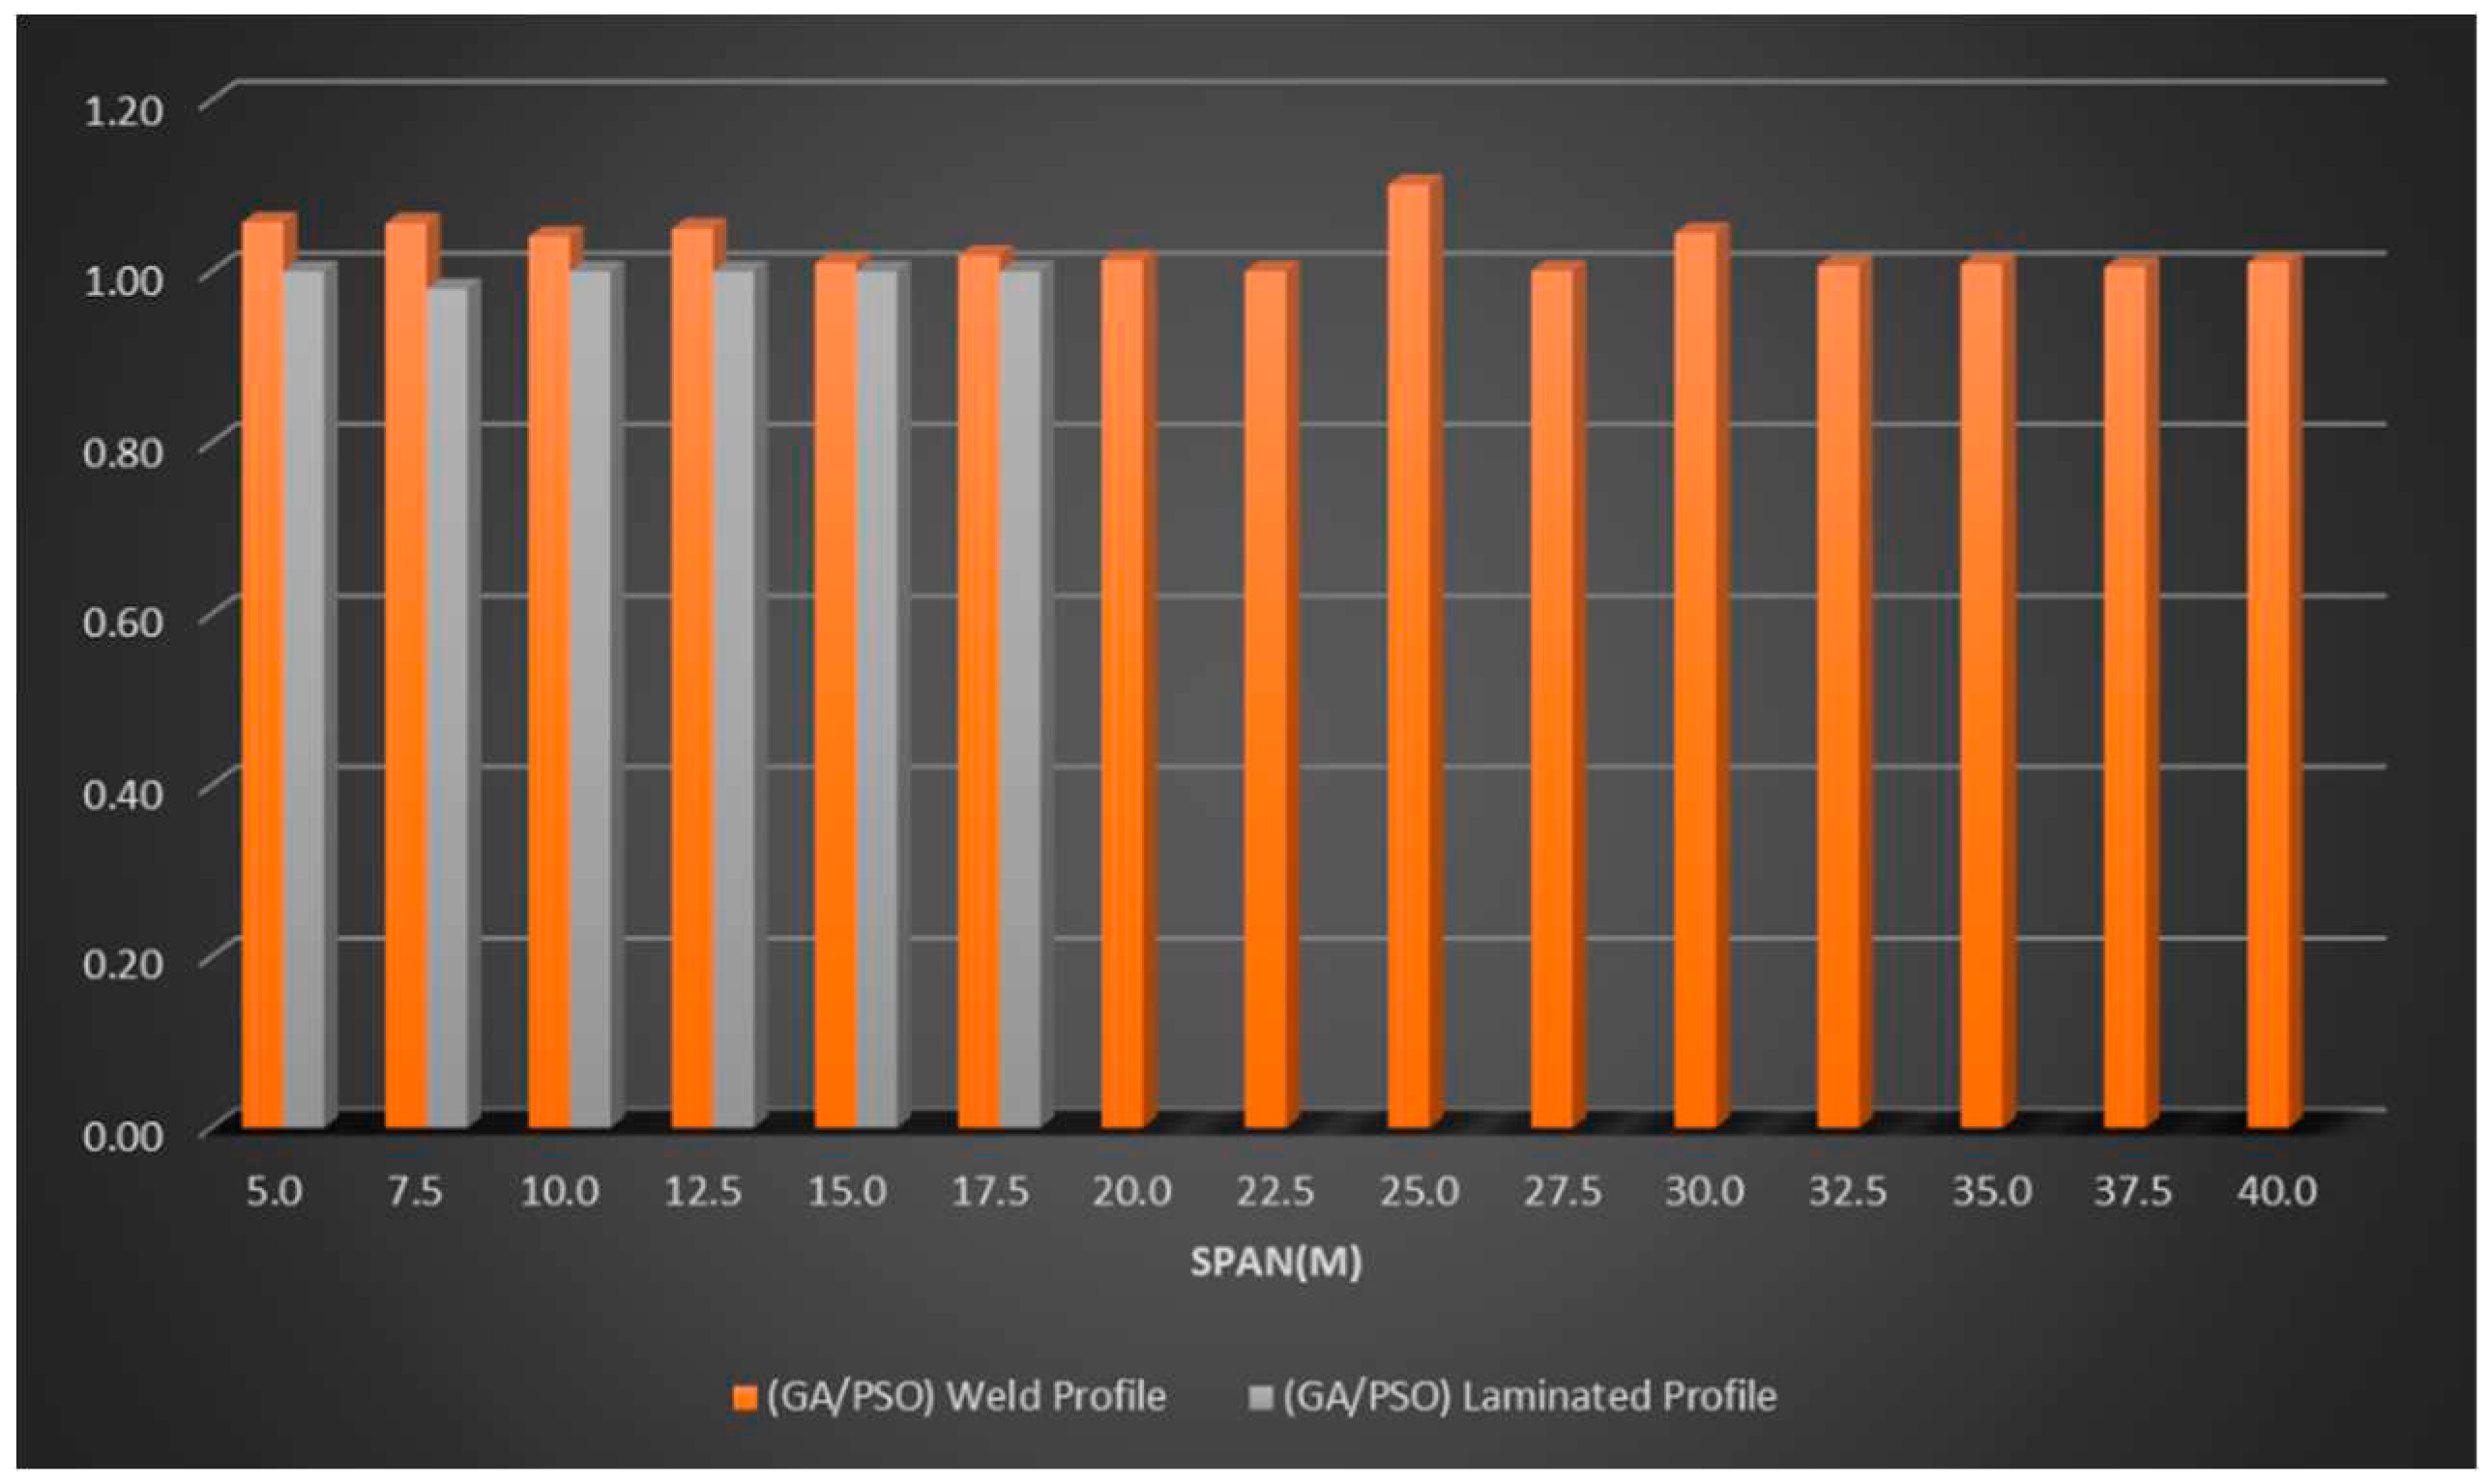
Figure 10 shows the ratio of the solution obtained via GA and PSO.
Figure 10 shows that PSO provided better or equal solutions to GA for both laminated profiles and welded profiles. Regarding welded profiles, the biggest difference totaled 11% for the 5-m span, whereas for laminated profiles, the biggest difference was around 2%. For the 20-m span, GA was unable to find a solution to the problem when adopting the laminated profile. Considering the GA limitations and that the best solutions were obtained via PSO, our analyses will refer to the solutions via PSO.
Regarding the PSO solutions for both laminated and welded profiles,
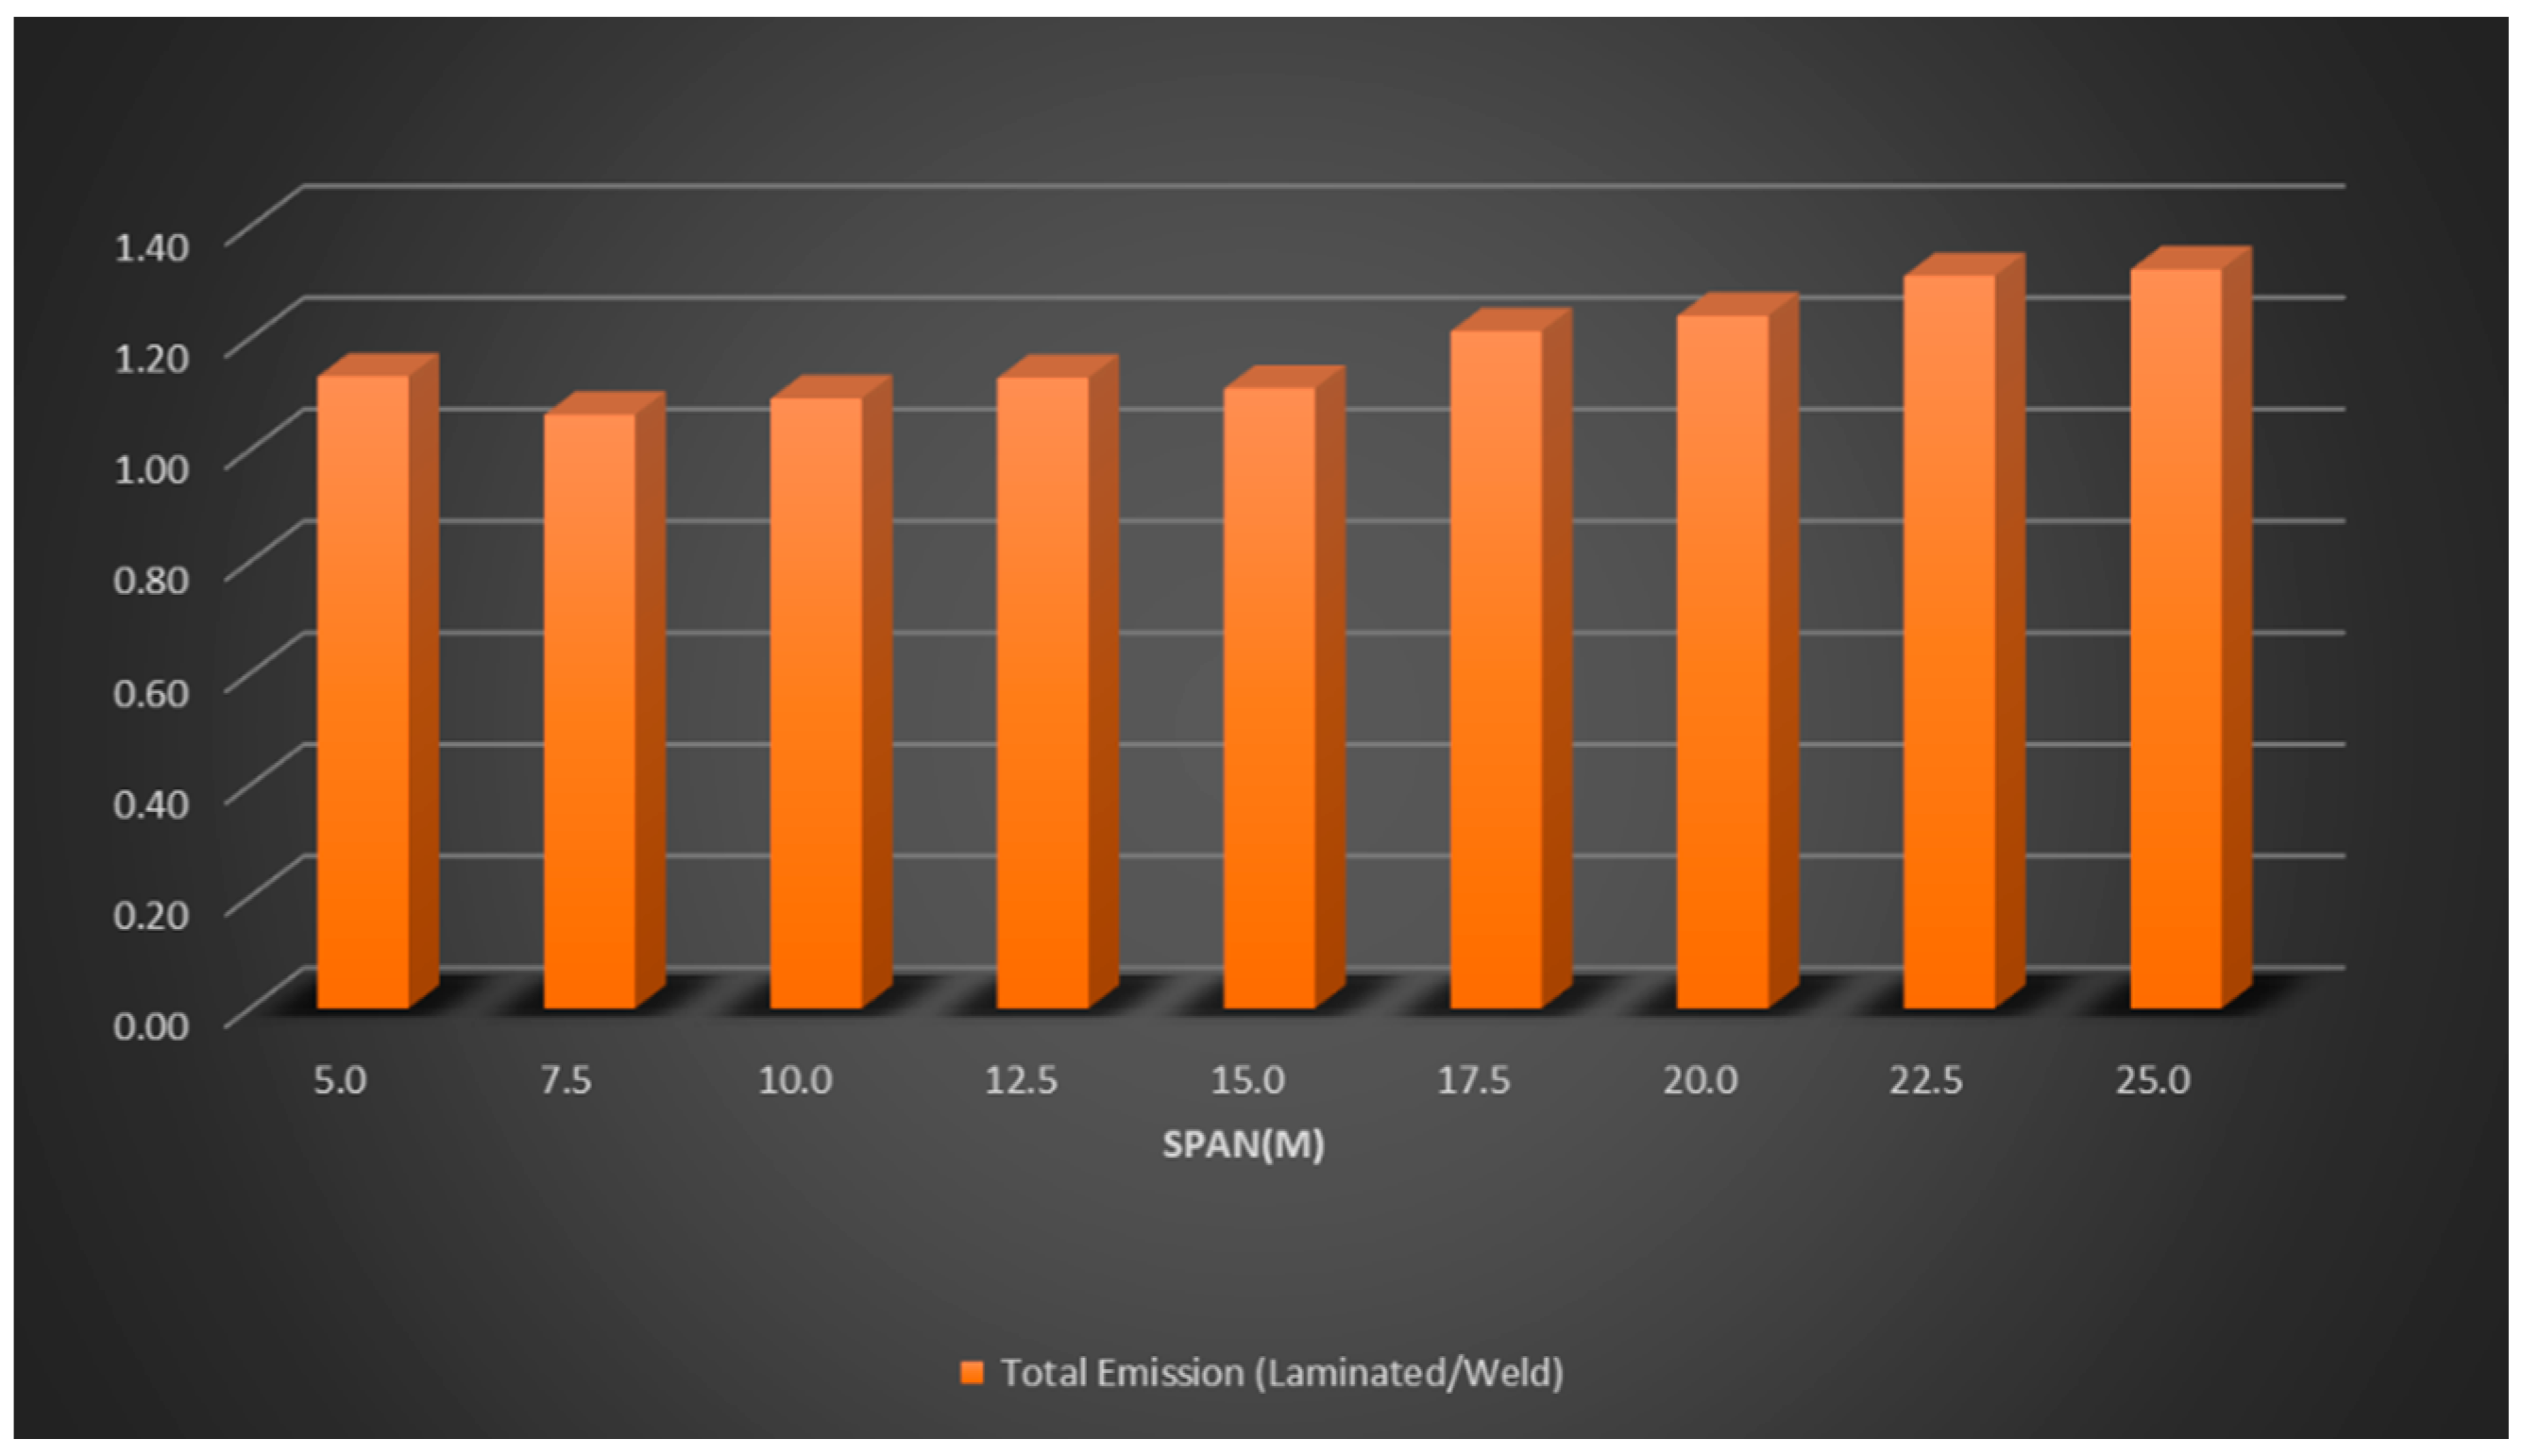
Figure 11 shows the relation between the best solutions for total emissions, which we limited to a maximum span of 25 m.
Figure 11 shows that when comparing the solutions obtained for laminated and welded profiles, the best solutions were for the welded profile regarding CO
2 emissions, even considering the emission of the weld in the profile manufacturing process.
Table 5 and
Table 6 show the dimensions obtained for both laminated and welded profiles after optimization, respectively.
Table 5 shows that laminated profiles faced limitations in their dimensions and, thus, tendons were required to solve the problem for spans of 20 m or more. On the other hand, for welded profiles, tendons were only necessary for spans exceeding 30 m. It can also be observed that for all beams, the solutions obtained were for an 11-cm concrete slab. The compressive strength of concrete starts to increase from the 17.5-m span for laminated profiles and the 20-m one for welded ones. Although the highest strength concrete has, the higher their CO
2 emission, this value is compensated in the composition of the final resistance capacity of the prestressed composite steel-concrete beam.
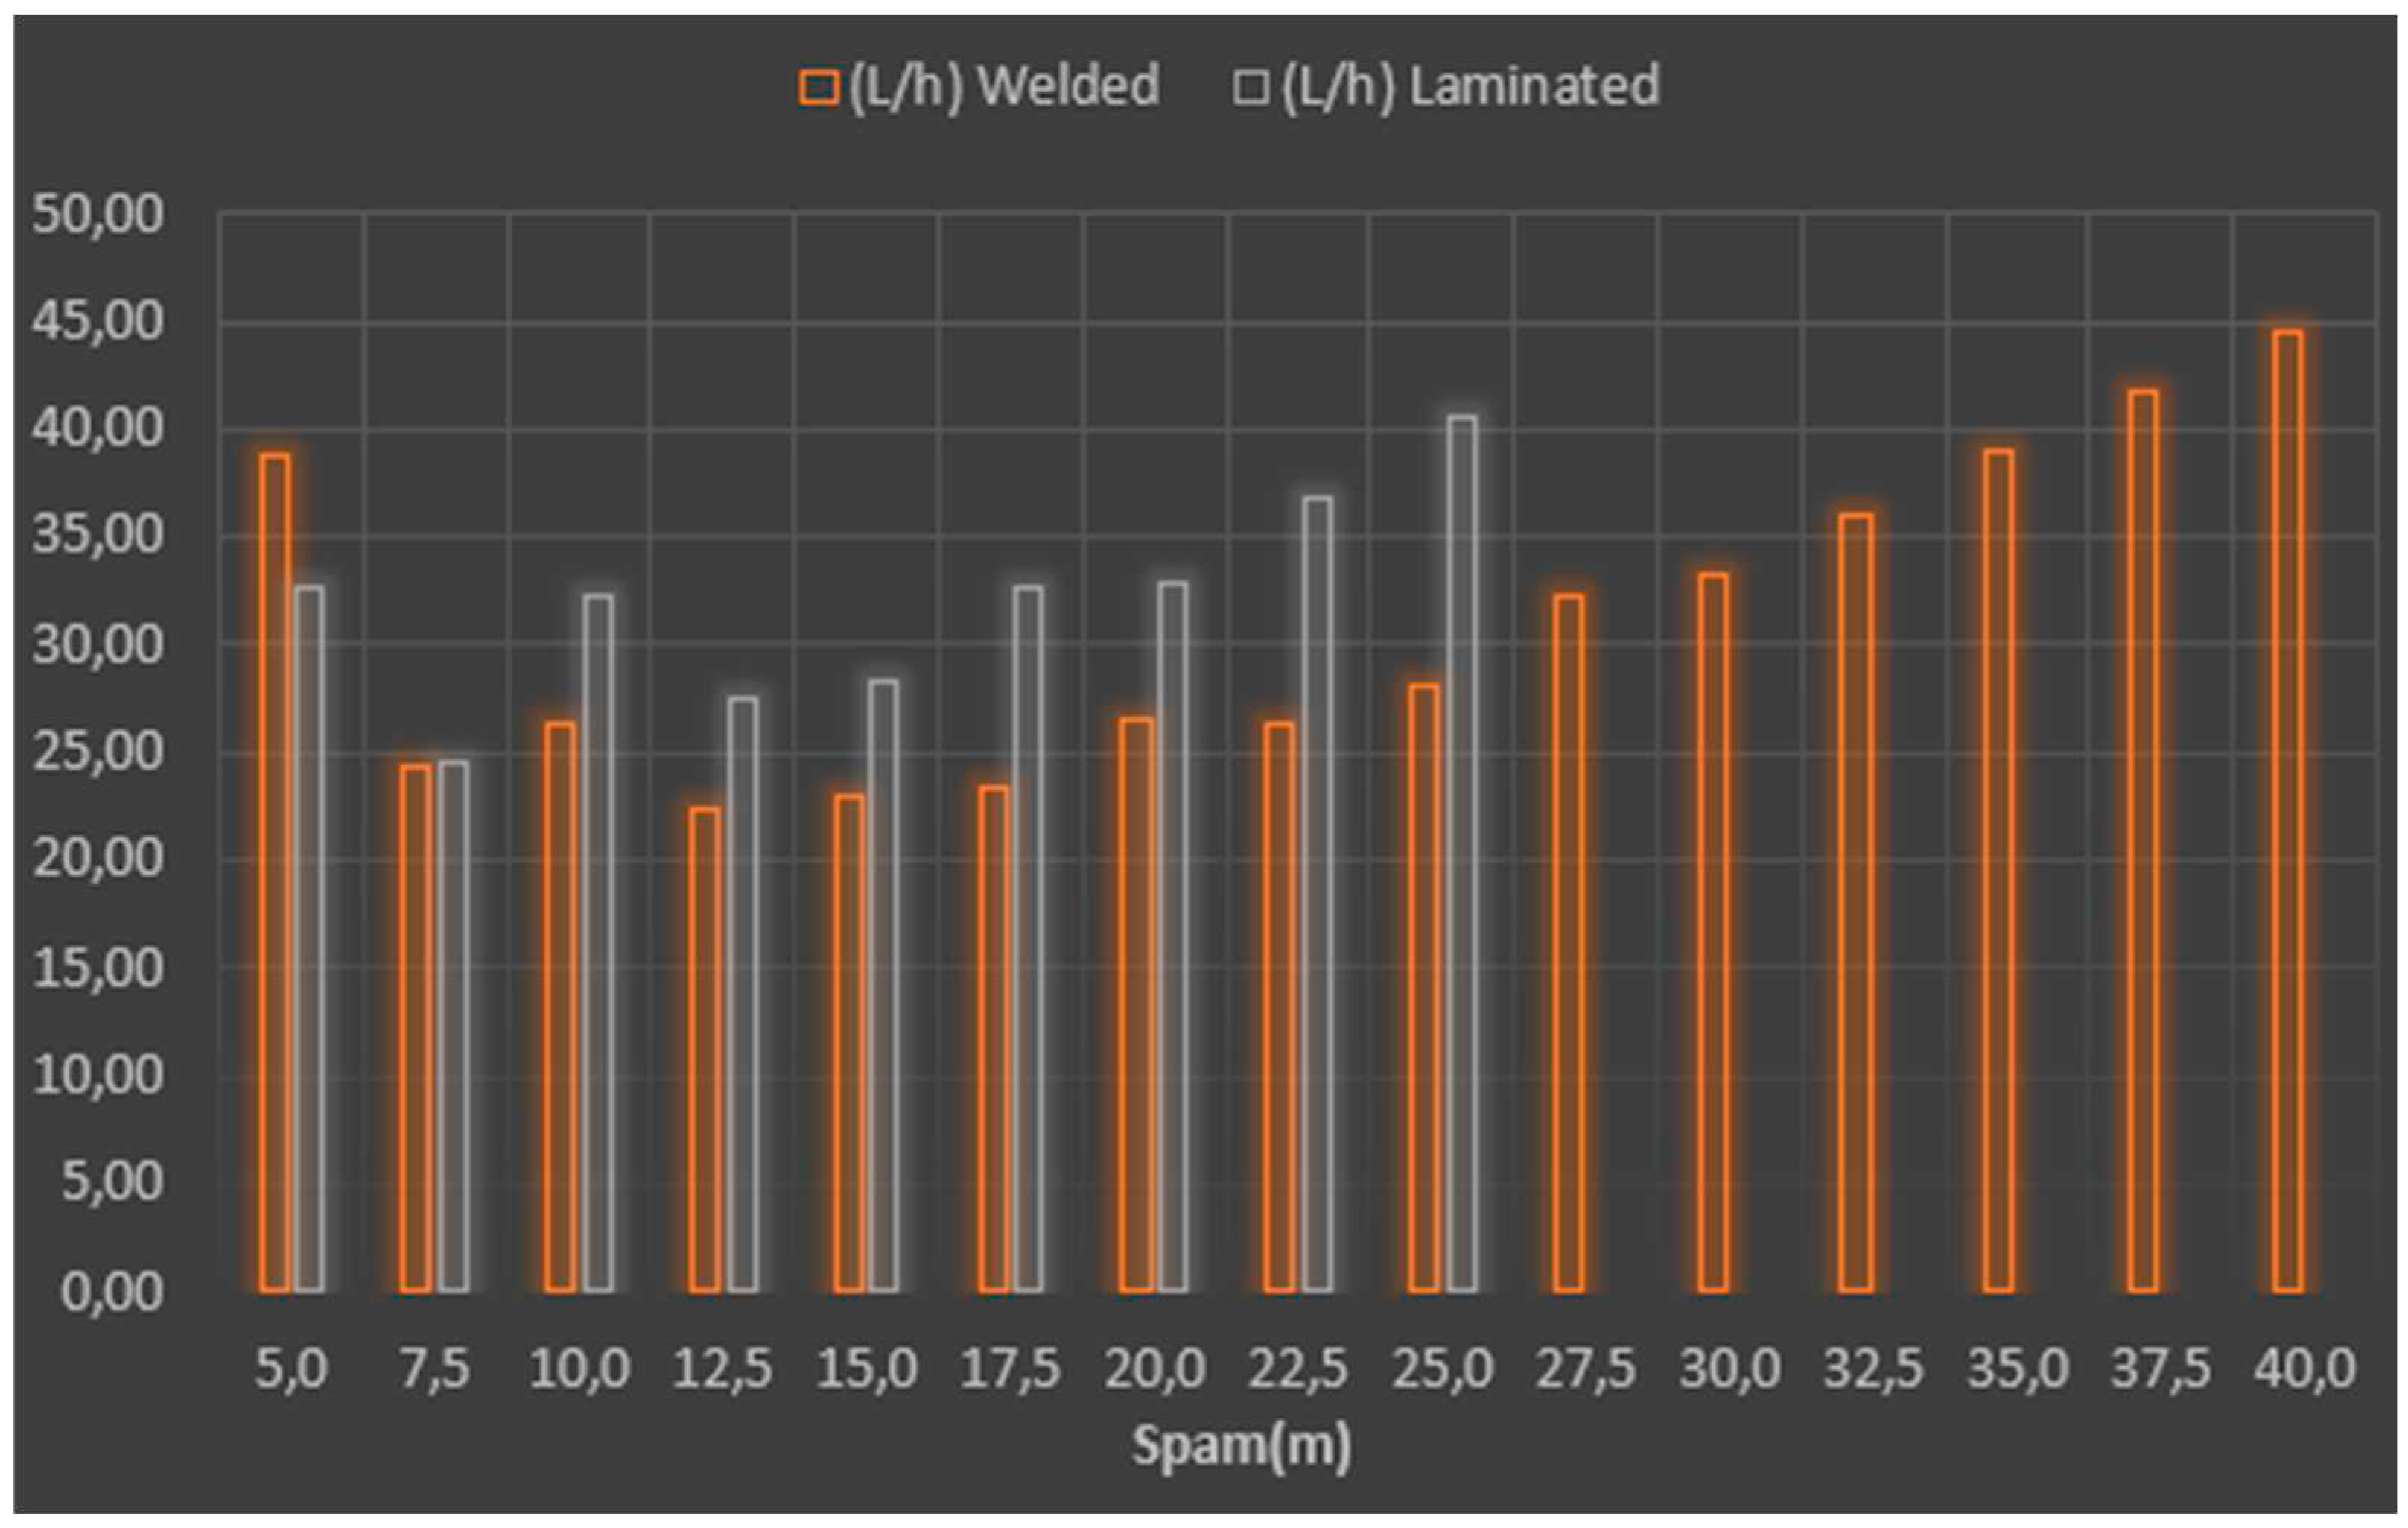
Figure 12 shows our analysis of the span/height ratio (
L/h) of laminated and welded profiles for the obtained solutions.
Figure 12 shows that the
L/h ratio for laminated profiles was higher than that for welded ones in the same analyzed spans. Laminated profiles averaged a 32 ratio, whereas welded ones, 31. These ratios indicate that a ratio between 30 and 35 L/h can be adopted for prestressed steel-concrete beams for pre-dimensioning purposes.
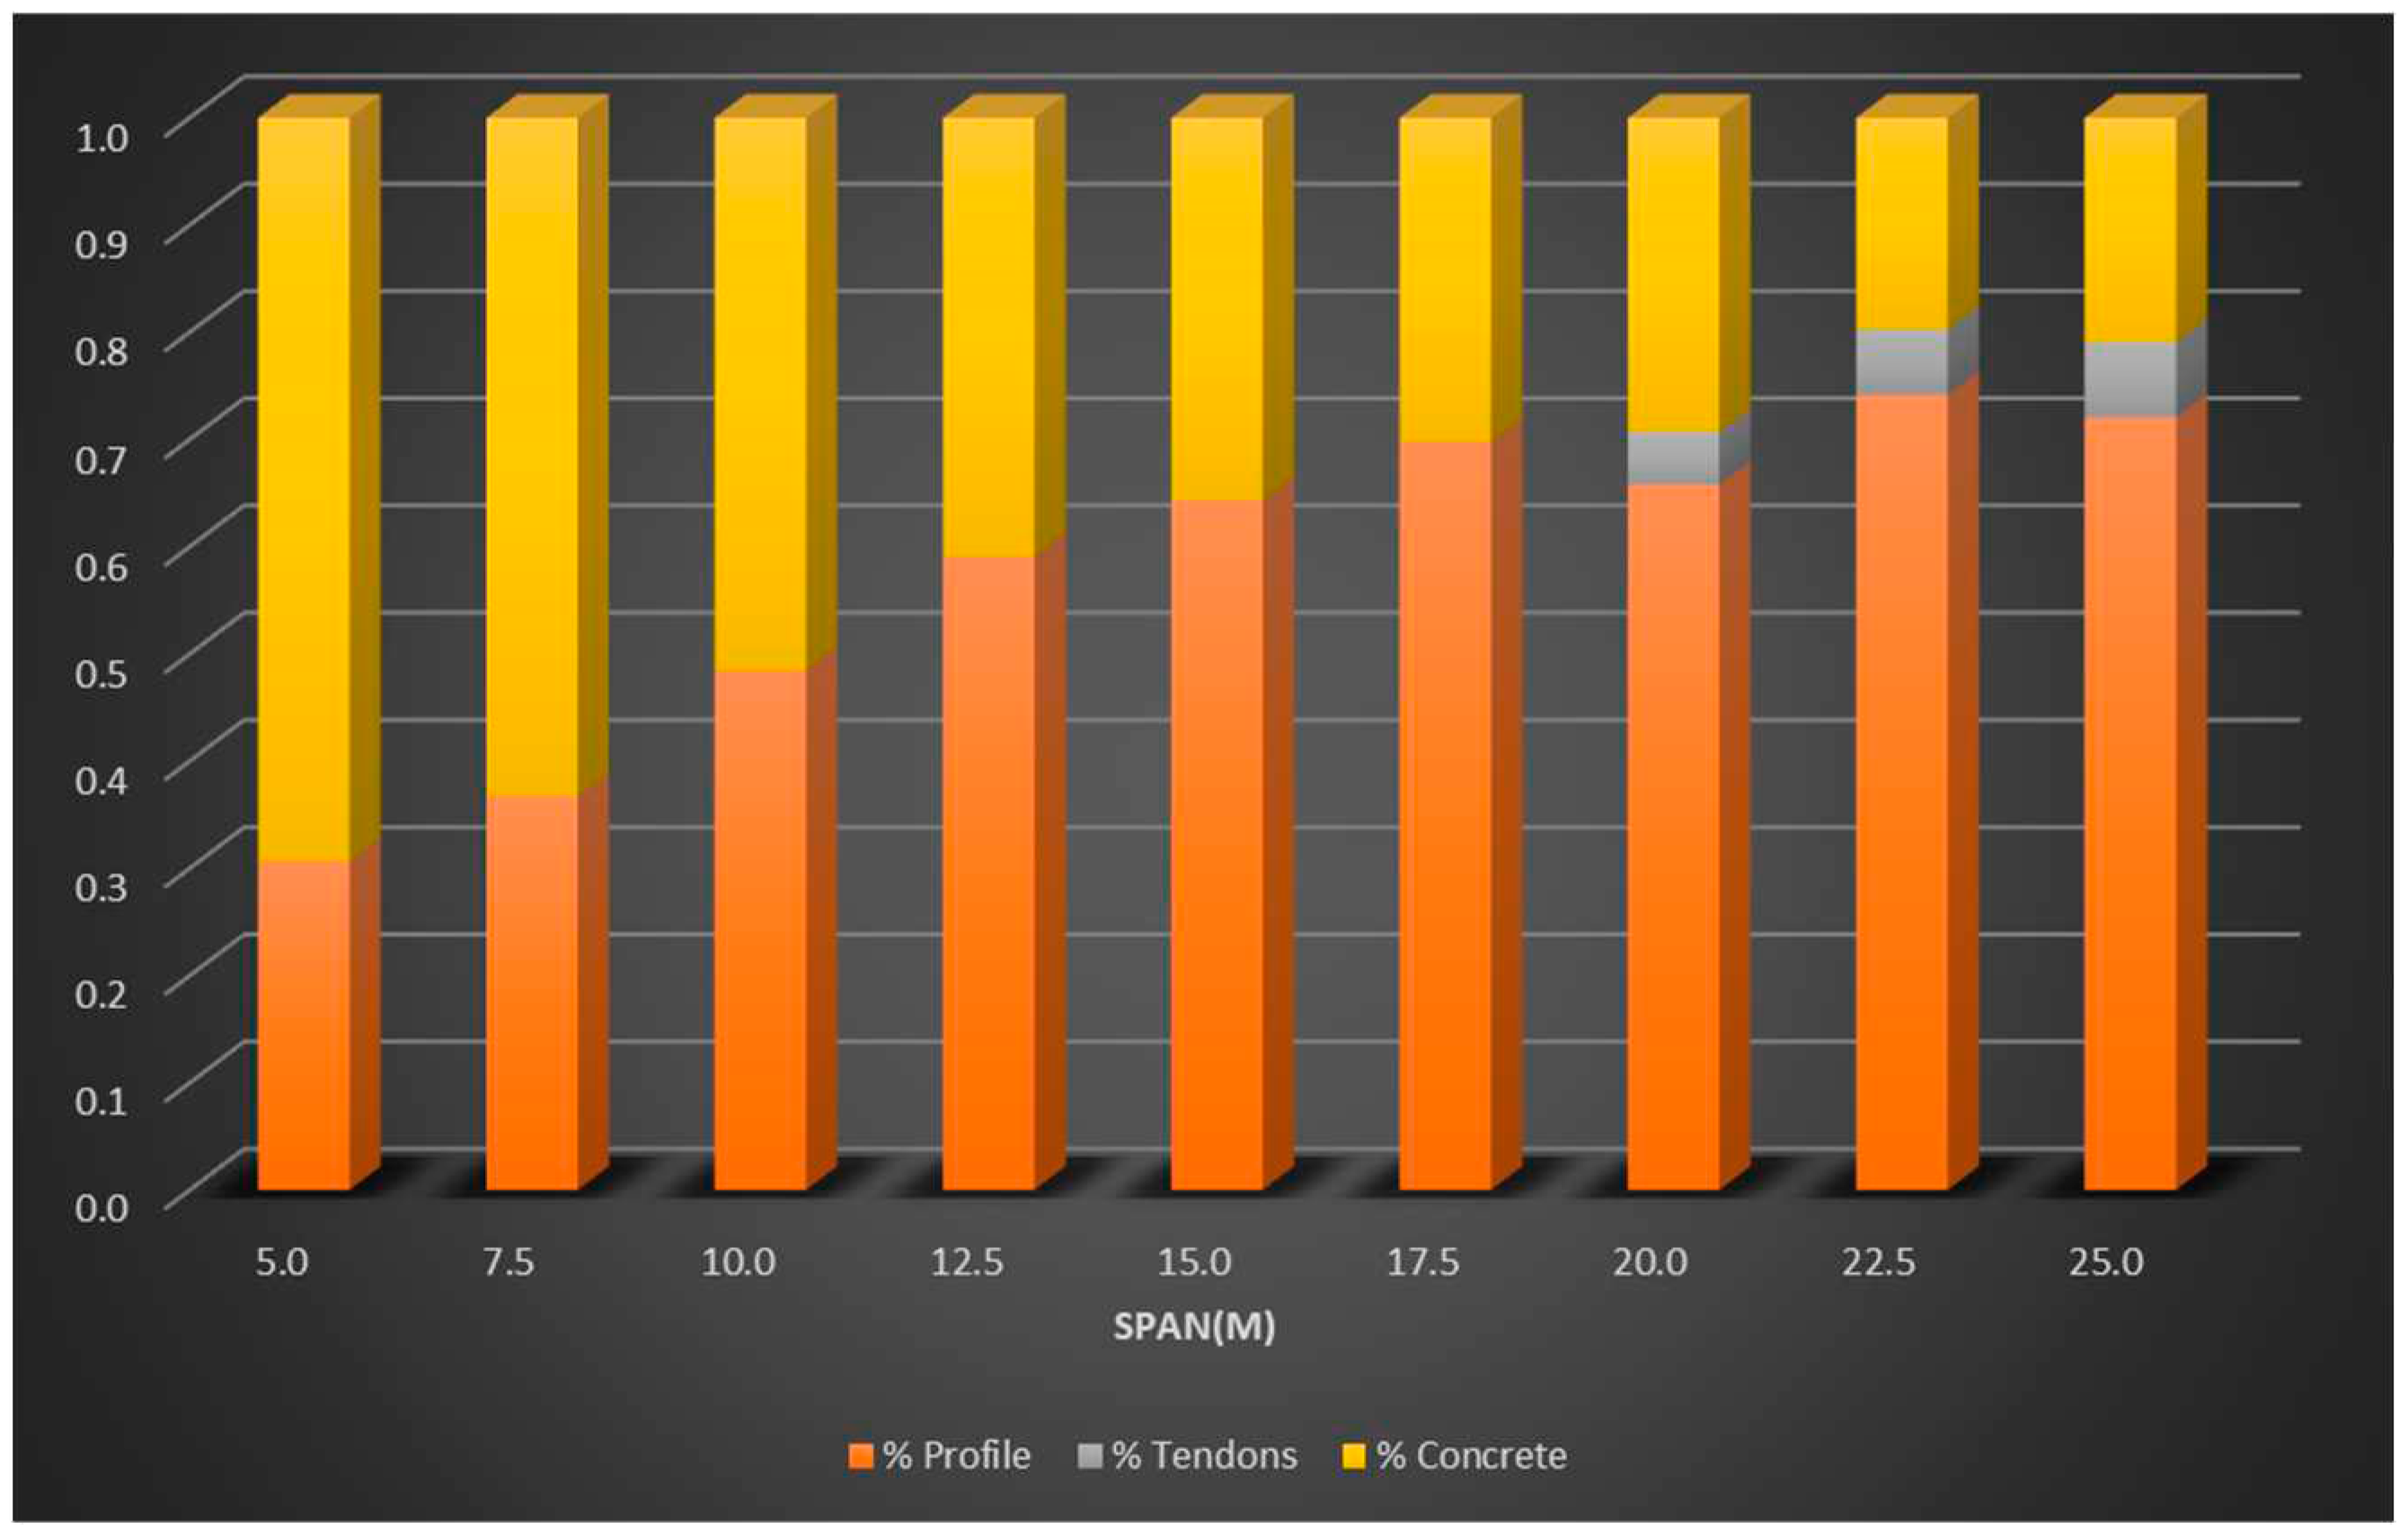
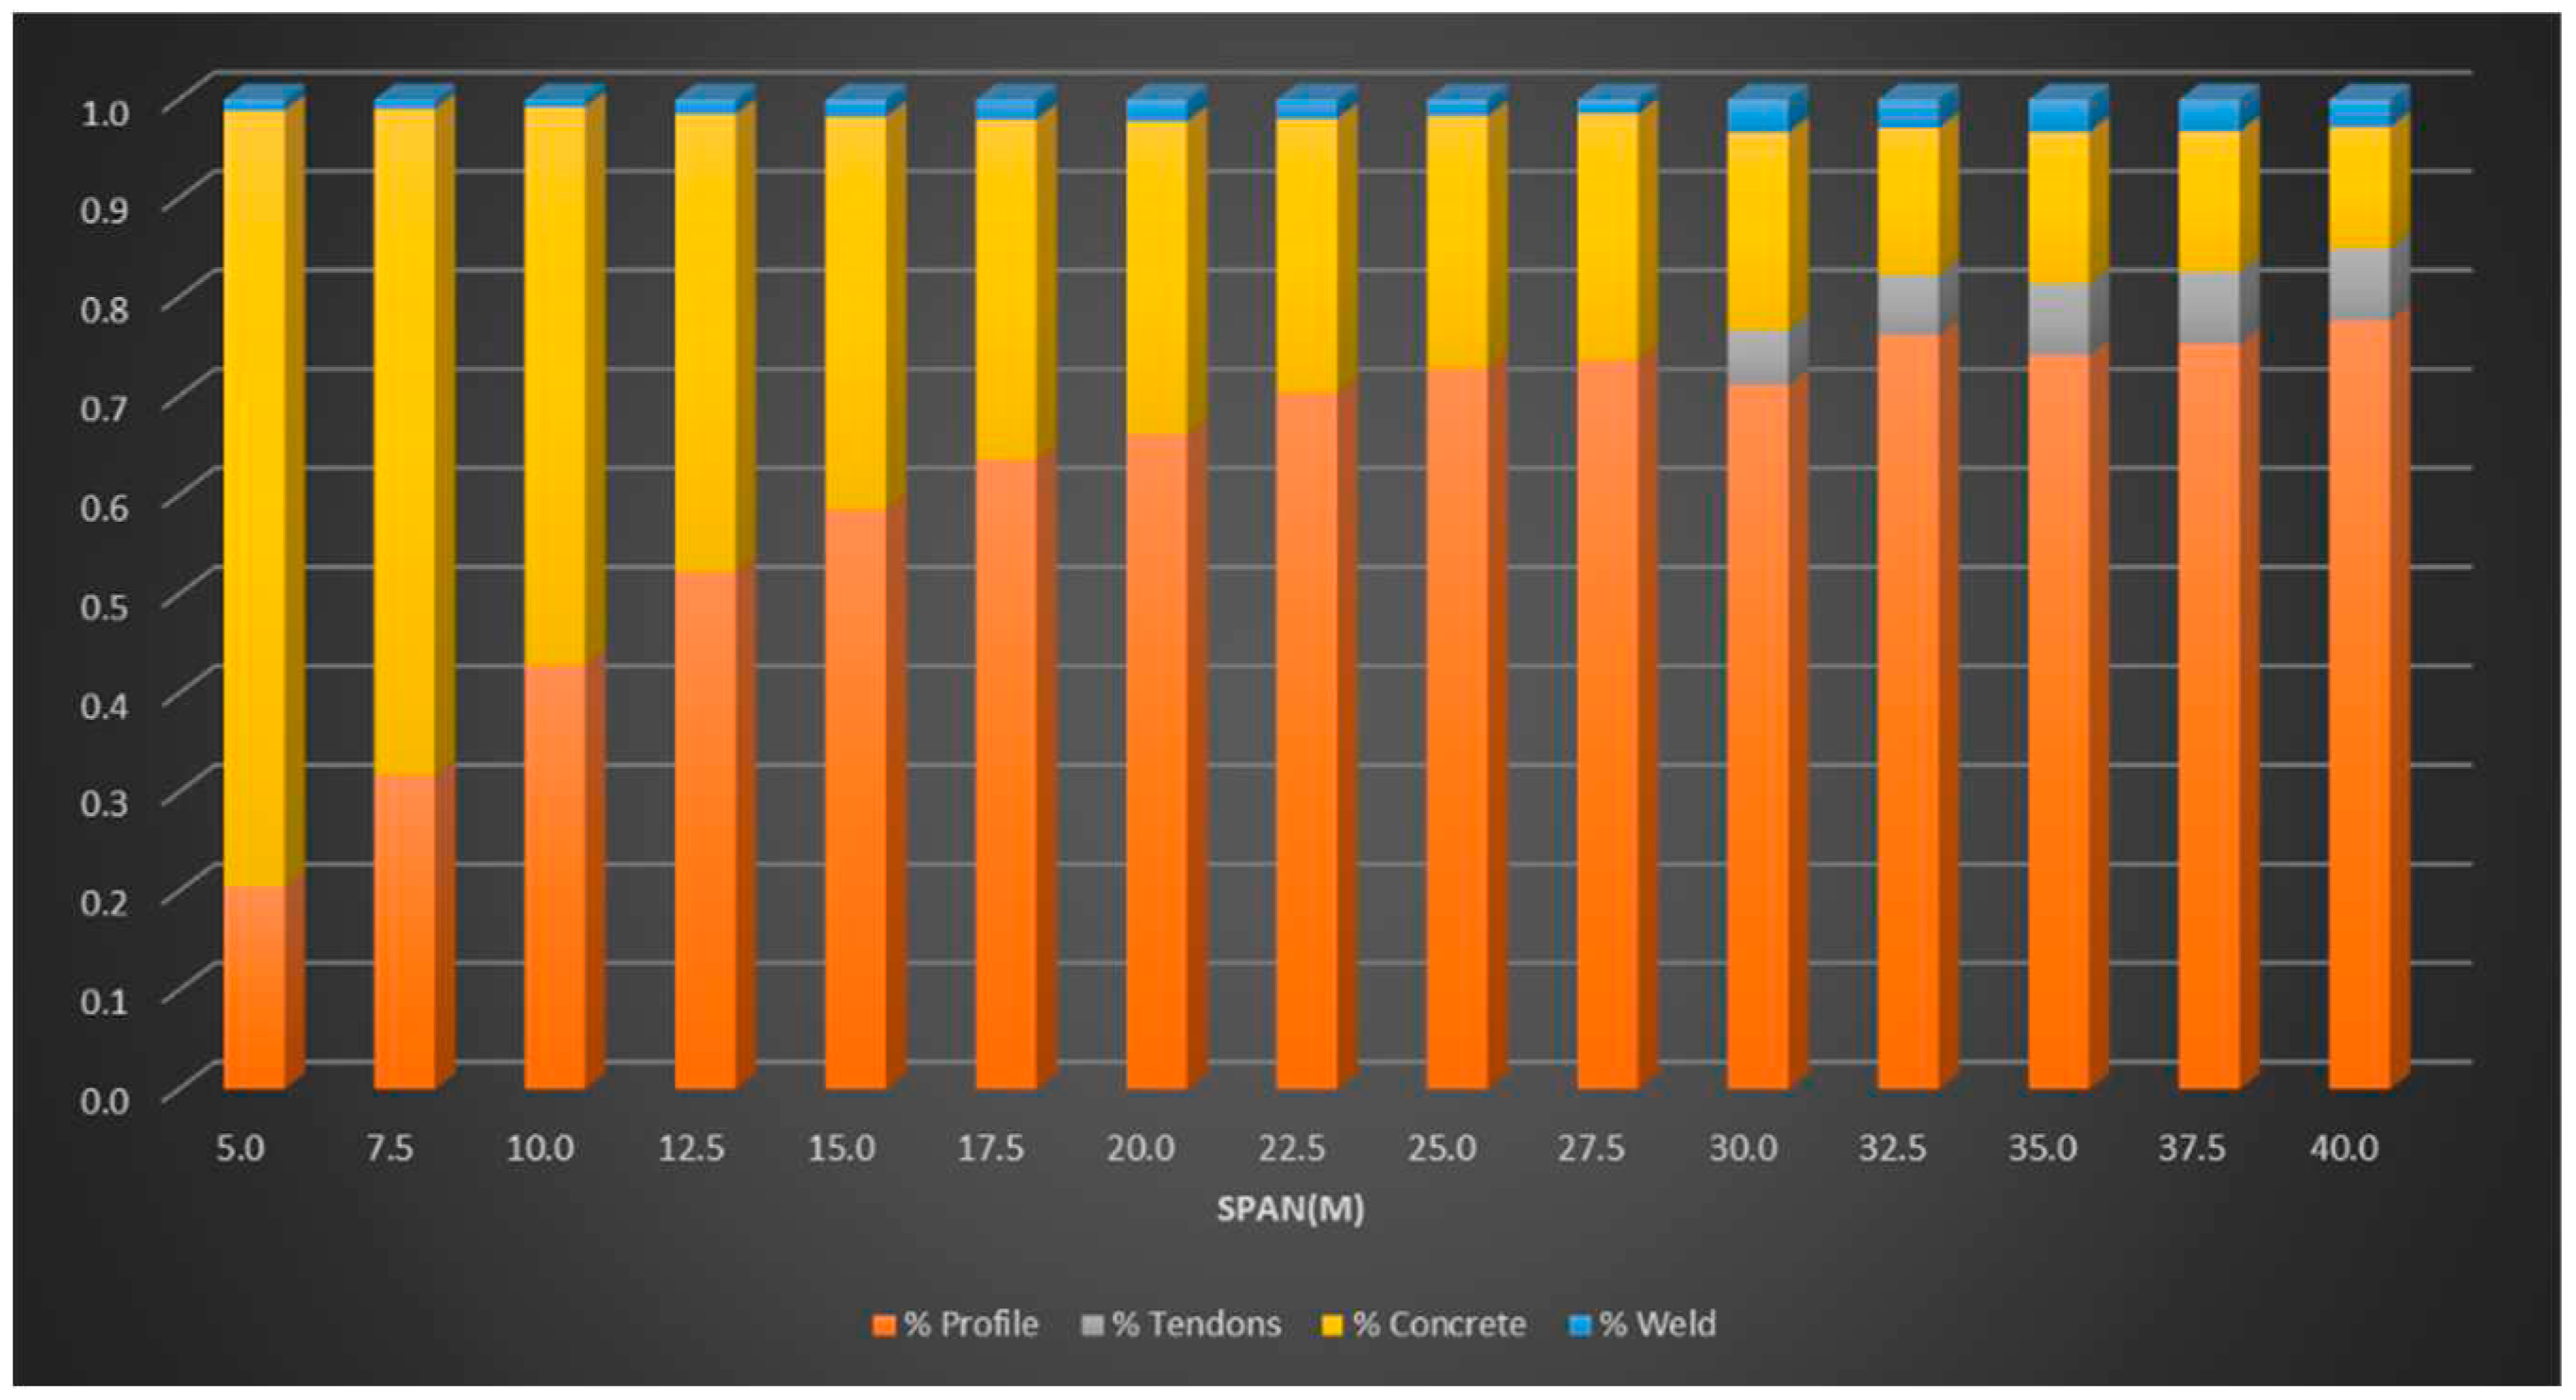
Figure 13 and
Figure 14 show the composition of the final emission of beams optimized with both the laminated and welded profiles.
For laminated profiles, as shown in
Figure 13, the steel profile is responsible for around 50% of the emission for 5-, 7.5-, and 10-m spans. For the largest spans, the emission related to the steel profile represents a value above 60%. On the other hand, for a 20-m span, emissions related to concrete revolved around 29%, whereas for tendons, around 5%. For the 22.5- and 25-m spans, emissions related to prestressing tendons and concrete were around 10% and 20%, respectively.
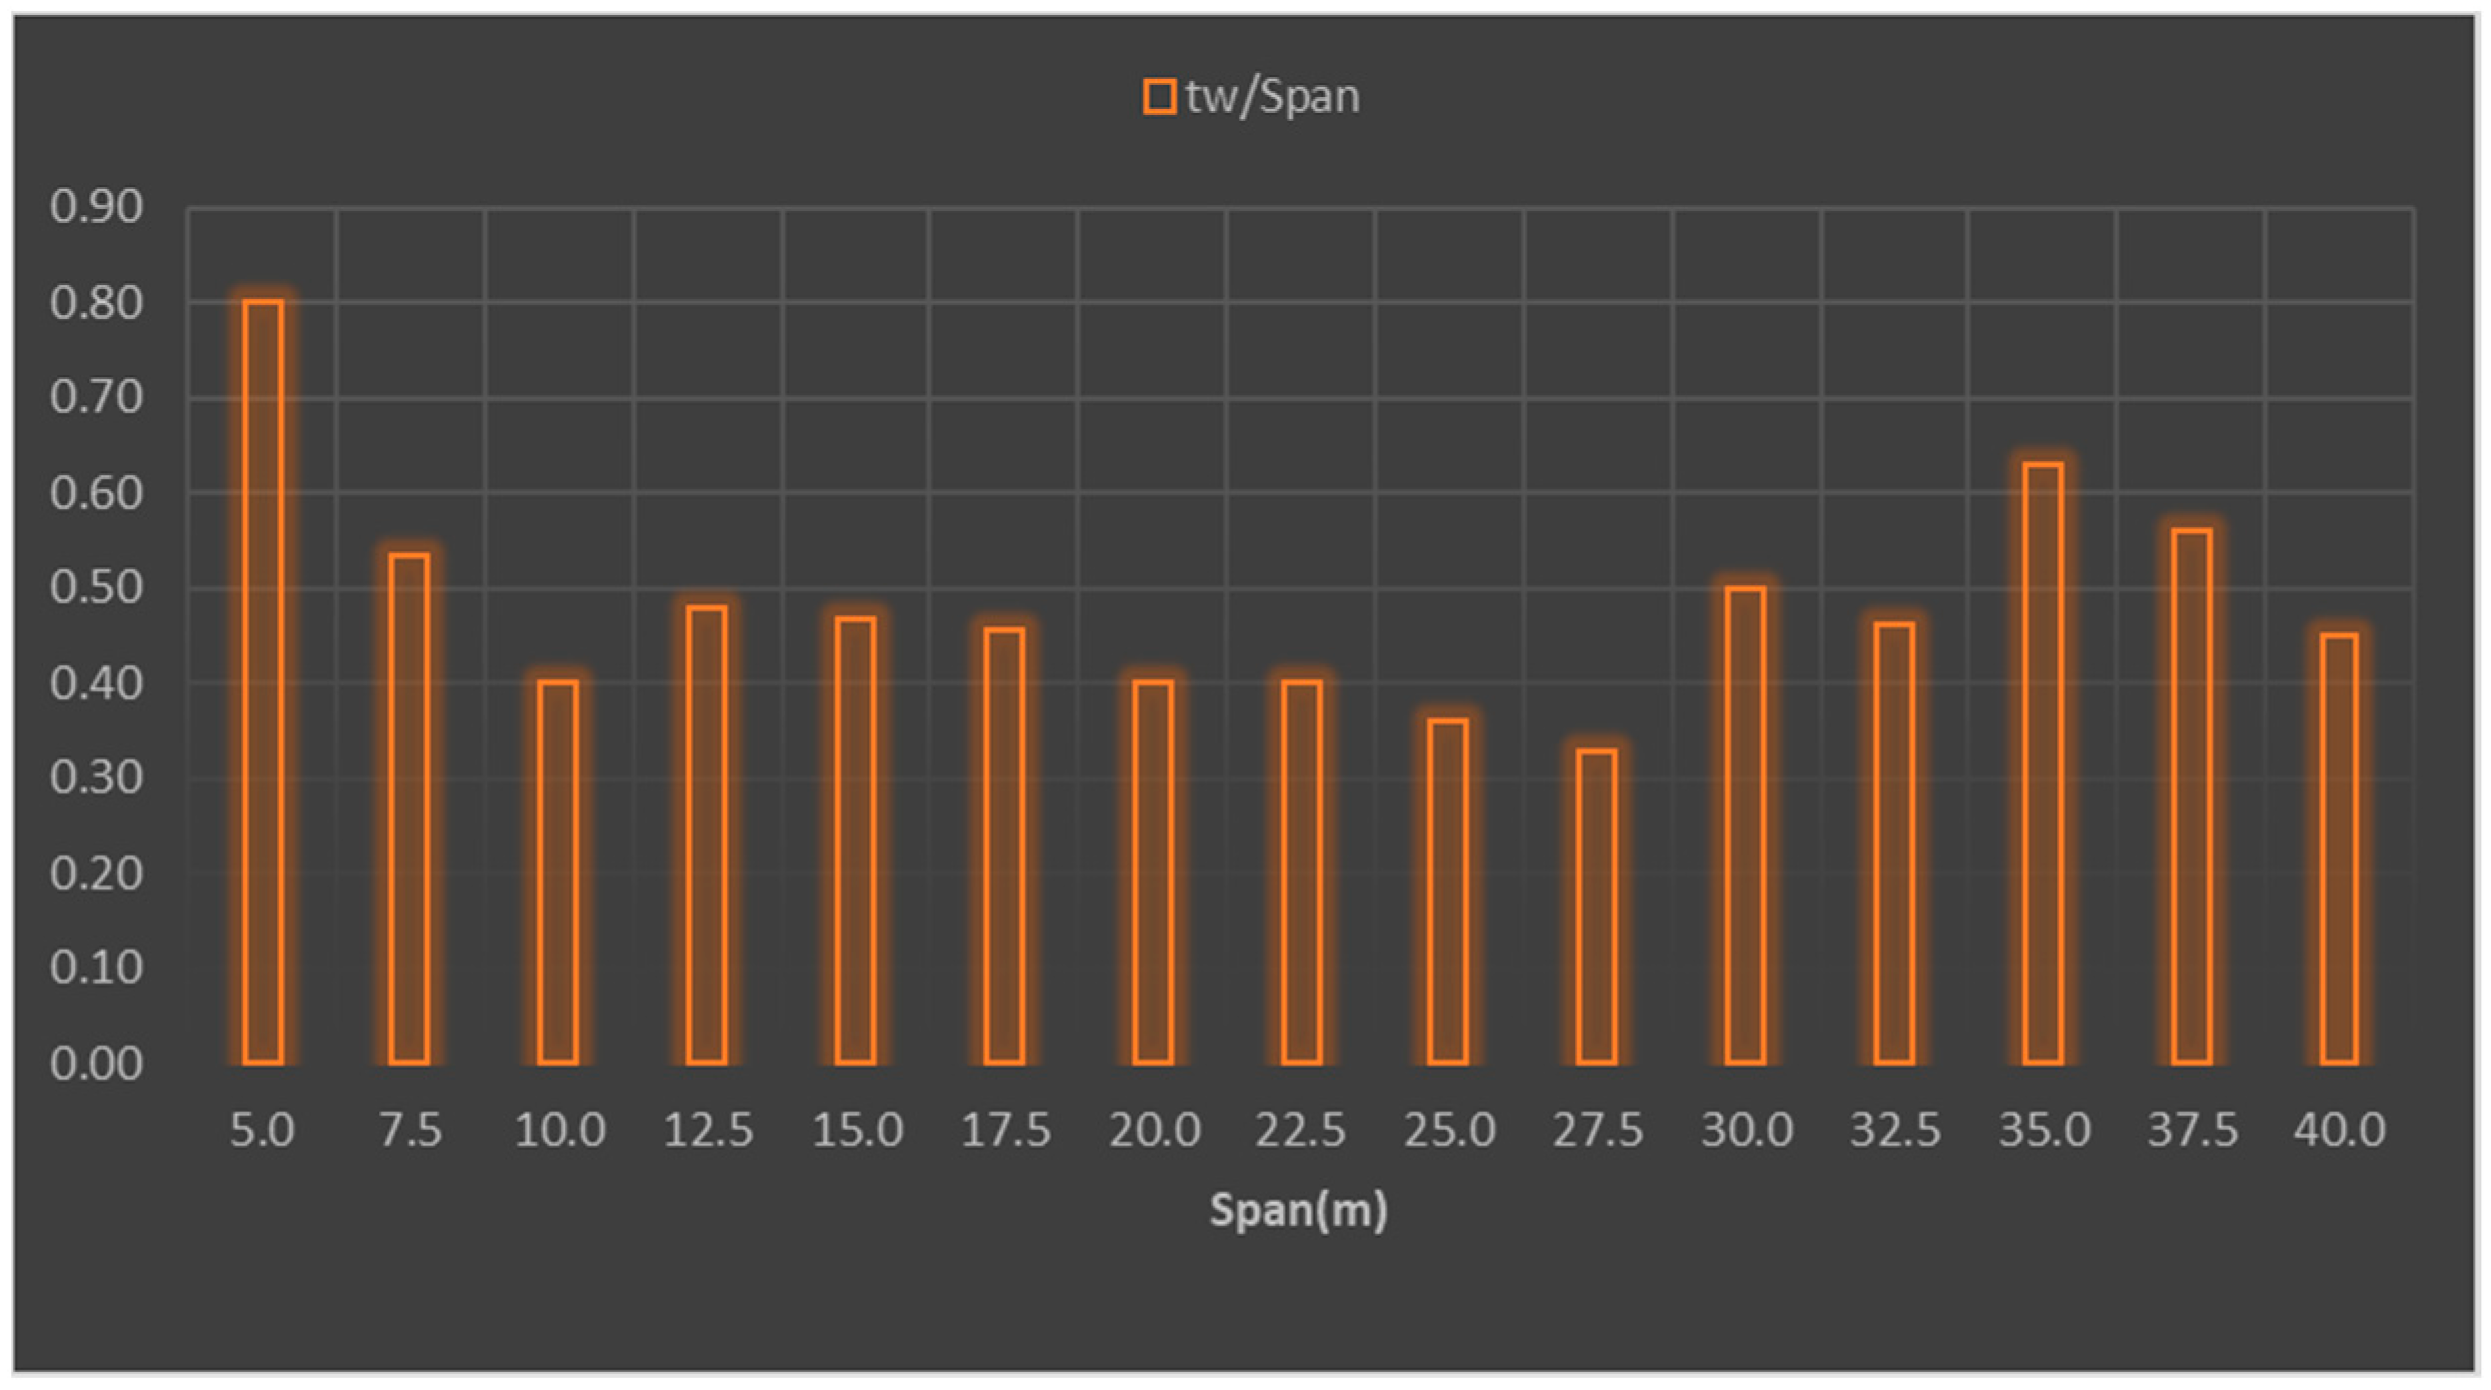
Welded profiles showed an emission distribution ratio similar to that for laminated profiles. Weld emission for these problems ranged from 1% for the 10-m span to a maximum value of 3.3% for the 30-, 35-, and 37.5-m spans. Note that weld emissions are proportional to the thickness of the web adopted for the welded profile, as shown in
Figure 15.
Emissions from tendons ranged from 5.5% for the 30-m span to 7.4% for the 37.5-m one, generating a low impact on the total emission of the beams.
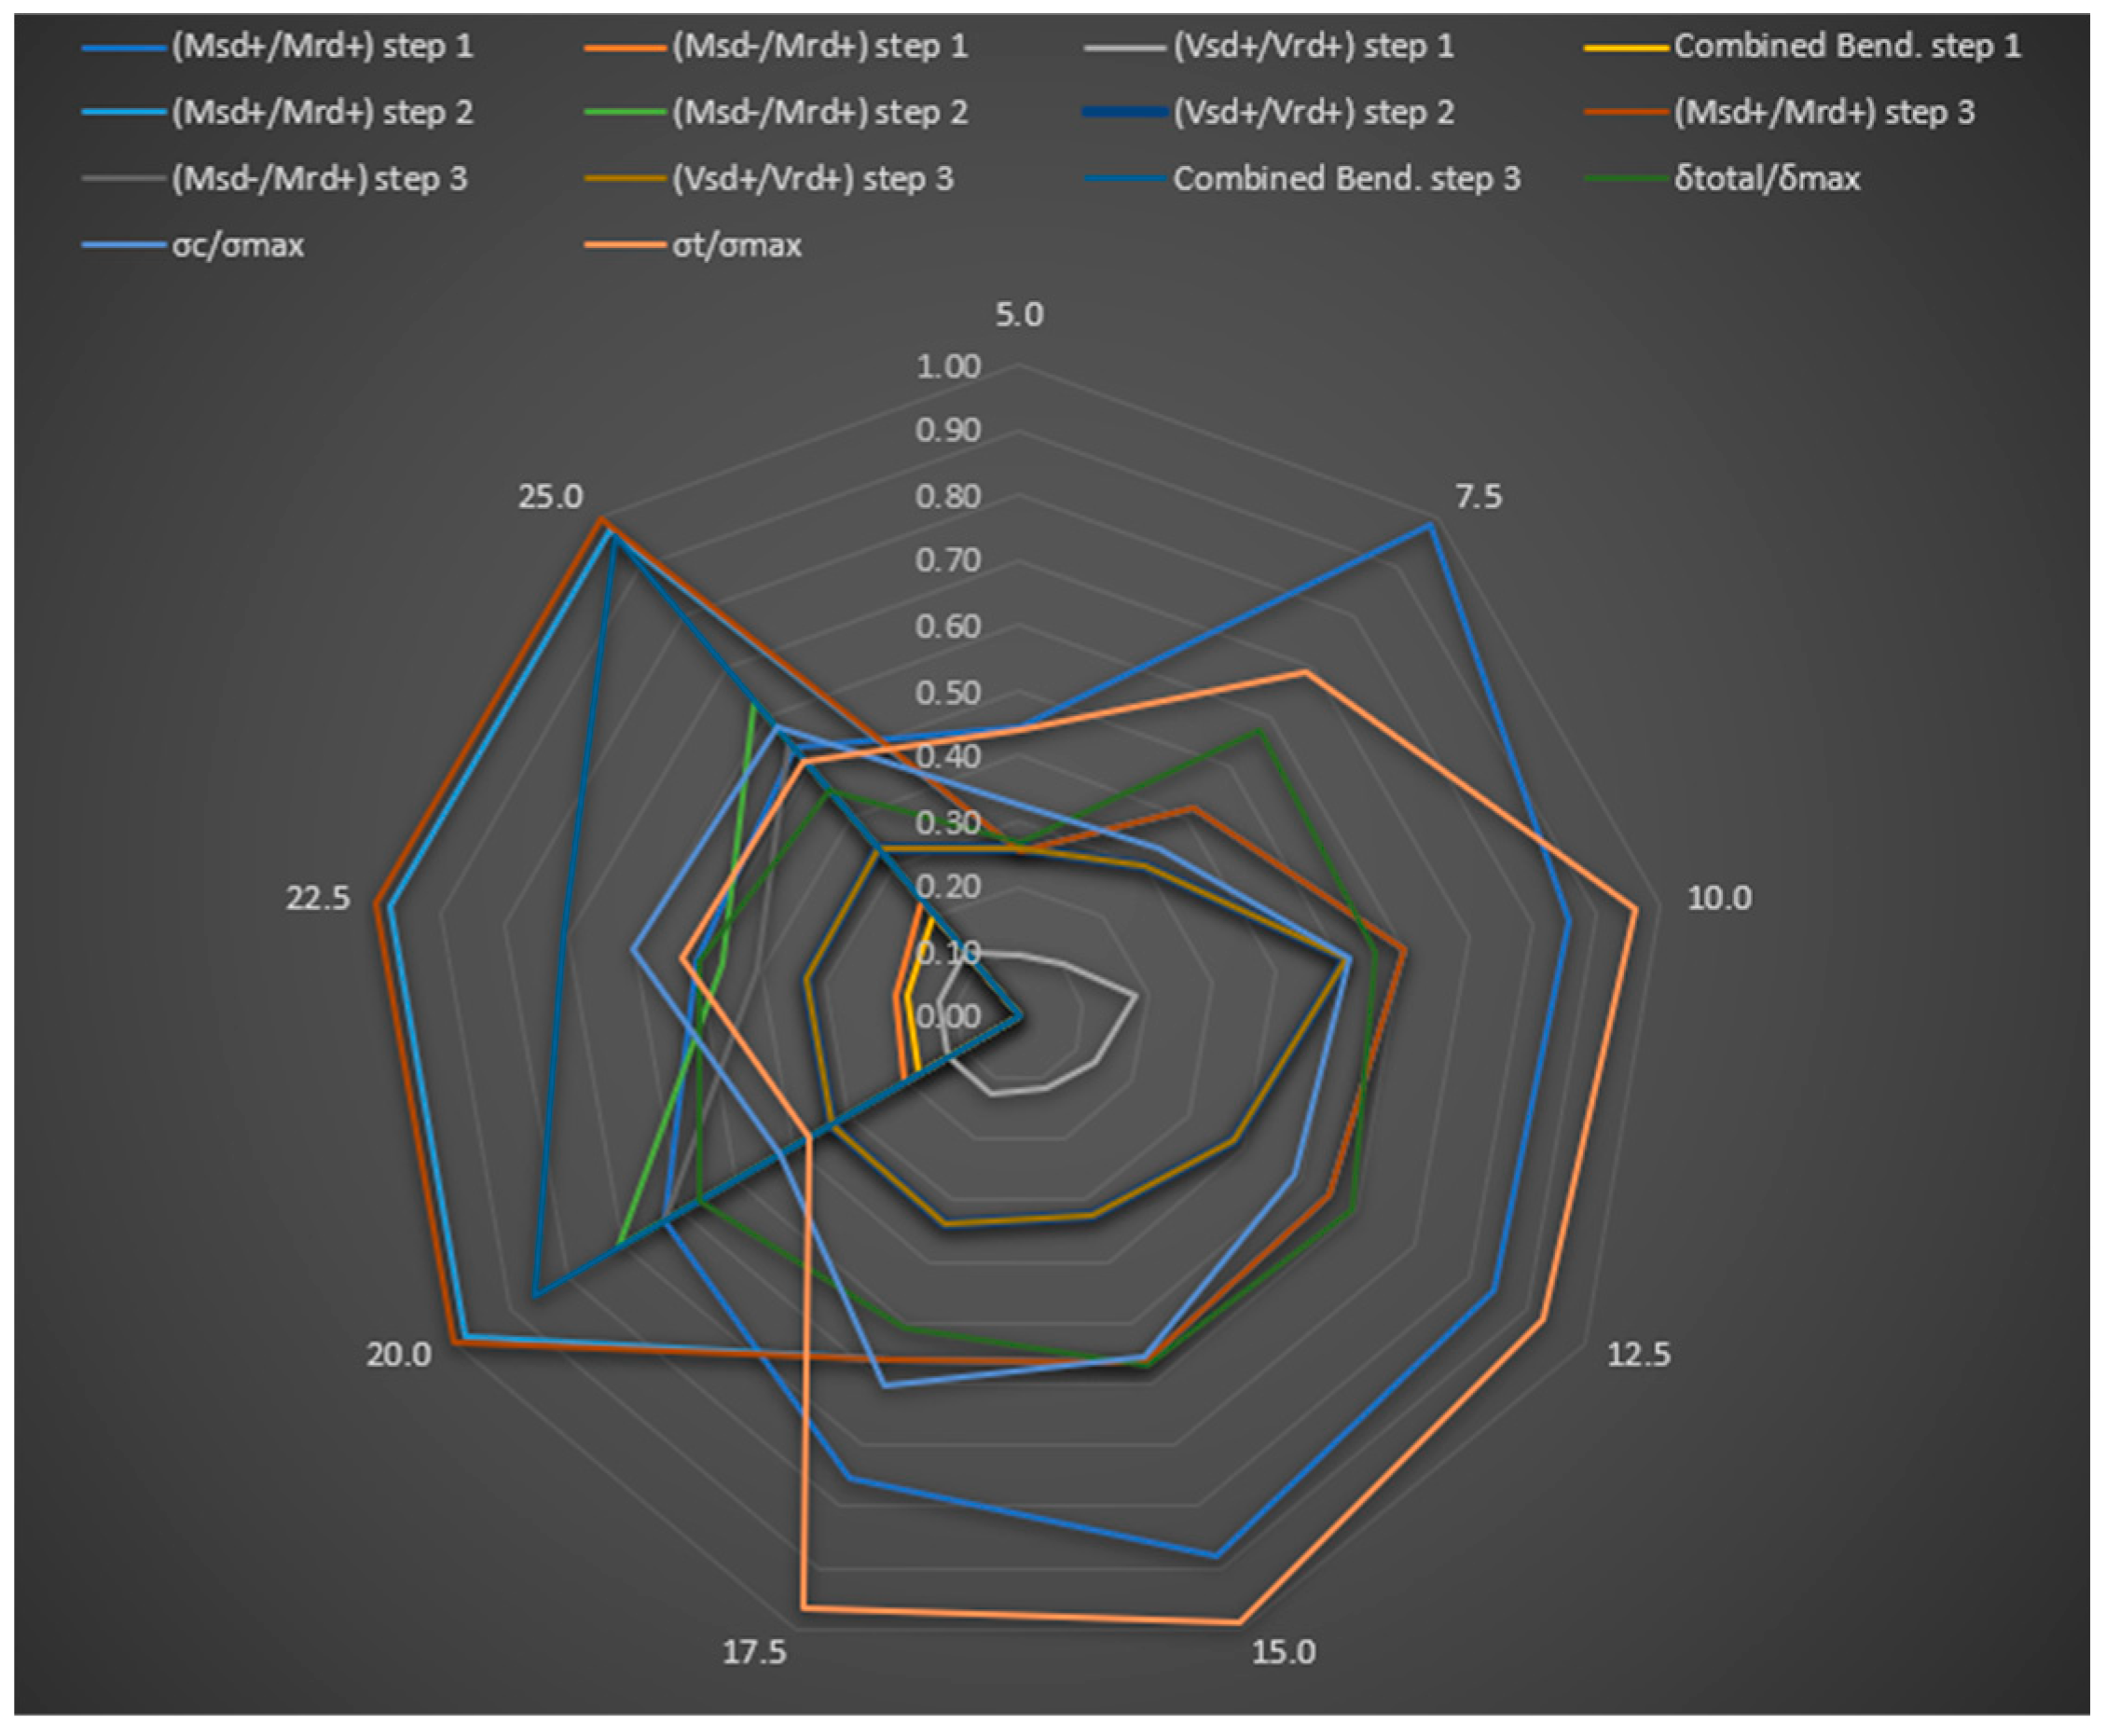
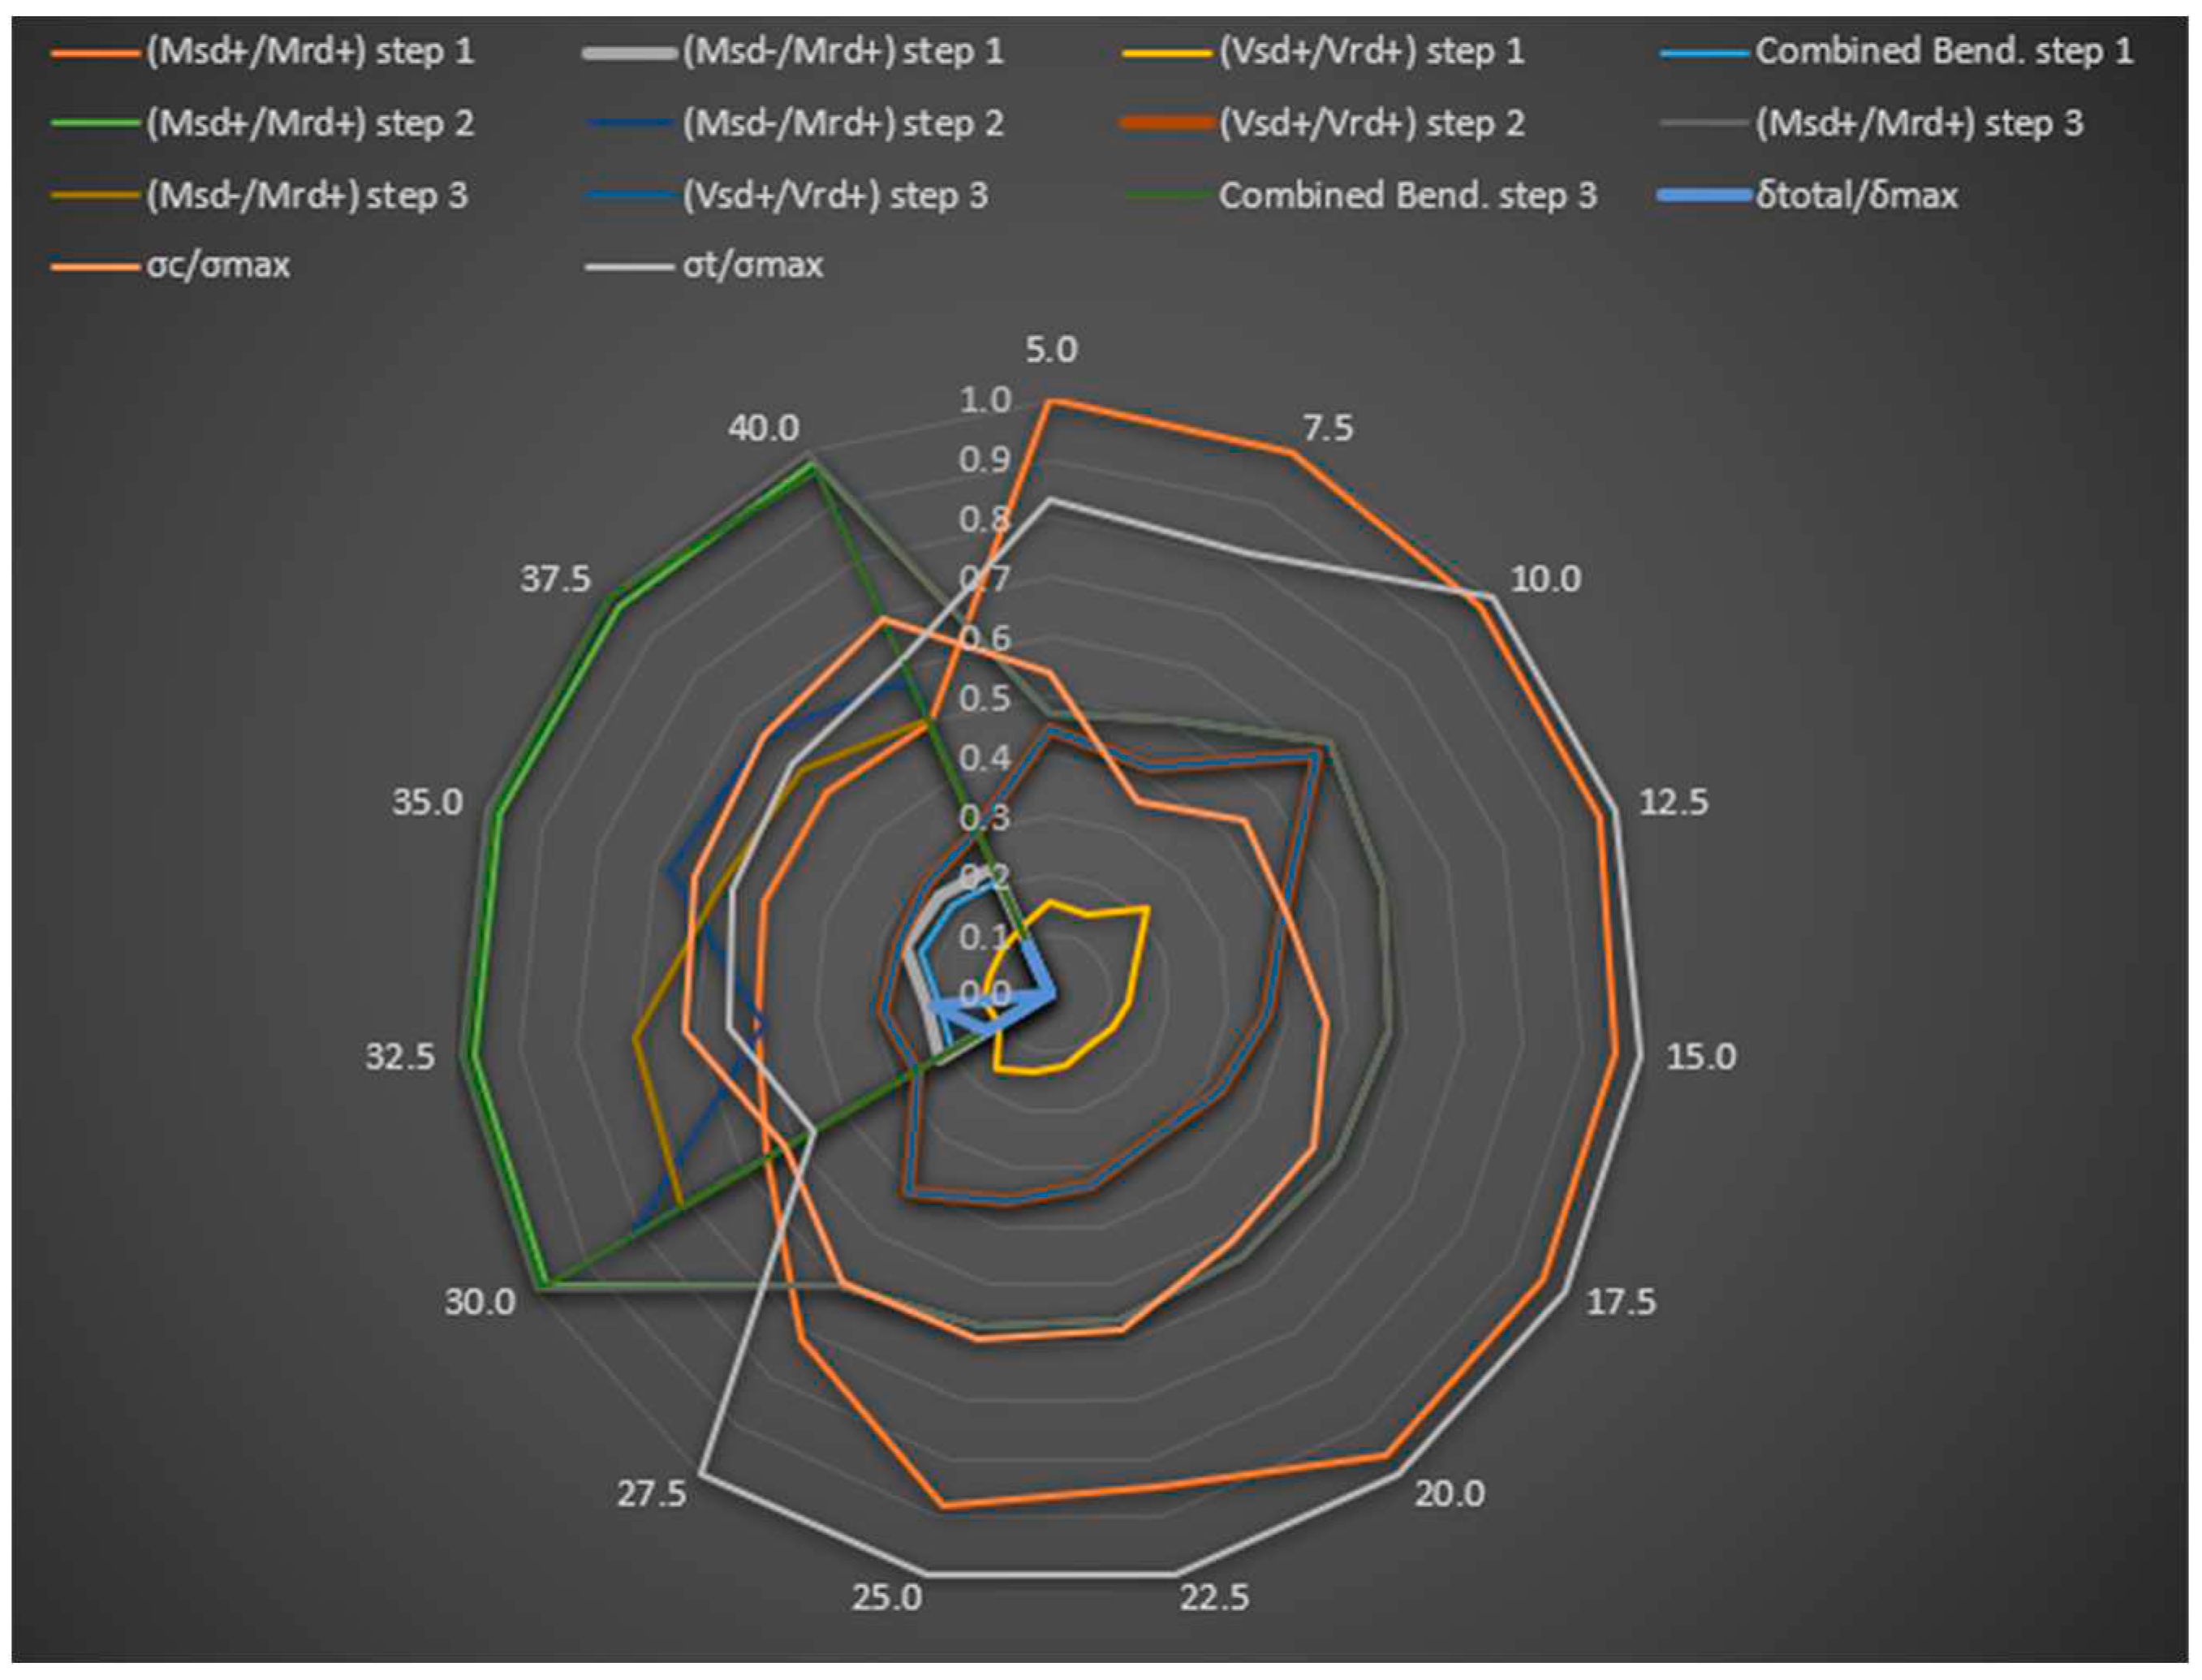
Figure 16 and
Figure 17 show an analysis of the factors that stood out for rolled and welded profiles, respectively, regarding the modes that governed the optimization problem.
According to
Figure 16, for spans ranging from 5 to 17.5 m, laminated profiles, show no need for tendons, the constraints that governed the problem referred to the maximum tensile stress generated in the profile, followed by the positive moment in the act of construction (assembly of the beam), in which only the profile resists the efforts of the structure due to the weight of the slab and construction loads. For cases that needed prestressing tendons, the constraints that governed the problem included the combined flexion at time t=∞ and the positive moment in the act of pretension t=0.
Similar to what occurred for laminated profiles, for spans ranging from 5 to 27.5 m, which showed no need for prestressing tendons, the constraints that governed the problem included the maximum tensile stress generated in the profile and the positive moment in the act of construction (assembly of the beam). For cases that needed prestressing tendons, the constraints that governed the problem referred to the combined flexion at time t=∞ and the positive moment in the act of pretension t=0. For both cases, note that the service limit state due to excessive sag was the constraint that least impacted the problem. This solution points to the importance of prestressing to control excessive deformations in structures.
4. Conclusion
This study aimed to propose an optimization of CO2 emissions from prestressed composite beams using doubly symmetrical laminated and welded profiles with external prestressing and straight tendons. For this, three examples were analyzed, the first of which to validate our algorithms, comparing our results to experimental ones. The second example optimized a prestressed composite beam compared it to the optimization of a prestressed metallic beam. The third example conducted a parametric analysis of the factors influencing the solution for the CO2 emission optimization problem.
Regarding the first validation example, results indicate that the methodology can reliably formulate the optimization problem considering the low difference in displacements and final moments in the structures when compared to experimental result.
Regarding the second example, in which a comparative analysis of the optimization was conducted following the proposed methodology with a prestressed steel beam, results were more than satisfactory. In this analysis, the best solution was found using GA and an unshored structure, obtaining a 63.1% reduction in CO2 emissions of the steel profile and a 57.2% reduction in total CO2 emissions. We also found a 16.7% reduction in its sag, 56.6% in its maximum compressive stress, and 51.8% in its tensile stress, increasing the safety of the structure. In this example the constraints that governed optimization referred to positive moments, bending, and combined bending in step 3.
With the conducted parametric analysis in the third example, we concluded that PSO generated better results than GA. GA found the best solutions for laminated spam profiles up to 17.5m while PSO found the best solutions for laminated profiles up to 25m. For welded profiles, solutions without prestressing tendons were used for spans up to 27.5 m.
Another observed point was that welded profiles generated the best results. Even with the use of welding in the manufacturing process, welded profiles generated lower emissions than laminated ones.
Regarding the final solution for the optimization problem, we observed that the thickness of the slab was the same for all examples. However, the compressive strength of the concrete increased from the span of 17.5 m for laminated profiles and 20 m for welded profiles, a positive contribution to the final solution as it decreased emissions. Thus, we found that the pre-dimensioning of a prestressed composite beam can adopt a L/h ratio between 30 and 35.
Steel profiles were the main responsible for emitting CO2. For laminated profiles, whose total CO2 emission value revolved around 50% for spans ranging from 5 to 10 m. For larger spans, this emission reaches 60%. Emissions related to the welding process had very little influence on the final solution and welded profiles showed better solutions than laminated ones. Concrete showed 29% of the total CO2 emission in beams with spans above 20 m, whereas the CO2 emission of tendons revolved around 5%. For 22.5- and 25-m spans, the emissions related to prestressing tendons revolved around 10% and 20% respectively.
On the other hand, welded profiles showed similar emission values, differing in the increase in weld emissions, around 1% for beams with up to 10-m spans and reaching a maximum value of 3.3% for 30-, 35-, and 37.5-m spans. Emissions from prestressing tendons was around 5.5% for a 30-m span and 7.4% for a 37.5-m one. In the absence of the need for prestressing tendons, maximum traction generated in the profile and the positive moment in the act of construction were the modes governing the third example. For cases that needed prestressing tendons, the constraints that governed included flexion combined with t=∞ and positive moment during prestressing.
Therefore, we suggest that our formulation to optimize prestressed composite steel-concrete beams proved to be reliable due to the satisfactory results in our analyses.
References
- Lin, W.; Yoda, T.; Taniguchi, N. Fatigue tests on straight steel-concrete composite beams subjected to hogging moment. Journal of Constructional Steel Research. v.80, 42-56, 2013. [CrossRef]
- Yu-Hang, W.; Jian-Guo, N.; Jian-Jun, Li. Study on fatigue property of steel-concrete composite beams and studs. Journal of Constructional Steel Research. v.94, 1-10, 2014. [CrossRef]
- Xing, Y.; Han, Q.; Xu, J.; Guo, Q.; Wang, Y. Experimental and numerical study on static behavior of elastic concrete-steel composite beams. Journal of Constructional Steel Research. v. 123, 79-92, 2016. [CrossRef]
- Hassanin, A. I.; Fawzy, H. M.; Elsheikh, A. I. Fatigue loading characteristic for the composite steel-concrete beams. Frattura ed Integrità Strutturale. v.55, 110-118, 2021. [CrossRef]
- Ayyub, B. M.; Sohn, Y. G.; Saadatmanesh, H. Prestressed composite girders under positive moment. Journal of Structural Engineering. New York, v.116, n. 11, p. 2931-2951,1990. [CrossRef]
- Intergovernmental Panel on Climate Change, Contribution of Working Group II to the Sixth Assessment Report of the Intergovernmental Panel on Climate Change. Climate Change 2022: Impacts, Adaptation, and Vulnerability, Cambridge University Press.
- Intergovernmental Panel on Climate Change, Contribution of working groups I, II and III to the fourth assessment report on intergovernmental panel on climate change. Climate change 2007: Synthesis report, Geneva, Switzerland.
- UN Environment and International Energy Agency (2021): Towards a zero-emission, efficient, and resilient buildings and construction sector. Global Status Report, 2021.
- Arpini, P. A. T.; Loureiro, M. C.; Breda, B. D.; Calenzani, A. F.; Alves, E. C. Optimum design of a composite floor system considering environmental and economic impacts. IBRACON Structures and Materials Jounal (Revista IBRACON de Estruturas e Materiais). v. 15, no. 3, e15302, 2022. [CrossRef]
- Santoro, J. F.; Kripka, M. Minimizing environmental impact from optimized sizing of reinforced concrete elements. Computers and concrete. v.25, n.2, 2020.
- Tormen, A.F.; Pravia, Z.M.C.; Ramires, F.B., Kripka, M. “Optimization of steel concrete composite beams considering cost and environmental impact”. Steel and Composite Structures. 34(3), 409-421. 2020. [CrossRef]
- Khasreen, M. M.; Banfill, P. F. G.; Menzies, G. F. Life-cycle assessment and the environmental impact of buildings: A review. Sustainability, vol. 1, no. 3, pp. 674–701, 2009. [CrossRef]
- Paya-Zaforteza, V.; Yepes, A. Hospitaler and F. González-Vidosa, CO2-optimization of reinforced concrete frames by simulated annealing. Engineering Structures, vol. 31, no. 7, pp. 1501–1508, 2009. [CrossRef]
- García Segura, T.; Yepes, V. Multiobjective optimization of post-tensioned concrete box-girder road bridges considering cost, CO2 emissions, and safety. Engineering Structures: the final public, pp. 325–336, 2016. [CrossRef]
- Holland, J. Adaptation in Natural and Artificial Systems. University of Michigan Press. 1975.
- Kennedy, J.; Eberhart, R. Particle swarm optimization. Proceedings of ICNN’95 - International Conference on Neural Networks. Anais...IEEE, 1995.
- Netto, P. M.; Calenzani, A. F. G.; Alves, E. C. Optimum design of prestressed steel beams via genetic algorithm. REM – Internationl Engineering Journal. Ouro Preto. v.76, 2023. [CrossRef]
- Breda, B. D.; Pietralonga, T. C.; Alves, E. C. Optimization of the structural system with composite beam and composite slab using Genetic Algorithm. REVISTA IBRACON DE ESTRUTURAS E MATERIAIS, v. 13, p. 01-14, 2020. [CrossRef]
- Erdal, F.; Doan, E.; Saka, M. P. Optimum design of cellular beams using harmony search and particle swarm optimizers. J. Constr. Steel Res., vol. 67, no. 2, pp. 237–247, 2011. [CrossRef]
- Senouci, A. B.; Al-Ansari, M. S. Cost optimization of composite beams using genetic algorithms. Adv. Eng. Softw., vol. 40, no. 11, pp. 1112–1118, 2009. [CrossRef]
- Govindaraj, V.; Ramasamy, J. V. Optimum detailed design of reinforced concrete continuous beams using Genetic Algorithms. Computer and Structures, vol. 84, no. 1–2, pp. 34–48, 2005. [CrossRef]
- Arpini, P. A. T.; Alves, E. C. Optimization of CO2 Emission of the Composite Floor System via Metaheuristics Algorithm. Journal of Engineering Science and Technology Review, v. 15, p. 1-14, 2022. [CrossRef]
- Poitras, G. L.; Lefrançois, G.; Cormier, G. Optimization of steel floor systems using particle swarm optimization. Journal of Constructional Steel Research, v. 67, n. 8, p. 1225-1231, 2011. [CrossRef]
- Catálogo Perfis Estruturais Gerdau, informações técnicas. Gerdau, 2023.
- Catálogo Protende Sistemas e Métodos. Protende, 2013.
- Sproesser, G.; Chang, Y.J.; Pittner, A.; Finkbeine, R.M.; Rethmeier, M. Life Cycle Assessment of welding technologies for thick metal plate welds. Journal of Cleaner Production, v.108, part A, p.46-53, 2015. [CrossRef]
- World Steel Assossiation, 2021.
- ASSOCIAÇÃO BRASILEIRA DE NORMAS TÉCNICAS. NBR 8800: Projeto de estrutura de aço e de estrutura mista de aço e concreto de edifícios. Rio de Janeiro, 2008.
- ASSOCIAÇÃO BRASILEIRA DE NORMAS TÉCNICAS. NBR 6118: Projeto de estruturas de concreto - Procedimento. Rio de Janeiro, 2014.
- MATLAB®. Guia do usuário R2016a. The Math Works Inc, 2016.
- Barbosa, H.; Lemonge, A.C. An adaptive penalty method genetic algorithms in constrained optimization problems. Frontiers in Evolutionary Robotics. 2008.
- ASSOCIAÇÃO BRASILEIRA DE NORMAS TÉCNICAS. NBR 12655: Concreto de cimento Portland — Preparo, controle, recebimento e aceitação — Procedimento. Rio de Janeiro, 2015.
|
Disclaimer/Publisher’s Note: The statements, opinions and data contained in all publications are solely those of the individual author(s) and contributor(s) and not of MDPI and/or the editor(s). MDPI and/or the editor(s) disclaim responsibility for any injury to people or property resulting from any ideas, methods, instructions or products referred to in the content. |
© 2023 by the authors. Licensee MDPI, Basel, Switzerland. This article is an open access article distributed under the terms and conditions of the Creative Commons Attribution (CC BY) license (http://creativecommons.org/licenses/by/4.0/).
