1. Introduction
The application of metal additive manufacturing in various fields requires new approaches to quality assurance. With a view on fatigue performance, measurement of the surfaces and characterization of surface texture are of interest.
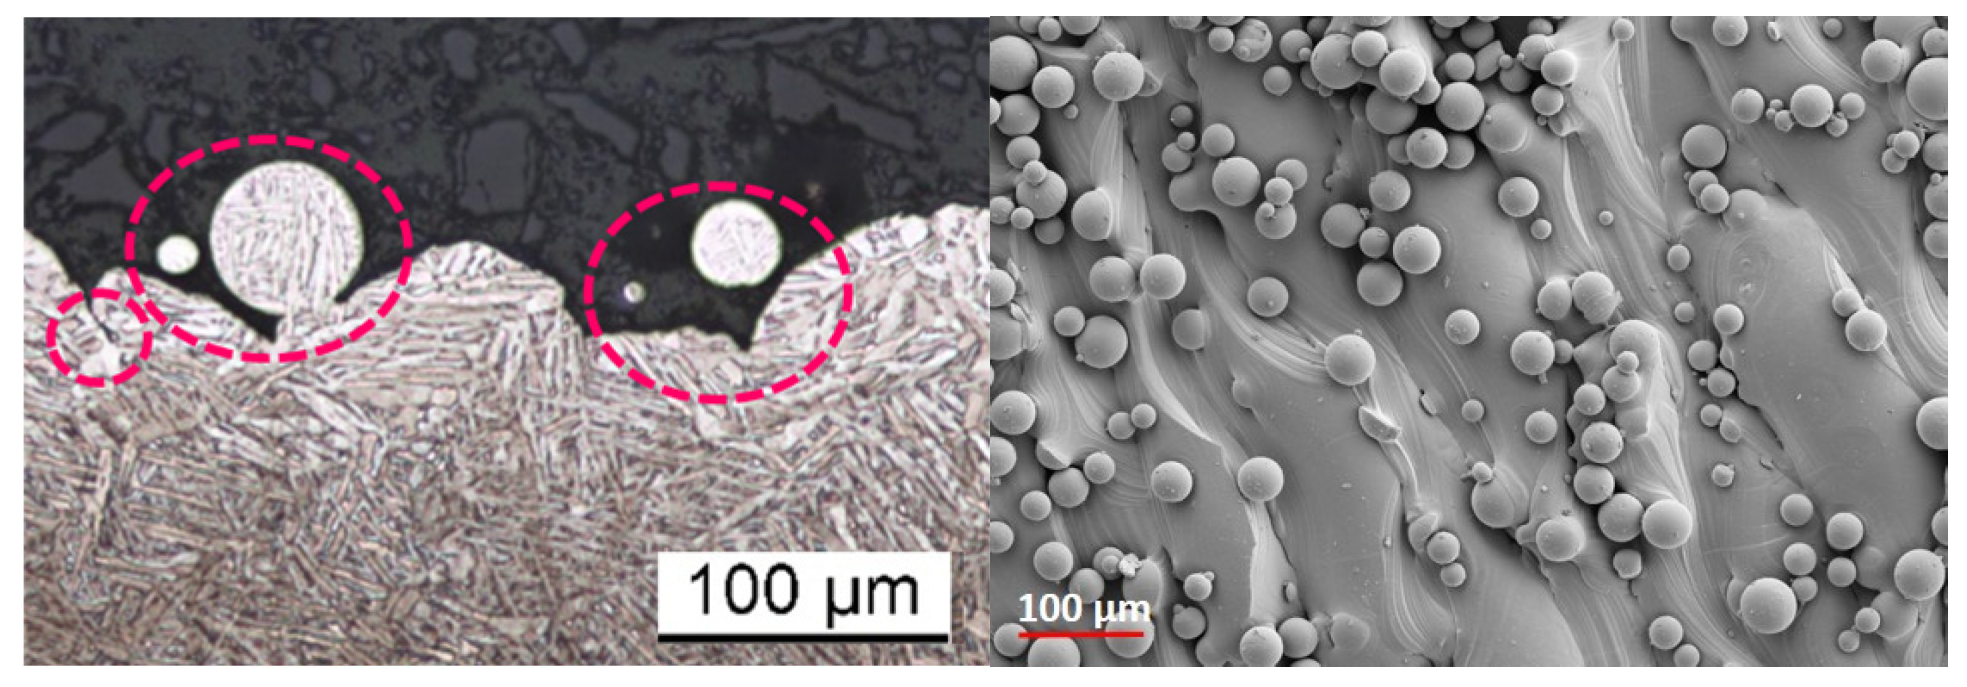
Surfaces from laser powder bed fusion (LPBF) typically exhibit agglomerations of attached powder particles (
Figure 1) of different size and shape are typical for these surfaces and this special nature imposes new challenges for measurement systems and their application.
The stylus method is still most commonly applied in industry and has the advantages of easy application and full standardization. It is, however, a contact method, meaning, that damage to the surface is possible. Looking at LPBF, the stylus tip may get stuck in particle agglomerations during measurement due to resulting undercuts and high slopes (see
Figure 1).
In recent years, optical measurement systems are gaining acceptance. They offer non-contact measurements with representative areal coverage and enable application of areal surface texture characterization.
Optical measurements and post-processing of data are not yet standardized. However, a number of methods are listed in ISO 25178-6 [
7] as suitable methods for characterization of areal surface texture and the standard is continuously updated.
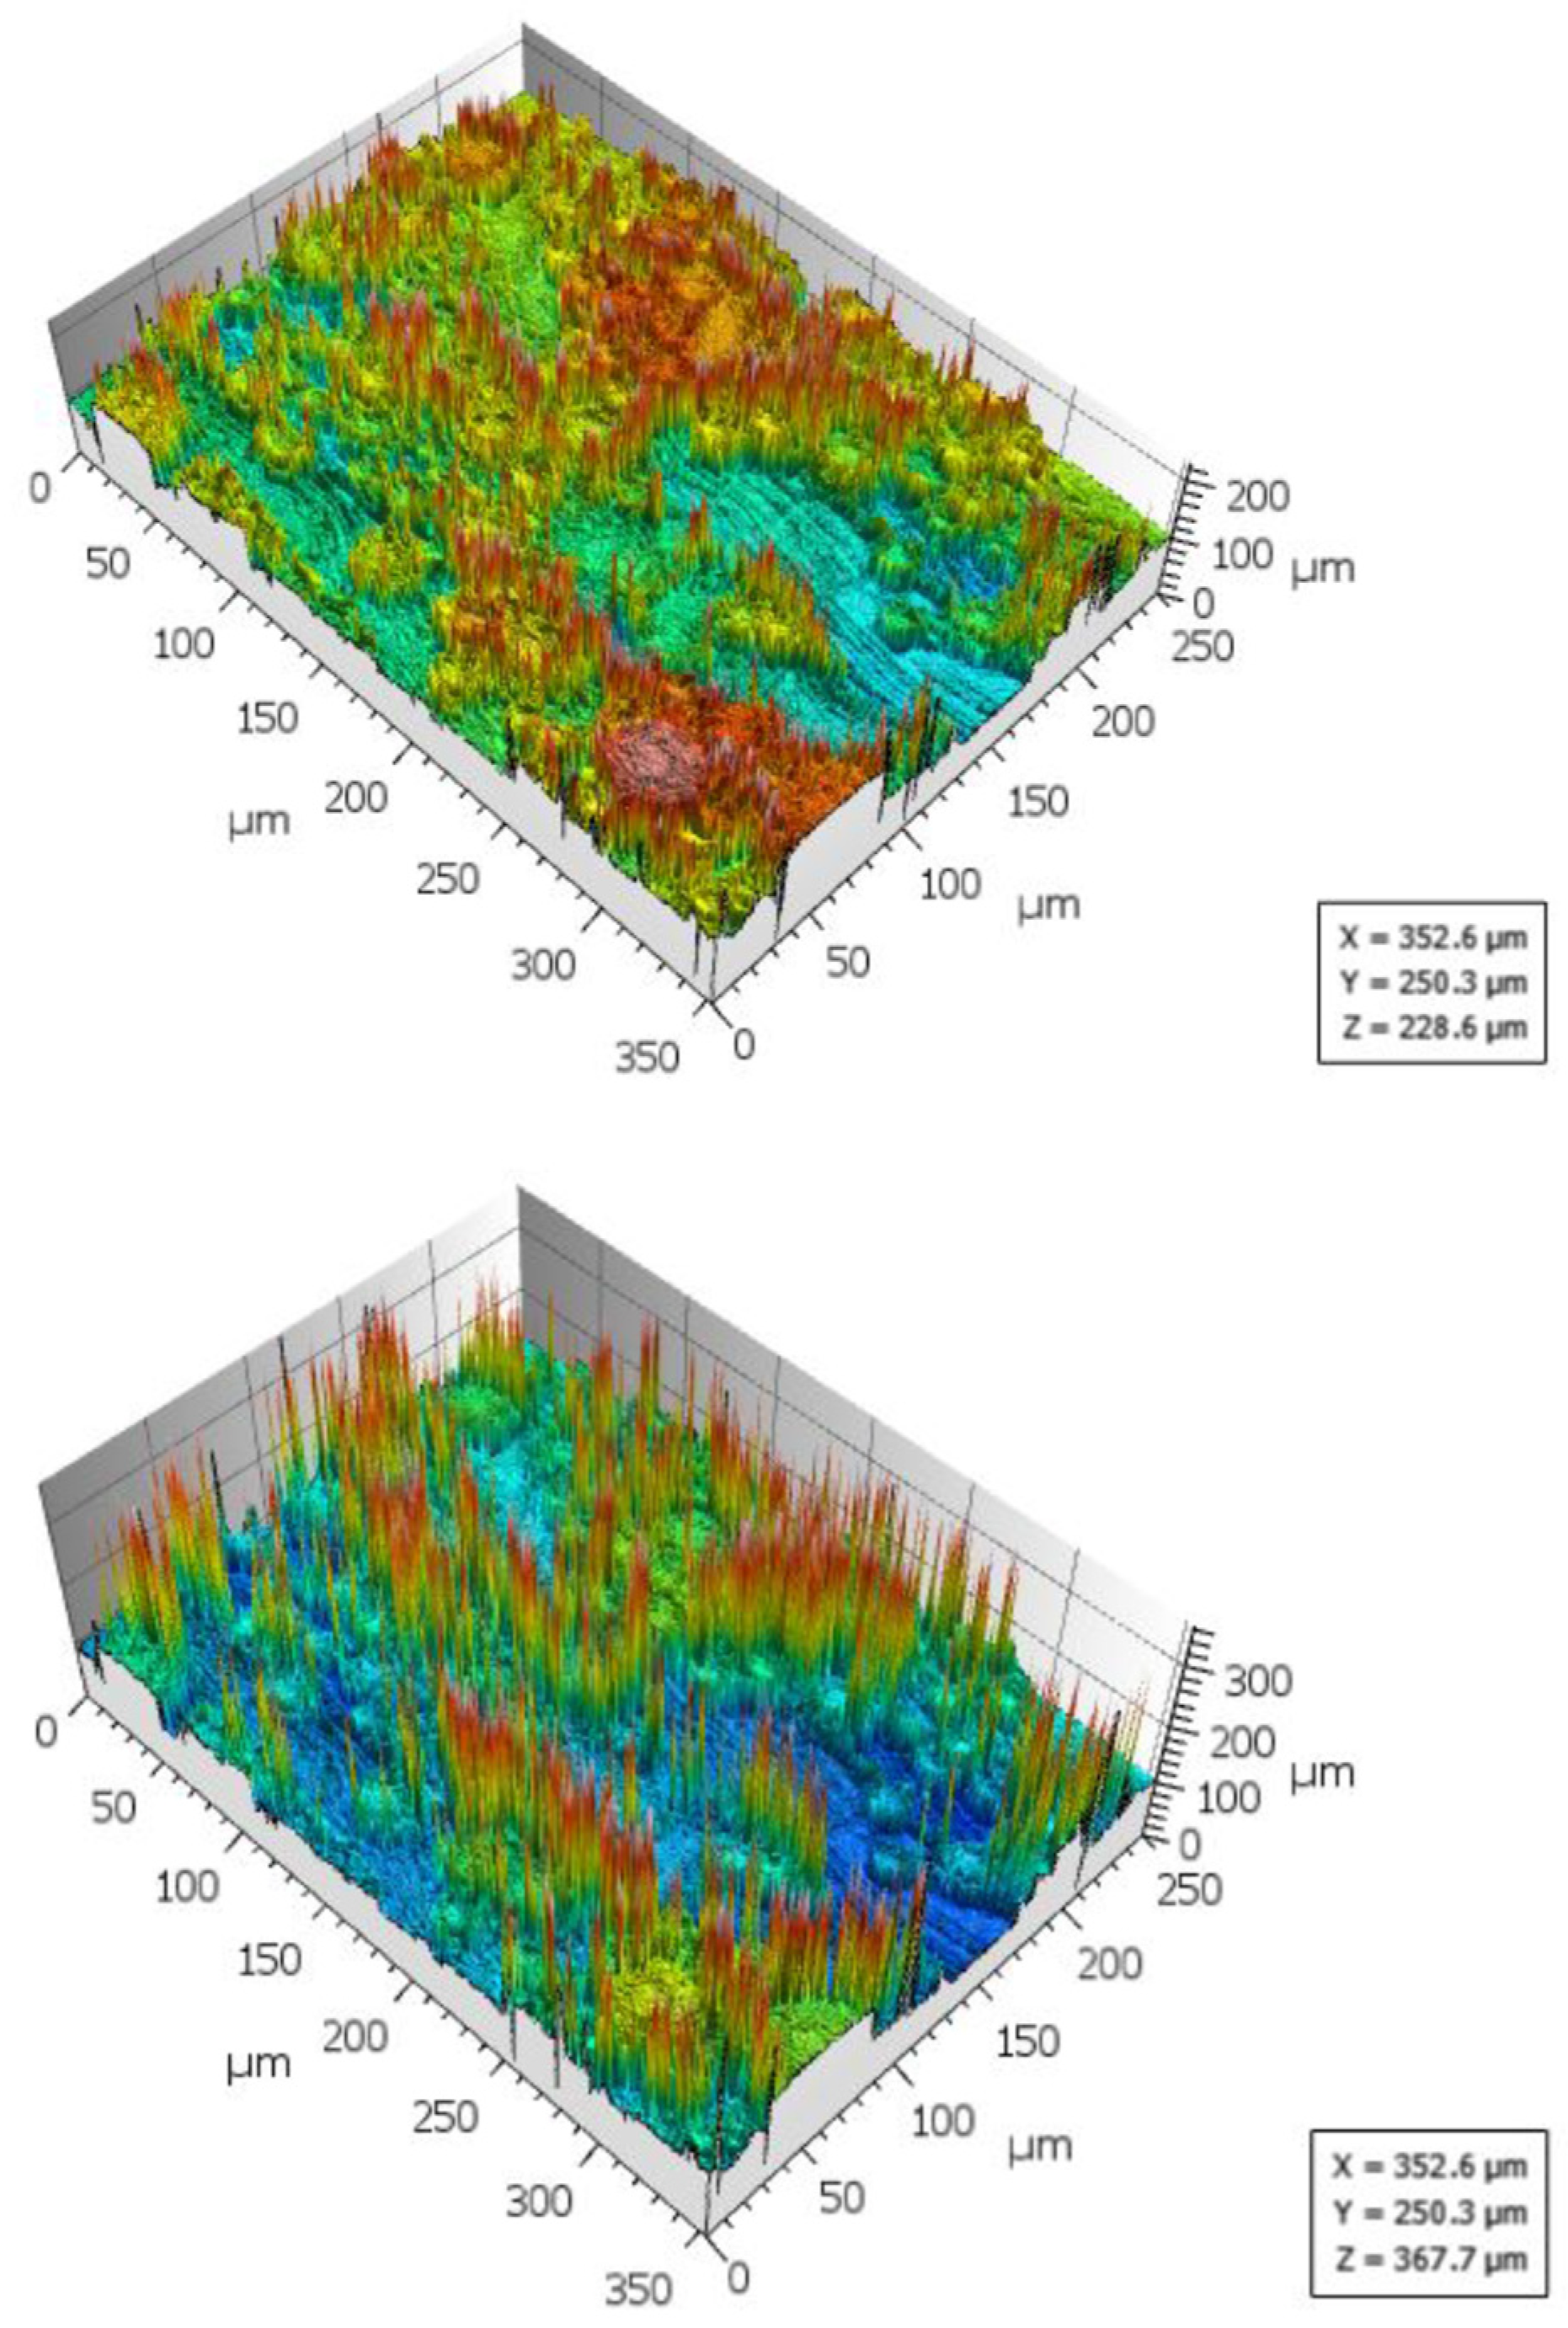
When specifically considering laser scanning confocal microscopy (LSCM), large spikes can be observed (see
Figure 3) in the data having a significant influence on typically used areal parameters such as Sa (arithmetic mean height), Sq (root mean square height) or Sz (maximum height), as these depend exclusively on height values and are hence very sensitive to local extremes.
Info on data acquisition and processing, such as outlier removal, reduction of measurement noise or levelling is often missing in studies on AM surface texture characterization [
11,
13]. However, where areal methods are applied, these information are crucial for reproducibility, since those processing steps can heavily influence the result.
This work aims on showing the impact of selected measurement and post-processing settings on surface texture parameters and stressing the importance of proper documentation of data acquisition and post-processing steps.
The effects of changing the z-range for the measurement, the outlier removal setting and interpolationg non-measured points (NMP) on Sq (root mean quare height), Sz (maximum height), Sk (core height) and Svk (reduced valley depth) are discussed.
2. Material and Methods
2.1. Laser Scanning Confocal Microscopy
In laser scanning confocal microscopy (LSCM), the surface is scanned by a laser in different focal planes, only exposing the area portion in focus. The 3D surface representation is created by layering data across the focal planes [
8]. The method is line-of-sight, meaning that re-entrant features, as shown in
Figure 1, cannot be detected.
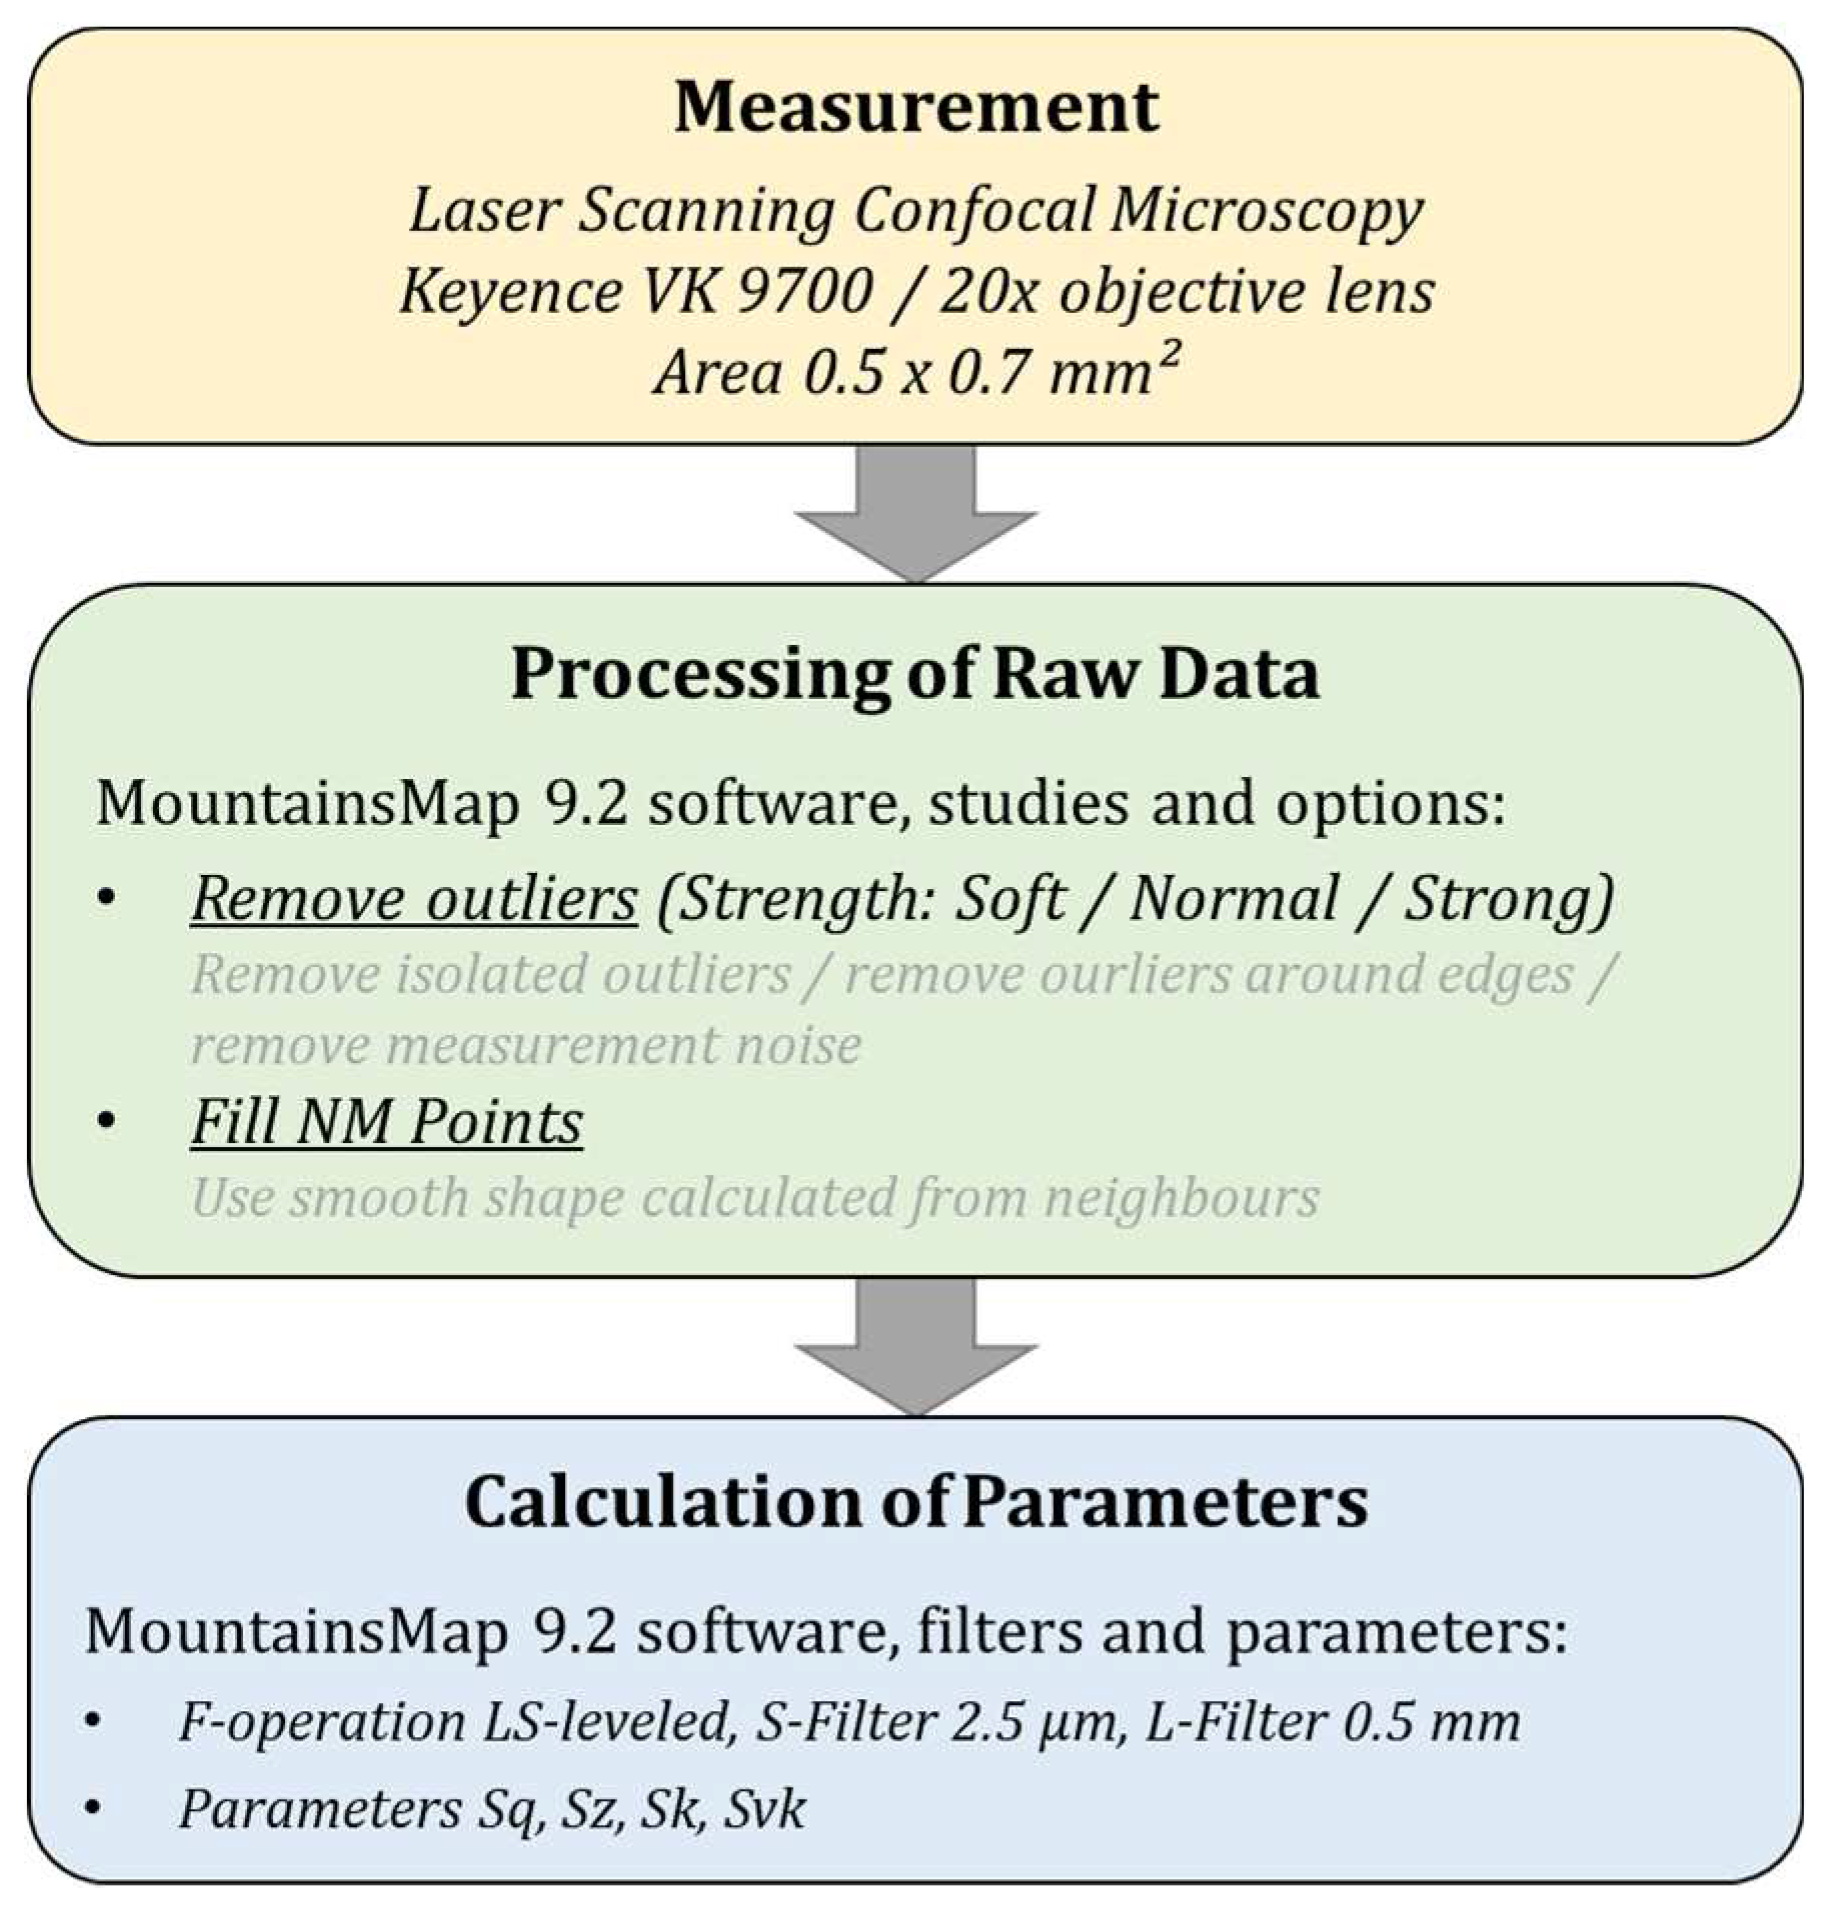
The used instrument in this study is the Keyence VK 9700 with the 20x magnification lens. Measurement uncertainty for the used instrument is not included in the presented results (overview in
Figure 2).
In ISO 25178-6 [
7], the method is listed as suitable method for areal surface texture characterization. Details on measurement and post-processing are not yet included in the standard.
Taking a look at literature, the method is mainly used for areal surface texture characterization and high resolution imaging [
2,
5,
10,
12].
2.2. Data Sets
The evaluated data sets originate from a Ti6Al4V sample in as-built condition from laser powder bed fusion (LPBF,
Figure 1). Typical powder particle agglomerations of different sizes are visible in scanning electron microscopy (SEM) images. Both data sets show an identical, randomly chosen location on the sample and the only difference in measurement settings is the predefined z-range the confocal microscope. One measurement was taken with a z-range of 229 µm, the second with 368 µm. The first value was selected based on the surface topography, the second value resulted from increasing the z-range in positive direction to study its effect.
When only looking at an individual image, it may be unclear why the effect of increasing z-range is interesting. However, when measuring larger surface portions requiring stitching of multiple images, the z-range for the used instrument (Keyence VK 9700, lens with 20x magnification) has to be set according to the highest height variation to be detected.
2.3. Surface Data Evaluation
The data evaluation was performed using MountainsMap® version 9.2. The raw data from confocal microscopy was imported and outlier removal ‘soft’, ‘normal’ and ‘strong’ was applied for the two evaluated data sets. The MountainsMap® outlier removal algorithm uses median filters (of variable size according to setting) to smooth isolated outliers and removes outliers around edges and converts them into non-measured points (for increased strength, more points are removed).
In order to quantify the influence of the chosen variations, the ISO 25178-2 parameters Sq (root mean square height), Sz (maximum total height) Sk (core height) and Svk (reduced valley depth) are compared amongst the post-processed data set versions. Sq and Sz are frequently applied in industrial environments while Sk and Svk are less common. The latter are calculated from the material ratio curve and were found to have potential for metal AM surface texture characterization in previous studies by the authors [
3,
4].
Prior to the parameter calculation a Gaussian S-filter of 2.5 µm and a Gaussian L-filter of 0.5 mm was applied to the processed surface data. The steps taken are summarized in
Figure 2.
3. Results and Discussion
Typical confocal microscopy raw data of LPBF surfaces show large spikes (see
Figure 3, also refer to [
11]), that occur around the edges of powder particles. Comparing the raw data to the microscopic images (i.e.
Figure 1) clearly shows these spikes are not physically present on the measured surfaces. The spikes are artefacts arising during data acquisition with the laser scanning confocal microscope.
A likely origin of the spikes are particle agglomerations, which are LPBF specific surface features. Confocal microscopy is a line-of-sight method and as-built LPBF surfaces show undercuts (see
Figure 1), which cannot be detected. On the boundaries of attached particles, the instrument detects two signals, one from the boundary and one from the surface below, leading to the display of a spike artefact.
Furthermore it can be observed, that the spherical shapes of the powder particles is not accurately depicted, which is a known phenomenon in confocal microscopy [
1,
12,
14]
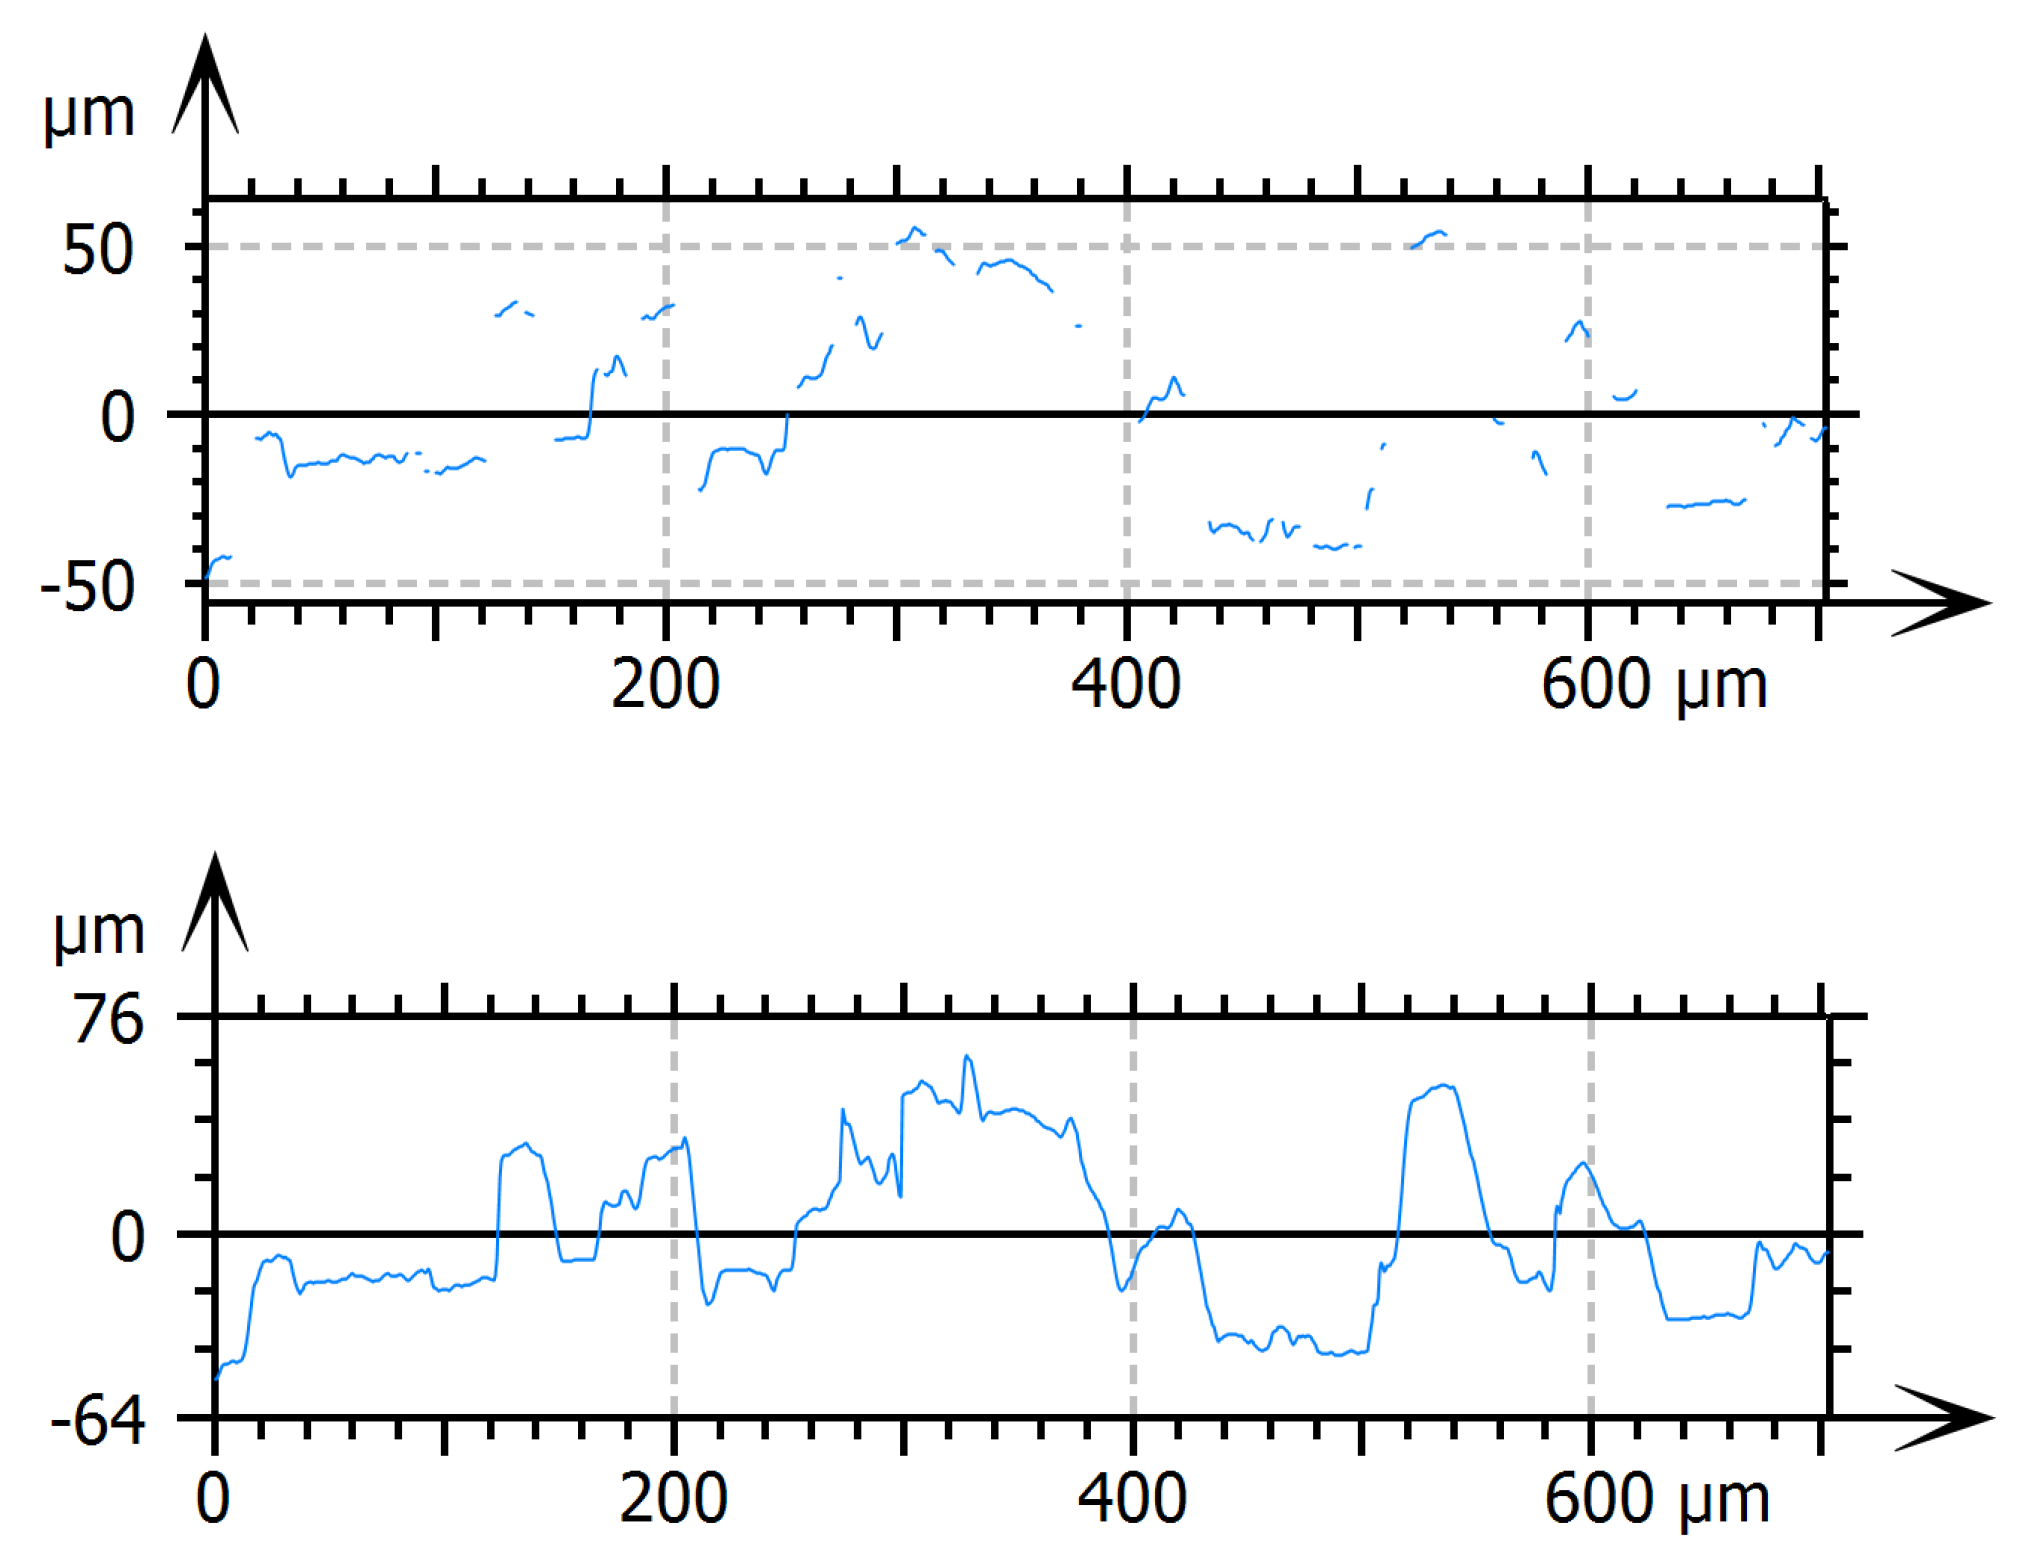
From previous measurement results it could be observed that the spikes have the size of the measured z-range.
Figure 3 shows measurements at identical location with variation of the pre-set z-range. The raw data illustration confirms the assumption that the size of the artefact does not depend on the size of surface features, but is mostly defined by the measurement setting.
The following main aspects were considered in the data evaluation:
- -
Effect of increasing the measured Δz
- -
Effect of outlier removal and fitting non-measured points
3.1. Raw Data with Different Δz
Looking at the chosen parameters, there is a significant difference between the Δz = 229 µm and Δz = 368 µm data sets. As expected, the largest deviation can be observed for the extreme value Sz (maximum total height), namely 40%. Note that due to filtering the data to separate roughness from waviness components (L-filter 0.5 mm), the value is smaller than the maximum measured z-range of the respective data sets.
Smaller but still significant is the difference of the root mean square height Sq, which amounts to 39%. This shows that Sq, being a parameter that is supposed to characterize the overall surface quality [
4], is very sensitive local extreme values, which are in this case caused by the measurement setting.
Considering the selected parameters from the material ratio curve, the difference is relatively low, namely 12% for the core height Sk and 4% for the reduced valley depth Svk and hence react less sensitively to the size of the spike artefacts.
Table 1 summarizes the above mentioned numerical values. When comparing the surface texture parameters for both data sets it is also notable, that while all other values increase with increasing Δz, Svk decreases slightly. This is possibly due to the spikes creating an increased number of data points, not only in the peak, but also in core portion of the profile, resulting in a slightly flatter main slope. Since the z-range in this case was only extended in positive direction (‘peak portion’), the effect on the valley parameter is small. For detailed information on the material ratio curve parameter calculation, please refer to [
4,
9].
Figure 3.
Spikes in confocal raw data of as-built Ti6Al4V. Top and bottom images show identical locations on the surface with different Δz setting.
Figure 3.
Spikes in confocal raw data of as-built Ti6Al4V. Top and bottom images show identical locations on the surface with different Δz setting.
These results clearly show the necessity of properly post-processing data from confocal microscopy (and other optical methods) in order to mitigate the effect of measurement artefacts.
Previous round-robin testing on best-practice measurement and characterization of surface texture with different labs has shown that some users are unfamiliar with how to choose post-processing settings for raw data from optical measurement, which supports the previous statement.
3.2. Outlier Removal and Non-measured Points
Depending on the chosen strength of the applied outlier removal, the non-measured points (NMP) amount to roughly 15% for the setting ‘soft’, 20% for ‘normal’ and 30% for ‘strong’ for both data sets.
In general, a trend of lower parameter values for stronger outlier removal can be observed (
Table 3). The strongest effect is on Sz, since with removing more spikes, more extreme values are eliminated.
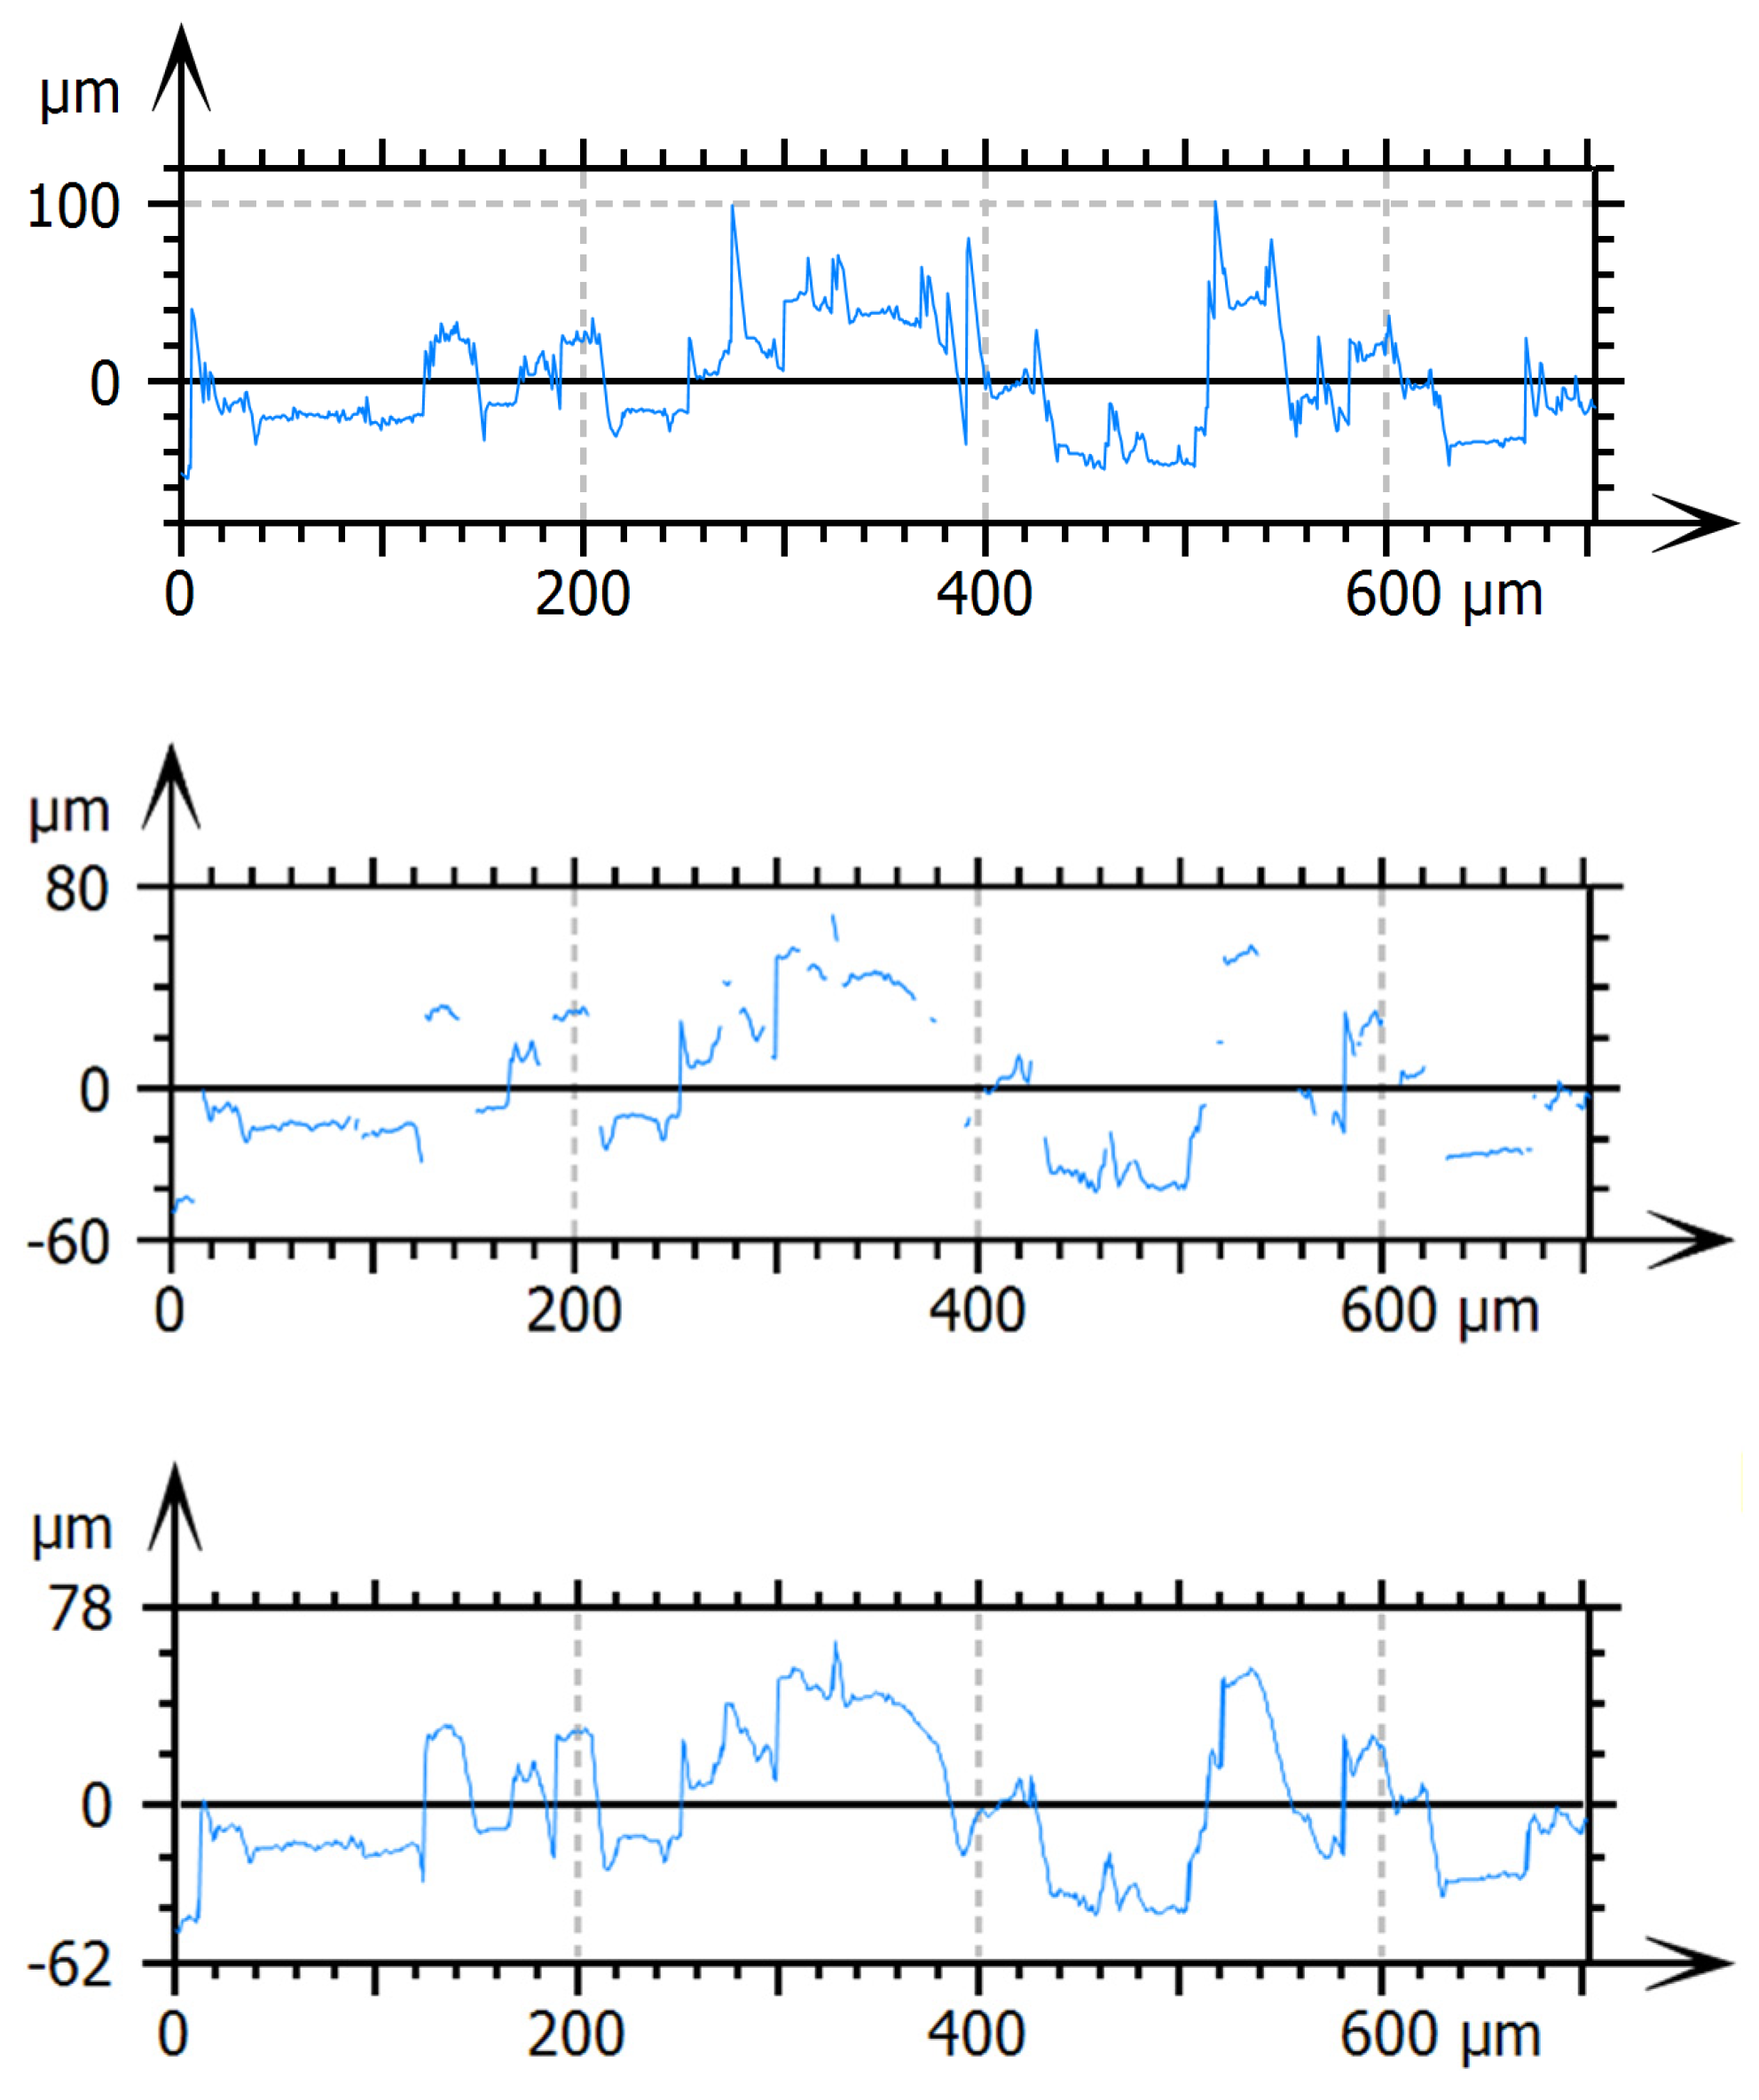
When removing a spike, it is usually eliminated starting from its root, which is why there are data points missing within the core part of the profile, as visible in
Figure 4 and
Figure 5, causing differences in Sk, Svk and Sq.
Table 2.
Non-measured points, dependence on outlier removal strength and Δz.
Table 2.
Non-measured points, dependence on outlier removal strength and Δz.
Data Set /
Outlier Removal
|
Δz = 229 µm |
Δz = 368 µm |
| Soft |
15.55% |
14.52% |
| Normal |
20.15% |
19.20% |
| Strong |
31.75% |
30.08% |
Table 3.
Resulting ISO 25178 parameters for variation of outlier removal strength and fitting non-measured points for Δz = 229 µm.
Table 3.
Resulting ISO 25178 parameters for variation of outlier removal strength and fitting non-measured points for Δz = 229 µm.
| |
Soft |
Normal |
Strong |
| Sq (NMP) / µm |
22.85 |
22.81 |
22.54 |
| Sq (NMP filled) / µm |
22.63 |
22.44 |
21.88 |
| Deviation |
1% |
2% |
3% |
| Sz (NMP) / µm |
186.40 |
184.00 |
170.80 |
| Sz (NMP filled) / µm |
186.40 |
184.00 |
170.80 |
| Deviation |
0% |
0% |
0% |
| Sk (NMP) / µm |
55.26 |
55.15 |
54.36 |
| Sk (NMP filled) / µm |
54.58 |
54.03 |
52.60 |
| Deviation |
1% |
2% |
3% |
| Svk (NMP) / µm |
13.42 |
13.05 |
11.86 |
| Svk (NMP filled) / µm |
14.18 |
13.98 |
13.16 |
| Deviation |
-6% |
-7% |
-11% |
3.3. Interpolation of Non-measured Points
Filling the NMP with interpolated values causes a variation of parameter values of up to 11% for Δz = 229 µm and 12% (
Table 3) for Δz = 368 µm. The parameter Sz is not affected by the interpolation.
This issue can be illustrated by looking at an extracted profile with nearly 18% NMP and interpolated points in
Figure 4. After the outlier removal step, data is mainly missing in the core portion (close to the center line) of the profile. The material ratio curve is hence gaining core material when interpolating NMP, resulting in flattening the curve (more data points per height level), which causes a slight decrease of Sk and a slight increase of Svk.
Figure 4 and
Figure 5 clearly show the difference between ‘normal’ and ‘strong’ outlier removal. The interpolated curve in
Figure 4 still show some sharp edges while
Figure 5 is relatively smooth.
4. Conclusions
The presented data show that changing measurement settings and use of different post-processing options can cause a large variation on surface texture parameters (up to 40%). Many publications do not state the applied steps. In addition, round-robin testing, where metal additive surface measurement and characterization were compared, showed that there are users who are unfamiliar with post-processing of raw data from optical measurements. In order to ensure reproducibility of results, specification, documentation and standardization are essential.
Outlier removal and interpolation of non-measured points may have a significant effect on the resulting parameters. Outlier removal settings have the strongest impact on the extreme value Sz. Filling in NMP does not alter Sz but does have an influence on the material ratio curve parameters Sk and Svk and the root mean square Sq due to the addition of data points in the core portion.
When choosing the appropriate setting for outlier removal for one’s confocal microscopy data, it is recommended to take a look at the 3D view to check the spikes’ size and quantity. The authors will mostly use the ‘soft’ or ‘normal’ setting in MountainsMap 9.2, to keep as much of the measured data as possible while getting rid of the artefacts.
The NMP interpolation, although adding points that were not measured may distort the results, is considered a valid approximation, since the measured surface is continuous.
Due to the large number of settings to be varied, the strong impact of their modification and lack of standardization, the application of optical measurement systems requires a high level of expertise.
A major advantage of confocal measurements and other optical systems is the areal coverage, allowing for three dimensional data acquisition (with the limitation to line-of-sight) rather than just a single profile as attained from the stylus method. This does not only accommodate a better representation of the surface from a statistical point of view, but also enables the characterization of process-specific surface features, such as powder particle agglomerations in LPBF.
Acknowledgments
Part of this work was funded by the Ministry of Economics and Energy (BMWi) of the Federal Republic of Germany within the APOLLO project (sub-project ‘PROMOTIVE’, funding code 20W1701B, duration 01.01.2018 to 30.06.2021).
Conflict of Interest
Authors state no conflict of interest.
References
- Aguilar, J. F.; Lera, M.; Sheppard, C. J. (2000). Imaging of spheres and surface profiling by confocal microscopy. Applied Optics, 39(25), 4621-4628. [CrossRef]
- Bagehorn, S.; Mertens, T.; Greitemeier, D.; Carton, L.; Schoberth, A. (2015). Surface finishing of additive manufactured Ti-6Al-4V - A comparison of electrochemical and mechanical treatments. 6th European Conference for Aerospace Sciences.
- Buchenau, T., Amkreutz, M., Brüning, H., & Norda, M. (2019). Evaluation of Alternative Parameters to Describe the Quality of Additively Manufactured Aluminium Alloy Surfaces. Additive Manufacturing Conference Turkey 2019.
- Buchenau, T., Amkreutz, M., & Brüning, H. (2021). Surface texture and high cycle fatigue of as-built metal additive AlSi7Mg0. 6. Journal of Additive Manufacturing Technologies, 1(2), 531-531.
- Grimm, T.; Wiora, G.; Witt, G. (2015). Characterization of typical surface effects in additive manufacturing with confocal microscopy. Surface Topography: Metrology and Properties, 3(1):014001. [CrossRef]
- ISO 25178-2:2022. Geometric Product Specifications (GPS) - Surface texture: areal - Part 2: Terms, definitions and surface texture parameters.
- ISO 25178-6:2010. Geometrical product specifications (GPS) - Surface texture: Areal - Part 6: Classification of methods for measuring surface texture.
- Leach, R. K. (Ed.). (2011). Optical Measurement of Surface Topography. [CrossRef]
- Leach, R. K. (Ed.). (2013). Characterisation of areal surface texture. Springer Science & Business Media.
- Safdar, A.; He, H.; Wei, L.-Y.; Snis, A.; de Paz, L. E. C. (2012). Effect of process parameters settings and thickness on surface roughness of EBM produced Ti-6Al-4V. Rapid Prototyping Journal. [CrossRef]
- Thompson, A.; Senin, N.; Giusca, C.; Leach, R. (2017). Topography of selectively laser melted surfaces: a comparison of different measurement methods. CIRP Annals, 66(1), 543-546. [CrossRef]
- Thompson, A. (2019). Surface texture measurement of metal additively manufactured parts by X-ray computed tomography. PhD Thesis. University of Nottingham.
- Townsend, A.; Senin, N.; Blunt, L.; Leach, R. K.; Taylor, J. S. (2016). Surface texture metrology for metal additive manufacturing: a review. In: Precision Engineering 46, S. 34–47. [CrossRef]
- Weise, W.; Zinin, P.; Wilson, T.; Briggs, A.; Boseck, S. (1996). Imaging of spheres with the confocal scanning optical microscope. Optics letters, 21(22), 1800-1802. [CrossRef]
|
Disclaimer/Publisher’s Note: The statements, opinions and data contained in all publications are solely those of the individual author(s) and contributor(s) and not of MDPI and/or the editor(s). MDPI and/or the editor(s) disclaim responsibility for any injury to people or property resulting from any ideas, methods, instructions or products referred to in the content. |
© 2023 by the authors. Licensee MDPI, Basel, Switzerland. This article is an open access article distributed under the terms and conditions of the Creative Commons Attribution (CC BY) license (http://creativecommons.org/licenses/by/4.0/).
