1. Introduction
Over the last two decades, additive manufacturing (AM) technologies evolved from rapid prototyping of porous structures to production of high-quality parts. AM enables design freedom, as well as reduction of material waste and cost [
1,
2]. However, when qualifying an AM part for load-bearing aerospace applications, surface texture is of particular interest with respect to fatigue performance [
1] and requires new approaches to quality assessment (QA).
In industrial QA, the generation of profile parameters such as
Ra (arithmetic mean deviation of the assessed profile) or
Rt (total height of profile), for data acquired using a contact stylus measurement system, is the status quo [
3]. Due to the low statistical relevance of individual profile measurements for the assessment of surface quality [
4] and the increasing application of optical measurement systems, their areal equivalent parameters,
Sa and
Sz, have gained relative acceptance in recent years. However,
Sa and
Sz are still based on height variation with respect to a mean plane, rather than representing the actual size of a topography element. The restriction to height variation leads to the same value of
Ra/
Sa representing surfaces with different surface features, different material ratios [
5] and different mechanical, adhesive and corrosive behaviours.
Areal measurements, as compared to profile measurements, offer a more representative depiction of surface topography and enable the extraction of characteristic surface features [
3,
4,
6]. Several feature parameters describing various geometric properties of hills and dales are included in the latest version of ISO 25178 [
7]. Beyond the consideration of hills and dales, process-related surface features can be evaluated. Frequently observed features in powder-based AM are particle agglomerations of different size. In recent years, extensive work has been done on developing methods for segmentation and feature detection and their application to AM surfaces [
8,
9,
10,
11,
12,
13,
14,
15].
In this work, we focus on the evaluation of surface properties related to powder particle agglomerations, such as size and quantity, as well as the area portion of the surface covered by attached particles and their relation to the particle size distribution of the powder used in the process.
Furthermore, selected ISO 25178 [
7] feature parameters derived from hill and dale properties after watershed segmentation are generated.
The surface topography is measured by focus variation (FV) microscopy, which is an optical non-contact method based on stacking images from different focal planes of the same location in
z-direction. An advantage of this technology is its robustness to variation of optical surface properties such as reflectivity [
16,
17].
Surfaces of fatigue specimens in as-built condition from a laser-beam powder bed fusion (PBF-LB) process made of AlSi7Mg0.6 material are examined in this study.
2. Materials and Methods
2.1. Samples
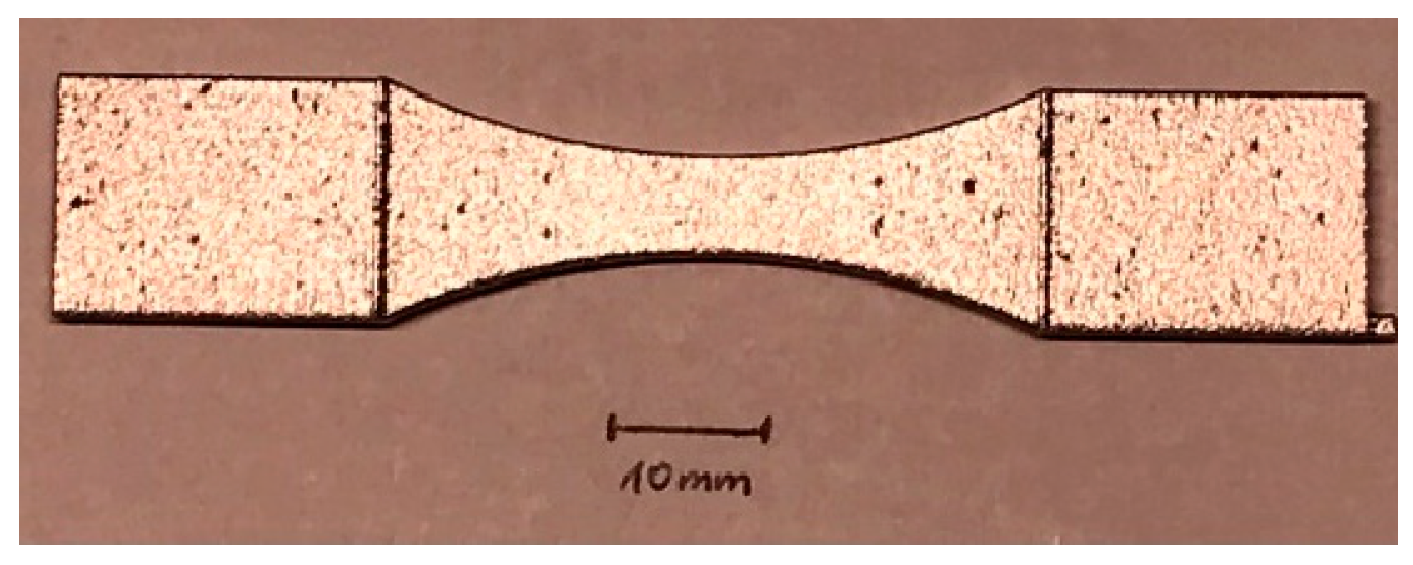
The evaluated samples are fatigue specimens according to ASTM 466–15 (total height 80 mm, smallest cross section width 6 mm, and thickness 3 mm, shown in
Figure 1) produced in a laser-based powder bed fusion (PBF-LB) process from AlSi7Mg0.6 material, manufactured on a Trumpf TruePrint 1000 system using the parameter settings specified in
Table 1.
Bulk and contour parameter sets were previously optimised for density and surface texture, respectively [
18]. The optimisation resulted in a layer thickness of 30 µm and a hatch spacing of 0.12 mm for both, bulk and contour. The specimen bulk was produced with a laser power of 166 W at a scan speed of 1000 mm/s. For the contour scan, these settings were adjusted to 195 W and 300 mm/s.
The eight specimens examined in this work originate from a larger surface variation study and are part of the smoothest surface group produced (for details, see [
18,
19,
20]).
2.2. Surface Measurement
The surfaces were measured using an Alicona Infinite Focus G5 focus variation (FV) instrument with unpolarised coaxial lighting at 10× magnification with an individual image field of view (FOV) of 1.62 mm × 1.62 mm. To measure the entire marked area of about 3 mm × 20 mm on each sample, up to 3 × 14 images were stitched. All measurements were taken with a vertical resolution < 0.1 µm and a lateral resolution of 2.5 µm.
2.3. Surface Data Evaluation
The data evaluation was performed in MountainsMap® V9.2. To reduce calculation time, a 3 mm × 6 mm area portion centred within the measured area was extracted and a total number of eight data sets from different samples (I to VIII) was used to obtain the results presented in this work.
For reference, height and functional parameters form ISO 25178 were generated. An overview of all parameters used is given in
Table 2.
Feature parameter evaluation according to ISO 25178 and process-specific feature analysis were performed. Pruning threshold values were selected in accordance with powder characteristics, namely half the d10 diameter of the used AlSi7Mg0.6 powder [
21], resulting in the applied height pruning value of 13.5 µm.
2.3.1. Surface Feature Parameters from ISO 25178
Selected surface feature parameters were calculated after applying a Gaussian convolution S-filter of 5.3 µm, a least-squares plane level operation and an L-filter of 0.25 mm.
The feature parameters specified in ISO 25178 describe hill and dale properties and are obtained from surface data after watershed segmentation and height pruning. For more information, refer to [
4,
15].
The considered parameters are the density of valleys,
Svd, the density of peaks,
Spd, and the mean local hill height
Shh. For details on the individual calculation of these parameters, refer to [
4].
2.3.2. Process-specific Areal Surface Features
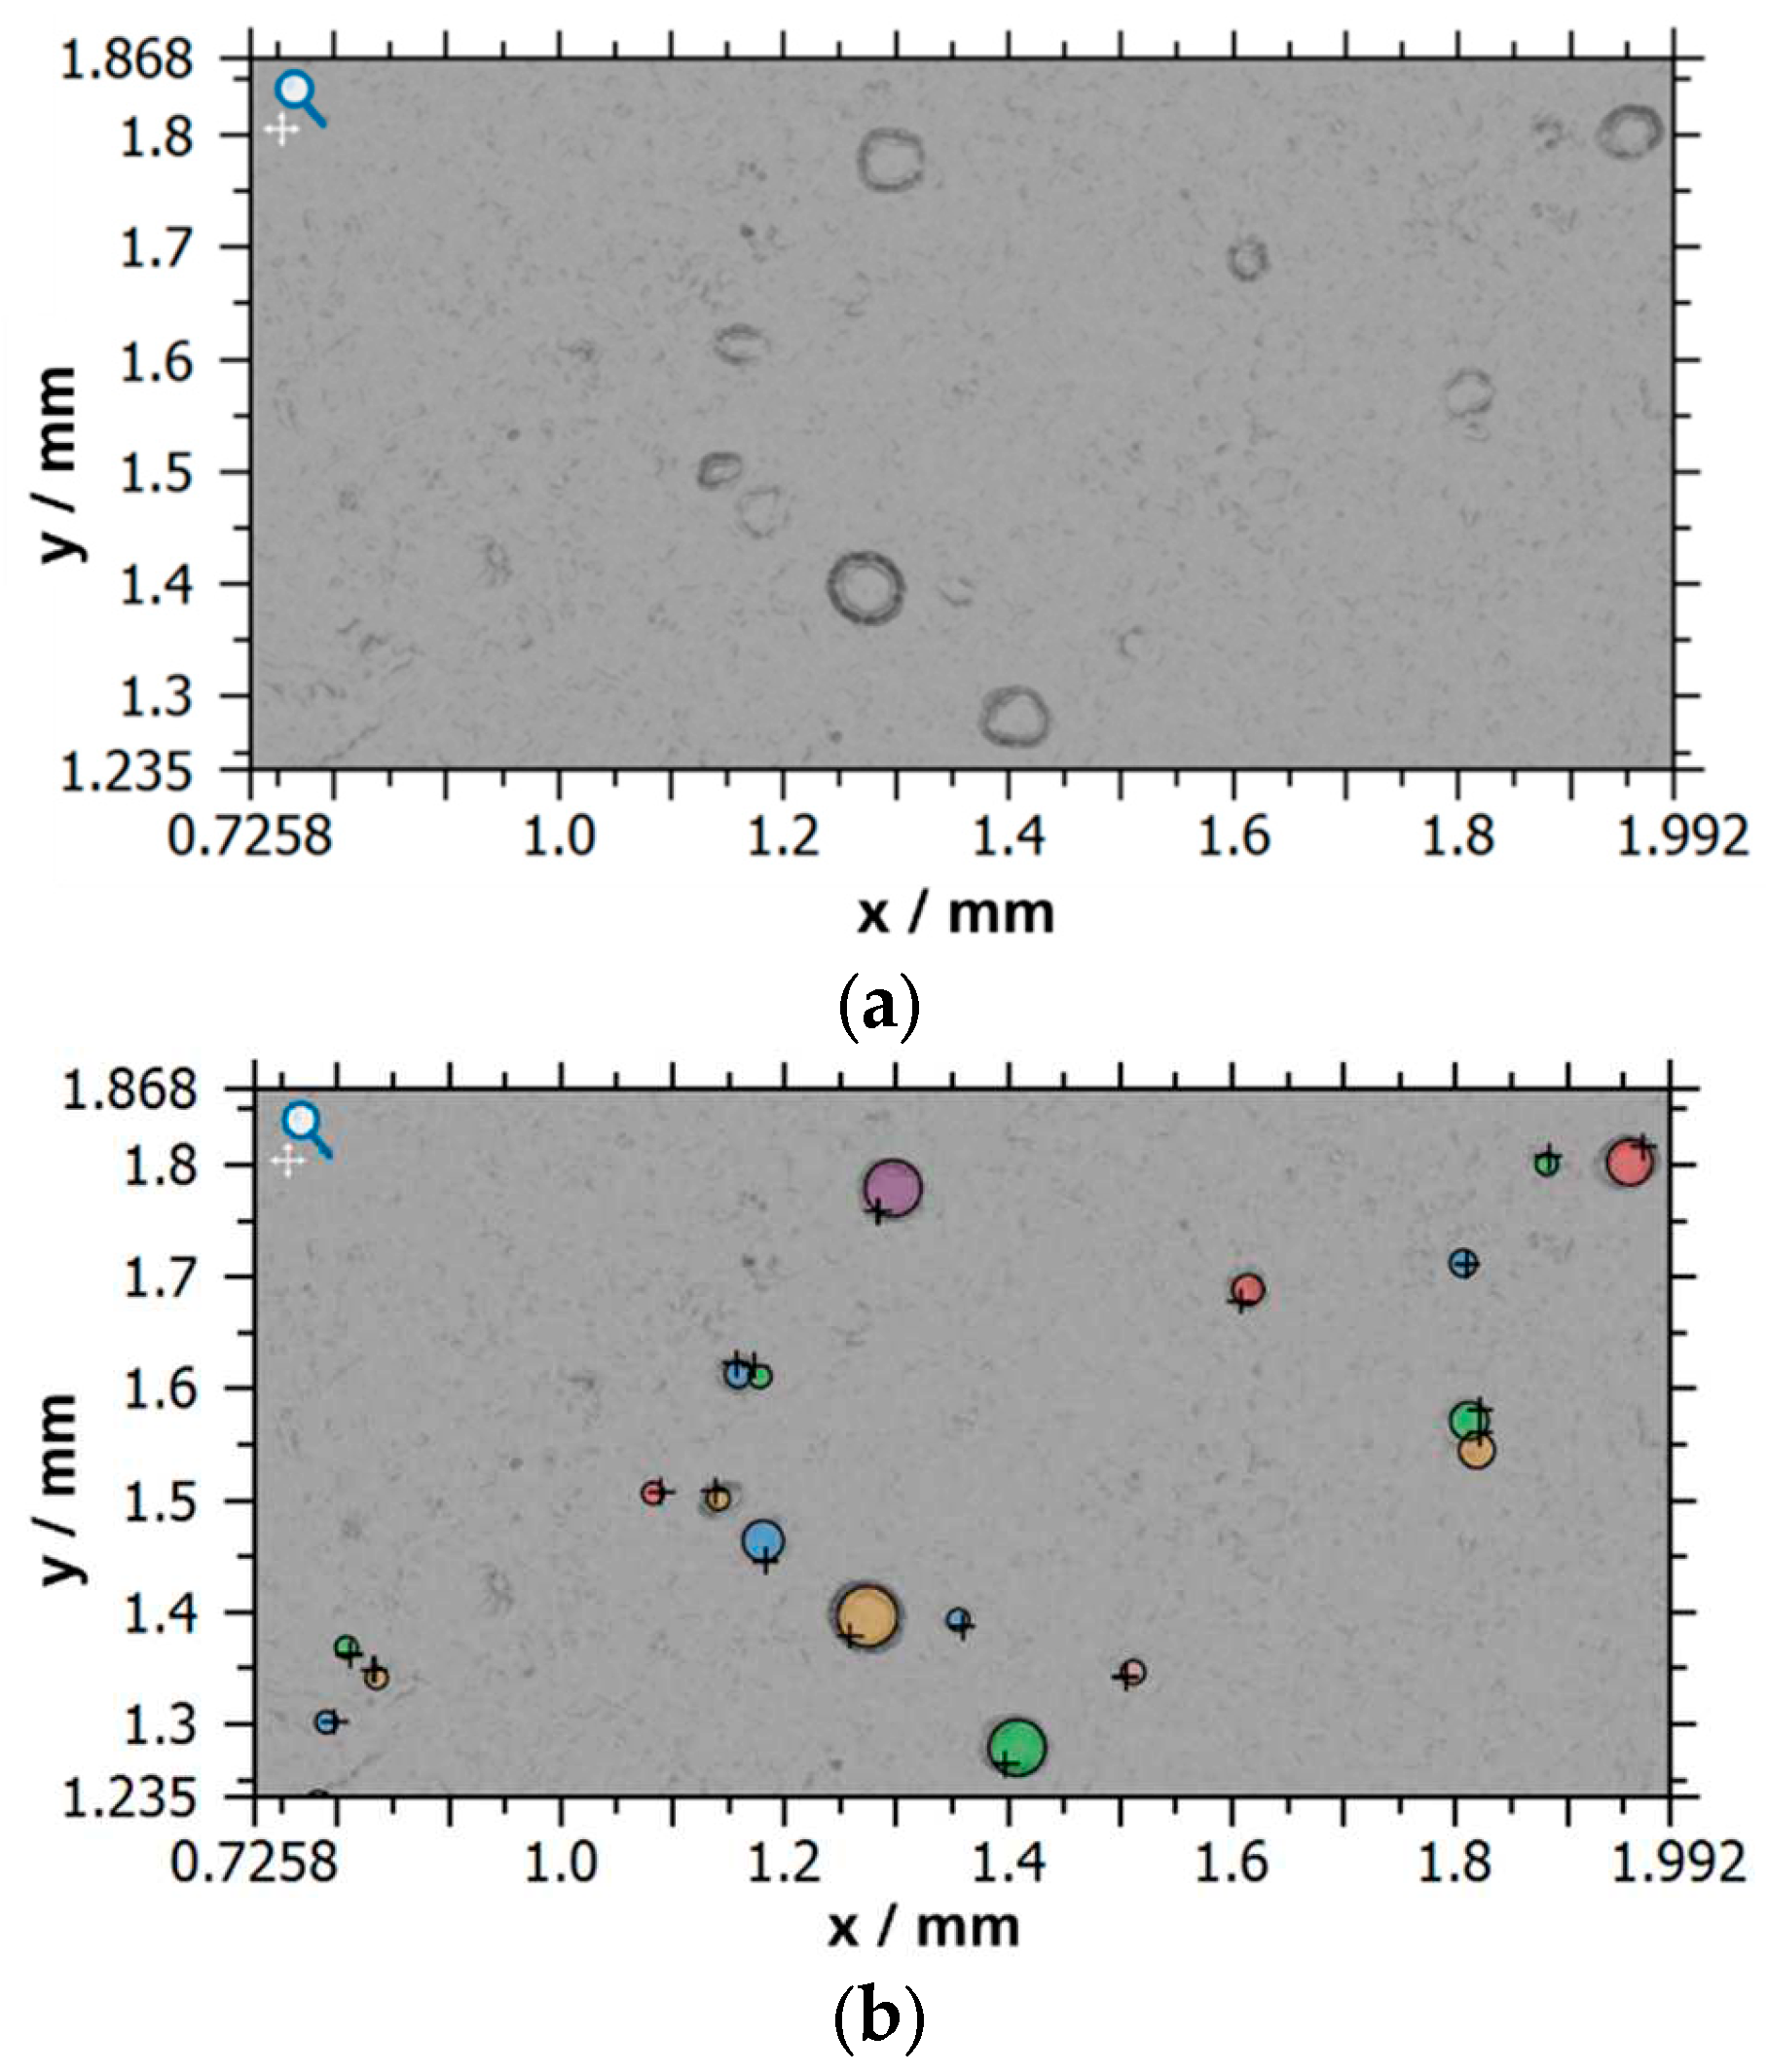
Particle agglomerations are significant process-specific features observed on PBF-LB surfaces. The circle detection method implemented in the MountainsMap® particle analysis module was used to isolate the specific features on the surfaces.
For this purpose, at first, a very small bandwidth was filtered to only maintain sharp edges (= particle boundaries), applying an L-filter of 0.0055 mm. Subsequently, the circle detection algorithm was applied, using limit values for detection diameters again, based on the particle size distribution values d10 = 27 µm and d90 = 67 µm. The minimum diameter for detection was set to 20 µm, somewhat lower than d10, while the maximum was chosen as 200 µm, roughly three times d90 to account for the possibility of clustered agglomerations.
In order to find the original height of the detected particles, the previously obtained mask was applied to the initial (primary) surface (after application of S-filter and F-operation).
The evaluated characteristics are the average maximum particle diameter dmax, maximum particle z-height zmax, percentage area portion covered by detected particles and finally, the particle density.
3. Results
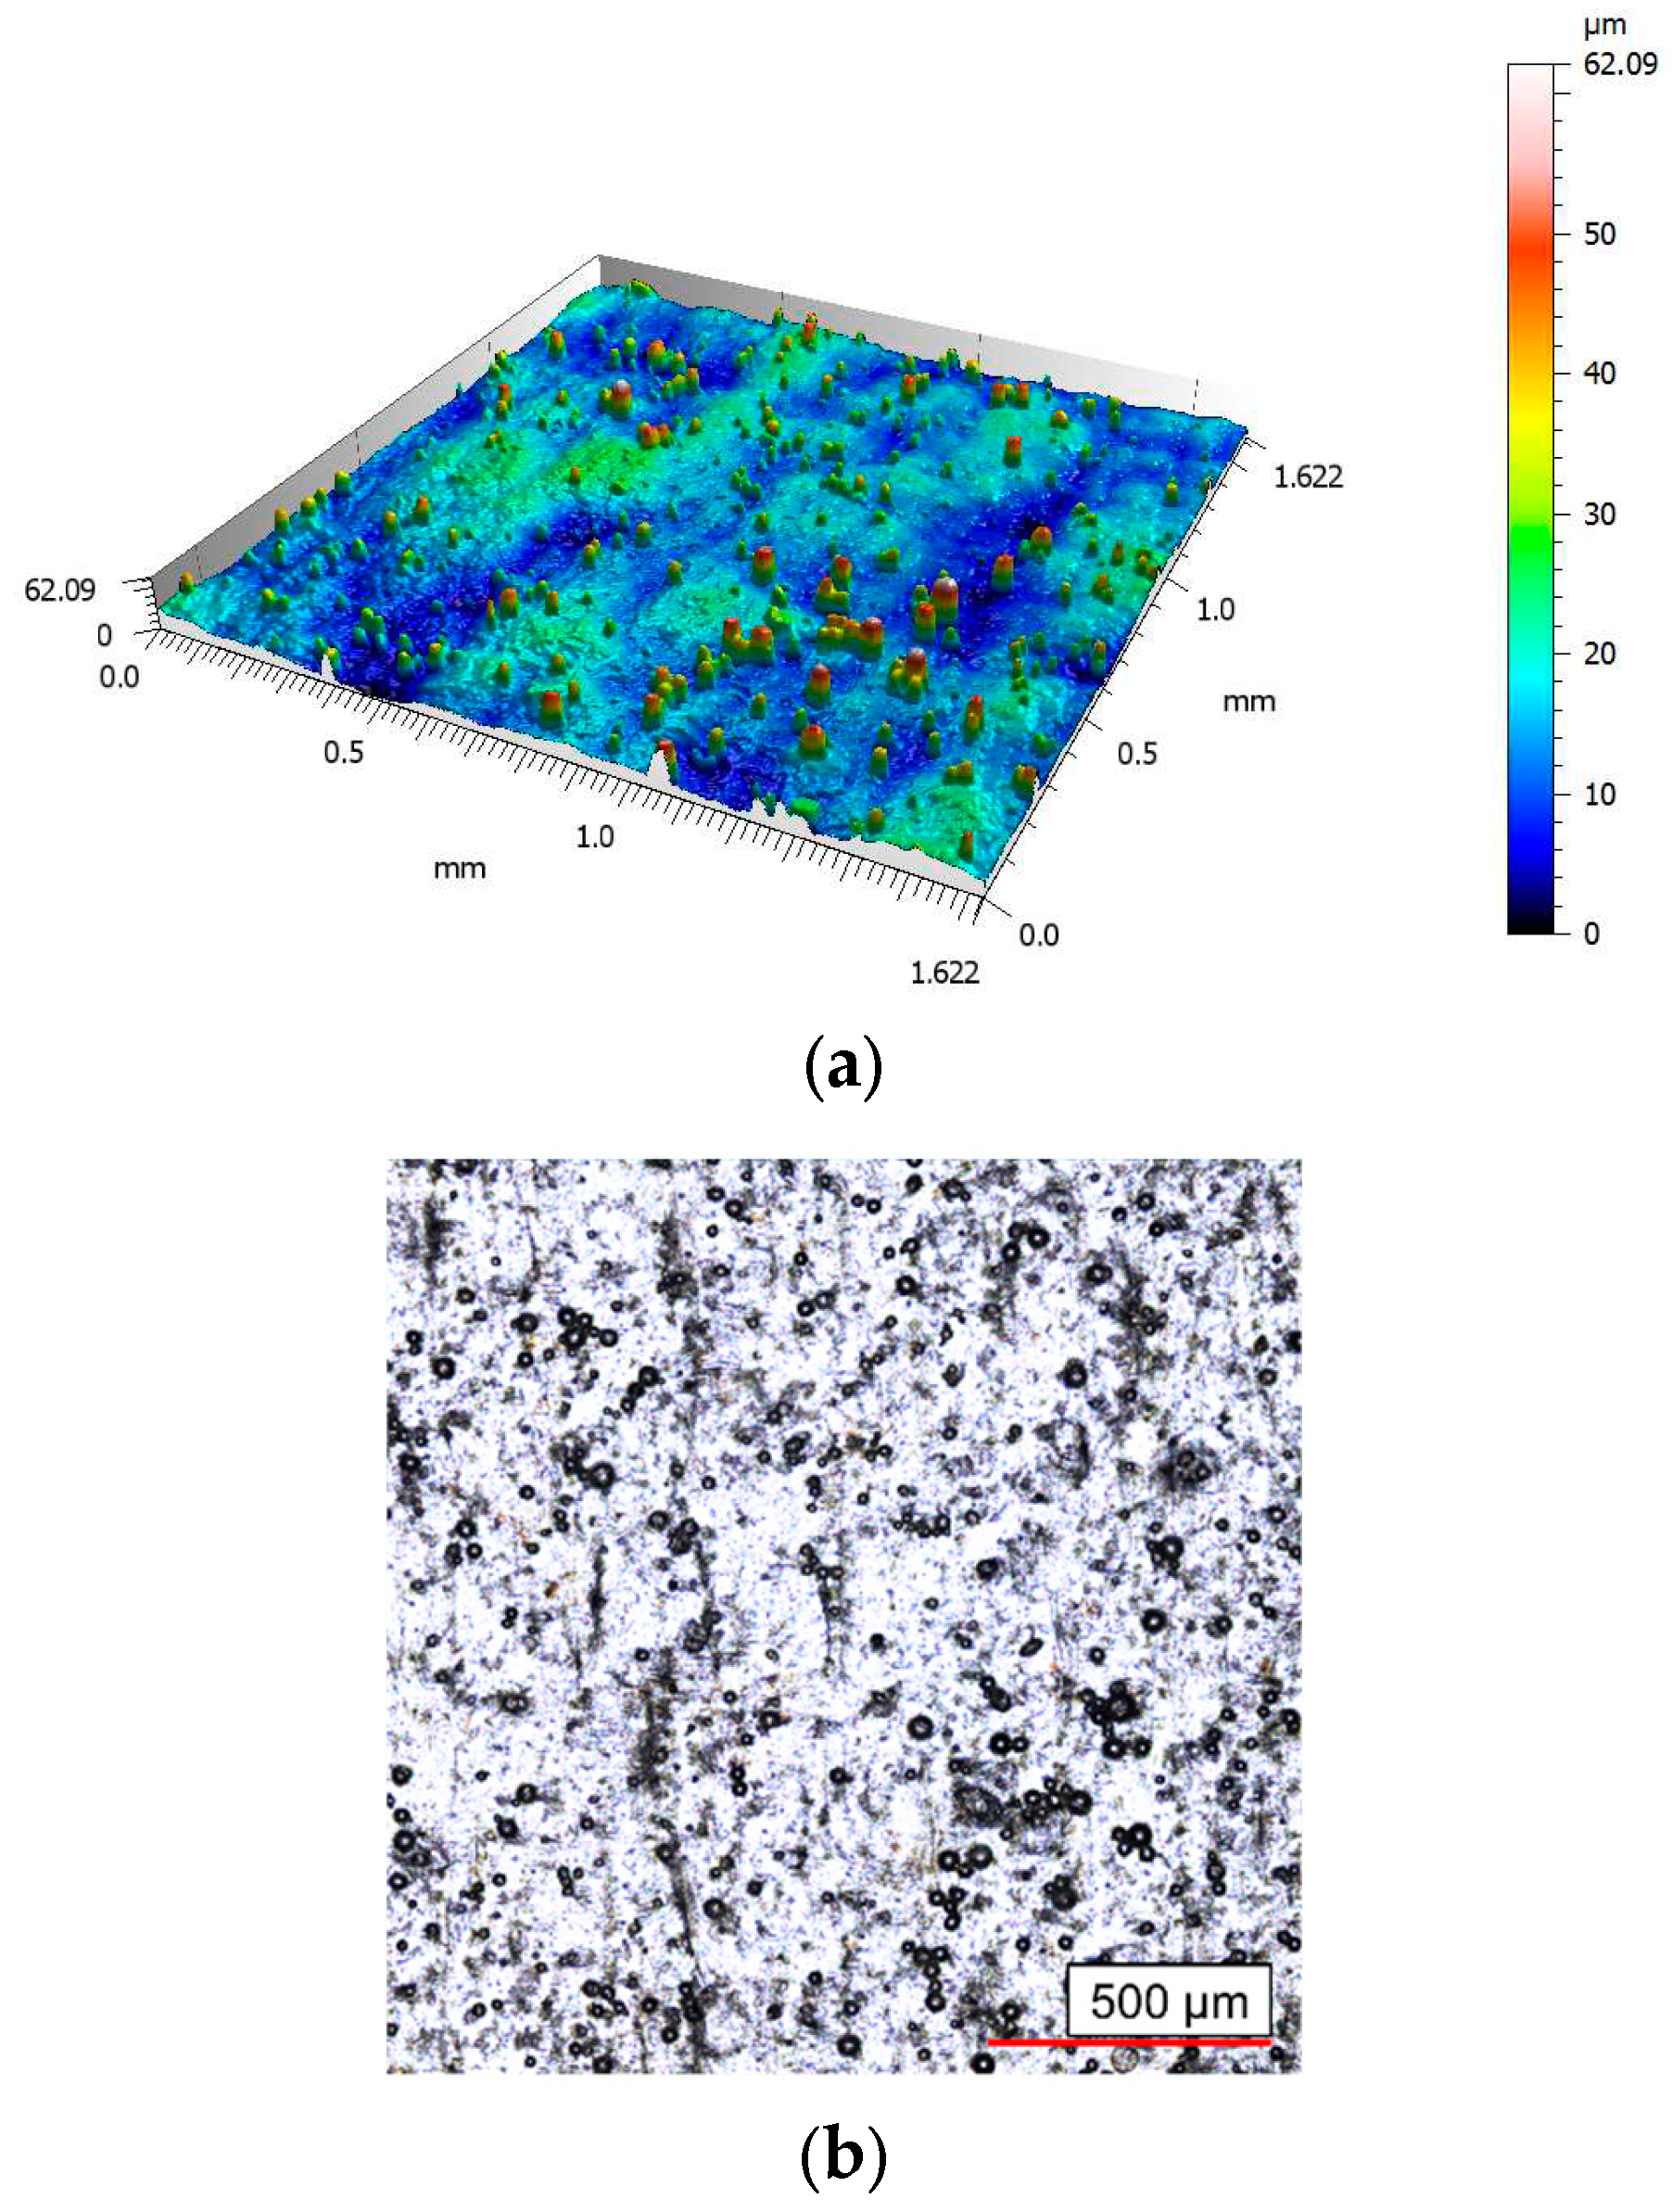
The 3D representation of one of the examined surfaces and the corresponding focus variation microscopic image in
Figure 2 show powder particle agglomerations as the dominant process-specific feature at the considered scale for this surface type.
This upcoming results section is split in three subsections, where ISO 25178 height and functional parameters, standardised feature parameters, and finally, characteristic values derived from process-specific areal surface features are presented.
3.1. Height and Functional Surface Texture Parameters from ISO 25178
For reference, the areal surface texture parameters
Sa (arithmetic mean height of profile) and
Sz (maximum total height of profile) were calculated. Furthermore, the material ratio curve parameters
Sk (core height),
Spk (reduced peak height) and
Svk (reduced valley depth) were generated. Numerical results including mean value and standard deviation (SD) for the listed parameters are given in
Table 3.
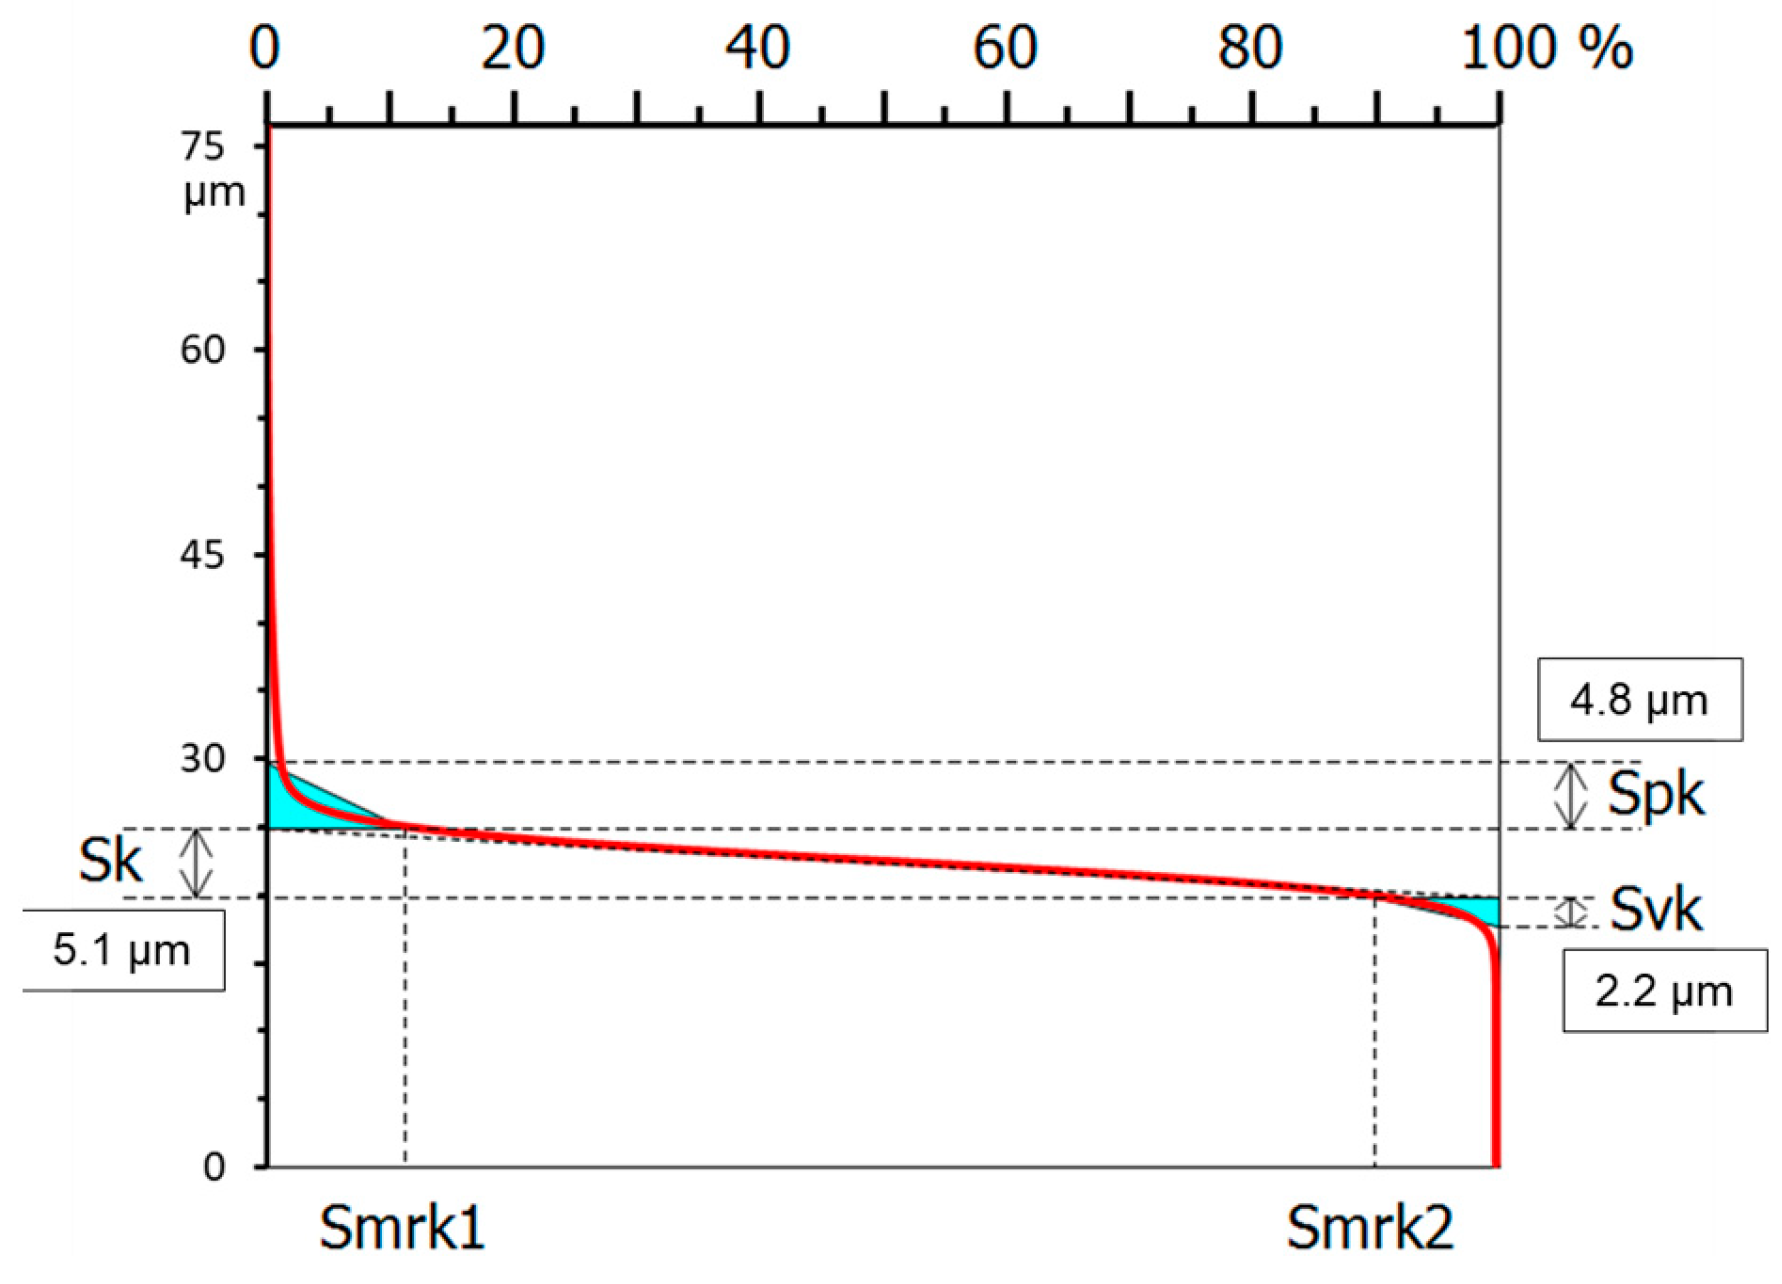
Figure 3 shows the exemplary material ratio curve of sample IV. From the curve, combined with the numerical values, a relatively flat core slope with steep decreases from the peak and toward the valley portion can be observed.
3.2. Surface Feature Parameters from ISO 25178
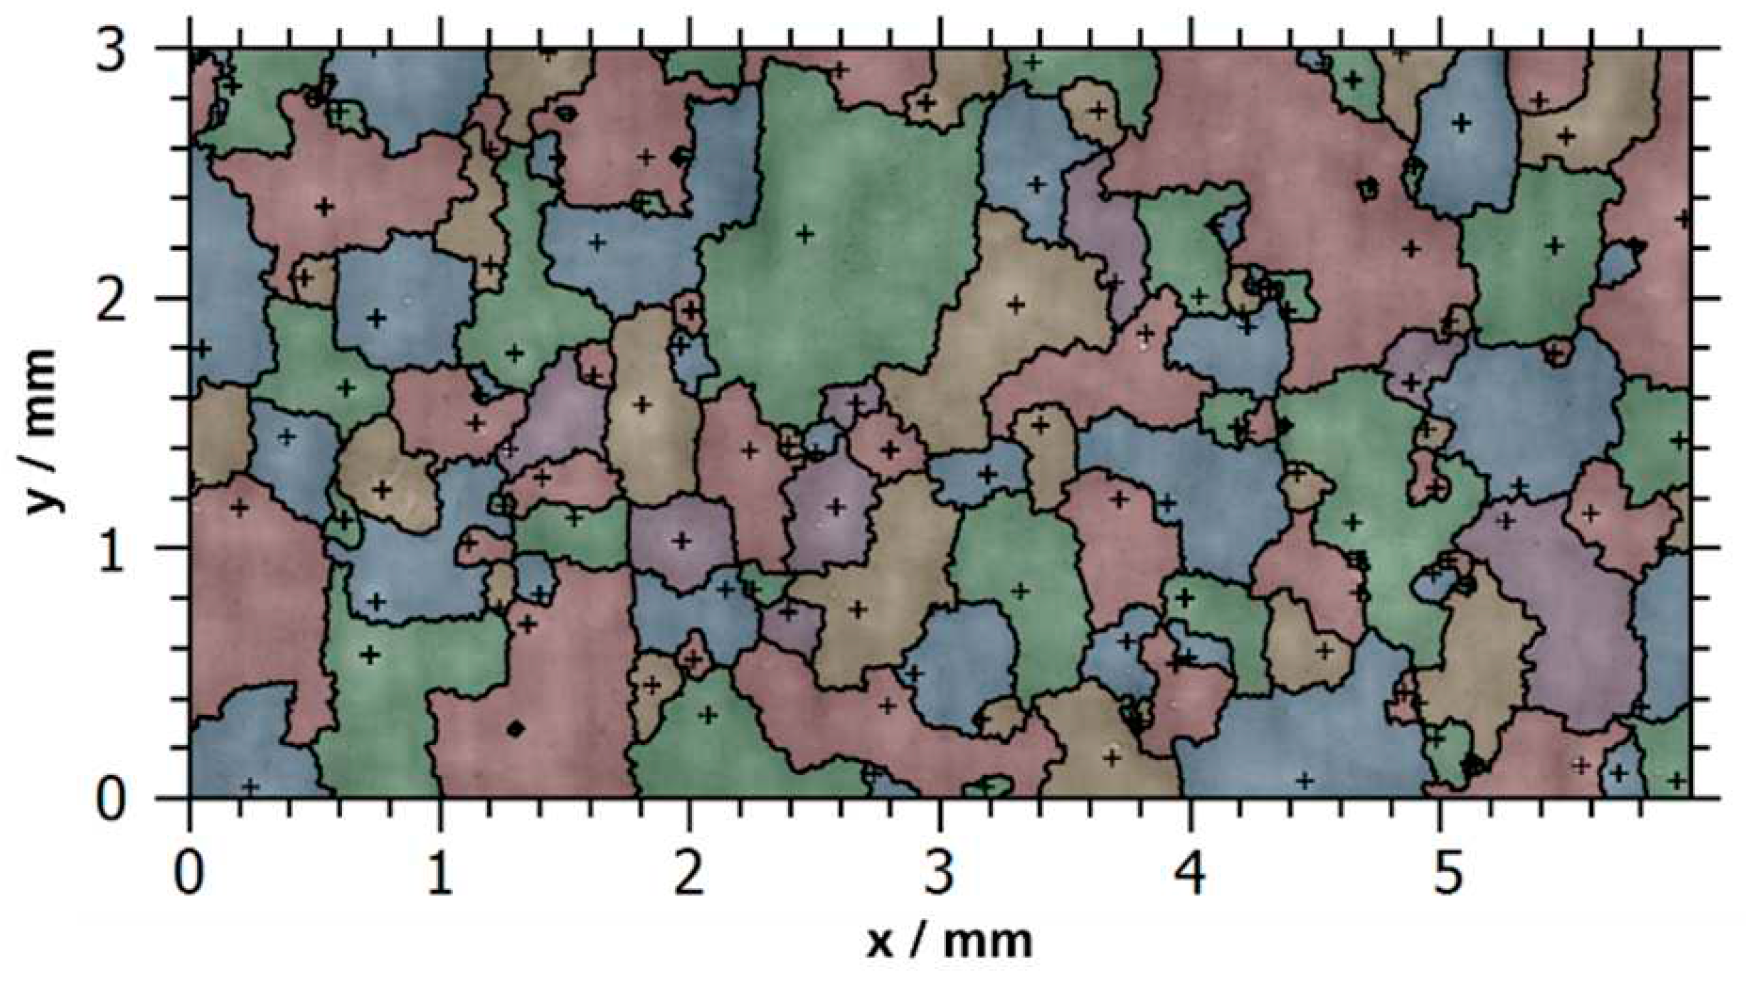
Figure 4 shows the watershed segmentation of the extracted 3 mm by 6 mm area of sample IV based on hill features; (+) denotes the location of the highest point of each segment. The colours are used to simplify the visual differentiation of adjacent particles. Due to the selected height pruning threshold of 13.5 µm, features smaller than half the d10 diameter (d10 = 27 µm) are merged with adjacent hill segments.
In
Table 4,
Spd (peak density),
Svd (valley density) and
Shh (mean local hill height) are listed. It is notable, that
Svd is equal for all the considered samples with 13.5 µm height pruning. The value of
Svd = 0.06 mm
-2 originates from the total valley count of one over the entire considered (3 × 6) mm² area.
3.3. Process-specific Areal Surface Features
The values presented in
Table 5 were obtained from the MountainsMap® V9.2 particle analysis circle detection module. A variety of characteristic values on feature size, shape, distribution and quantity can be generated. The presented initial selection was based on possible relation to powder particle size and potential relevance for fatigue performance, which will be subject of future work.
For clarity, the chosen parameters are explained in a bit more detail. dmax is the largest diameter of a detected particle, meaning, for a (near-) spherical agglomerated particle, and represents the (partial) sphere diameter. The zmax value gives the average of maximum particle z-heights with respect to the lowest point on the surface of all detected particles on the surface. Finally, the percentage of area covered by detected particles and the number of detected particles per unit area (particle density) are given.
Figure 5 shows an area portion on sample IV with circular and near-circular shaped features that could be detected. The top image is the S-L surface with an L-filter of 0.0055 mm. This very low value was chosen to only keep particle attachments and cut out other surface irregularities and waviness. In the bottom image, detected circular particles are marked. The (+) sign again, denotes the highest point on each individual particle.
4. Discussion
From visual inspection, it is confirmed that the dominant process-specific feature on the considered surface condition is agglomeration of powder particles. Examining
Table 3, it is clear from the material ratio curve that the peak portion represented by
Spk, is considerably larger than the valley population on the surface. The core part of the sample IV curve (
Figure 3) is fairly flat and exhibits a steep slope toward the peaks and valleys, where the maximum peak size (e.g.,
Figure 3: above 75 µm) is significantly larger than the maximum valley size, which is related to attached particles on an otherwise presumably flat surface.
Using
Sa as a common and widely known parameter, the surface condition can be considered to be comparatively smooth to other PBF-LB parts (as-built PBF-LB parts can easily exceed an
Sa/
Ra of 20 µm under similar filtering conditions, depending on material and processing [
17,
22]).
Correspondingly, the
Svd value of 0.06 mm
-2 (see
Table 4) over the extracted area on each of the considered samples (N = 8) counts one single dale, meaning, there are no significant dales present with a height pruning value of 13.5 µm on the studied surface condition.
Considering the peak density
Spd, there can be significant hills identified on the surface, which is again in agreement with the material ratio curve results (see
Figure 3,
Table 3). The mean local hill height
Shh with 22.39 µm matches the order of magnitude of the d10 of 27 µm and is hence representative of the expected feature size.
Moving on toward the discussion of the process-specific feature characteristics,
dmax and
zmax are with 28 µm and 34 µm on average similarly close to the d10 size. Considering respective standard deviations (
Table 5), it can be concluded that this is equally applying to all evaluated specimens. This suggests that the strategy of using a small L-filter value to only retain sharp edges (i.e., particle boundaries) seems to have been effective.
At this point it is emphasised that the generated mean values are based on averages per sample and given standard deviations represent the difference in mean value among the eight assessed specimens.
The area of less than 2% covered with particles will supposedly be of interest in comparison with other as-built surfaces (e.g. those introduced in [
18]) and in regard to correlation with mechanical properties.
The final feature characteristic value to be discussed is the particle density. While the description itself may suggest similarities to the peak density Spd, the mean value is more than twice as high. This considerable deviation is owing to differences in the detection/segmentation methods and reference surfaces. Firstly, the circle detection is based on an S-L surface with small bandwidth to reliably filter smooth height variations with continuous slopes (waviness or similar) and particles are detected based on their shape rather than height. The peaks are counted based on the original surface (levelled and S-filtered) after watershed segmentation, where it is likely that two adjacent particles are part of the same segment and due to height pruning (combination of smaller features), only the highest of both is counted as segment peak.
Secondly, even though identical height pruning values are applied, the pruning is performed with respect to different reference points. While for the ISO 25178 parameters, the height of a hill feature is defined with respect to the highest saddle point on its course line [
4] and is merged with the adjacent taller hill if below the threshold value, detected circular particles will only be merged when overlapping. This being addressed,
Figure 4 and
Figure 5 clarify the large difference in particle and peak density.
5. Conclusions and Future prospects
This work provides an insight into the opportunities for novel approaches to quality assurance concepts using feature parameters and process-specific surface features for surface texture characterisation of metal additive parts, specifically of AlSi7Mg0.6 specimens from PBF-LB.
In summary, for the examined surface type with the selected measurement method, configuration and software tool settings, the following conclusions are drawn:
Evaluated feature parameters correspond with the (qualitative) implications of height-based parameters from the material ratio curve (hills/dales, peak/valley portion).
Mean values of the surface feature characteristics and parameters can be linked with particle size of the powder used in the manufacturing process.
In comparison to common height variation-based parameters such as Sa and Sz, feature parameters and characteristics describe properties of physical topography elements rather than being based on deviation from a mean line or individual extreme values. The material ratio curve parameters on the other hand, could provide an insight on the height distribution, identifying a smaller valley than peak portion, which matched well with the feature parameter results.
However, the material ratio curve only provides information about the height distribution, while the characterisation of surface features can provide an understanding of present feature shapes, size distribution or quantity. This approach can be of interest when trying to understand relationships between surface quality and mechanical performance (e.g. fatigue), corrosion or adhesion.
The presented results give a first idea of the prospects of quantifying the PBF-LB-specific powder particle agglomeration features based on mean values per specimen. Ongoing work includes more detailed examinations of distribution and frequency of detected particle sizes on individual samples.
Additional aspect to be considered in future work are the challenges imposed on optical metrology systems regarding the accurate representation of surface features and on evaluation software concerning their comprehensive detection.
Acknowledgements
TB thanks the German academic exchange service DAAD for funding a research stay with the manufacturing metrology team at the university of Nottingham, funding program ID 57556282.
References
- Uriondo, A., Esperon-Miguez, M., Perinpanayagam, S. (2015). The present and future of additive manufacturing in the aerospace sector: A review of important aspects. Proceedings of the Institution of Mechanical Engineers, Part G: Journal of Aerospace Engineering, 229(11), 2132-2147. [CrossRef]
- Herzog, D., Seyda, V., Wycisk, E., Emmelmann, C. (2016). Additive manufacturing of metals. Acta Materialia, 117, 371-392. [CrossRef]
- Townsend, A., Senin, N., Blunt, L., Leach, R. K., Taylor, J. S. (2016). Surface texture metrology for metal additive manufacturing: a review. Precision Engineering, 46, 34-47. [CrossRef]
- Leach, R. (ed.). (2013). Characterisation of Areal Surface Texture. Springer Berlin Heidelberg.
- Sauer, B.(ed.), Steinhilper, W. (2016). Konstruktionselemente des Maschinenbaus. Springer Berlin Heidelberg.
- Zou, Y., Cao, S., Li, J., Ju, Y. (2022). Multiscale characterization and analysis of additive manufacturing surfaces based on confocal laser scanning microscopy. The International Journal of Advanced Manufacturing Technology, 122(5-6), 2475-2491. [CrossRef]
- ISO 25178-2:2022-02-04: Geometric Product Specifications (GPS) - Surface texture: areal - Part 2: Terms, definitions and surface texture parameters, 2022.
- Senin, N., Thompson, A., Leach, R. (2017). Characterisation of the topography of metal additive surface features with different measurement technologies. Measurement Science and Technology, 28(9), 095003. [CrossRef]
- Jiang, X., Senin, N., Scott, P.J., Blateyron, F. (2021). Feature-based characterisation of surface topography and its application. CIRP Annals 70/2, 681-702. [CrossRef]
- Newton, L., Senin, N., Chatzivagiannis, E., Smith, B., Leach, R. (2020). Feature-based characterisation of Ti6Al4V electron beam powder bed fusion surfaces fabricated at different surface orientations. Additive Manufacturing, 35, 101273. [CrossRef]
- Senin, N., Thompson, A., Leach, R. (2018). Feature-based characterisation of signature topography in laser powder bed fusion of metals. Measurement Science and Technology, 29(4), 045009. [CrossRef]
- Newton, L., Senin, N., Chatzivagiannis, E., Smith, B., Leach, R. (2020). Feature-based characterisation of Ti6Al4V electron beam powder bed fusion surfaces fabricated at different surface orientations. Additive Manufacturing, 35, 101273. [CrossRef]
- Fox, J. C., Moylan, S. P., Lane, B. M. (2016). Effect of process parameters on the surface roughness of overhanging structures in laser powder bed fusion additive manufacturing. Procedia CIRP, 45, 131-134. [CrossRef]
- Lou, S., Jiang, X., Sun, W., Zeng, W., Pagani, L., Scott, P. J. (2019). Characterisation methods for powder bed fusion processed surface topography. Precision Engineering, 57, 1-15. [CrossRef]
- Lou, S., Pagani, L., Zeng, W., Jiang, X., Scott, P.J. (2020). Watershed segmentation of topographical features on freeform surfaces and its application to additively manufactured surfaces, Precision Engineering 63, 177-186. [CrossRef]
- Danzl, R., Helmli, F., Scherer, S. (2011). Focus Variation – a Robust Technology for High Resolution Optical 3D Surface Metrology. Strojniski Vestnik/Journal of Mechanical Engineering, 57(3). [CrossRef]
- Newton, L., Senin, N., Gomez, C., Danzl, R., Helmli, F., Blunt, L., Leach, R. (2019). Areal topography measurement of metal additive surfaces using focus variation microscopy. Additive Manufacturing, 25, 365-389. [CrossRef]
- Buchenau, T., Amkreutz, M., Bruening, H., Mayer, B. (2023). Surface and Bulk Quality of Metal Additive AlSi7Mg0.6 With Contour Scan Variation. Preprints. [CrossRef]
- Buchenau, T., Amkreutz, M., Brüning, H. (2021) Surface texture and high cycle fatigue of as-built metal additive AlSi7Mg0.6. Journal of Additive Manufacturing Technologies, 1(2), 531. [CrossRef]
- Buchenau, T., Bruening, H., Amkreutz, M. (2022). Elementparameter zur Oberflächencharak-terisierung additiv gefertigter Metall-Komponenten. In: Zimmermann, Martina (ed.). Werkstoffe und Bauteile auf dem Prüfstand. DGM – Deutsche Gesellschaft für Materialkunde e.V., 117-123.
- Amkreutz, M., Aumund-Kopp, C., Brüning, H., Buchenau, T., Norda, M., Sukowski, F., & Suth, D. (2021). APOLLO - Additive Teilefertigung, -prüfung und Oberflächenbehandlung für Aluminiumkompo-nenten; Teilvorhaben PROMOTIVE – Prozessopti-mierung, Materialcharakterisierung und Oberflä-chenschutz additiv gefertigter Aluminiumbauteile: Schlussbericht, Laufzeit: 01.01.2018 bis 30.06.2021. Fraunhofer IFAM. [CrossRef]
- Zerbst, U., Bruno, G., Buffiere, J. Y., Wegener, T., Niendorf, T., Wu, T., ... Schnabel, K. (2021). Damage tolerant design of additively manufactured metallic components subjected to cyclic loading: State of the art and challenges. Progress in materials science, 121, 100786. [CrossRef]
|
Disclaimer/Publisher’s Note: The statements, opinions and data contained in all publications are solely those of the individual author(s) and contributor(s) and not of MDPI and/or the editor(s). MDPI and/or the editor(s) disclaim responsibility for any injury to people or property resulting from any ideas, methods, instructions or products referred to in the content. |
© 2023 by the authors. Licensee MDPI, Basel, Switzerland. This article is an open access article distributed under the terms and conditions of the Creative Commons Attribution (CC BY) license (http://creativecommons.org/licenses/by/4.0/).
