1. Introduction
Glycyl-L-alanine hydroiodide monohydrate (H
2N-CH
2-CO-NH-CH(CH
3)-COOH·HI·H
2O is a dipeptide hydrohalide whose crystal structure was determined in 1989 and used as a model for the study of inter- and intramolecular hydrogen bonds in peptides. It is a noncentrosymmetric polar compound that crystallizes in space group P2
1, with two molecules in the unit cell [
1]. The crystal possesses a polar 2-fold axis parallel to the crystallographic
b axis and, consequently piezoelectricity, pyroelectricity and optical second harmonic generation are allowed by symmetry. Among these properties, pyroelectricity was reported as a function of temperature in the range 100 – 300K, indicating a pyroelectric coefficient along the polar axis that varies between 2 μC·m
−2K
−1 at 100K and 15.5 μC m
−2K
−1 at 357K [
2]. The compound was synthesized at room temperature from benzyoxycarbonyl-glycyl-L-alanine methyl ester with an excess of iodine hydride (HI) [
3,
4]. Crystals obtained through this synthetic route are hereafter identified as Gly-L-AlaHI.H
2O (Poly1).
Here, we report a polymorph of Glycyl-L-Alanine hydroiodide monohydrate (hereafter referred to as Gly-L-AlaHI.H2O (Poly2)) obtained from the synthesis of the cyclic dipeptide cyclo-glycyl-L-alanine with hydroiodic acid (HI) in an aqueous solution at room temperature. The newly discovered polymorph has unit cell parameters very similar to Poly 1, but the atomic positions of the iodine and dipeptide within the unit cell are different. Although we have started from the cyclic dipeptide, its conformation in the unit cell of the Gly-L-AlaHI.H2O (Poly2) is not cyclic as the initial closed dipeptide chain was broken during the synthesis process, and the dipeptide has crystallized with a linear chain displaying a different conformation from that reported in Poly1.
In general, polymorphs differ either in the unit cell parameters, their space group or in both. The type of polymorphism now reported for Gly-L-AlaHI.H2O is very unusual, as both the unit cell parameters and the space group are the same, that is, Poly1 and Poly2, both crystalize in space group . The difference between the two polymorphs results from the dipeptide and water molecules positions as well iodine atomic positions within the unit cell, displaying directionally different hydrogen bonds as a result of different atomic coordinates.
We report here the crystal structure of a synthesized polymorph, referred as Gly-L-Ala.HI.H2O (Poly2), its pyroelectric and optical second harmonic generation properties.
Cyclo-glycyl-l-alanine, one of the simplest dipeptides, is a chiral cyclic di-amino peptide found in nature and is synthesized by some microorganisms [
5,
6]. The dipeptide, resulting from the bonding of glycine and l-alanine amino acids, is able to adapt its conformation according to a certain functional structure. This dipeptide behavior was demonstrated when used as a linker in metal-organic framework compounds [
7,
8,
9]. We reason that the polymorph now discovered (Gly-L-AlaHI.H
2O (Poly2)) starting from the cyclic dipeptide in an acidic aqueous solution, results from the general property of the flexibility of dipeptides and protein that is primary determined by the flexibility of the constituent amino acids [
10]. In particular, glycyl-L-alanine dipeptide experiences torsional, orientational, and displacive changes under different environments [
7].
2. Experimental Section
2.1. Synthesis
Cyclo-glycyl-L-alanine (1.29 g, 10 mmol), was dissolved in 5 ml of HI (57%, stabilized with H
3PO
3) and 10 ml of water. H
3PO
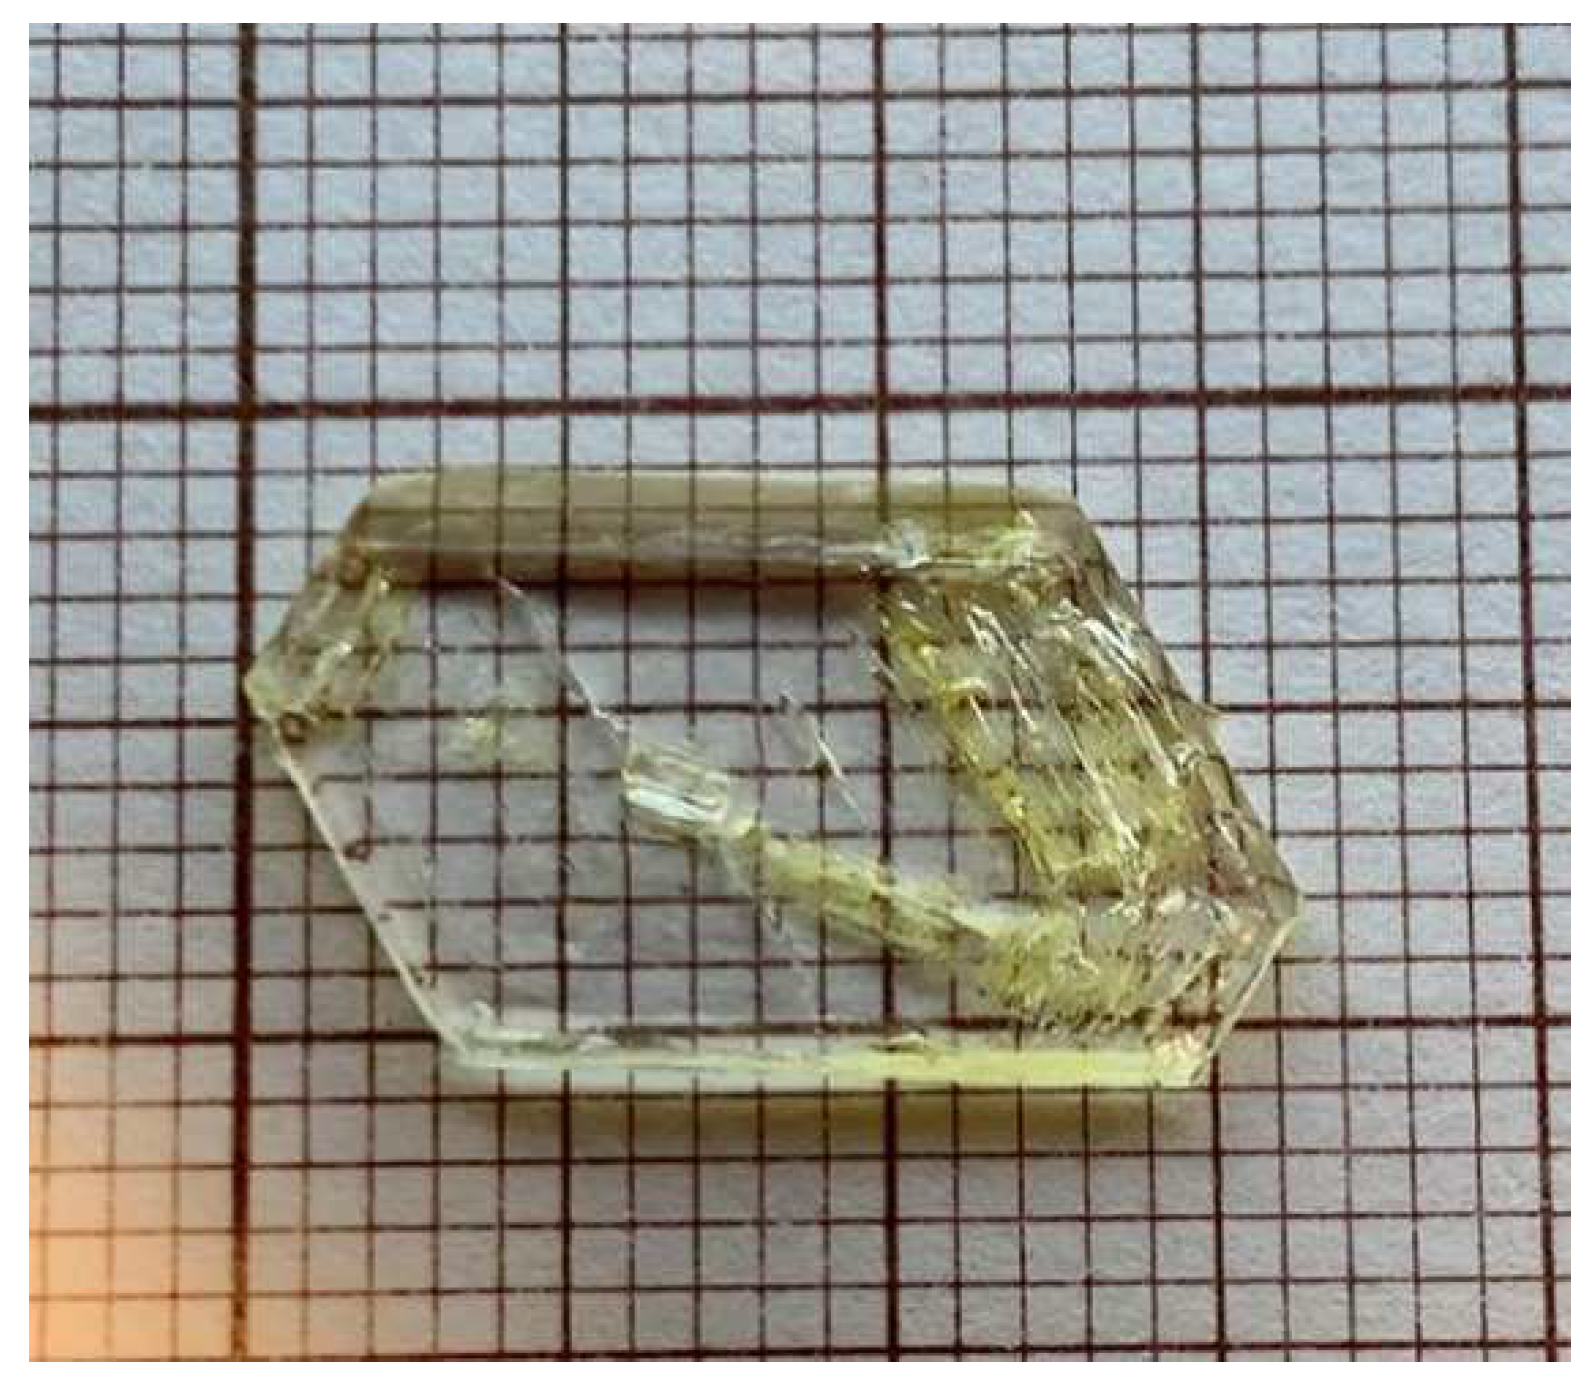
3 acted as a stabilizer for HI to avoid reduction to elemental iodine. After two weeks of slow evaporation at room temperature, transparent, hexagonal-shaped single crystals of Gly-L-AlaHI.H
2O (Poly2) were formed. The crystals were collected and rinsed with acetone, dried and kept in a dissector. An example of the grown crystals is shown in
Figure 1. Cyclo-Glycyl-L-alanine (cyclo-Gly-L-Ala) was purchased from Bachem AG (Bubendorf, Switzerland). Hydriodic acid (HI) was purchased from Merck (Darmstadt, Germany) and used as received.
2.2. XRay Crystallography experimental conditions description
A single crystal of Gly-L-Ala.HI.H
2O (Poly2) was selected, covered with Fomblin (polyfluoro ether oil) and mounted on a nylon loop. The data was collected at 293(2)K on a Bruker D8 Venture diffractometer equipped with a Photon 100 CMOS detector, using graphite monochromated Mo-Kα radiation (λ=0.71073 Å). The data was processed using the APEX3 suite software package, which includes integration and scaling (SAINT), absorption corrections (SADABS 2016/2) [
11] and space group determination (XPREP). Structure solution and refinement were done using direct methods with the programs SHELXT (version 2014/5) and SHELXL (version 2018/3)[
12] inbuilt in APEX, and WinGX-Version 2021.3 [
13] software packages. All non-hydrogen atoms were refined anisotropically. Except for NH, OH and water H-atoms, which were located on the difference Fourier map, the remaining hydrogen atoms were inserted in idealized positions and allowed to refine riding on the parent carbon or oxygen atom with C–H distances of 0.96 Å, 0.97 Å and 0.98 Å for methyl, methylene and methine H atoms, respectively. The molecular diagrams were drawn with Mercury [
14]. Crystal data for Gly-L-Ala.HI.H
2O (Poly2): C
5H
13IN
2O
4, FW = 292.07, monoclinic, space group
P2
1 (no.4), 0.400×0.300×0.260 mm
3 (yellow prism),
Dc = 1.865 g cm
-3, Z = 2, a = 7.747(6), b = 6.435(5), c = 10.941(9) Å, α = 90 °, β = 107.53(3) °, γ = 90 °, V = 520.1(7) Å
3, T = 293(2) K, Bruker D8 Venture diffractometer with Photon 100 CMOS detector, λ (MoKα) = 0.71073 Å, µ = 3.063 mm
-1. Of 12554 reflections measured (
Rint = 0.0551), 2562 were unique. Refinement on F
2 concluded with the values
R1 = 0.0286 and
wR2 = 0.0683 for 126 parameters and 2457 data with
I > 2
σI (GooF = 1.096). The data for Gly-L-Ala.HI.H
2O (Poly2) was deposited in the CCDC under deposit number 2247398.
2.3. Dielectric spectroscopy
The dielectric properties of the Gly-L-AlaHI.H
2O (Poly2) crystals were characterized by impedance spectroscopy, at temperatures of 288 – 383 K and in the frequency range of 20Hz–3MHz. The complex permittivity, written as ε=ε'-iε'', where ε and ε'' are the real and imaginary parts, respectively, was calculated from the measured capacitance (C) and loss tangent (tan δ), using the equations:
Here, A is the electric contact area and d is the crystal thickness. To form the capacitor, the bottom and top electrodes were made with gold contacts were sputtered on the sample surfaces. A Wayne Kerr 6440A (Wayne Kerr Electronics, London, UK) precision component analyzer was used, together with a dedicated computer and software, to acquire the data. Shielded test leads were employed to avoid parasitic impedances due to connecting cables. Temperature-dependent measurements were performed at a rate of 2° C/min, using a Polymer Labs PL706 PID controller (Polymer Labs, Los Angeles, CA, USA) and furnace.
2.4. Pyroelectric Measurements
Pyroelectricity is a property of polar crystalline materials that results from the temperature dependence of their spontaneous polarization. By changing the temperature, an electric field originating from changes in intrinsic dipoles is compensated by the surface layer of free charges. The rate of change of the spontaneous polarization ( with the temperature ( is the pyroelectric coefficient,. The change in polarization was detected by measuring, at constant stress, the pyroelectric current, , with a Keithley 617 electrometer (Keithley Instruments GmbH, Landsberg, Germany). In the equation, A is the electrode area and is the rate of temperature change with time (.
The measurements were performed on a capacitor geometry under short-circuit conditions and the electrode area was 8.11 × 10⁻⁶ m. The temperature interval was between 290 K and 345 K at the heating rate of 2 K/min.
2.5. Second Harmonic Generation
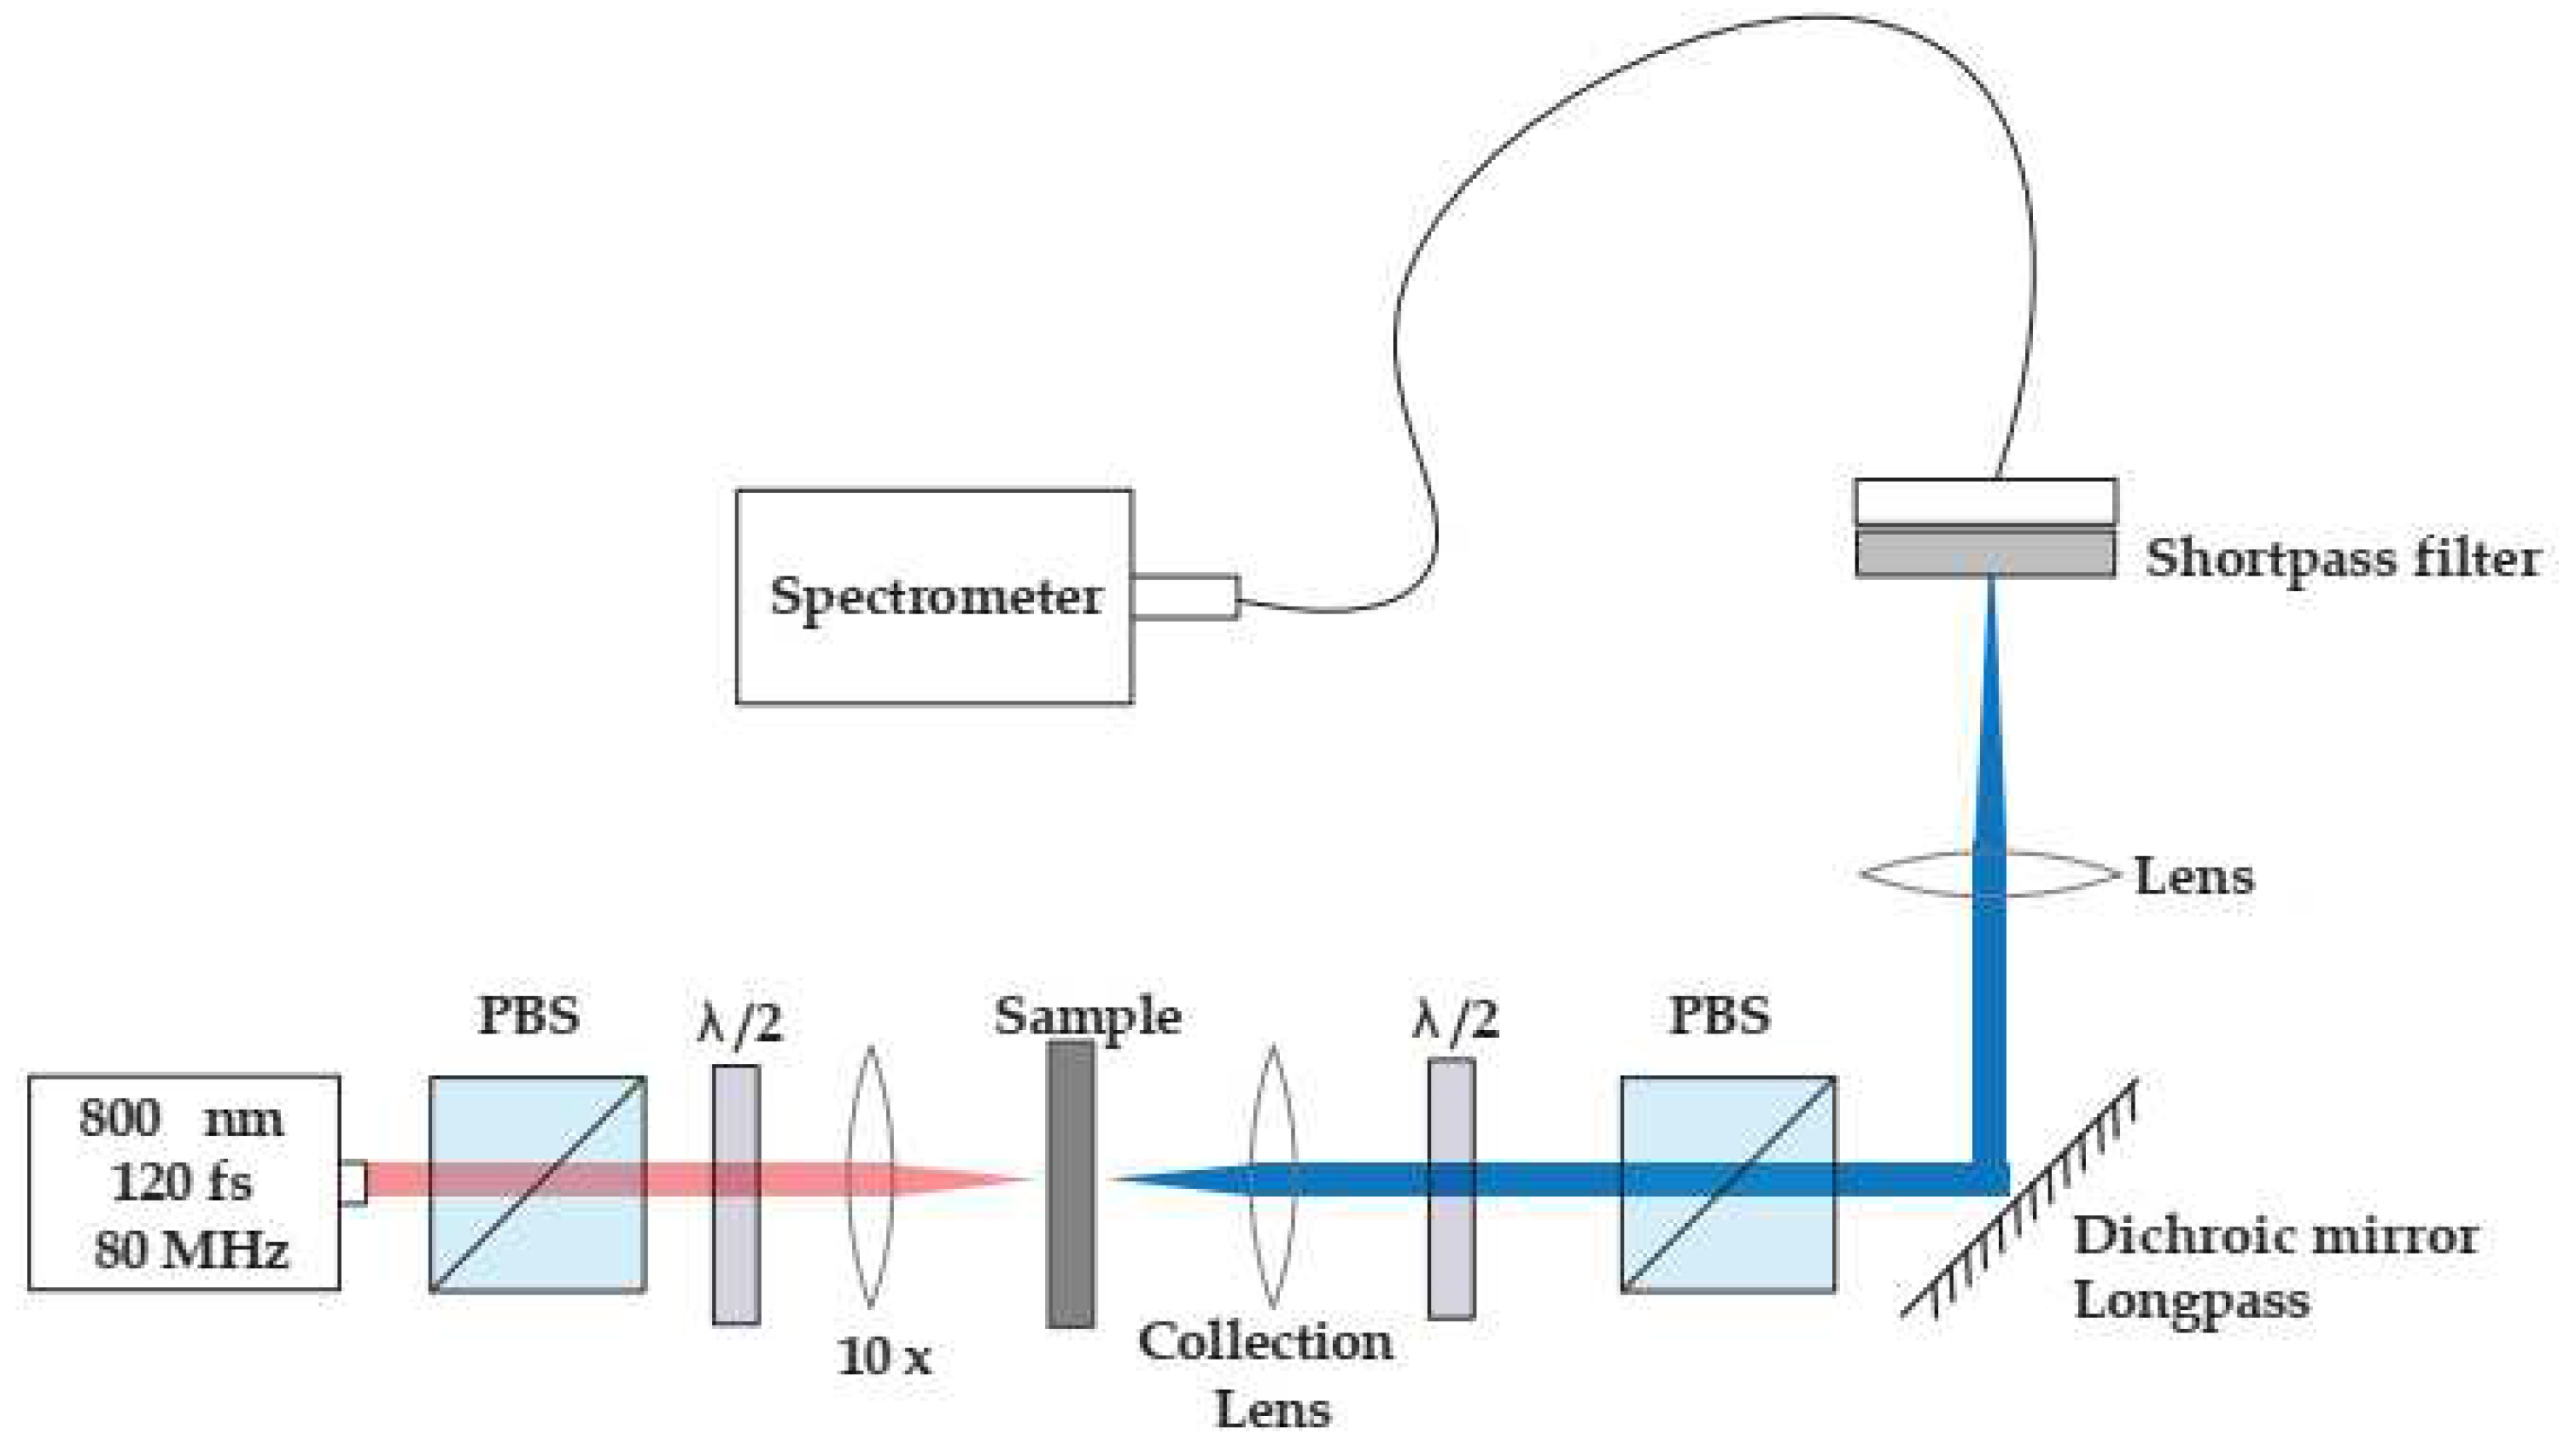
The second harmonic measurements were carried out using a mode-locked Ti:Sapphire laser (Coherent Mira) coupled into a Nikon Eclipse Ti2 inverted microscope as shown in
Figure 2. A calcite Glan-Taylor polarization followed by a zero-order half-wave plate controlled the incident polarization. A Nikon CFI Plan Fluor x10 objective focused the beam onto the samples, while a Mad City Labs xyz piezo-controlled translation stage positioned the samples in the focal plane with sub-micrometer accuracy. Incident powers ranged from 5mW for the sample to approximately one hundred microWatts for the BBO crystal used for calibration of the system’s sensitivity. Although the Fourier limit of the pulse duration is approximately 85 fs, we estimate that duration stretched to approximately 120 fs when incident on the sample because of the combined effect of the calcite polarizer and the microscope objective. The detection arm along the trans-illumination direction consisting of a 40mm focal length best form lens (Thorlabs LBF254-040-A) to collimate the second harmonic light followed by a zero-order half wave-plate polarizer combination to analyze the emitted second harmonic light. A long-pass dichroic mirror (Thorlabs DMLP650) filters out most of the incident light while reflecting 98% of the second harmonic light. A short focal length lens then focuses the beam through a narrow band-pass filter (Thorlabs FBH400-40nm) onto a fiber bundle coupled to an Andor imaging spectrometer (Shamrock 300i) equipped with a cooled CCD array (Newton).
A crystal plate taken from the crystal sample shown in
Figure 1 was mounted perpendicular to the laser beam and the surface was scanned for the most intense SHG signal. We acquired the second harmonic signal using the following protocol. At each position of the half-wave plate controlling the polarization of the incident beam, the analyzer half-wave plate was scanned over 180º. At each analyzer wave plate position the CCD signal was integrated for 1 second and the subsequent second harmonic light spectra were fit to a Gaussian profile as shown in Figure SI8 found in the supplementary information. The area under the Gaussian fit was taken as the total number of second harmonic signal counts.
3. Results and Discussion
3.1. Synthesis
The synthesis of Gly-L-AlaHIH
2O (Poly2) started from the cyclic form of the dipeptide (cyclo-Glycine-L-Alanine) as stated before and therefore the crystal growth conditions are different from those reported for Gly-L-AlaHIH
2O (Poly1). We have also attempted the synthesis of linear glycyl-L-alanine with HI in an aqueous solution as described for Gly-L-AlaHIH
2O (Poly2) using Cyclo Glycyl-L-alanine, but no crystals were ever formed. After complete evaporation of the solution, an oily residue was obtained. We conclude that Gly-L-AlaHIH
2O (Poly1) is only obtained following the procedure reported in reference [
1].
3.2. Crystal Structure
Gly-L-Ala.HI.H
2O (Poly2) crystallizes as yellowish prisms, in the monoclinic system, space group
P2
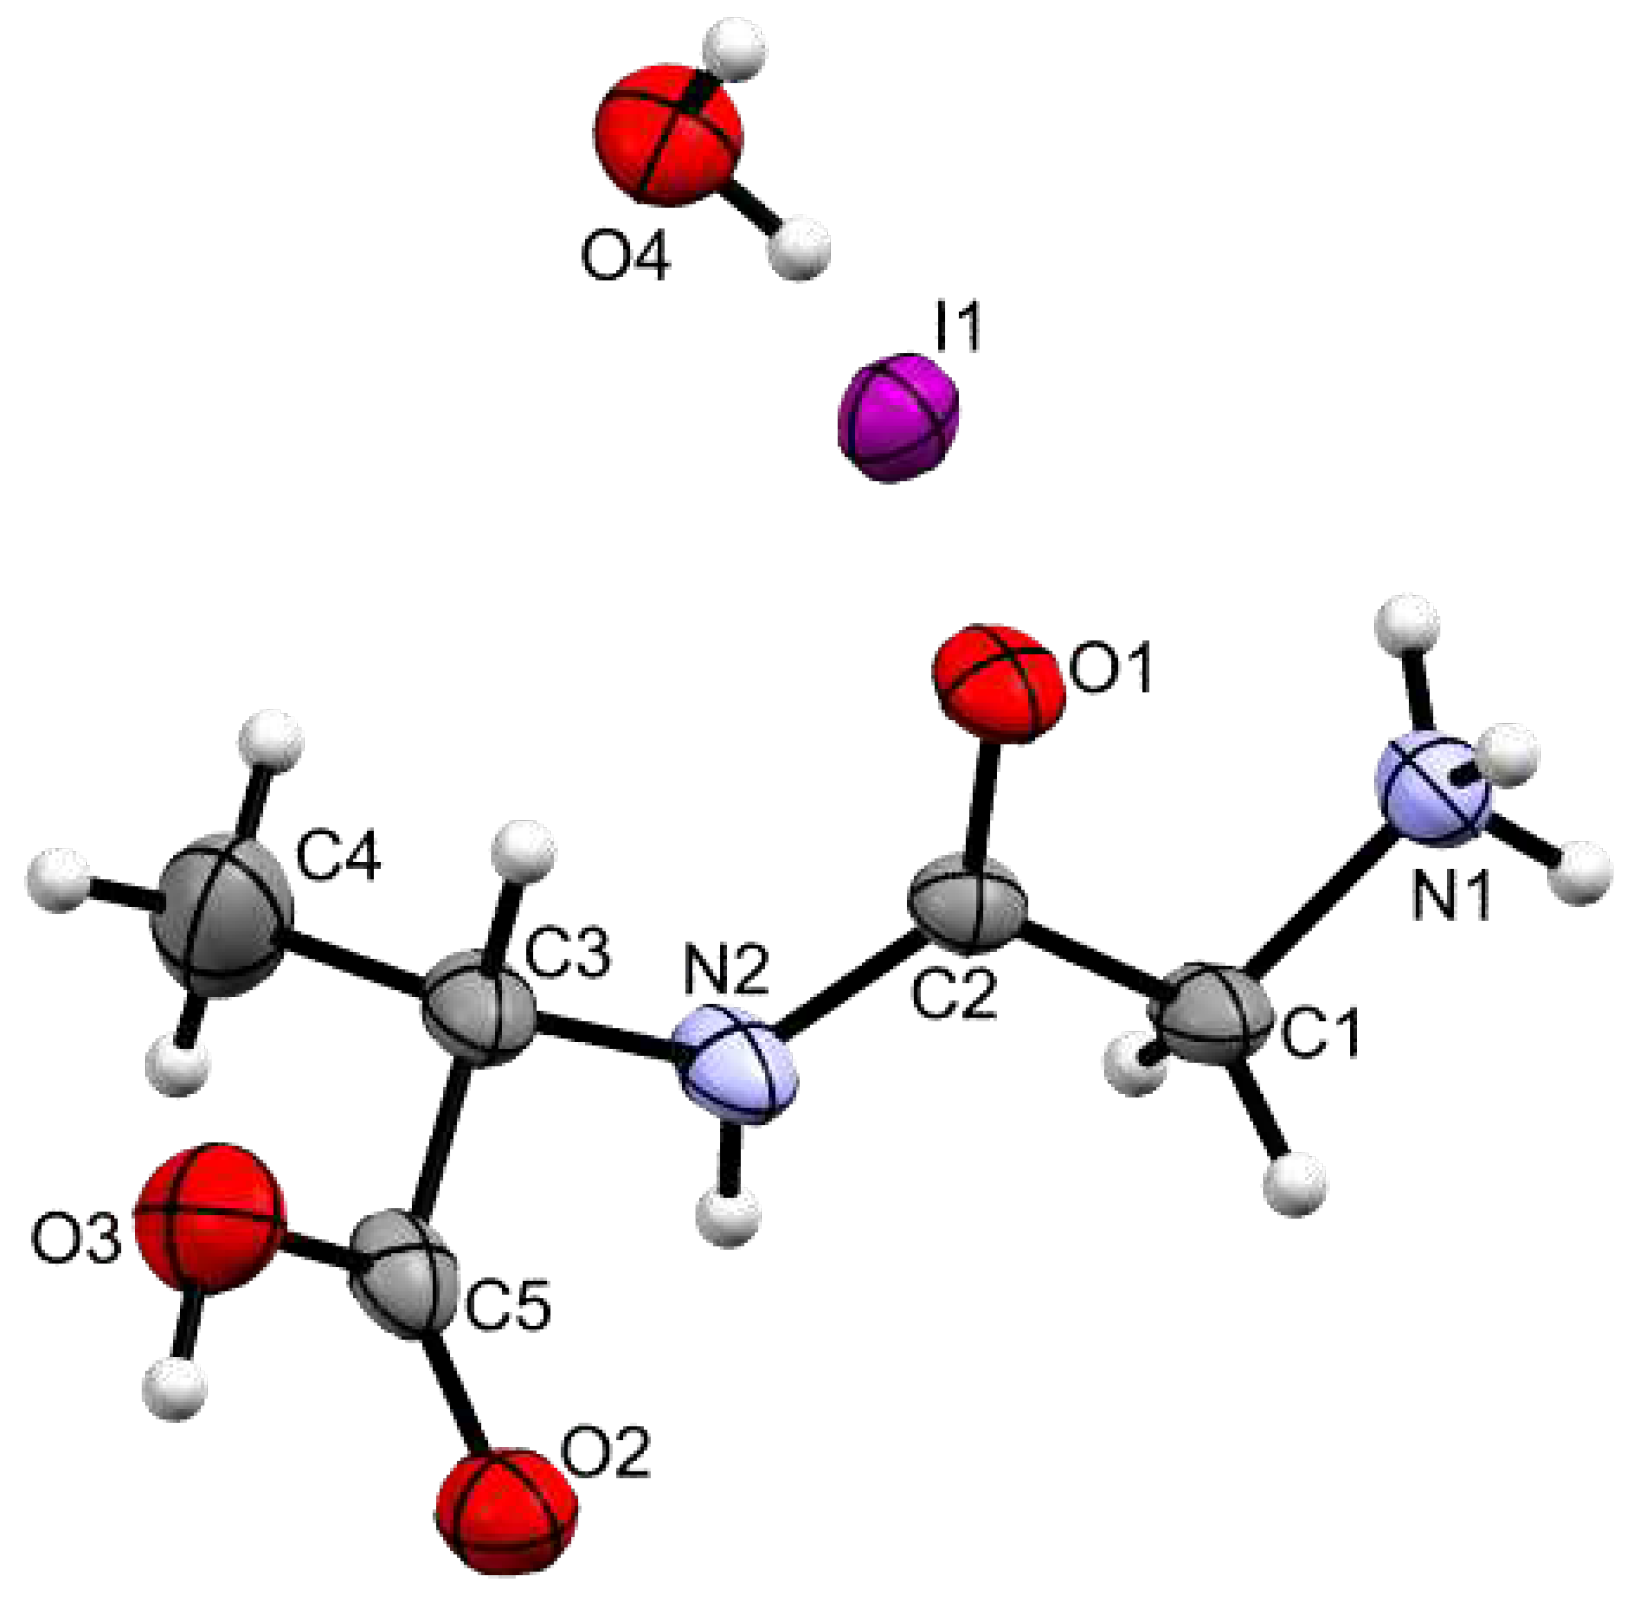
1, as a Glycine-L-Alanine hydroiodide salt with one water molecule. Its molecular structure is depicted in
Figure 3, and the most relevant bond distances and angles in the corresponding Figure caption and in
Tables SI1 and SI2 (Supplementary Information).
As referred above, Gly-L-Ala.HI.H
2O (Poly2) is a polymorph of Gly-L-Ala.HI.H
2O (Poly1) reported by Kehrer et al in 1989 [
1]. However, no crystal data could be found in the Cambridge Crystallographic Data Centre (CCDC) [
15] for graphical comparison. Both structures have comparable unit cells (a = 7.747(6) Å, b = 6.435(5) Å, c = 10.941(9) Å, α = 90 º, β = 107.53(3) º, γ = 90 ° for Gly-L-Ala.HI.H
2O (Poly2) vs a = 10.933(3) Å, b = 6.371(2) Å, c = 7.709(1) Å, α = 90 º, β = 107.29(1) º, γ = 90 ° for Gly-L-Ala.HI.H
2O (Poly1), but with axis
a and
c interchanged. The unit cell atomic coordinates are different in both crystals, the more evident being the location of the iodide anion that in Gly-L-Ala.HI.H
2O (Poly1) has
y fixed at
and in Gly-L-Ala.HI.H
2O (Poly2) is at
.
In
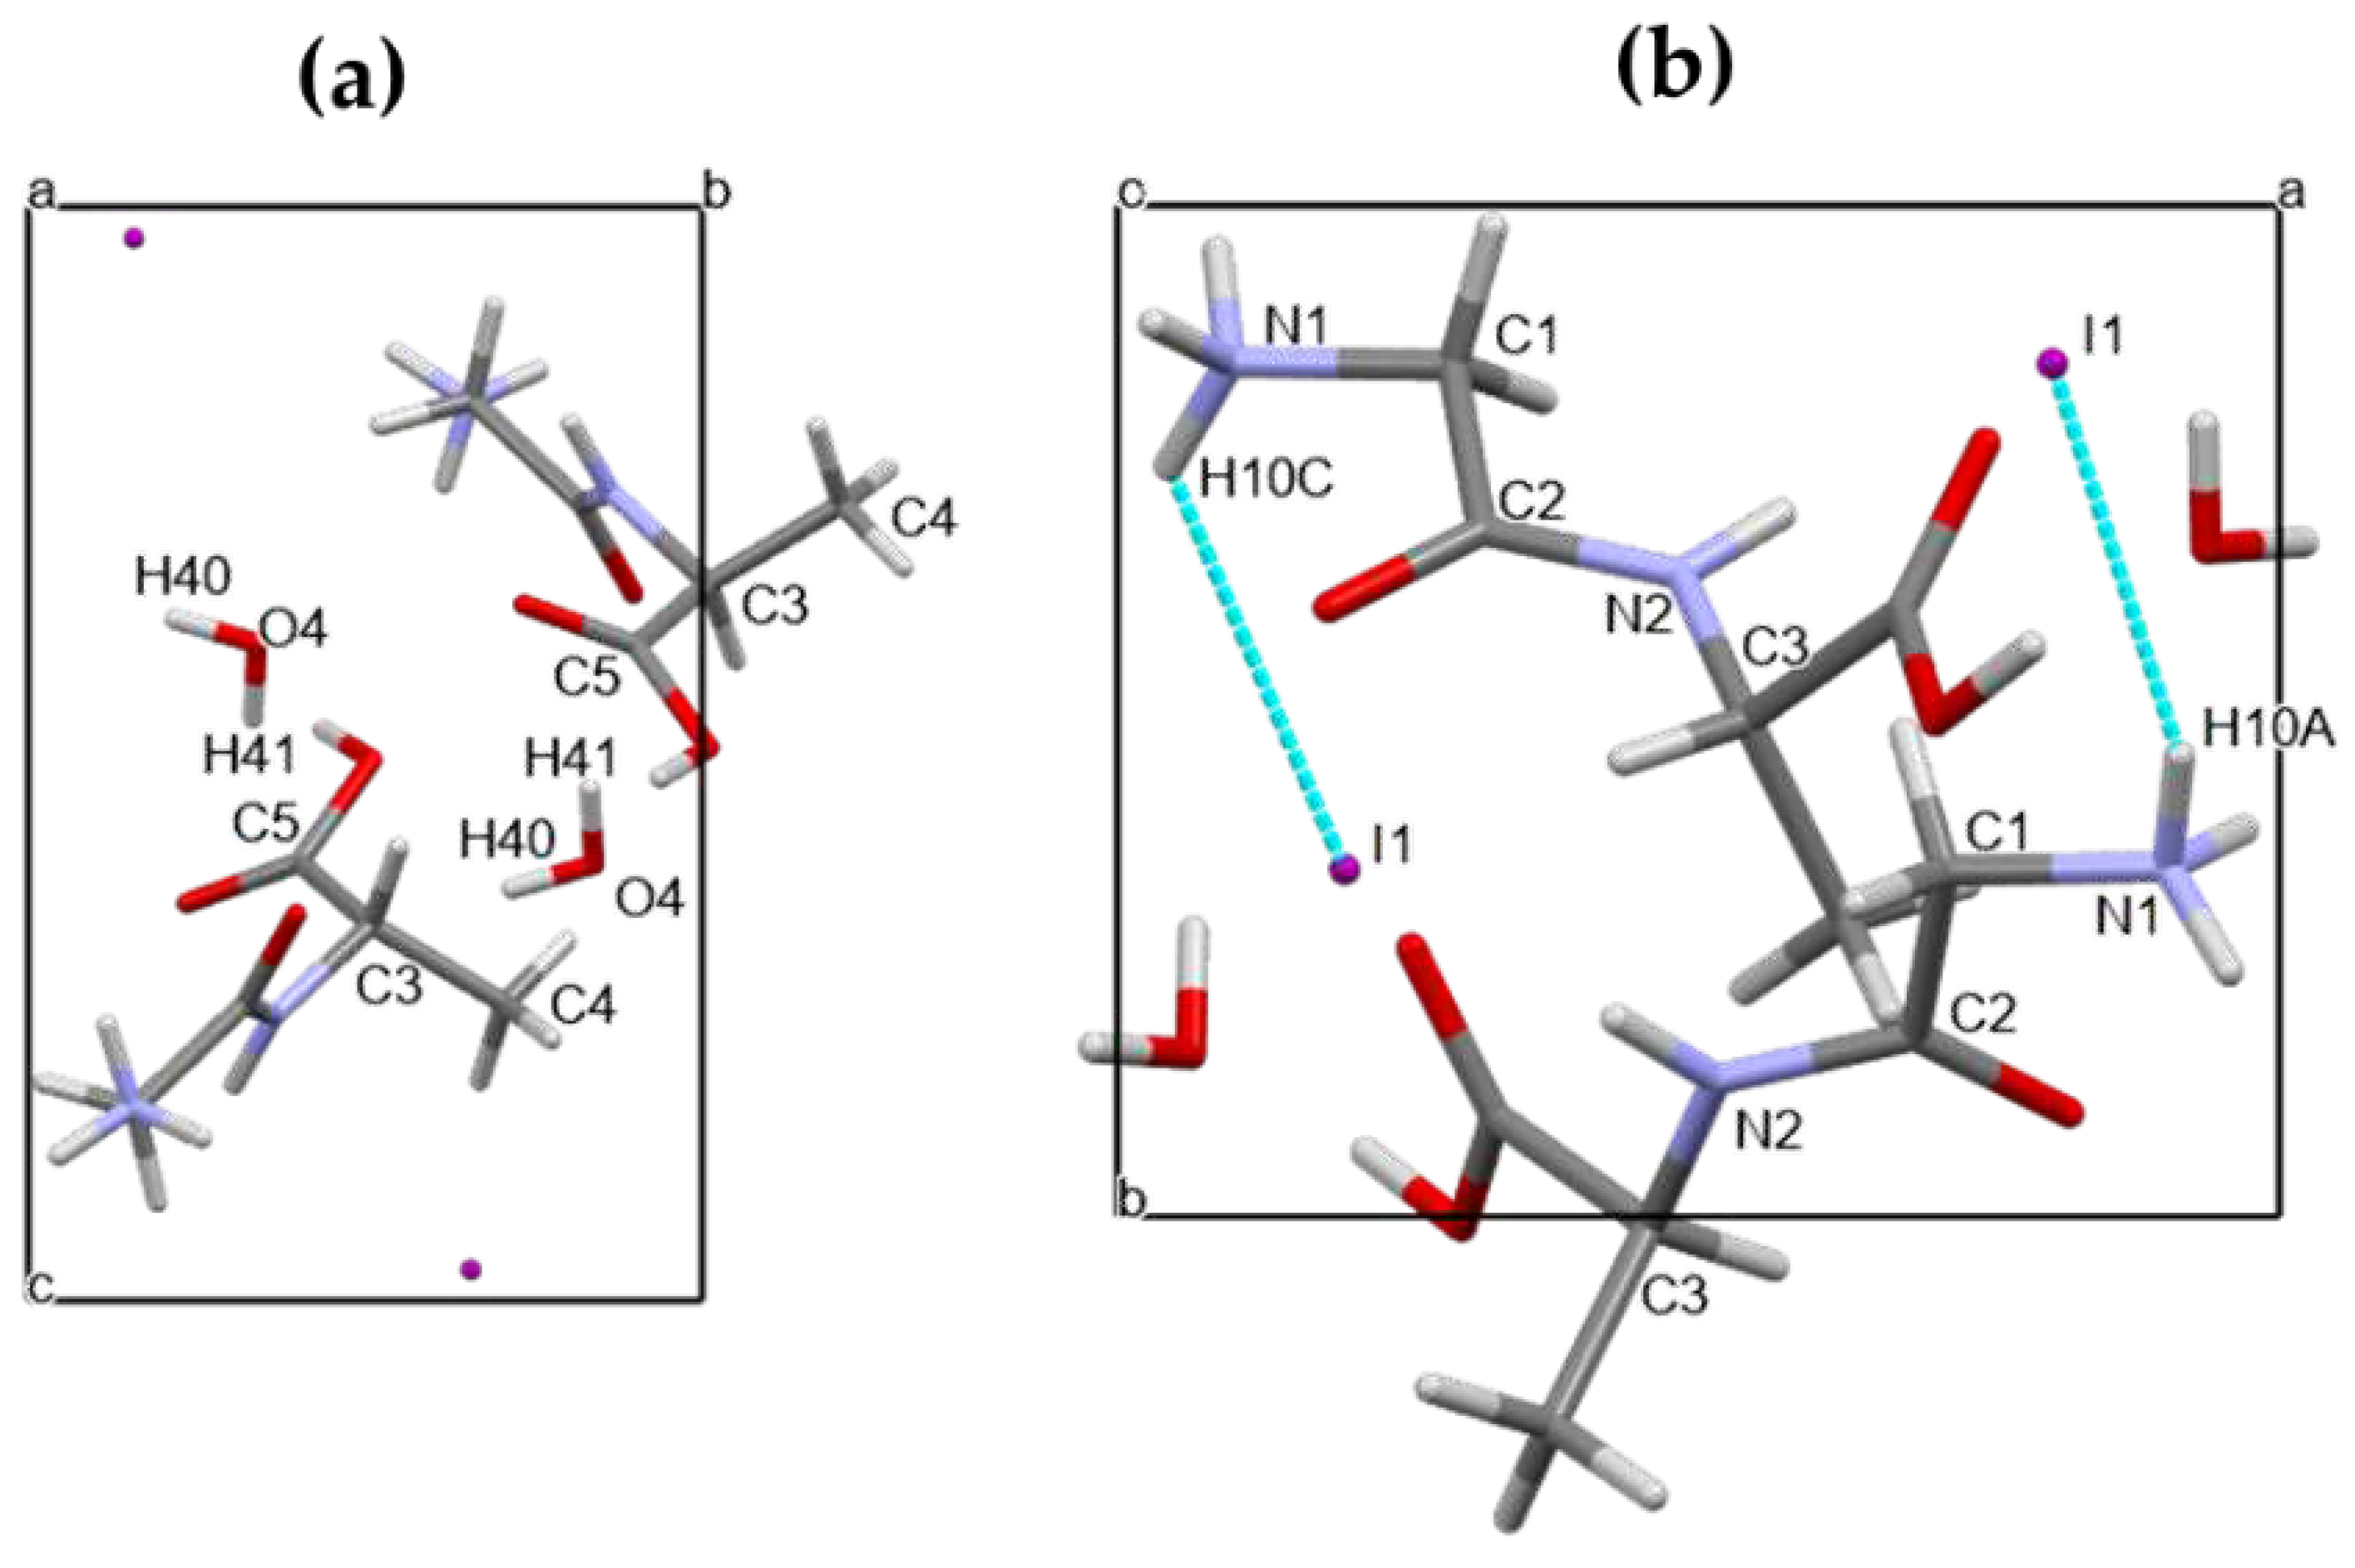
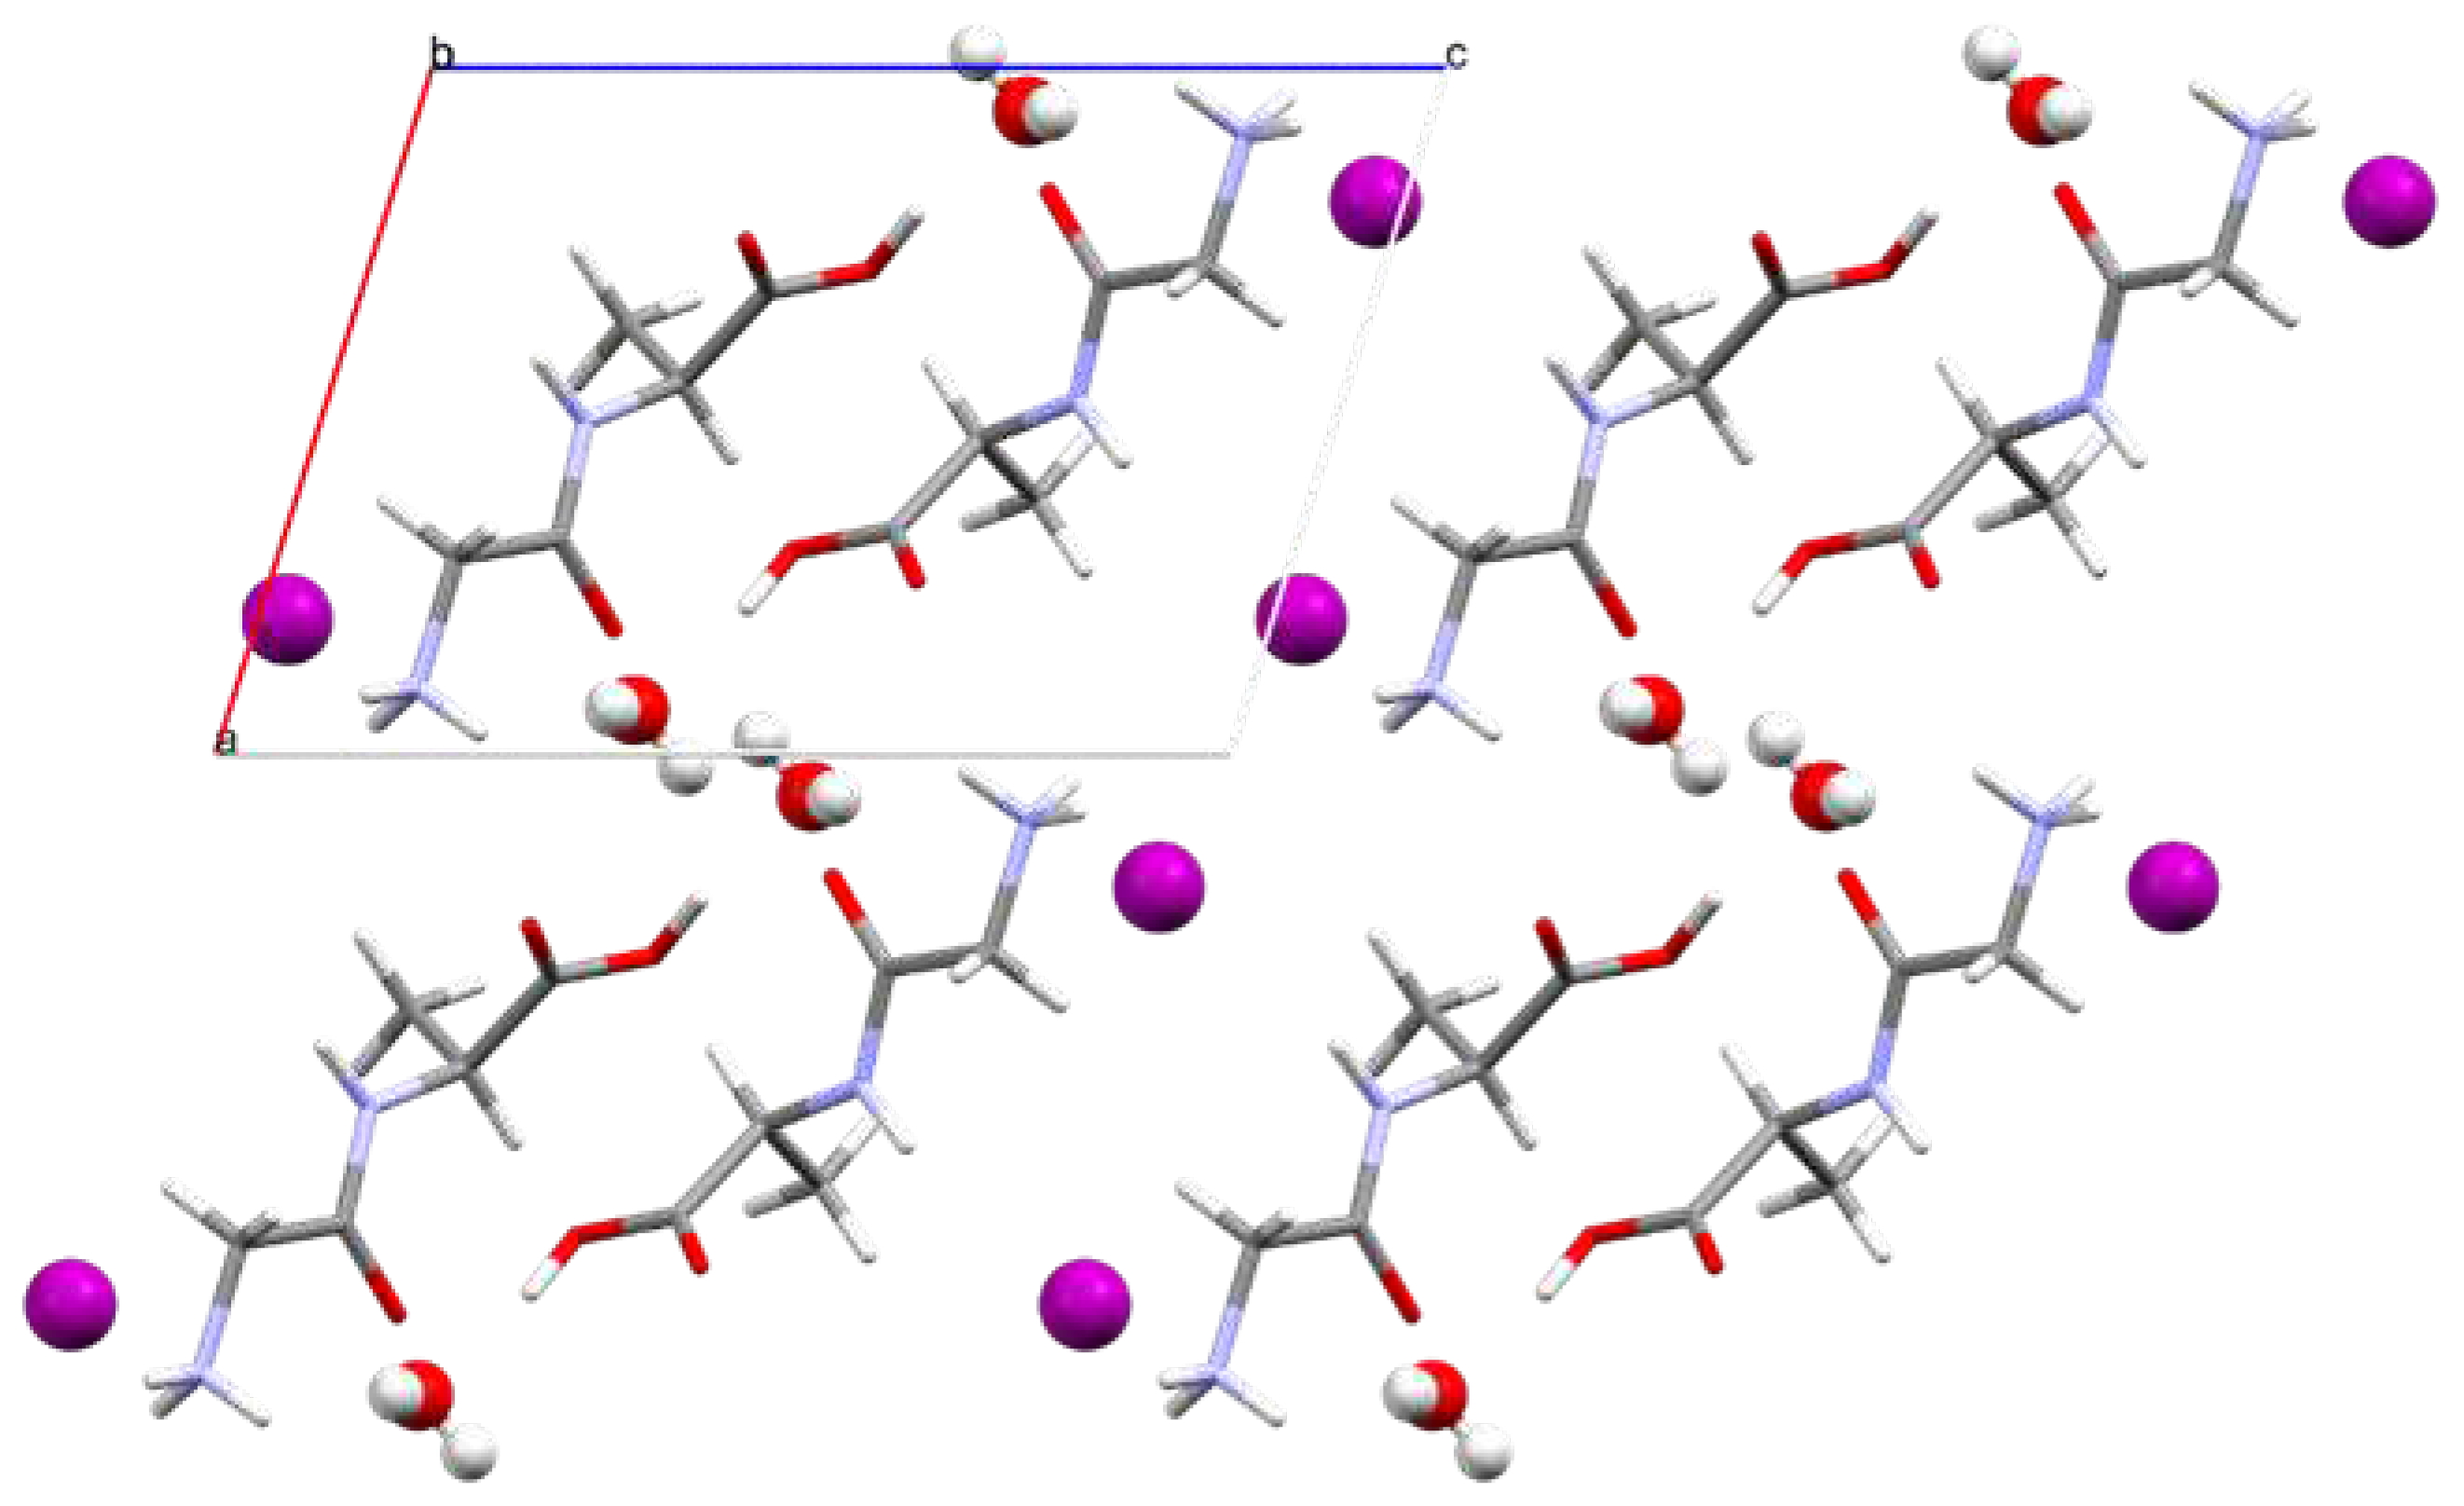
Figure 4 a) and b) below it is shown for Gly-L-Ala.HI.H
2O (Poly2) a projection of the crystal structure down the crystallographic axis
a and
c, respectively. Comparing these figures with those depicted in ref (1) one can see that although the unit cell parameters are similar the atom positions are different. The 2
1 polar axis is parallel to the crystallographic
b axis, as shown in Figure SI1. If we consider a partial electrical dipole formed by C5-C3-C4, this dipole points in the 2
1 polar axis direction with an inclination of around 30 °,
Figure 4 a). Moreover, the dipeptide backbone N1-C1-C2-N2-C3 also forms a partial electrical dipole inclined also
ca. 45 ° to the 2
1 polar axis,
Figure 4 b).
The ammonium group (N1) displays a slightly distorted tetrahedral geometry, with the N–H distances within the group varying between 0.885(3) and 0.880(3) Å. On the other hand, the carboxylate group shows two distinct C–O bond lengths (C4–O2 1.221(7) and C4–O3 1.316(7) Å), clearly indicating that the group is in the carboxylic acid form and allowing the assignment of the carbonyl and O–H substituents.
The main chain of the molecule presents an almost planar
trans conformation between atoms N1 and C3 (Figure SI3), with torsion angles of 167.9(5) ° for N1−C1−C2−N2 and 177.7(5) ° for C1−C2−N2−C3. In Poly2, the angle for C4−C3−N2−C2 is 111.0(6) °. The torsion angle of -77.12º in C4-N1-C2-C1 from [
9] indicates a gauche conformation.
The supramolecular arrangement observed in the crystal structure of Gly-L-Ala.HI.H
2O (Poly2), when viewed along the b axis (ac plane), shows consecutive layers of iodide anions and peptide cations parallel to the
b axis (
Figure 5), with the peptide cations are in an anti-parallel fashion.
This 3D-arrangement is further stabilized by the presence of water molecules that interact with the peptide moieties through intermolecular hydrogen bonds within the asymmetric unit and with other symmetry generated cations. Moreover, all remaining hydrogen atoms bonded to electronegative O or N atoms, participate in either classical (N–H…O and O–H…O) or non-classical hydrogen bonds (N–H…I and C–H…I), as presented in
Table 1.
The iodide anion is involved in three H-bonds, one of them within the asymmetric unit. The same applies to the three ammonium H-atoms, which are involved in two N–H…I non-classical H-bonds (H10A and H10C), while H10B participates in two classical H-bonds, with the water molecule (O4) and with the carbonyl (O2) of the carboxylate group. On the other hand, oxygen O1 simultaneously accepts two H-bonds from H40 and H41 of two water molecules.
The ammonium group (N1) displays a slightly distorted tetrahedral geometry, with the N–H distances within the group varying between 0.885(3) and 0.880(3) Å.
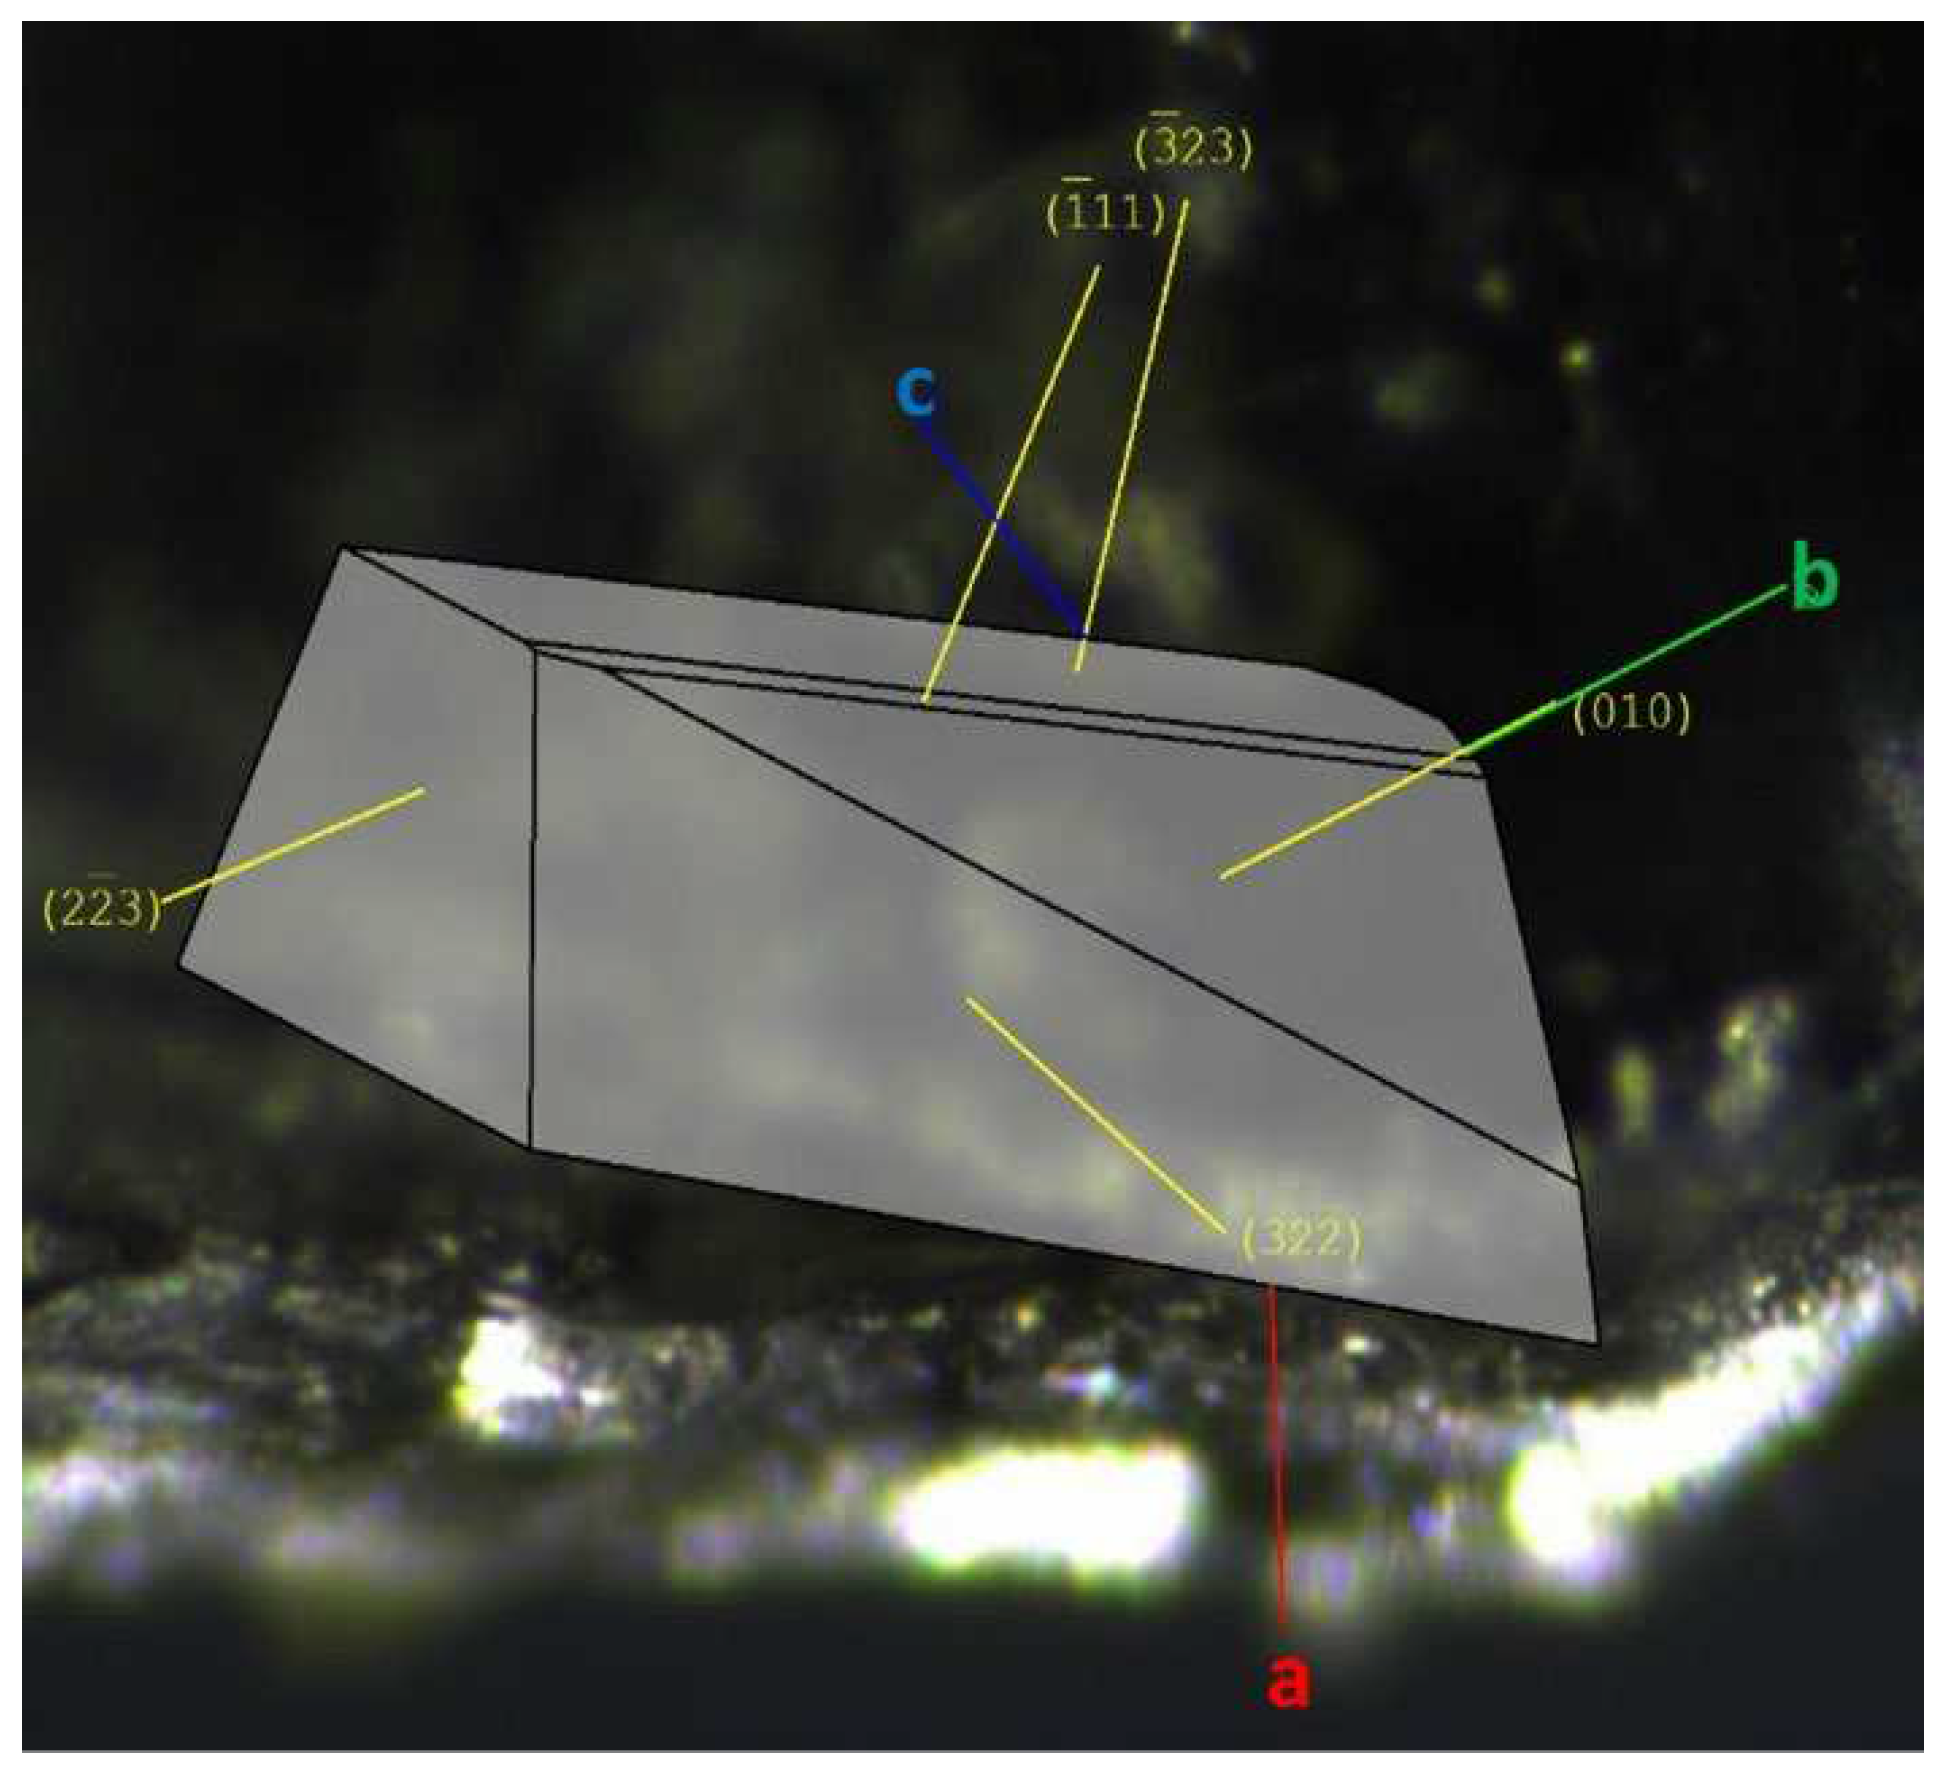
The faces of Gly-L-Ala.HI.H
2O (Poly2), used for characterization studies and crystal structure determination, with the assigned Miller indices, are indicated in
Figure 6 a). The crystal complete morphology is depicted in Figure SI2.
3.3. Pyroelectric properties
The pyroelectric coefficient is a vector quantity with three components (
For space group P2
1, with the 2-fold screw axis along
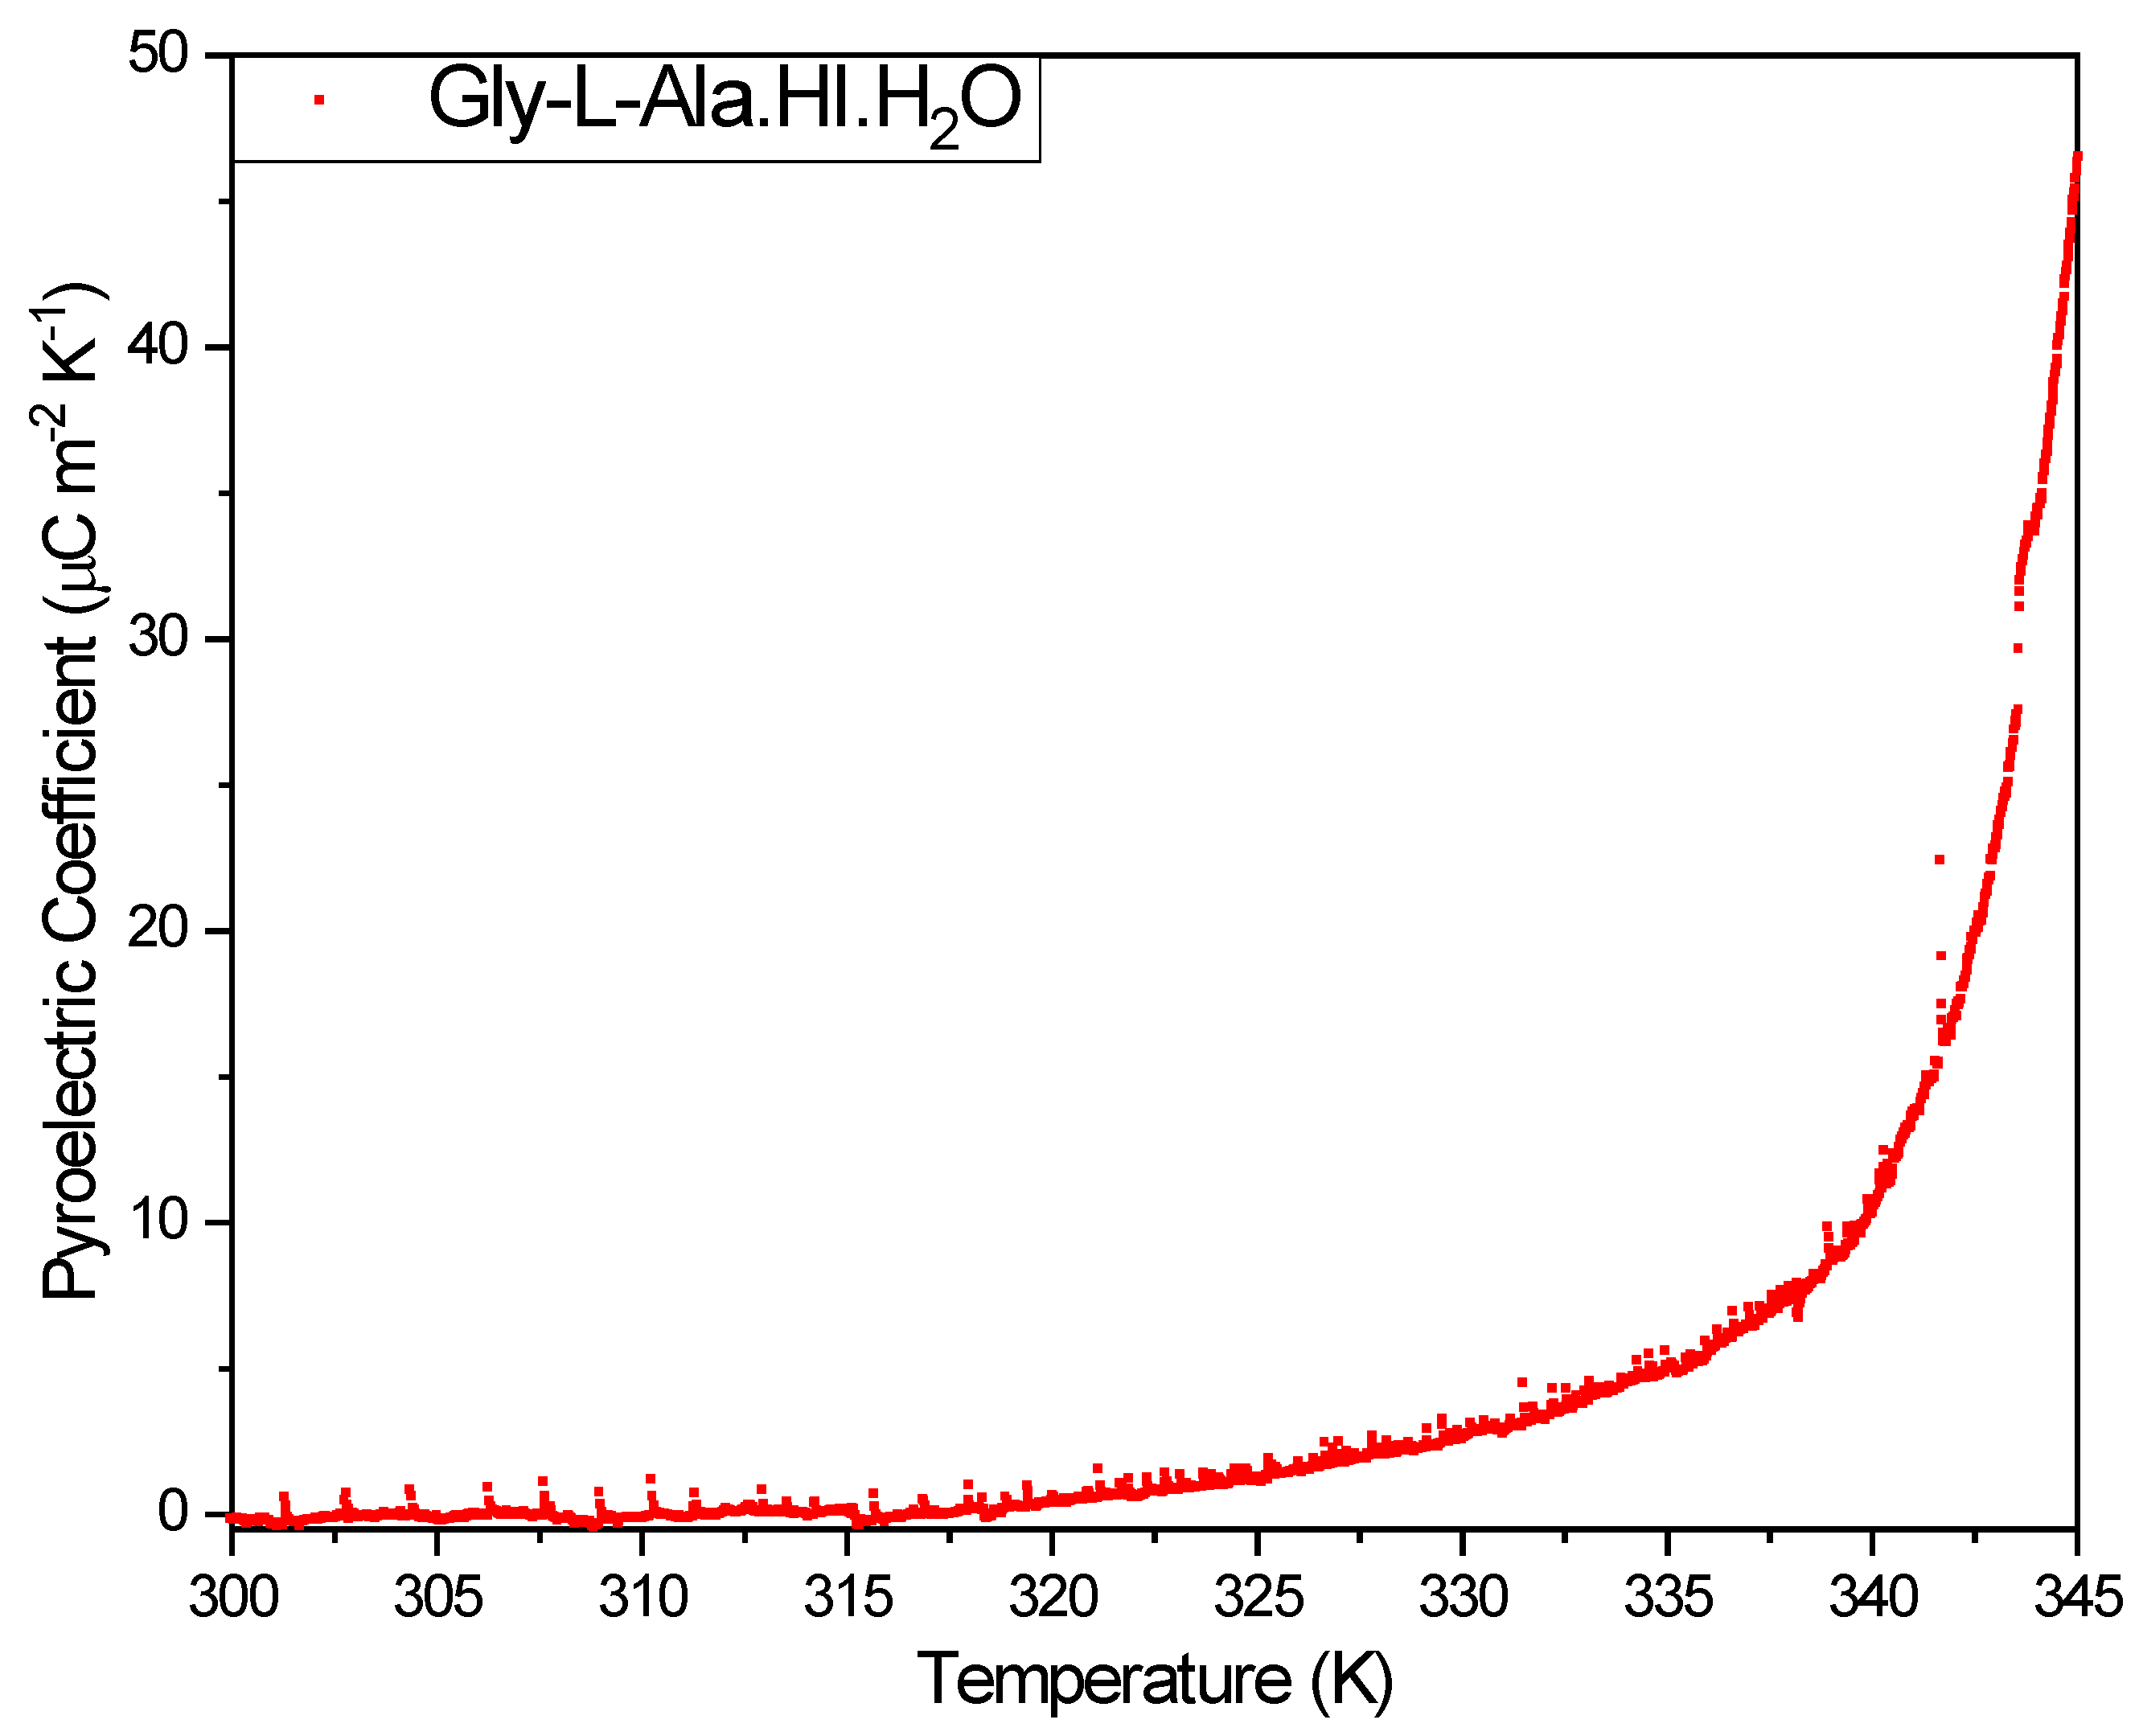
b-axis, the vector has only one component along that crystallographic axis. The pyroelectric coefficient reported in this work was measured on a (010) orientated Gly-L-Ala.HI.H
2O (Poly2) crystal plate. Its value reached a maximum of
at 345 K, as shown in
Figure 7. The pyroelectric coefficient along the polar 2-fold axis reported for the Gly-L-Ala.HI.H
2O (Poly1) polymorph varied between
at 100 K and
at 357 K [
2]. Therefore, the pyroelectric coefficient of Poly2 is roughly three times bigger than that reported to Poly1. That is due to the different crystal structure arrangements inside the crystalline unit cell. In
Table 2, the pyroelectric coefficient of some important inorganic and semi-organic crystals is presented.
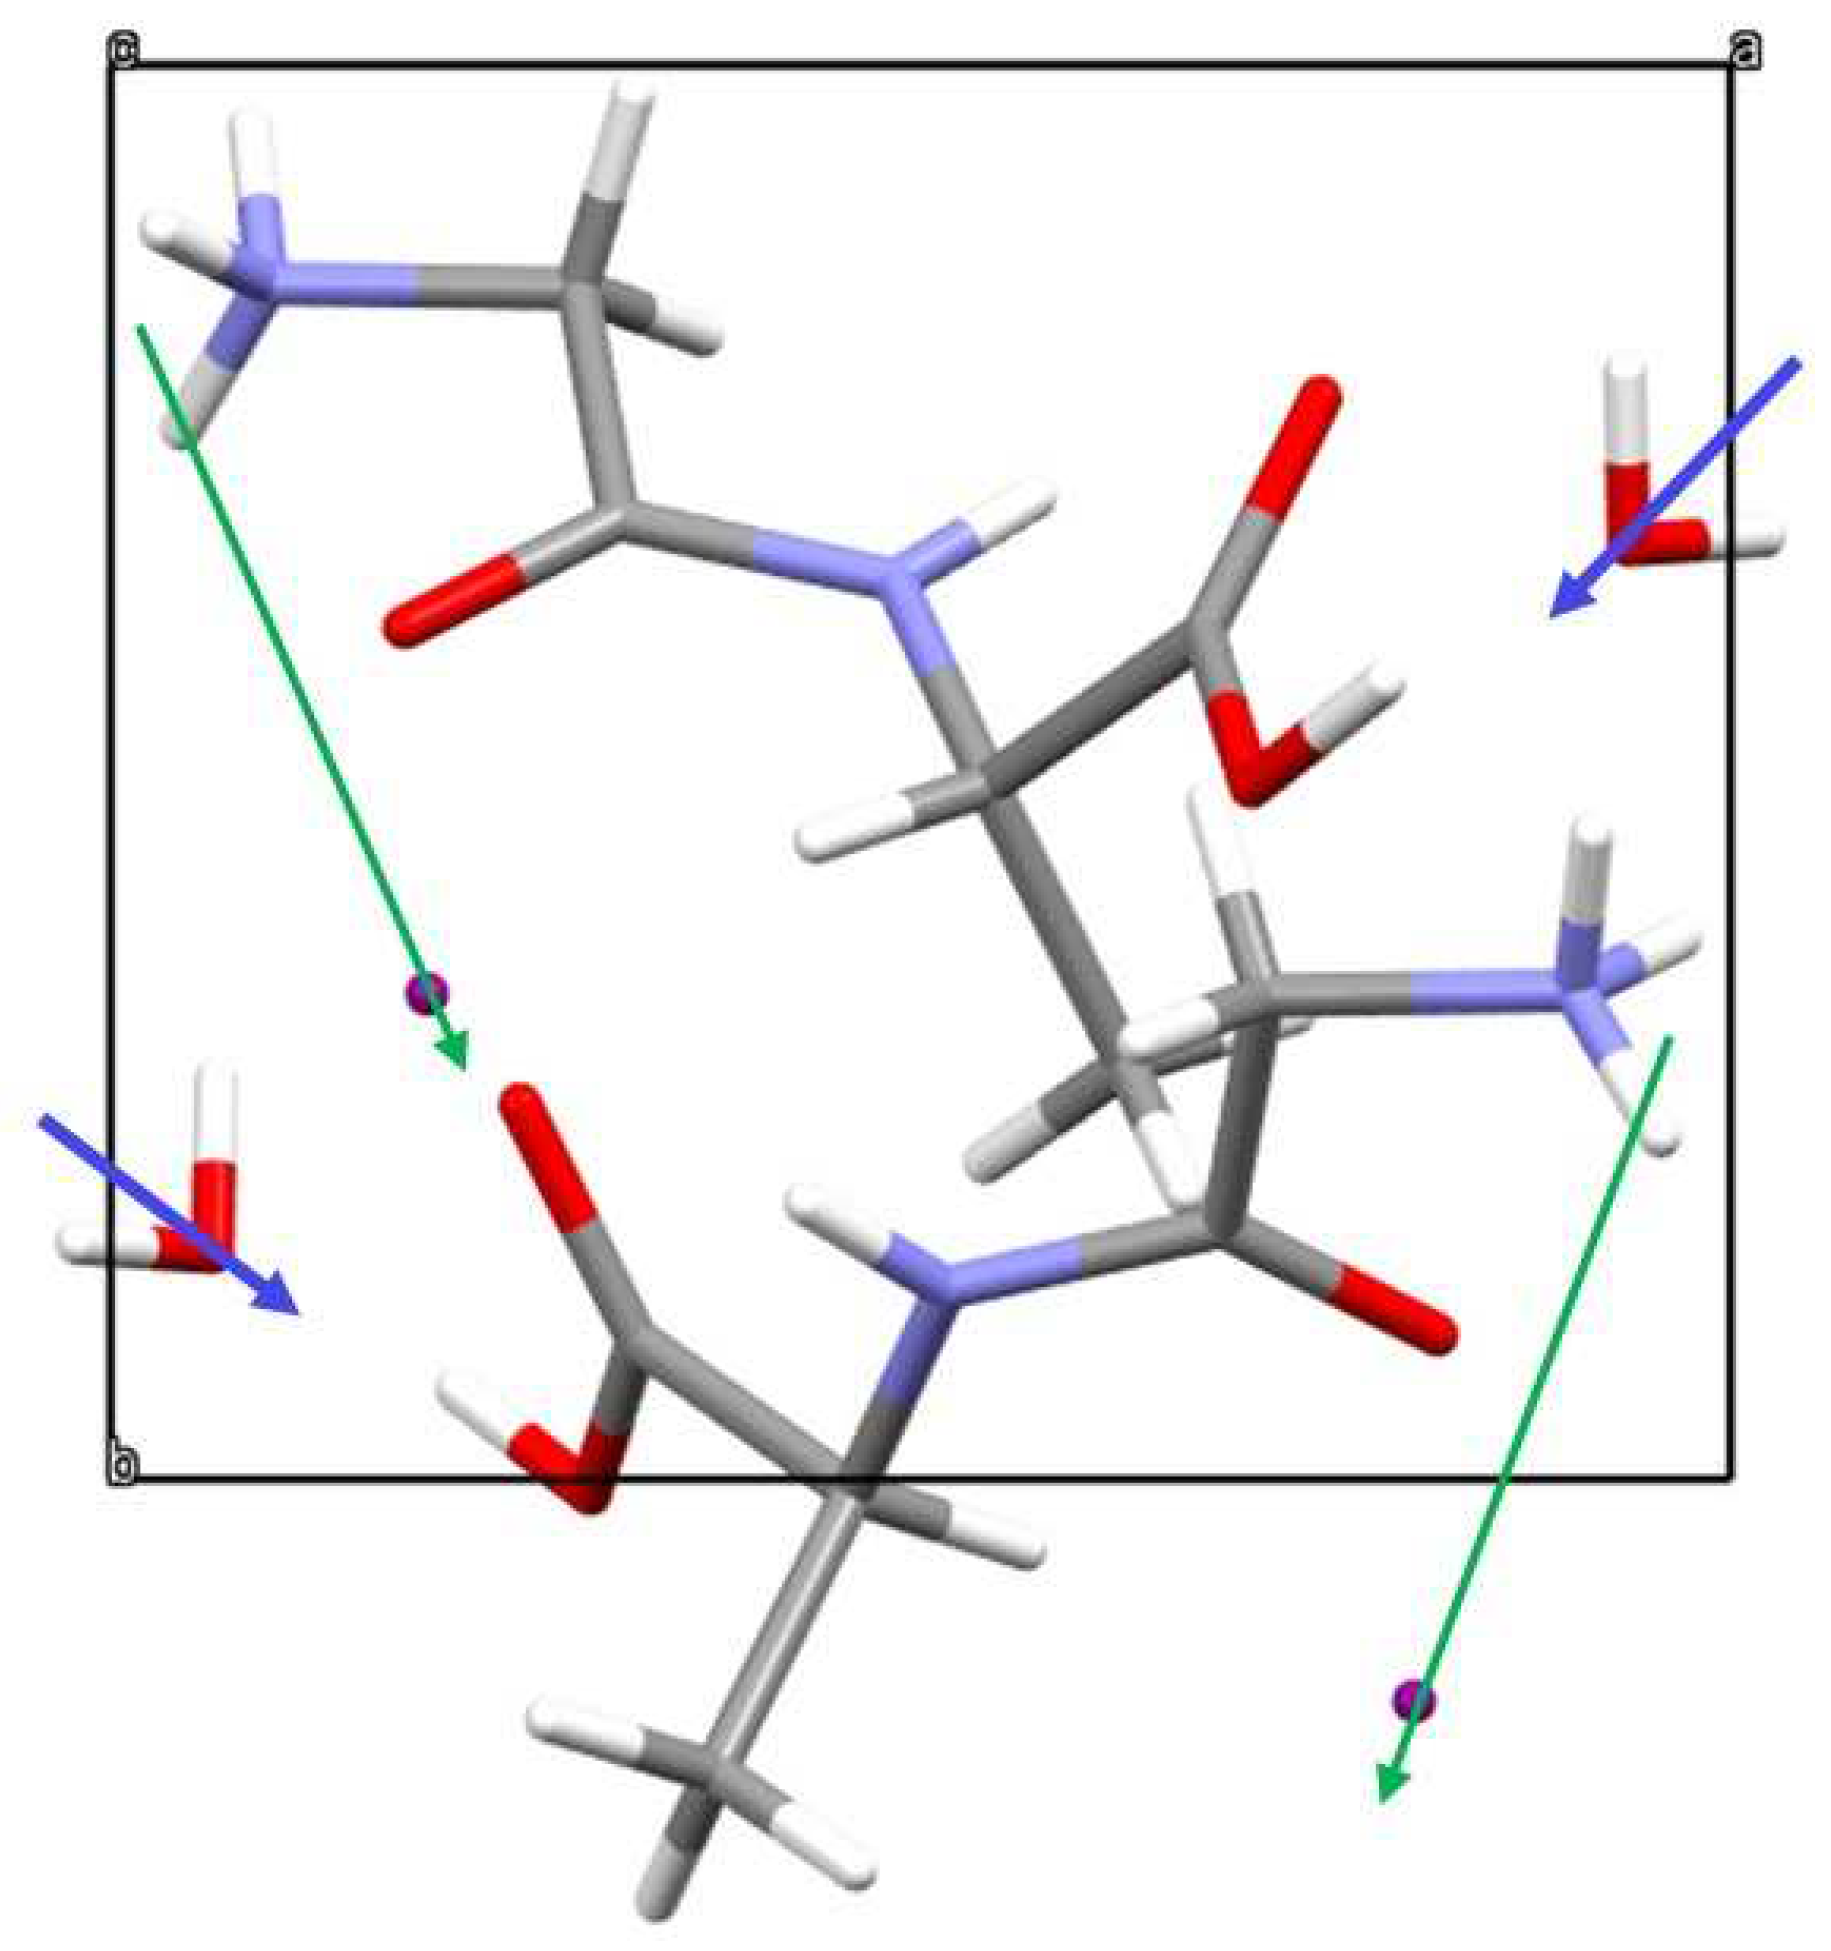
There are in the crystal unit cell of Gly-L-Ala.HI.H
2O (Poly2) four dipole moments: two from the water molecules and another two formed by
…
, as shown in
Figure 8. The first two dipoles form an angle of approximately
with the polar
b axis while the other two dipoles
…
) form an angle of approximately
. For Gly-L-Ala.HI.H
2O (Poly1) similar dipoles are identified from the reported structure. However the water dipoles are inclined to the b axis by 45º [
2]. Additionally, for
…
the bond length in Poly1 (
) is shorter than the corresponding bond length in Gly-L-Ala.HI.H
2O (Poly 2) (
As a consequence the overall net dipole moment contribution is higher for Poly2 than for Poly1, which explains the higher value of the pyroelectric coefficient reported in this work.
3.4. Thermal Properties
TGA measurement results indicate that the crystal mass is stable up to 380 K. A small initial mass loss of 2% happens at 388 K that results from water molecules evaporation [SI, Figure SI4], which is also visible in the DSC at 386 K [SI Figure SI5] At around 393 – 413 K, the iodine hydrogen bonds break, visible at the sharp enthalpy peak of the DSC (393 K), alongside with some mass loss. Above 473 K, there is a considerable loss of mass (about 50%), which corresponds to the decomposition of the crystalline compound. The peak at 533 K corresponds to the degradation temperature of the dipeptide glycyl-L-alanine. It is interesting to note that this temperature, 533 K, is very close to the melting temperature reported for cyclo-glycyl-L-alanine, which is 531 K and 32 K lower than that of linear glycyl-L-alanine dipeptide (563 K) [
20]. This suggests that although the dipeptide in Poly2 is not in its cyclic form, when crystallized as the present hydroiodide salt, it keeps a memory of its initial cyclic closed chain, therefore showing a thermal memory effect: one should remember that the crystal synthesis started from the cyclic dipeptide form and after reacting with the iodide acid the cyclic chain opened up.
3.5. Dielectric Spectroscopy
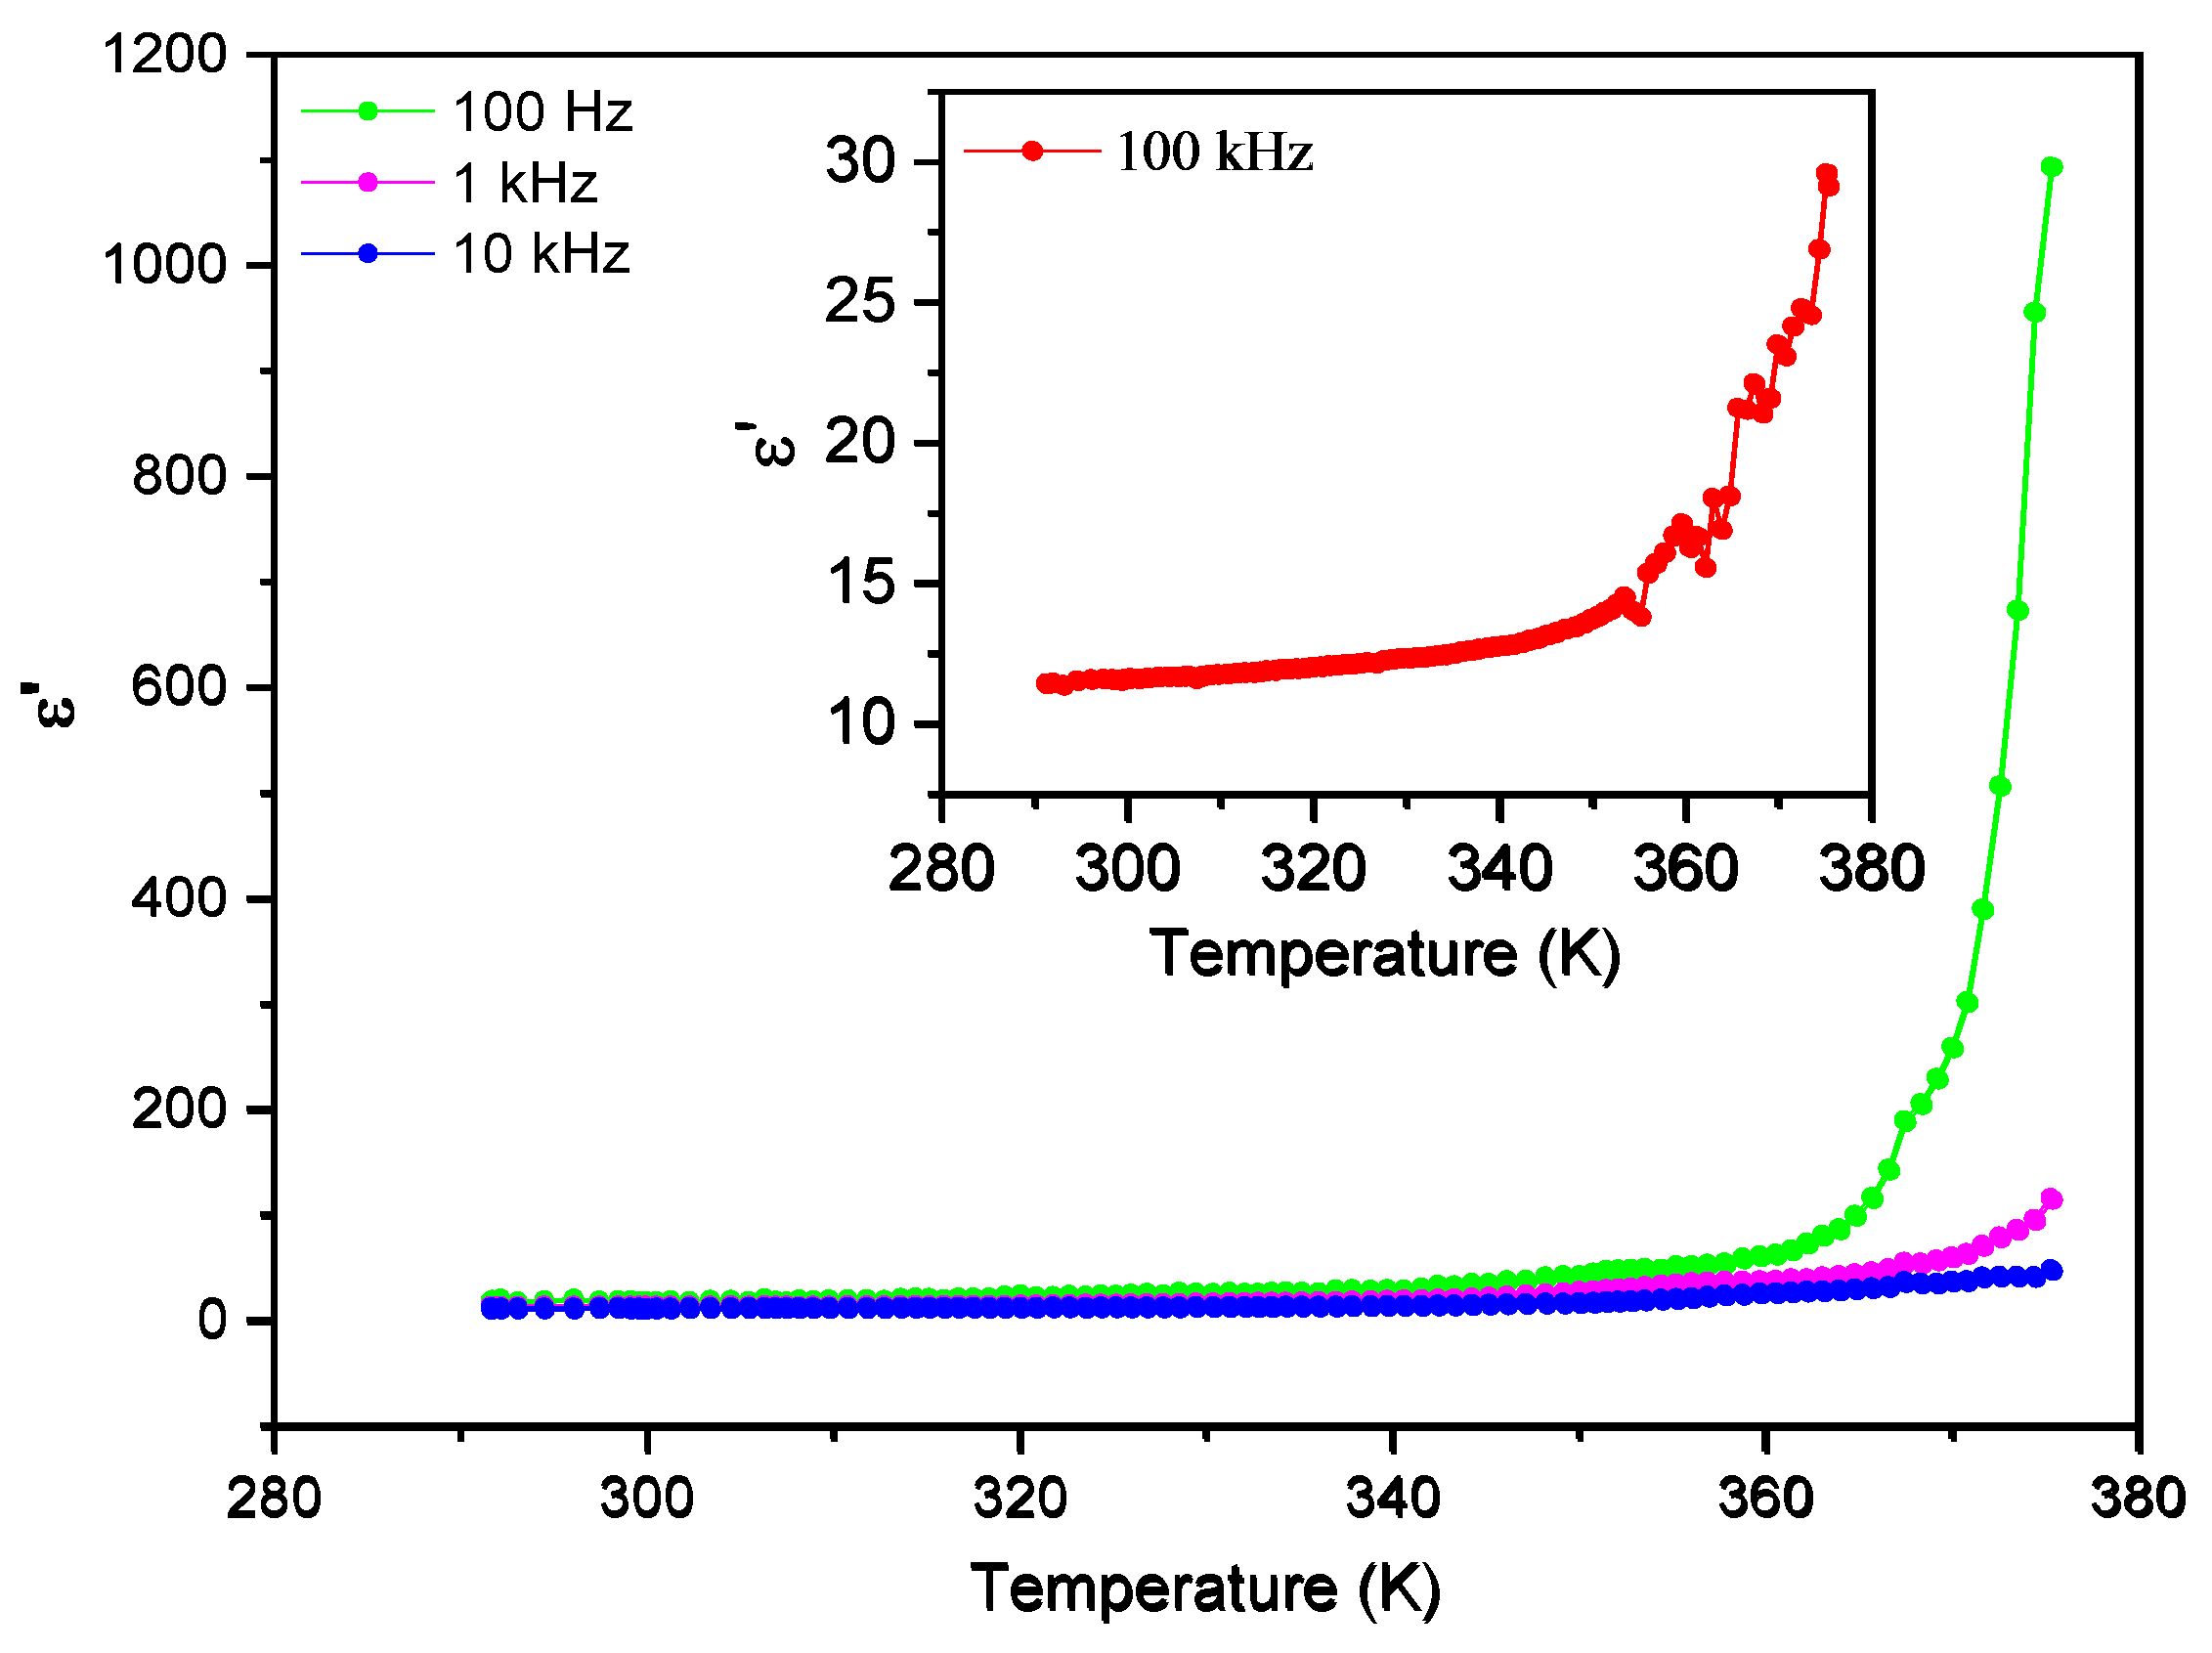
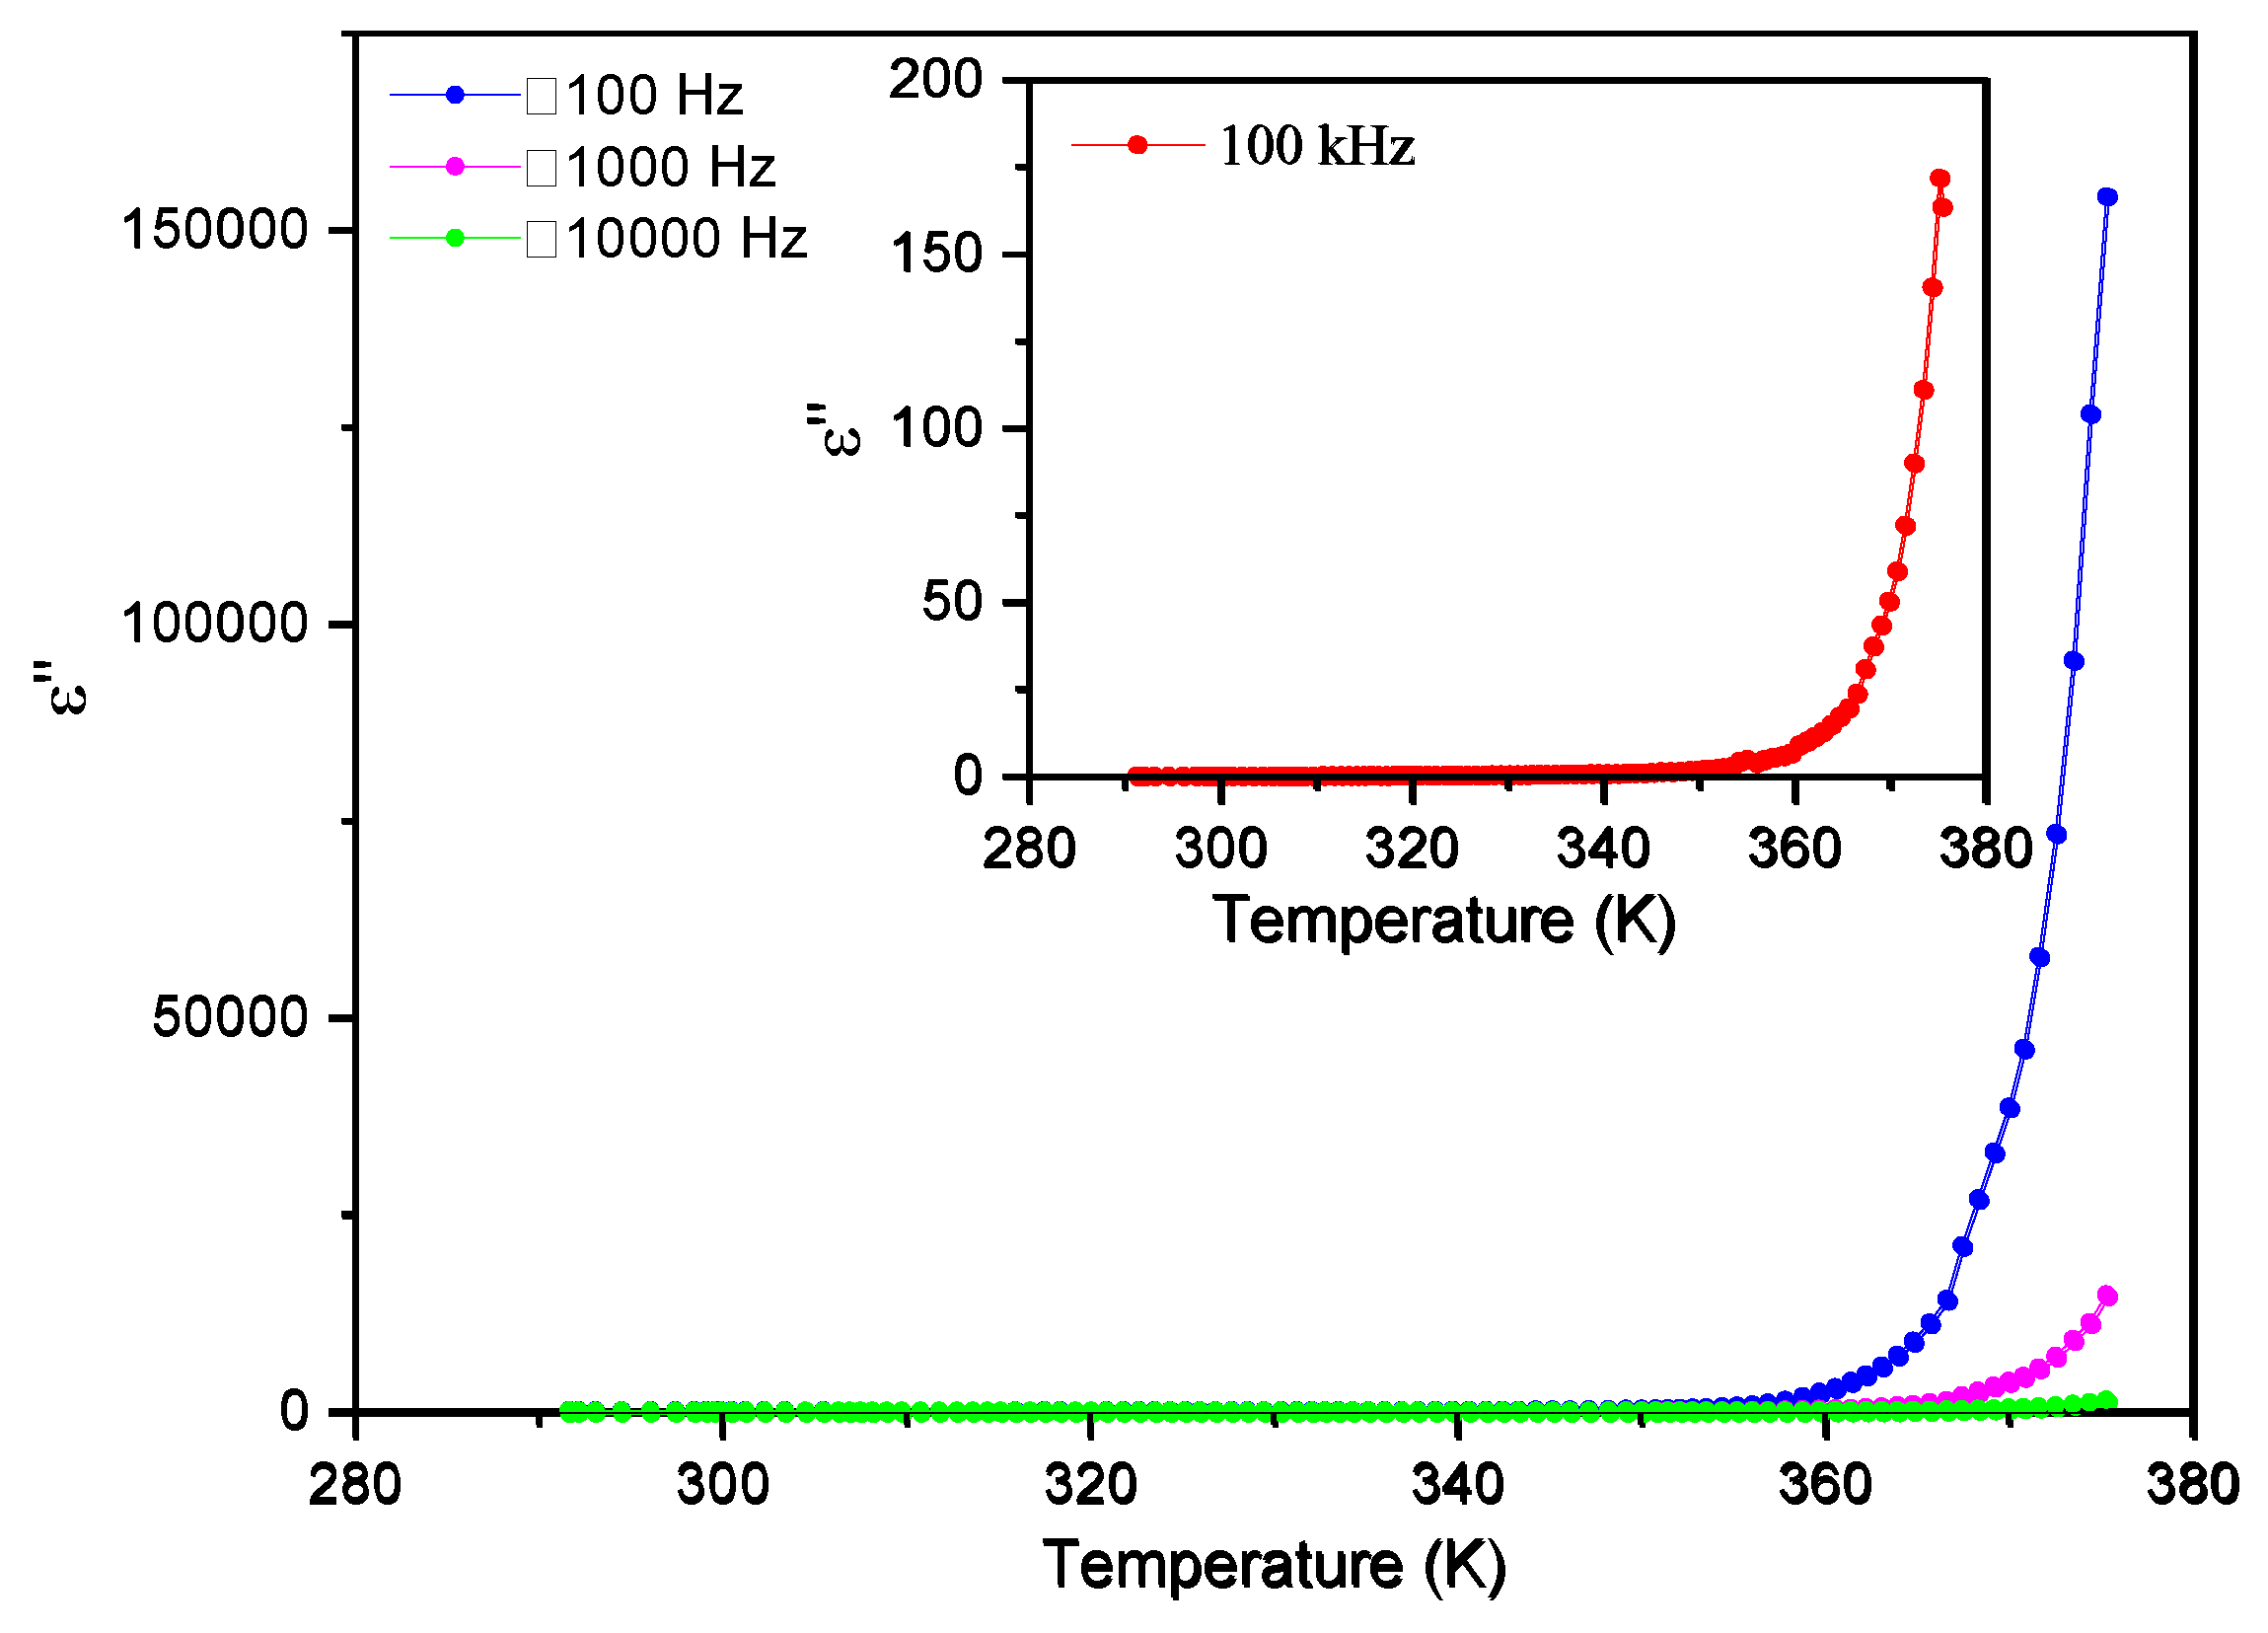
Figure 9 and
Figure 10 show the temperature dependence of the real (ε´) and imaginary (ε´’) parts of the dielectric permittivity measured in the range of 287 K – 370 K, for different frequencies from 100 Hz to 100 kHz. Two regimes are identified in both the real and imaginary parts of the dielectric permittivity, with a different dependence below and above 350 K. The real part of the electric permittivity is approximately constant and less than 100 from room temperature until 343 K, both for low and high frequencies. However, beyond 350 K it increases very steeply, reaching the value of 1100 for 100 Hz, as shown in
Figure 9.
Similarly, the imaginary part of the electric permittivity, ε´´, is also approximately constant until 350 K and smaller than 25 for all frequencies, as seen in
Figure 10. Again, it increases steeply beyond 350 K reaching 160 000 at T ~ 375 K, and a frequency of 100 Hz.
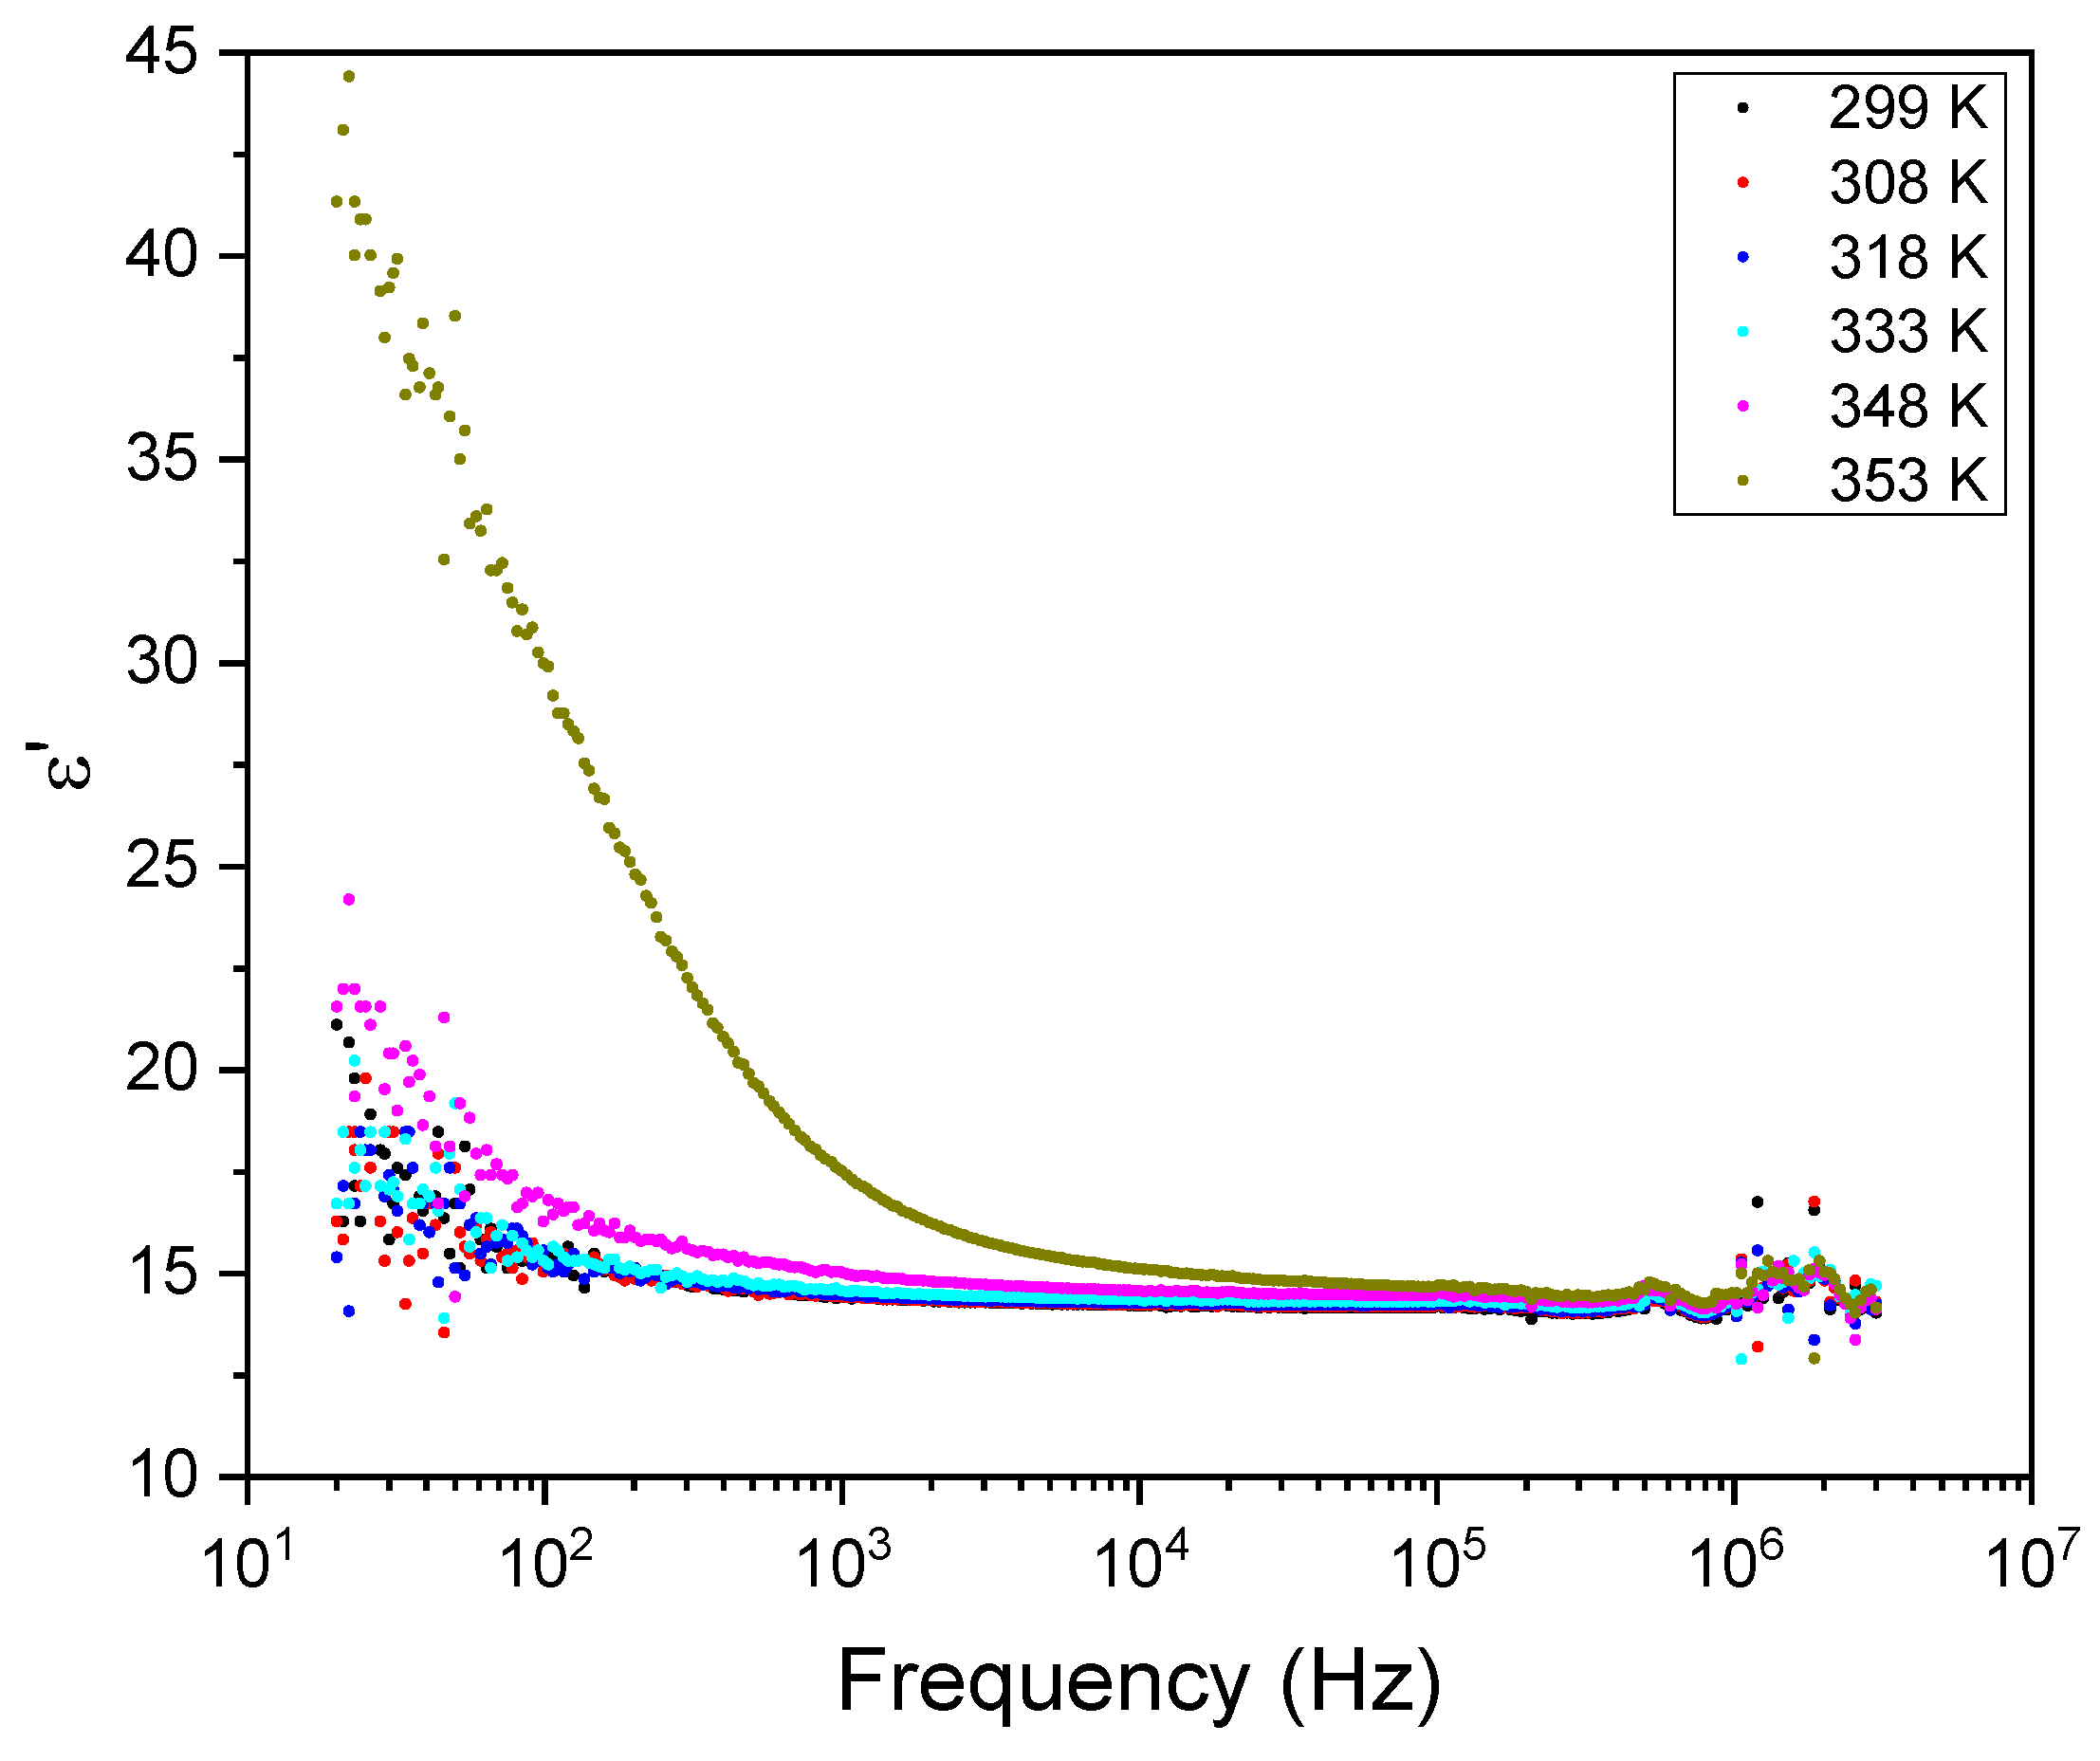
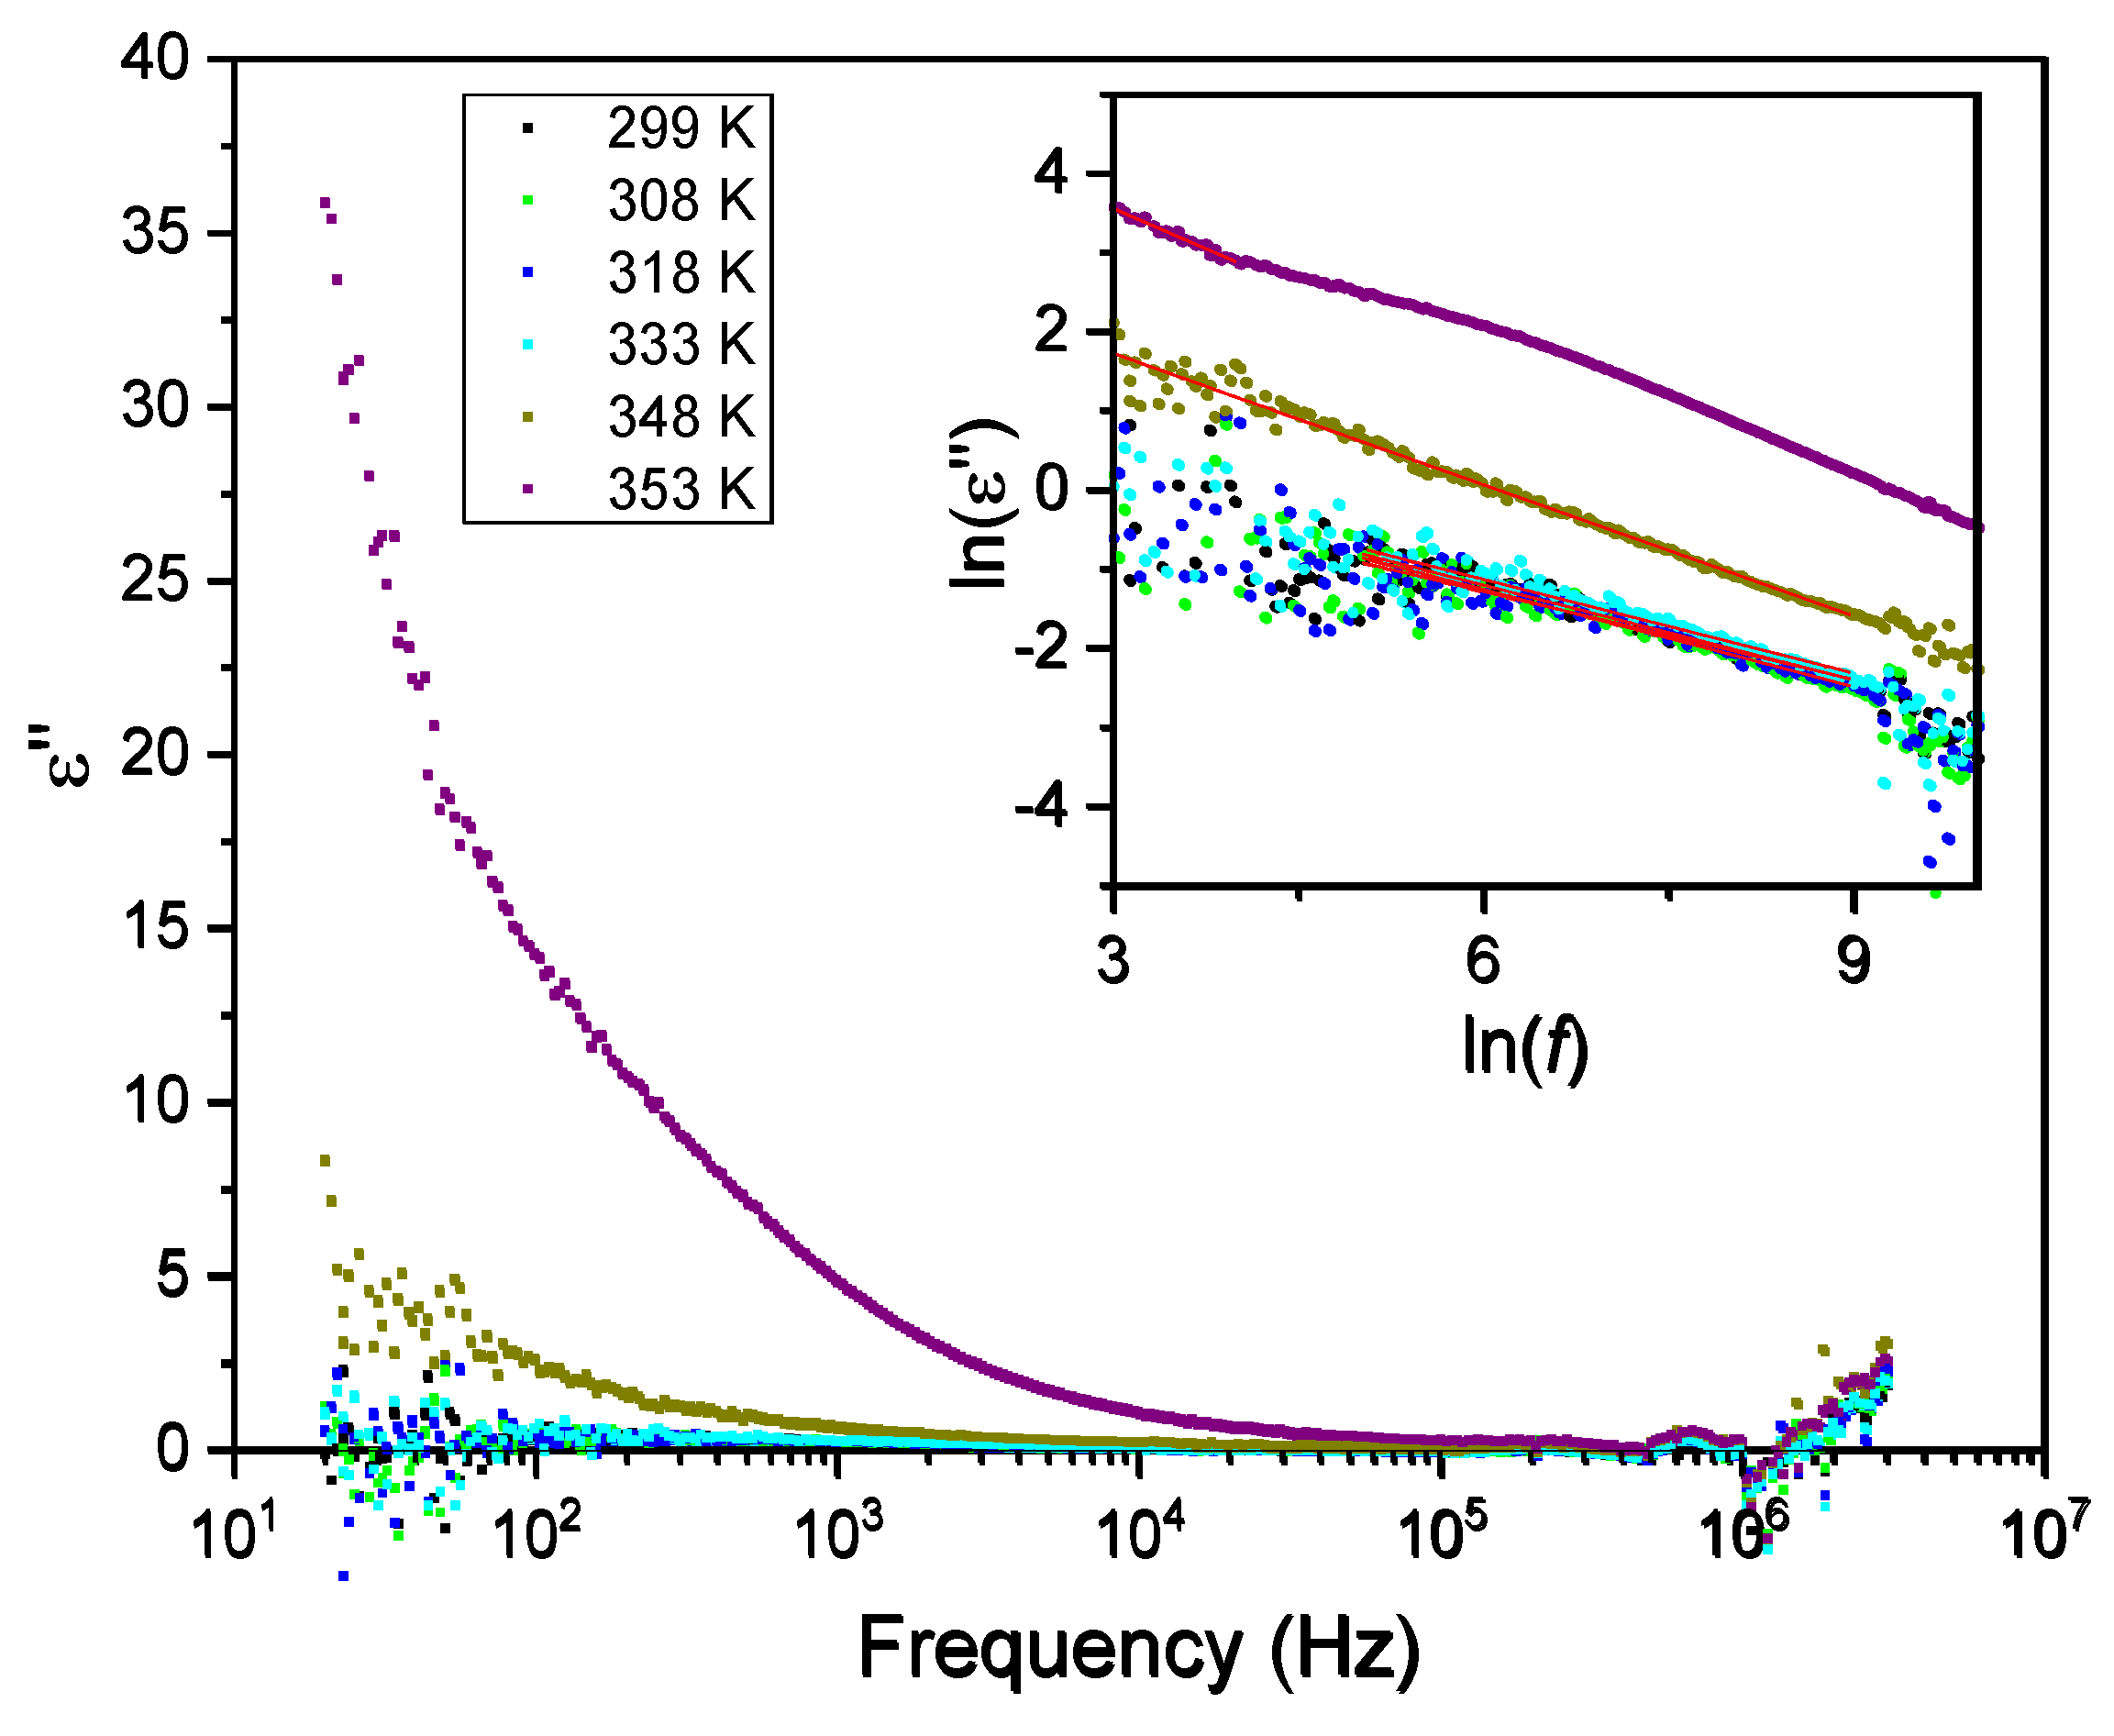
Figure 11 and
Figure 12 show the frequency dependence of the real and imaginary electric permittivity at different temperatures. Both ε´ and ε´´ present initially a sharp drop in the low-frequency region and afterward attain a slower decrease at high frequencies. The initial, low frequency drop in the imaginary part reveals a contribution from a conductivity term, as the samples are non-ideal capacitors.
For purely electronic conductivity, the permittivity is imaginary and given by ε''=
/(
ω) [
21], where
is the vacuum dielectric permittivity, ω is the angular frequency and
is the DC conductivity. For ionic charge carriers, which cause electrode or Maxwell-Wagner-polarization effects, this equation can be generalized, so that the conductivity contribution can be described by the equation ε''=
/(
ω
s), where
s is an exponent and
s ≤ 1. As such, since the logarithm of the imaginary component of the permittivity as a function of the logarithm of the frequency gives a linear dependence, it was fitted with a straight line to determine the conductivity according to:
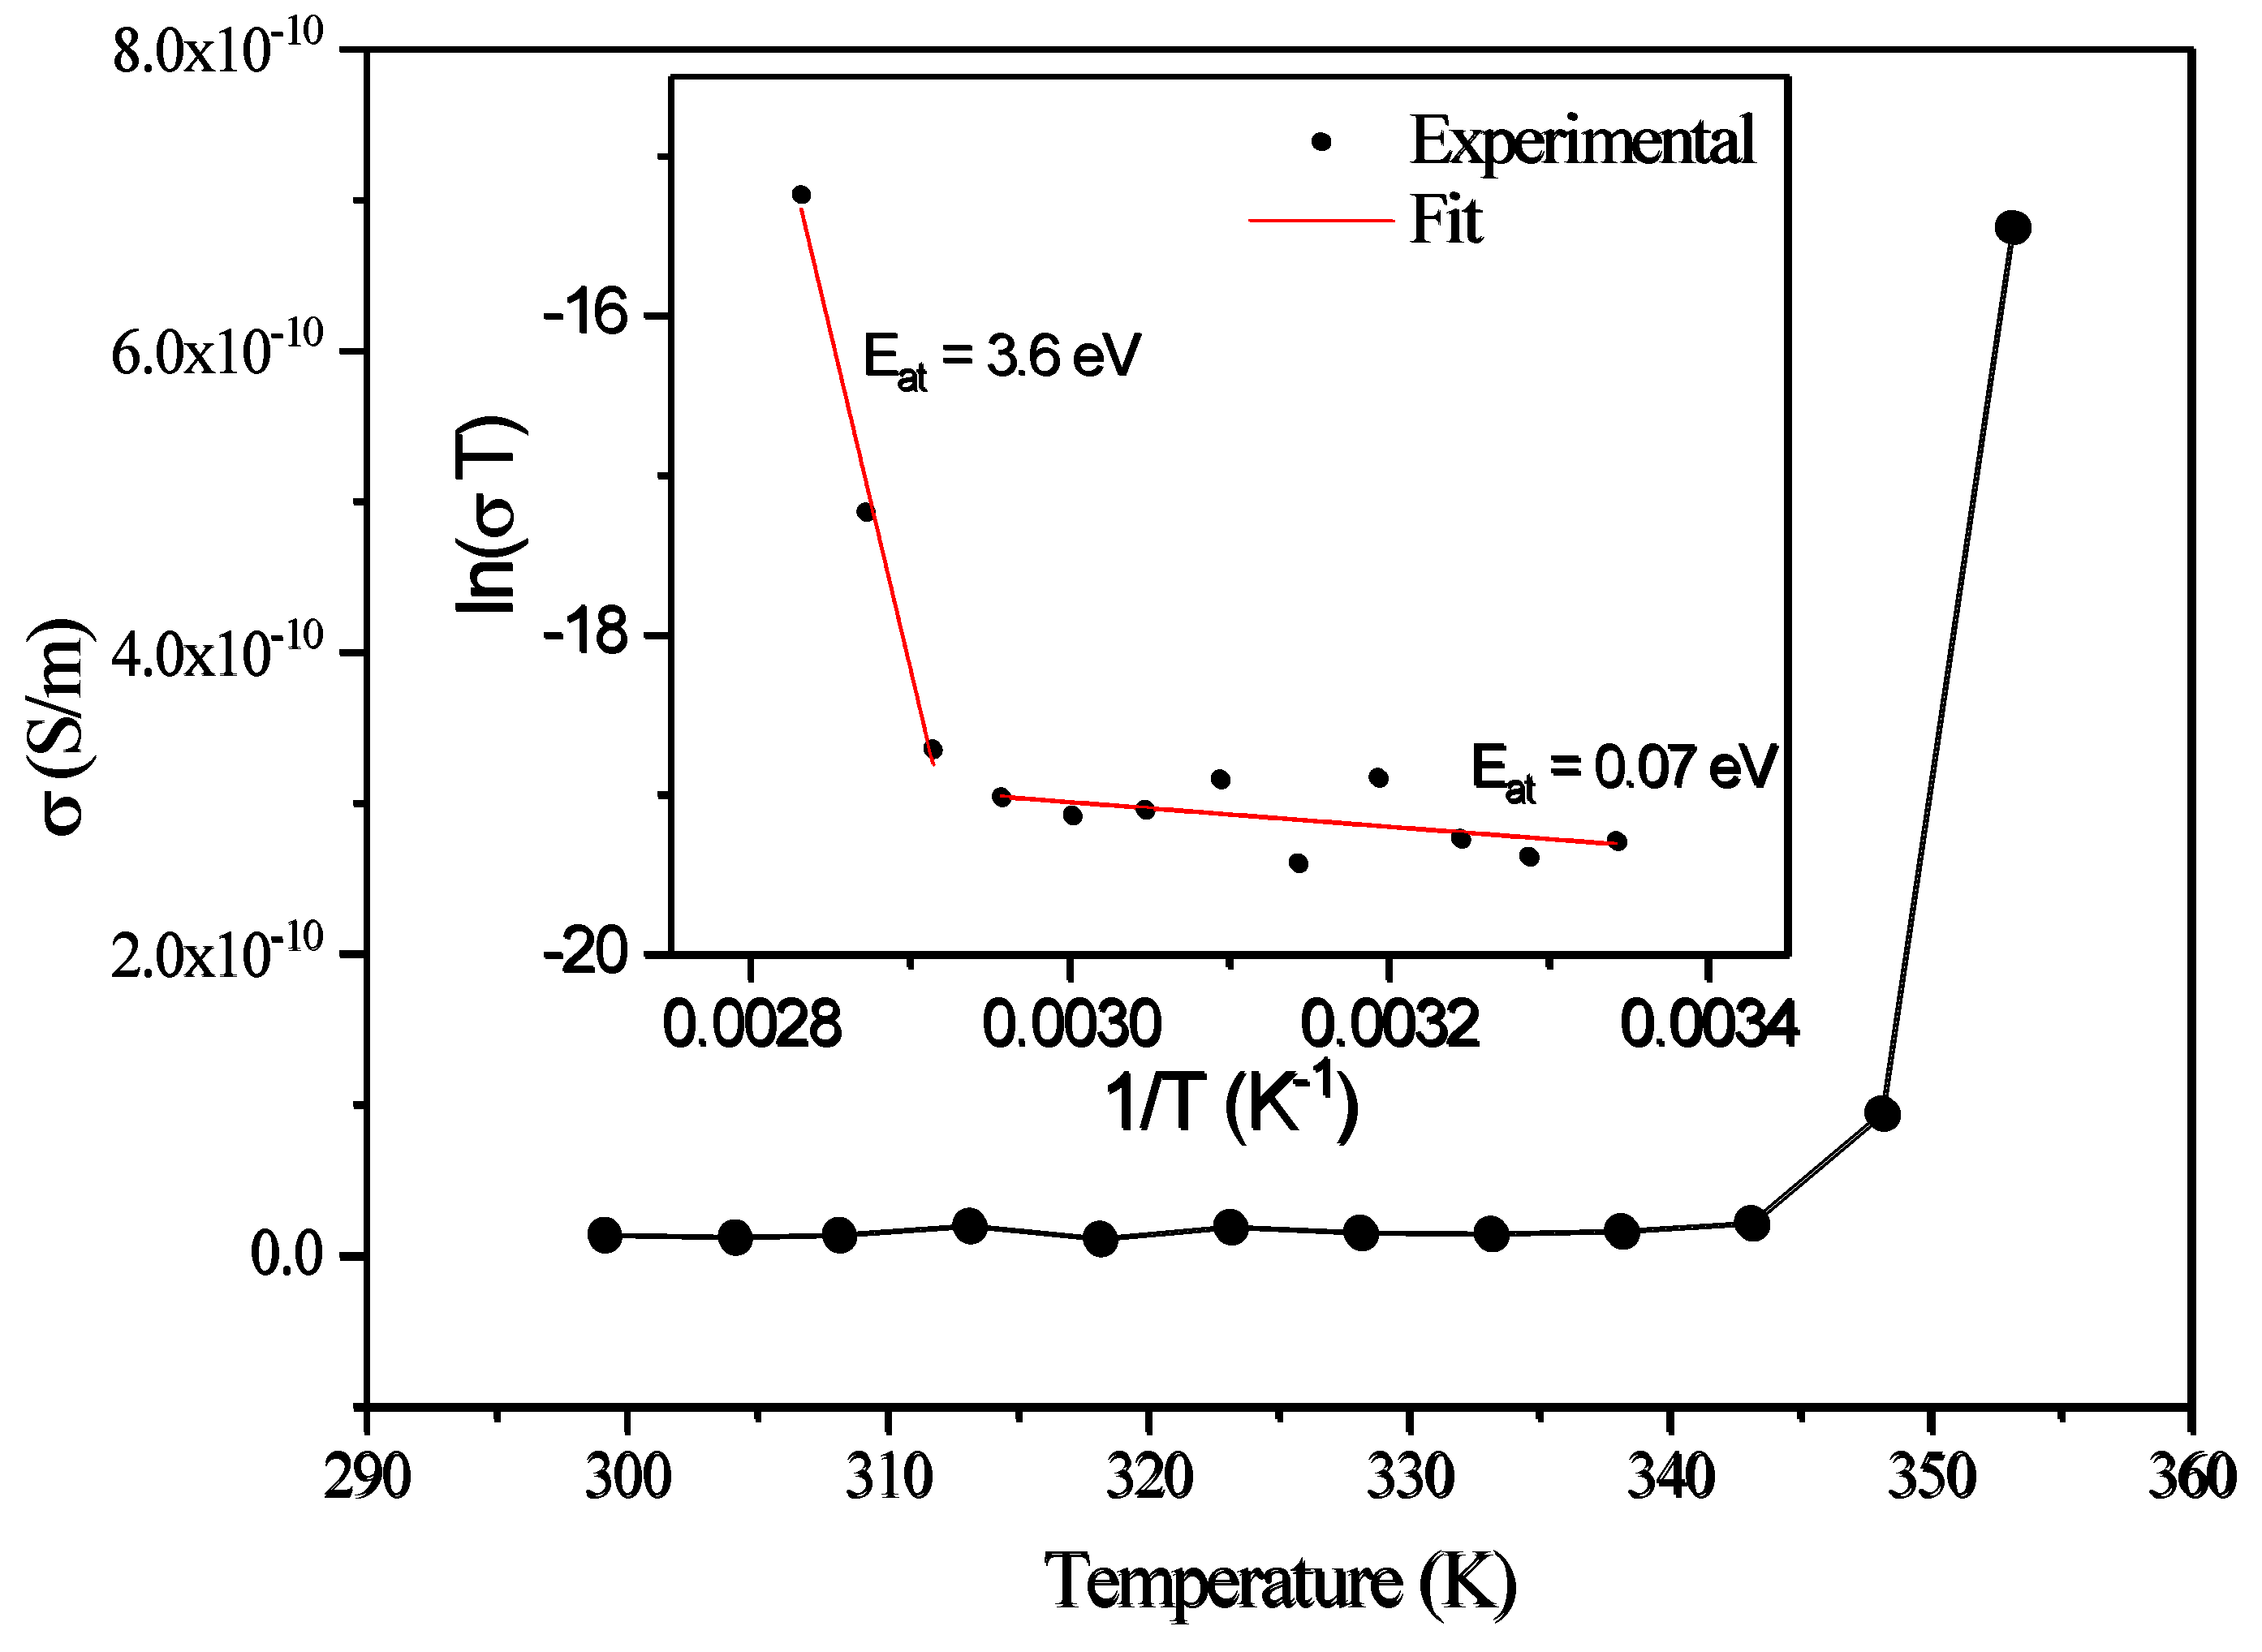
The inset of
Figure 12 shows the linear fits to
as a function of the logarithm of the frequency, for different temperatures, in the low-frequency region. From the fits, the corresponding calculated DC conductivity (
) values and their temperature dependence are shown in
Figure 13. Again, a small variation of the DC conductivity is observed until the 350 K region, above which the conductivity rises sharply. The
behavior as a function of temperature in both regions shows characteristic Arrhenius-like processes, with activation energies (E
a), given by the equation [
21,
22]
where T is the temperature, k
B is the Boltzmann constant and σ
0 is a constant. The activation energy can be determined from the slopes of the fittings to the curves of
as a function of the inverse of T, for the different temperature regions, as shown in the inset of
Figure 13. The two temperature regions with different conductivity and the corresponding activation energy,
values are shown in the figure.
corresponds to the low-temperature region and is characteristic of electrical conduction through the polaron transport behavior [
23]. At higher temperatures, the activation energy increases to
, that is characteristic of ionic conduction in the samples [
21]. As such, the two observed regimes are due to the change from the low temperature, polaronic transport behavior to the high temperature ionic conductivity dependence. This region is associated with the onset of temperature induced changes on the samples (e.g., loss of water as observed from the TGA results which start just above 350 K).
3.6. Second Harmonic Response
Data for the second harmonic response of an approximately 3 mm thick Gly-L-AlaHI.H
2O (Poly2) dipeptide crystal, taken from that shown in
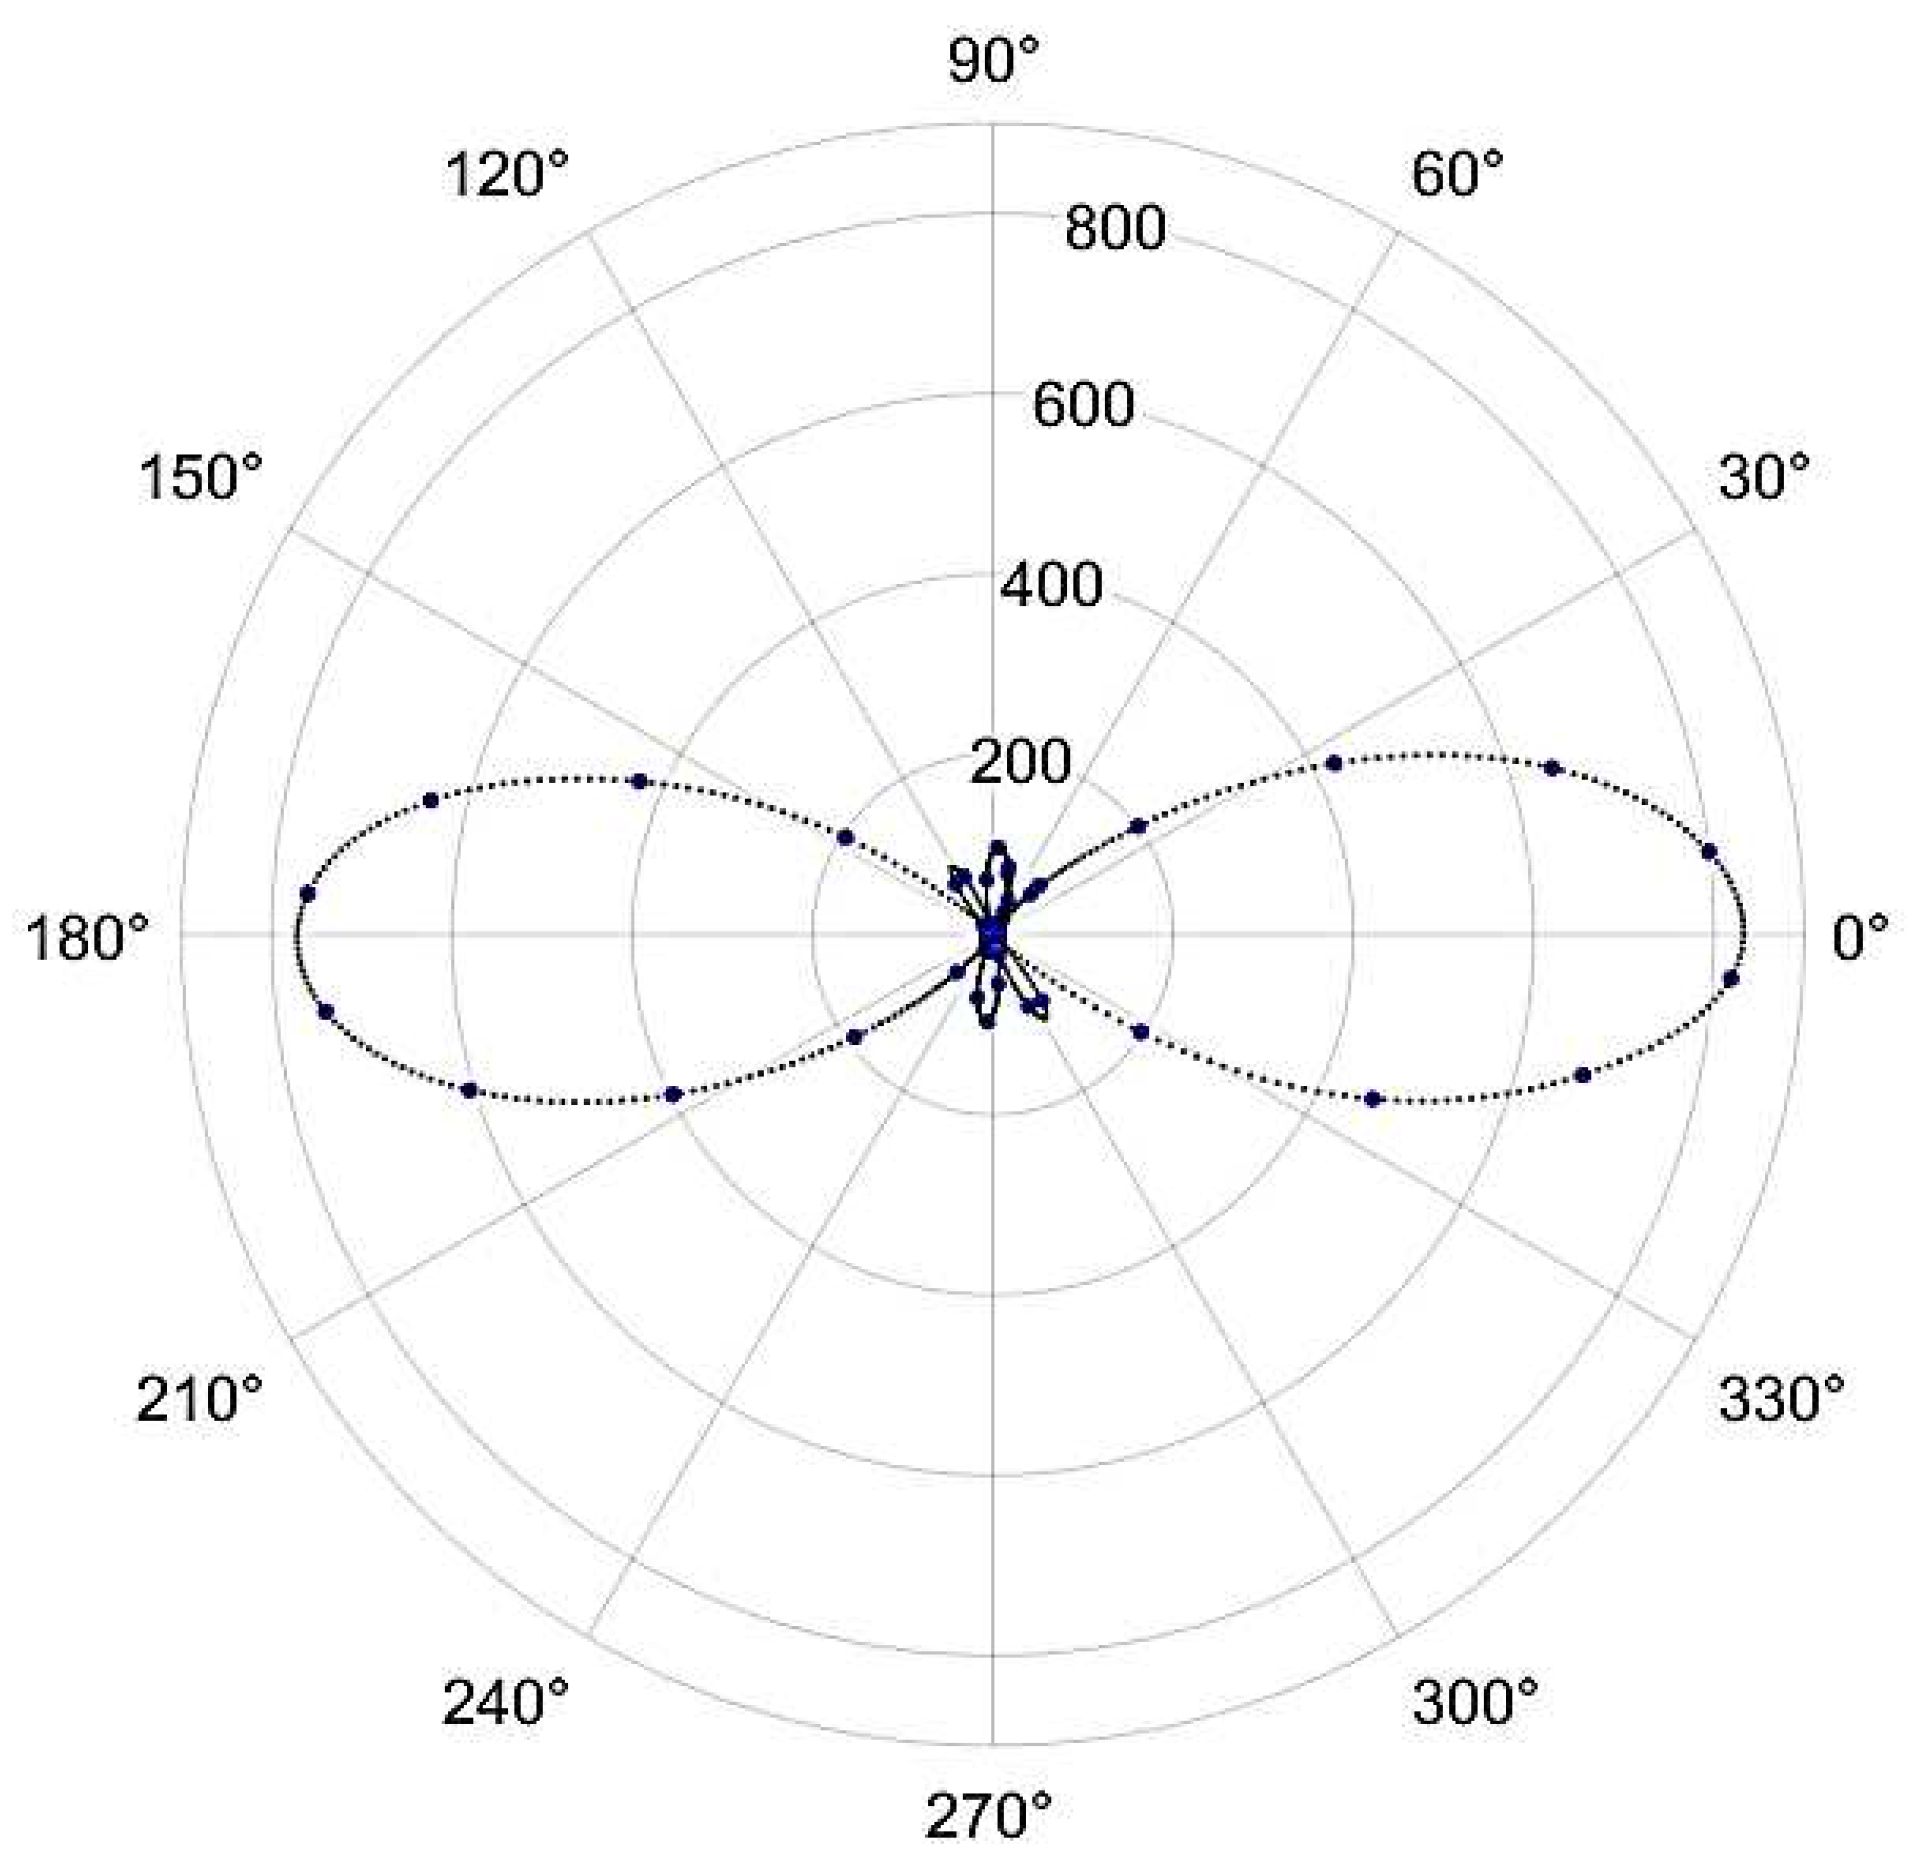
Figure 1. were acquired using incident fundamental pulses with an average incident power of 5mW, corresponding to roughly 66 pJ of energy per pulse. The beam was incident normal to the as-grown crystal surface, and the crystal was scanned over the laboratory x, y and z directions, with z taken to be the direction of the laser beam propagation. The maximum signal values as a function of the polarization of the fundamental beam direction are presented in
Figure 14.
Second harmonic signals were observable only for a narrow range of z positions when the fundamental beam waist was within a few tens of from the crystal surface. Furthermore, the orientation of the analyzer that resulted in the maximum detected signal was very nearly parallel to the direction of the incident polarization. We believe this to be an indication that the normal of the as-grown crystal is close to the crystallographic b axis. As explained in the supplementary information, for this orientation, the second harmonic light will be generated with nearly the same polarization as the fundamental beam and will suffer from strong phase mismatch limiting the generation to close to the crystal surface.
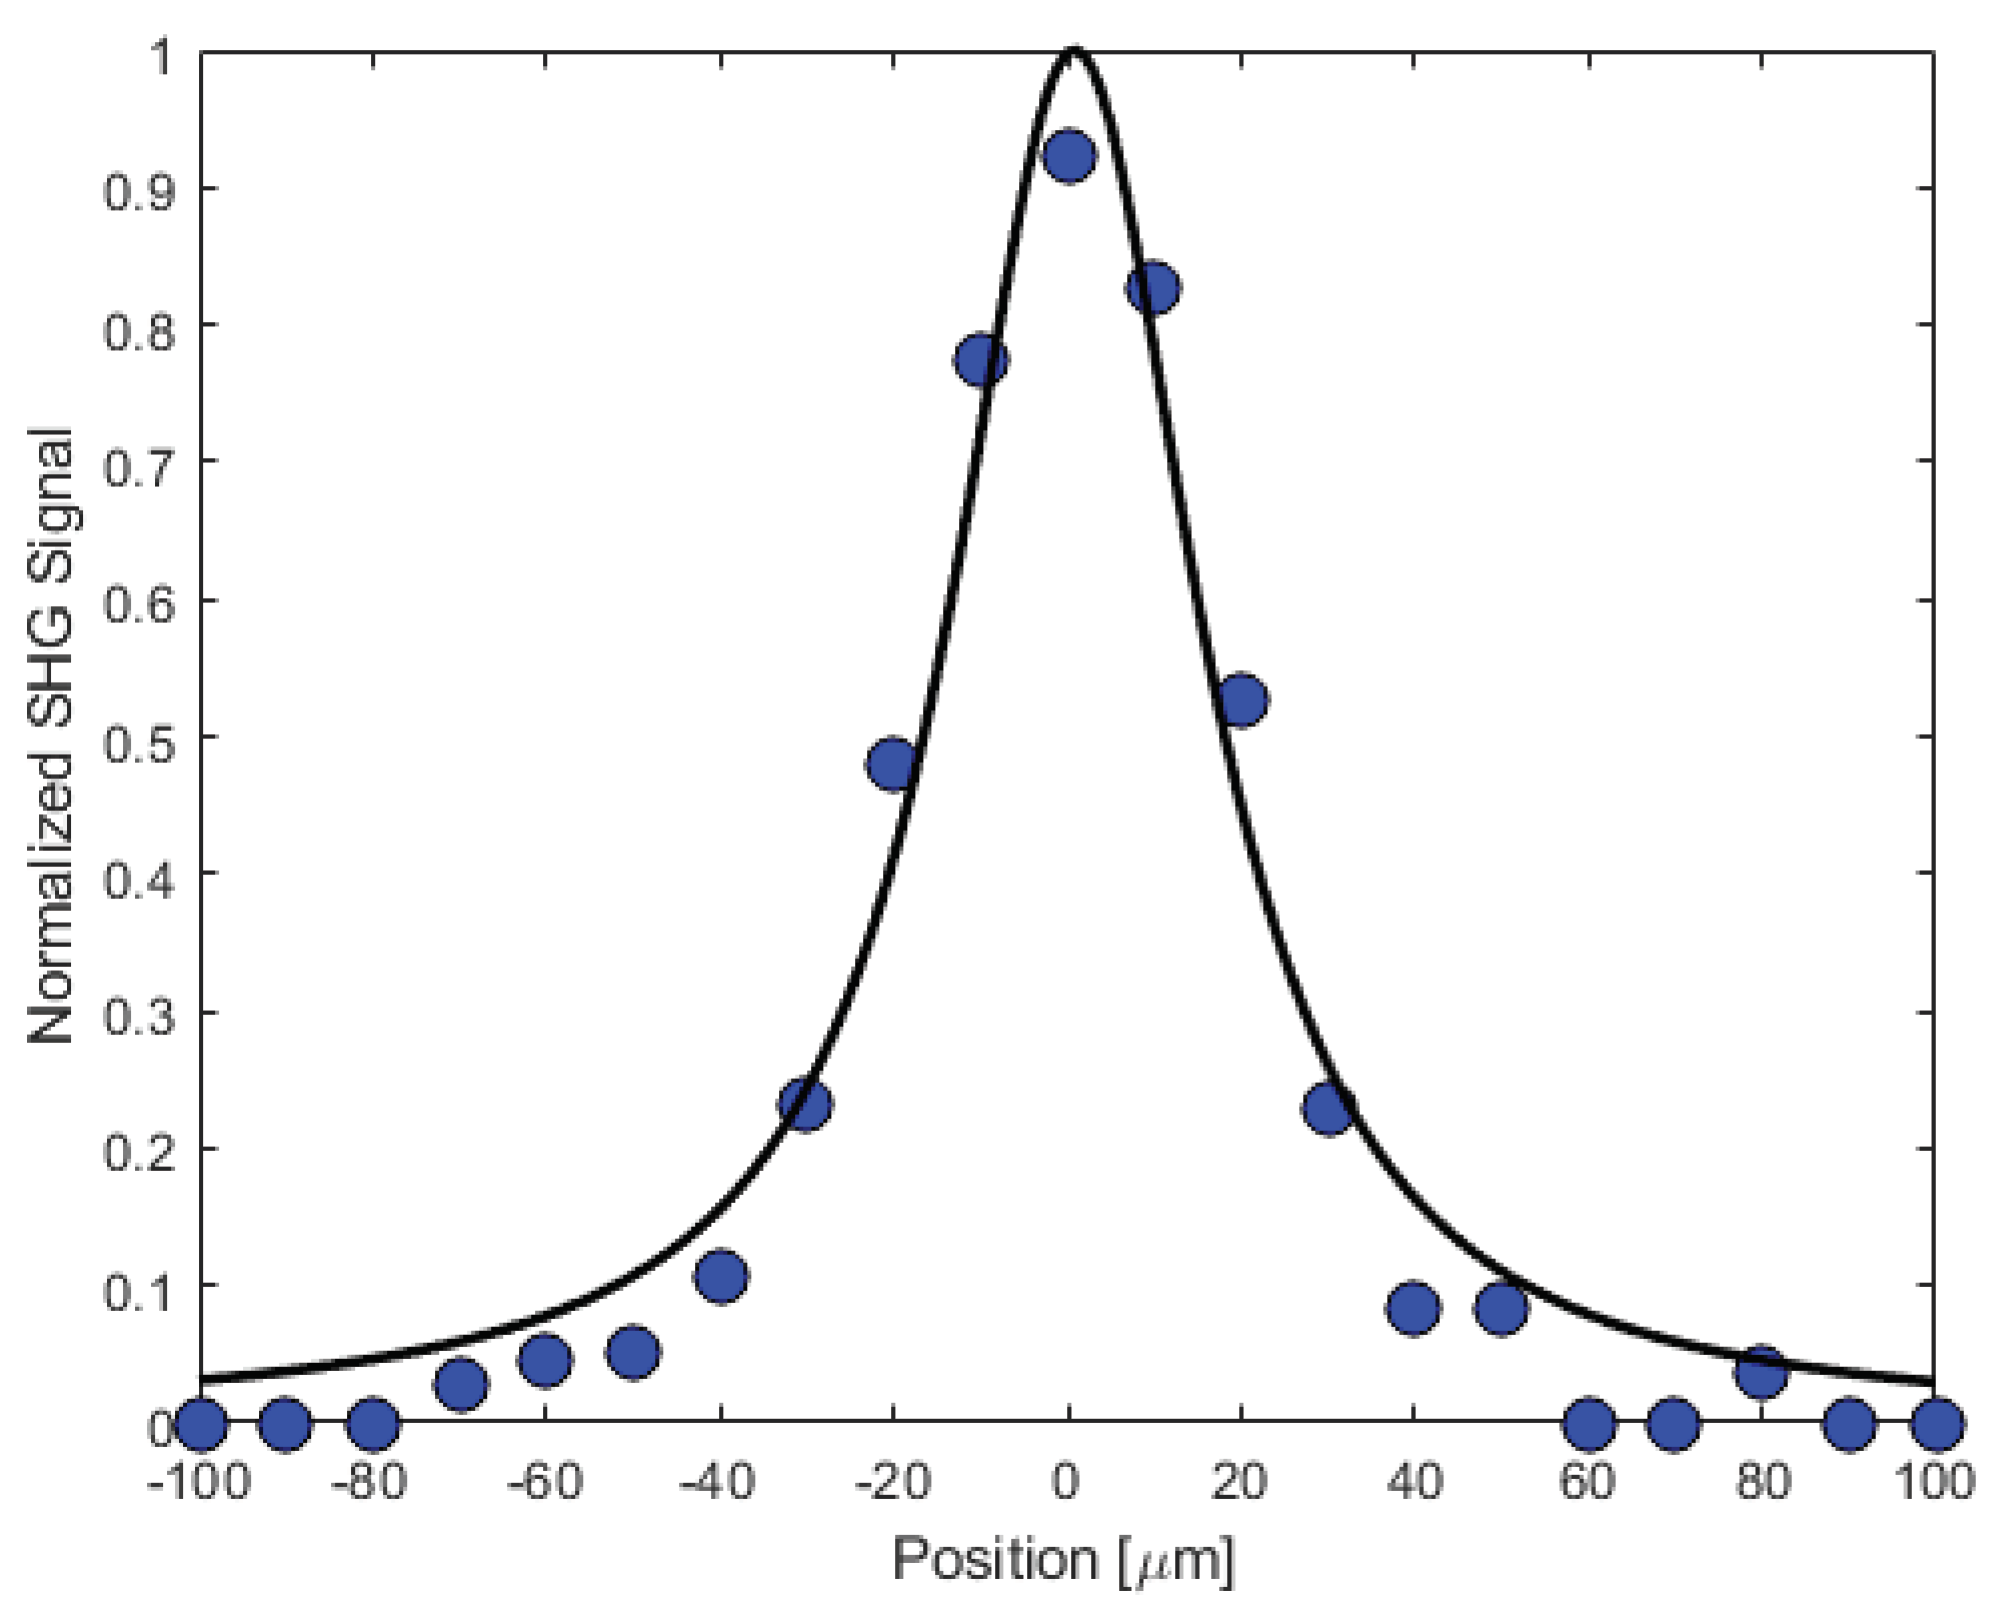
We have carried out a study of the second harmonic response as a function of the fundamental beam’s waist position by translating the crystal in 10
𝜇 steps along the beam’s propagation direction using the MadCity’s piezoelectric translation stage. Representative data are shown in
Figure 15 along with a theoretical fit as described in the supplementary information (Figure SI8).
By calibrating the efficiency of our second harmonic microscope using a 2 mm thick BBO crystal cut the phase matching angle for 800 nm incident light, we can estimate a lower bound for the effective nonlinear susceptibility of the dipeptide crystal. Applying the results described in the supplementary information, we estimate that a lower bound for the effective second-order nonlinear coefficient of Gly-L-Ala.HI.H2O (Poly2) crystals 0.14 pm/V.
4. Conclusions
A polymorph (Gly-L-Ala.HI.H2O (Poly2)) of a previously reported Glycyl-L-alanine HI.H2O salt, was synthesized from the chiral cyclo-Glycyl-L-alanine dipeptide. The dipeptide is known to show molecular flexibility in different environments, which originated the polymorphism. The crystal structure of the Glycyl-L-alanine HI.H2O polymorph is determined at room temperature in space group (P21) with two molecules per unit cell and unit cell parameters a = 7.747 Å, b = 6.435 Å, c = 10.941 Å, α = 90 °, β = 107.53(3) °, γ = 90 °, V = 520.1(7) Å3. The polymorph crystallizes as yellowish prismatic crystals, in the polar point group 2, being therefore a pyroelectric and nonlinear optical material.
The pyroelectric coefficient reported in this work on a (010) orientated Gly-L-Ala.HI.H2O (Poly2) crystal plate, showed an increase with temperature with no significant abnormalities in the range 300-345 K reaching a maximum of at 345 K. Therefore, the pyroelectric coefficient of Poly2 is roughly three times bigger than that reported to Gly-L-Ala.HI.H2O (Poly1) polymorph previously reported to raise to maximum of at 357 K. The different order of magnitude of the measured values for the polymorphs results from the different unit cell atomic coordinates of the dipeptide and water molecules and the iodine ions within the unit cells of both compounds, which originated differences in some of bond lengths magnitude and directionality of hydrogen bonds. Consequently, an overall net dipole moment along the polar b-axis is higher for Poly2 than for the previously reported compound, which explains the higher value of the pyroelectric coefficient reported in this work.
Thermal studies showed that Gly-L-Ala.HI.H2O (Poly2) starts degradation at 533 K, close to the melting temperature reported for cyclo-glycyl-L-alanine, which is 531 K. That temperature (533 K) is 30 K lower than that reported of linear glycyl-L-alanine dipeptide (563 K), suggesting that although the dipeptide when crystallized in Poly2 is not anymore in its cyclic form, it keeps a memory of its initial closed chain, therefore showing a thermal memory effect.
A dielectric characterization of the polymorph is reported: the temperature dependence of the real (ε´) and imaginary (ε´’) parts of the dielectric permittivity is measured in the range of 287 K to 370 K and for frequencies from 100 Hz to 100 kHz. Two regimes are identified in both ε´ and ε´’ different dependence in temperature below and above 350 K, where ε´ is approximately constant and less than 100 from in the first region of temperature (less than 350 K), both for low and high frequencies.
The DC conductivity behavior as a function of temperature in the regions below and above 350 K indicates with different conductivities with corresponding activation energy, values of in the low-temperature region, characteristic of electrical conduction through the polaron transport behavior and at higher temperatures, the activation energy increases to , which is characteristic of ionic conduction in the samples.
Finally, the efficiency of Gly-L-Ala.HI.H2O (Poly2) second harmonic generation was measured against a state-of-the-art nonlinear optical barium borate (BBO) crystal cut at the phase matching angle for 800 nm incident laser light. A lower bound for the effective second-order nonlinear coefficient of Gly-L-Ala.HI.H2O (Poly2) crystals was estimated 0.14 pm/V.
Supplementary Materials
The following supporting information can be downloaded at the website of this paper posted on Preprints.org, Table SI1 and SI2: Crystal data; Figure SI1: Unit cell of Gly-L-Ala.HI.H
2O (Poly2); Figure SI2: Gly-L-Ala.HI.H
2O (Poly2) morphology; Figure SI3: Molecule conformation; Figure SI4: TGA spectra; Figure SI5: DSC spectra; Figure SI6: FTIR-ATR spectra; Figure SI7: Raman spectra; Figure SI8: Gaussian fit. References [
24,
25,
26,
27] are cited in the supplementary materials.
Author Contributions
Conceptualization, R.M.F.B. and E.d.M.G.; investigation, R.M.F.B., C.S.B.G., B.S., J.O., B.A., C.C., P.V.R., A.M., R.B.F., M.R.L.F.R. and M.B.; writing—original draft preparation, R.M.F.B., C.S.B.G. and E.d.M.G.; writing—review and editing, R.M.F.B., C.S.B.G., E.d.M.G., B.A. and M.B.; supervision, R.M.F.B. and E.d.M.G.; project administration, R.M.F.B. and E.d.M.G.; funding acquisition, R.M.F.B., C.S.B.G., B.A., M.B. and E.d.M.G. All authors have read and agreed to the published version of the manuscript.
Funding
This research was funded by Fundação para a Ciência e Tecnologia through FEDER (European Fund for Regional Development)-COMPETE-QREN-EU (ref. UID/FIS/04650/2013 and UID/FIS/04650/2019) and E-Field - "Electric-Field Engineered Lattice Distortions (E-FiELD) for optoelectronic devices", ref. PTDC/NAN-MAT/0098/2020. C.S.B.G. acknowledges funding from Fundação para a Ciência e Tecnologia FCT/MCTES through projects UIDB/50006/2020, UIDP/50006/2020 and LA/P/0008/2020 of the Associate Laboratory for Green Chemistry – LAQV, UIDB/04378/2020, UIDP/04378/2020 and LA/P/0140/2020 of UCIBIO and Associate Laboratory i4HB, respectively.
Institutional Review Board Statement
This study did not involve humans or animals.
Informed Consent Statement
This study did not involve humans or animals.
Acknowledgments
We acknowledge national funds (OE), through FCT − Fundação para a Ciência e a Tecnologia, I.P., in the scope of the framework contract foreseen in the numbers 4, 5, and 6 of the article 23, of the Decree-Law 57/2016, of August 29, changed by Law 57/2017, of July 19.
Conflicts of Interest
The authors declare no conflict of interest.
References
- Kehrer, A.; Dou, S.-q.; Weiss, A. 79,81Br−127I−NQR, and Crystal Structure of Glycyl-l-alanine Hydrobromide Monohydrate and Hydroiodide Monohydrate. Z. Naturforsch. A 1989, 44, 659–668. [Google Scholar] [CrossRef]
- Kehrer, A.; Weiss, A. The pyroelectric coefficient of glycyl-l-alanine hydrobromide monohydrate and glycyl-alanine hydrolodide monohydrate. Ferroelectrics 1990, 106, 405–410. [Google Scholar] [CrossRef]
- Tranter, T.C. Crystal Structure of Glycyl-L-Alanine Hydrobromide. Nature 1954, 173, 221–222. [Google Scholar] [CrossRef]
- Tranter, T.C. Crystal Structure of Glycyl-L-Alanine Hydrochloride. Nature 1956, 177, 37–38. [Google Scholar] [CrossRef]
- Prasad, C. Bioactive cyclic dipeptides. Peptides 1995, 16, 151–164. [Google Scholar] [CrossRef] [PubMed]
- Mendham, A.P.; Dines, T.J.; Snowden, M.J.; Chowdhry, B.Z.; Withnall, R. Vibrational spectroscopy and DFT calculations of di-amino acid cyclic peptides. Part I: cyclo(Gly-Gly), cyclo(L-Ala-L-Ala) and cyclo(L-Ala-Gly) in the solid state and in aqueous solution. J. Raman Spectrosc. 2009, 40, 1478–1497. [Google Scholar] [CrossRef]
- Rabone, J.; Yue, Y.F.; Chong, S.Y.; Stylianou, K.C.; Bacsa, J.; Bradshaw, D.; Darling, G.R.; Berry, N.G.; Khimyak, Y.Z.; Ganin, A.Y.; et al. An Adaptable Peptide-Based Porous Material. Science 2010, 329, 1053–1057. [Google Scholar] [CrossRef] [PubMed]
- Barone, G.; Puliti, R. Correlation Between Phase Transition Thermodynamics and Crystal Features of Solid Small Peptides. J. Therm. Anal. Calorim. 1999, 57, 119–132. [Google Scholar] [CrossRef]
- Capelli, S.C.; Burgi, H.-B.; Dittrich, B.; Grabowsky, S.; Jayatilaka, D. Hirshfeld atom refinement. IUCrJ 2014, 1, 361–379. [Google Scholar] [CrossRef]
- Huang, F.; Nau, W.M. A Conformational Flexibility Scale for Amino Acids in Peptides. Angew. Chem. Int. Ed. 2003, 42, 2269–2272. [Google Scholar] [CrossRef]
- Krause, L.; Herbst-Irmer, R.; Sheldrick, G.M.; Stalke, D. Comparison of silver and molybdenum microfocus X-ray sources for single-crystal structure determination. J. Appl. Crystallogr. 2015, 48, 3–10. [Google Scholar] [CrossRef] [PubMed]
- Sheldrick, G. Crystal structure refinement with SHELXL. Acta Crystallogr. Sec. C 2015, 71, 3–8. [Google Scholar] [CrossRef]
- Farrugia, L. WinGX and ORTEP for Windows: an update. J. Appl. Crystallogr. 2012, 45, 849–854. [Google Scholar] [CrossRef]
- Macrae, C.F.; Sovago, I.; Cottrell, S.J.; Galek, P.T.A.; McCabe, P.; Pidcock, E.; Platings, M.; Shields, G.P.; Stevens, J.S.; Towler, M.; et al. Mercury 4.0: from visualization to analysis, design and prediction. J. Appl. Crystallogr. 2020, 53, 226–235. [Google Scholar] [CrossRef]
- Groom, C.R.; Bruno, I.J.; Lightfoot, M.P.; Ward, S.C. The Cambridge Structural Database. Acta Crystallogr. Sec. B 2016, 72, 171–179. [Google Scholar] [CrossRef]
- Isakov, D.V.; Ferreira, F.P.; Barbosa, J.; Ribeiro, J.L.; de Matos Gomes, E.; Belsley, M.S. Piezoelectric, nonliner optical, electro-optical, and pyroelectric properties of cesium hydrogen malate hydrate crystal. Appl. Phys. Lett. 2007, 90, 073505. [Google Scholar] [CrossRef]
- Fleck, S.; Weiss, A. Dielectric and pyroelectric properties of lithium hydrogen dimalate, LiH3(C4H4O5)2. Z. Naturforsch. A 1986, 41, 1289–1296. [Google Scholar] [CrossRef]
- Bhalla, A.S.; Cook, W.R.; Liu, S.T. Numerical data and functional relationships in science and technology; Nelson, D.F., Ed.; Springer: Berlin, 1993; Volume Vol. 29b, pp. 121–351.
- Mishuk, E.; Weissbuch, I.; Lahav, M.; Lubomirsky, I. Pyroelectricity in Nonpolar Directions in Crystals: Enantiomeric Disorder and Surface Wetting in Racemic α-Amino-Acids. Cryst. Growth. Des. 2014, 14, 3839–3848. [Google Scholar] [CrossRef]
- Do, H.T.; Chua, Y.Z.; Habicht, J.; Klinksiek, M.; Hallermann, M.; Zaitsau, D.; Schick, C.; Held, C. Melting properties of peptides and their solubility in water. Part 1: dipeptides based on glycine or alanine. Rsc. Adv. 2019, 9, 32722–32734. [Google Scholar] [CrossRef]
- Kremer, F.; Schönhals, A. Broadband dielectric spectroscopy; Springer Science & Business Media: 2002.
- Nuernberg, R.B. Numerical comparison of usual Arrhenius-type equations for modeling ionic transport in solids. Ionics 2020, 26, 2405–2412. [Google Scholar] [CrossRef]
- Franchini, C.; Reticcioli, M.; Setvin, M.; Diebold, U. Polarons in materials. Nat. Rev. Mater. 2021, 6, 560–586. [Google Scholar] [CrossRef]
- Tulip, P.R.; Bates, S.P. First principles determination of structural, electronic and lattice dynamical properties of a model dipeptide molecular crystal. Mol. Phys. 2009, 107, 2201–2212. [Google Scholar] [CrossRef]
- Tzankov, P.; Petrov, V. Effective second-order nonlinearity in acentric optical crystals with low symmetry. Appl. Optics 2005, 44, 6971–6985. [Google Scholar] [CrossRef] [PubMed]
- Wang, H.; Weiner, A.M. Efficiency of short-pulse type-I second-harmonic generation with simultaneous spatial walk-off, temporal walk-off, and pump depletion. Ieee J. Quantum Elect. 2003, 39, 1600–1618. [Google Scholar] [CrossRef]
- D'Errico, J. Fminspleas available at MATLAB Central File Exchange. (accessed on Retrieved March 7).
Figure 1.
The Glycyl-l-alanine hydroiodide monohydrate polymorph single crystal used for crystal structure determination and further characterization.
Figure 1.
The Glycyl-l-alanine hydroiodide monohydrate polymorph single crystal used for crystal structure determination and further characterization.
Figure 2.
Second harmonic microscope layout; PBS- Polarized beam splitter; λ/2 - half-waveplate; The transmission axes of both PBS are aligned vertically in this schematic.
Figure 2.
Second harmonic microscope layout; PBS- Polarized beam splitter; λ/2 - half-waveplate; The transmission axes of both PBS are aligned vertically in this schematic.
Figure 3.
ORTEP representation of Gly-L-Ala.HI.H2O (Poly2), using 50% level ellipsoids. Selected bond distances (Å): C1–N1 1.481(4), C2–O1 1.243(6), C5–O2 1.221(7), C5–O3 1.316(7). Selected bond angles (°): C1–C2–N2 114.6(4), C2–N2–C3 124.4(4), N2–C3–C5 109.7(5), O2–C5–O3 123.9(5). Selected torsion angles (°): N1–C1–C2–N2 167.9(5), C1–C2–N2–C3 177.7(5).
Figure 4.
Unit cell of Gly-L-Ala.HI.H2O (Poly2) viewed down a) crystallographic a axis and showing the partial electrical dipole formed by C5-C3-C4, and b) crystallographic c axis showing the dipeptide backbone N1-C1-C2-N2-C3.
Figure 4.
Unit cell of Gly-L-Ala.HI.H2O (Poly2) viewed down a) crystallographic a axis and showing the partial electrical dipole formed by C5-C3-C4, and b) crystallographic c axis showing the dipeptide backbone N1-C1-C2-N2-C3.
Figure 5.
Supramolecular arrangement in Gly-L-Ala.HI.H2O (Poly2), viewed along the b axis (ac plane). Iodide anions and water molecules represented in ball and stick style, while dipeptide cations are depicted in capped sticks style.
Figure 5.
Supramolecular arrangement in Gly-L-Ala.HI.H2O (Poly2), viewed along the b axis (ac plane). Iodide anions and water molecules represented in ball and stick style, while dipeptide cations are depicted in capped sticks style.
Figure 6.
Morphology and face indexing of Gly-L-Ala.HI.H2O (Poly2) with axes a (red), b (green), and c (blue), and assigned Miller indices overlaid.
Figure 6.
Morphology and face indexing of Gly-L-Ala.HI.H2O (Poly2) with axes a (red), b (green), and c (blue), and assigned Miller indices overlaid.
Figure 7.
The pyroelectric coefficient versus temperature, measured during heating on the Glycyl-L-alanine hydroiodide polymorph (Gly-L-AlaHI.H2O (Poly2)) crystal, from room temperature to 345 K. A maximum modulus of 45 µC/m2K occurs at 345 K.
Figure 7.
The pyroelectric coefficient versus temperature, measured during heating on the Glycyl-L-alanine hydroiodide polymorph (Gly-L-AlaHI.H2O (Poly2)) crystal, from room temperature to 345 K. A maximum modulus of 45 µC/m2K occurs at 345 K.
Figure 8.
(Gly-L-AlaHI.H2O (Poly2) unit cell showing the electric dipole moments from water molecule (blue arrows) and from the group and ion (green arrows), showing that there is a net dipole moment along the polar 2-fold screw b-axis.
Figure 8.
(Gly-L-AlaHI.H2O (Poly2) unit cell showing the electric dipole moments from water molecule (blue arrows) and from the group and ion (green arrows), showing that there is a net dipole moment along the polar 2-fold screw b-axis.
Figure 9.
Real part of the electric permittivity, ε´, as a function of temperature for frequencies up to 10 kHz.
Figure 9.
Real part of the electric permittivity, ε´, as a function of temperature for frequencies up to 10 kHz.
Figure 10.
Imaginary part of the electric permittivity, ε´´, as a function of temperature for frequencies up to 10 kHz.
Figure 10.
Imaginary part of the electric permittivity, ε´´, as a function of temperature for frequencies up to 10 kHz.
Figure 11.
Real part of the electric permittivity, ε´, as a function of frequency for different temperatures.
Figure 11.
Real part of the electric permittivity, ε´, as a function of frequency for different temperatures.
Figure 12.
Imaginary part of the electric permittivity, ε´´, as a function of frequency for different temperatures. The inset shows an ln-ln plot, where the linear dependence is observed due to the contribution from the DC conductivity (red lines).
Figure 12.
Imaginary part of the electric permittivity, ε´´, as a function of frequency for different temperatures. The inset shows an ln-ln plot, where the linear dependence is observed due to the contribution from the DC conductivity (red lines).
Figure 13.
Temperature dependence of the electrical conductivity determined from the low frequency behavior of the imaginary permittivity of figure 7. The inset shows as a function of the inverse of temperature. The slopes of the linear fits give the activation energies in the two temperature intervals.
Figure 14.
Second harmonic signal generated by the Gly-L-AlaHI.H2O (Poly2) crystal as a function of the orientation of the fundamental beam’s polarization orientation relative to the analyzer’s transmission axis. Experimental points are in blue, while the dotted black line is a spline fit to the data.
Figure 15.
The second harmonic response as the crystal was translated in 10 μm steps along the propagation direction of the fundamental beam. Also shown is a theoretical fit assuming Gaussian spatial and temporal profiles for the two beams. The 0 position was chosen to be close to the maximum SHG signal. We estimate that the coherence length due to phase mismatch is approximately 1.7 while the Rayleigh range for the fundamental beam is roughly an order of magnitude larger at 16.4 .
Table 1.
Hydrogen bonds for Gly-L-Ala.HI.H2O (Poly2) [Å and °].
Table 1.
Hydrogen bonds for Gly-L-Ala.HI.H2O (Poly2) [Å and °].
| D-H...A |
d(H...A) |
d(D...A) |
<(DHA) |
Symmetry operation |
| C(1)-H(1B)...I(1) |
3.26 |
3.953(3) |
129.5 |
-x+1,y-1/2,-z+2 |
| N(1)-H(10B)...O(2) |
2.30(6) |
2.902(6) |
128(6) |
x-1,y,z
|
| N(1)-H(10B)...O(4) |
2.47(6) |
3.110(8) |
133(6) |
x,y-1,z
|
| N(1)-H(10A)...I(1) |
2.77(4) |
3.570(9) |
152(6) |
x,y-1,z
|
| N(1)-H(10C)...I(1) |
3.13(11) |
3.642(4) |
119(10) |
-x,y-1/2,-z+2 |
| N(1)-H(10C)...I(1) |
2.96(11) |
3.598(9) |
130(11) |
|
| N(2)-H(20)...I(1) |
2.76(10) |
3.637(5) |
169(7) |
-x+1,y-1/2,-z+2 |
| O(3)-H(30)...O(4) |
1.77(10) |
2.662(6) |
167(9) |
-x+1,y-1/2,-z+1 |
| O(4)-H(41)...O(1) |
2.026 |
2.824(4) |
161.29(15) |
-x,y+1/2,-z+1 |
| O(4)-H(40)...O(1) |
2.233 |
2.982(6) |
152.86 |
|
Table 2.
Characteristics of some semi-organic and organic materials in comparison with Gly-L-AlaHI.H2O (Poly2) at room temperature. ε´ is the dielectric constant and 𝑝 the pyroelectric coefficient.
Table 2.
Characteristics of some semi-organic and organic materials in comparison with Gly-L-AlaHI.H2O (Poly2) at room temperature. ε´ is the dielectric constant and 𝑝 the pyroelectric coefficient.
| Material |
ε´ |
𝑝 (µC/m2K) |
|
|
Ref. |
| Gly-L-AlaHI.H2O (Poly2) |
11.5 |
45 (345 K) |
|
|
This work |
| Gly-L-AlaHI.H2O (Poly1) |
__ |
15.5 (357 K) |
|
|
[2] |
| CsH(C4H4O5)∙H2O |
11.2 |
2.5 (245 K) |
|
|
[16] |
| LiH3(C4H4O5)2
|
8.1 |
6.1 |
|
|
[17] |
| (NH2CH2COOH)3H2SO4
|
25 |
350 |
|
|
[18] |
| DL-Alanine |
__ |
5.5 |
|
|
[19] |
| KH2PO4
|
45 |
300 (120 K) |
|
|
[18] |
|
Disclaimer/Publisher’s Note: The statements, opinions and data contained in all publications are solely those of the individual author(s) and contributor(s) and not of MDPI and/or the editor(s). MDPI and/or the editor(s) disclaim responsibility for any injury to people or property resulting from any ideas, methods, instructions or products referred to in the content. |
© 2023 by the authors. Licensee MDPI, Basel, Switzerland. This article is an open access article distributed under the terms and conditions of the Creative Commons Attribution (CC BY) license (http://creativecommons.org/licenses/by/4.0/).

