1. Introduction
Until October 2022, numerous studies have provided evidence supporting the impact of environmental and seasonal factors on COVID-19 [
1,
2,
3,
4,
5,
6]. Various types of pollution, relative humidity, solar radiation, wind, and temperatures, as well as people's behavior (e.g., tendency to generate gatherings with poor air circulation in the colder months), seem to impact its virulence and/or contagiousness significantly. However, the effect size and significance of these external influences are currently debated [
7]. Furthermore, part of the scientific community emphasizes the greater importance of virological phenomena such as the appearance of SARS-CoV-2 variants of concern and the duration of the population's immunological memory [
8]. In this regard, the author of this manuscript underlines some ambiguities and critical issues that must be adequately addressed in order to establish a standard research line. The first is the definition of “seasonality.” Indeed, it is unclear whether this term identifies the periodic annual recurrence of a specific virus behavior regarding its contagiousness and/or its virulence and at what intensity (e.g., is the peaks' heights a determinant?). In this manuscript, any periodic manifestation is considered seasonal regardless of its intensity; thus, it is possible to take into account any environmental influence and its relative impact. The second concerns the complexity of the epidemiological system to be examined since such variables influence each other through bidirectional causality mechanisms (e.g., the immune response of a group of individuals is altered by confounding factors such as environmental characteristics, lifestyle, and even psychological determinants) [
9,
10]. This makes it difficult to establish universal and immutable primary epidemiological causes. Furthermore, COVID-19 severity is aggravated by a long series of known comorbidities, including obesity, diabetes, asthma, chronic lung disease, sickle cell anemia, and immunodeficiency [
11,
12,
13,
14,
15,
16]; and, as if that were not enough, these comorbidities are in turn influenced by the above variables. Therefore, this research adopts an observational approach to provide an overall review of the epidemiological scenario. Finally, the third involves the purpose of epidemiological research: in fact, the scientific and ethical objective is the analysis of the causes and determinants of public health problems in order to provide solutions and preventive strategies. Ergo, viewing the COVID-19 health crisis as a stand-alone issue, decontextualized from the current local situation, is highly incorrect and reckless. Indeed, even admitting and not conceding the absence of seasonality in the infection, it is essential to evaluate components such as spatial and temporal resilience and effectiveness of the health system, giving the right weight to the combined action of all the other causes of hospitalization and events that are dangerous for the collective well-being within a specific geographical region. In this regard, one large analysis by Gasparrini et al. shows a marked increase in epidemiological risk during cold seasons worldwide [
17]. Based on this premise, the present manuscript aims to investigate this aspect of the COVID-19 pandemic in Italy by analyzing mortality patterns nationwide and their possible relationships with temperature. The aim is to describe historical seasonal and temperature-related risks and look for any plausible relationship with COVID-19.
2. Results
2.1. Relationships between historical excess deaths, seasonality, and temperatures
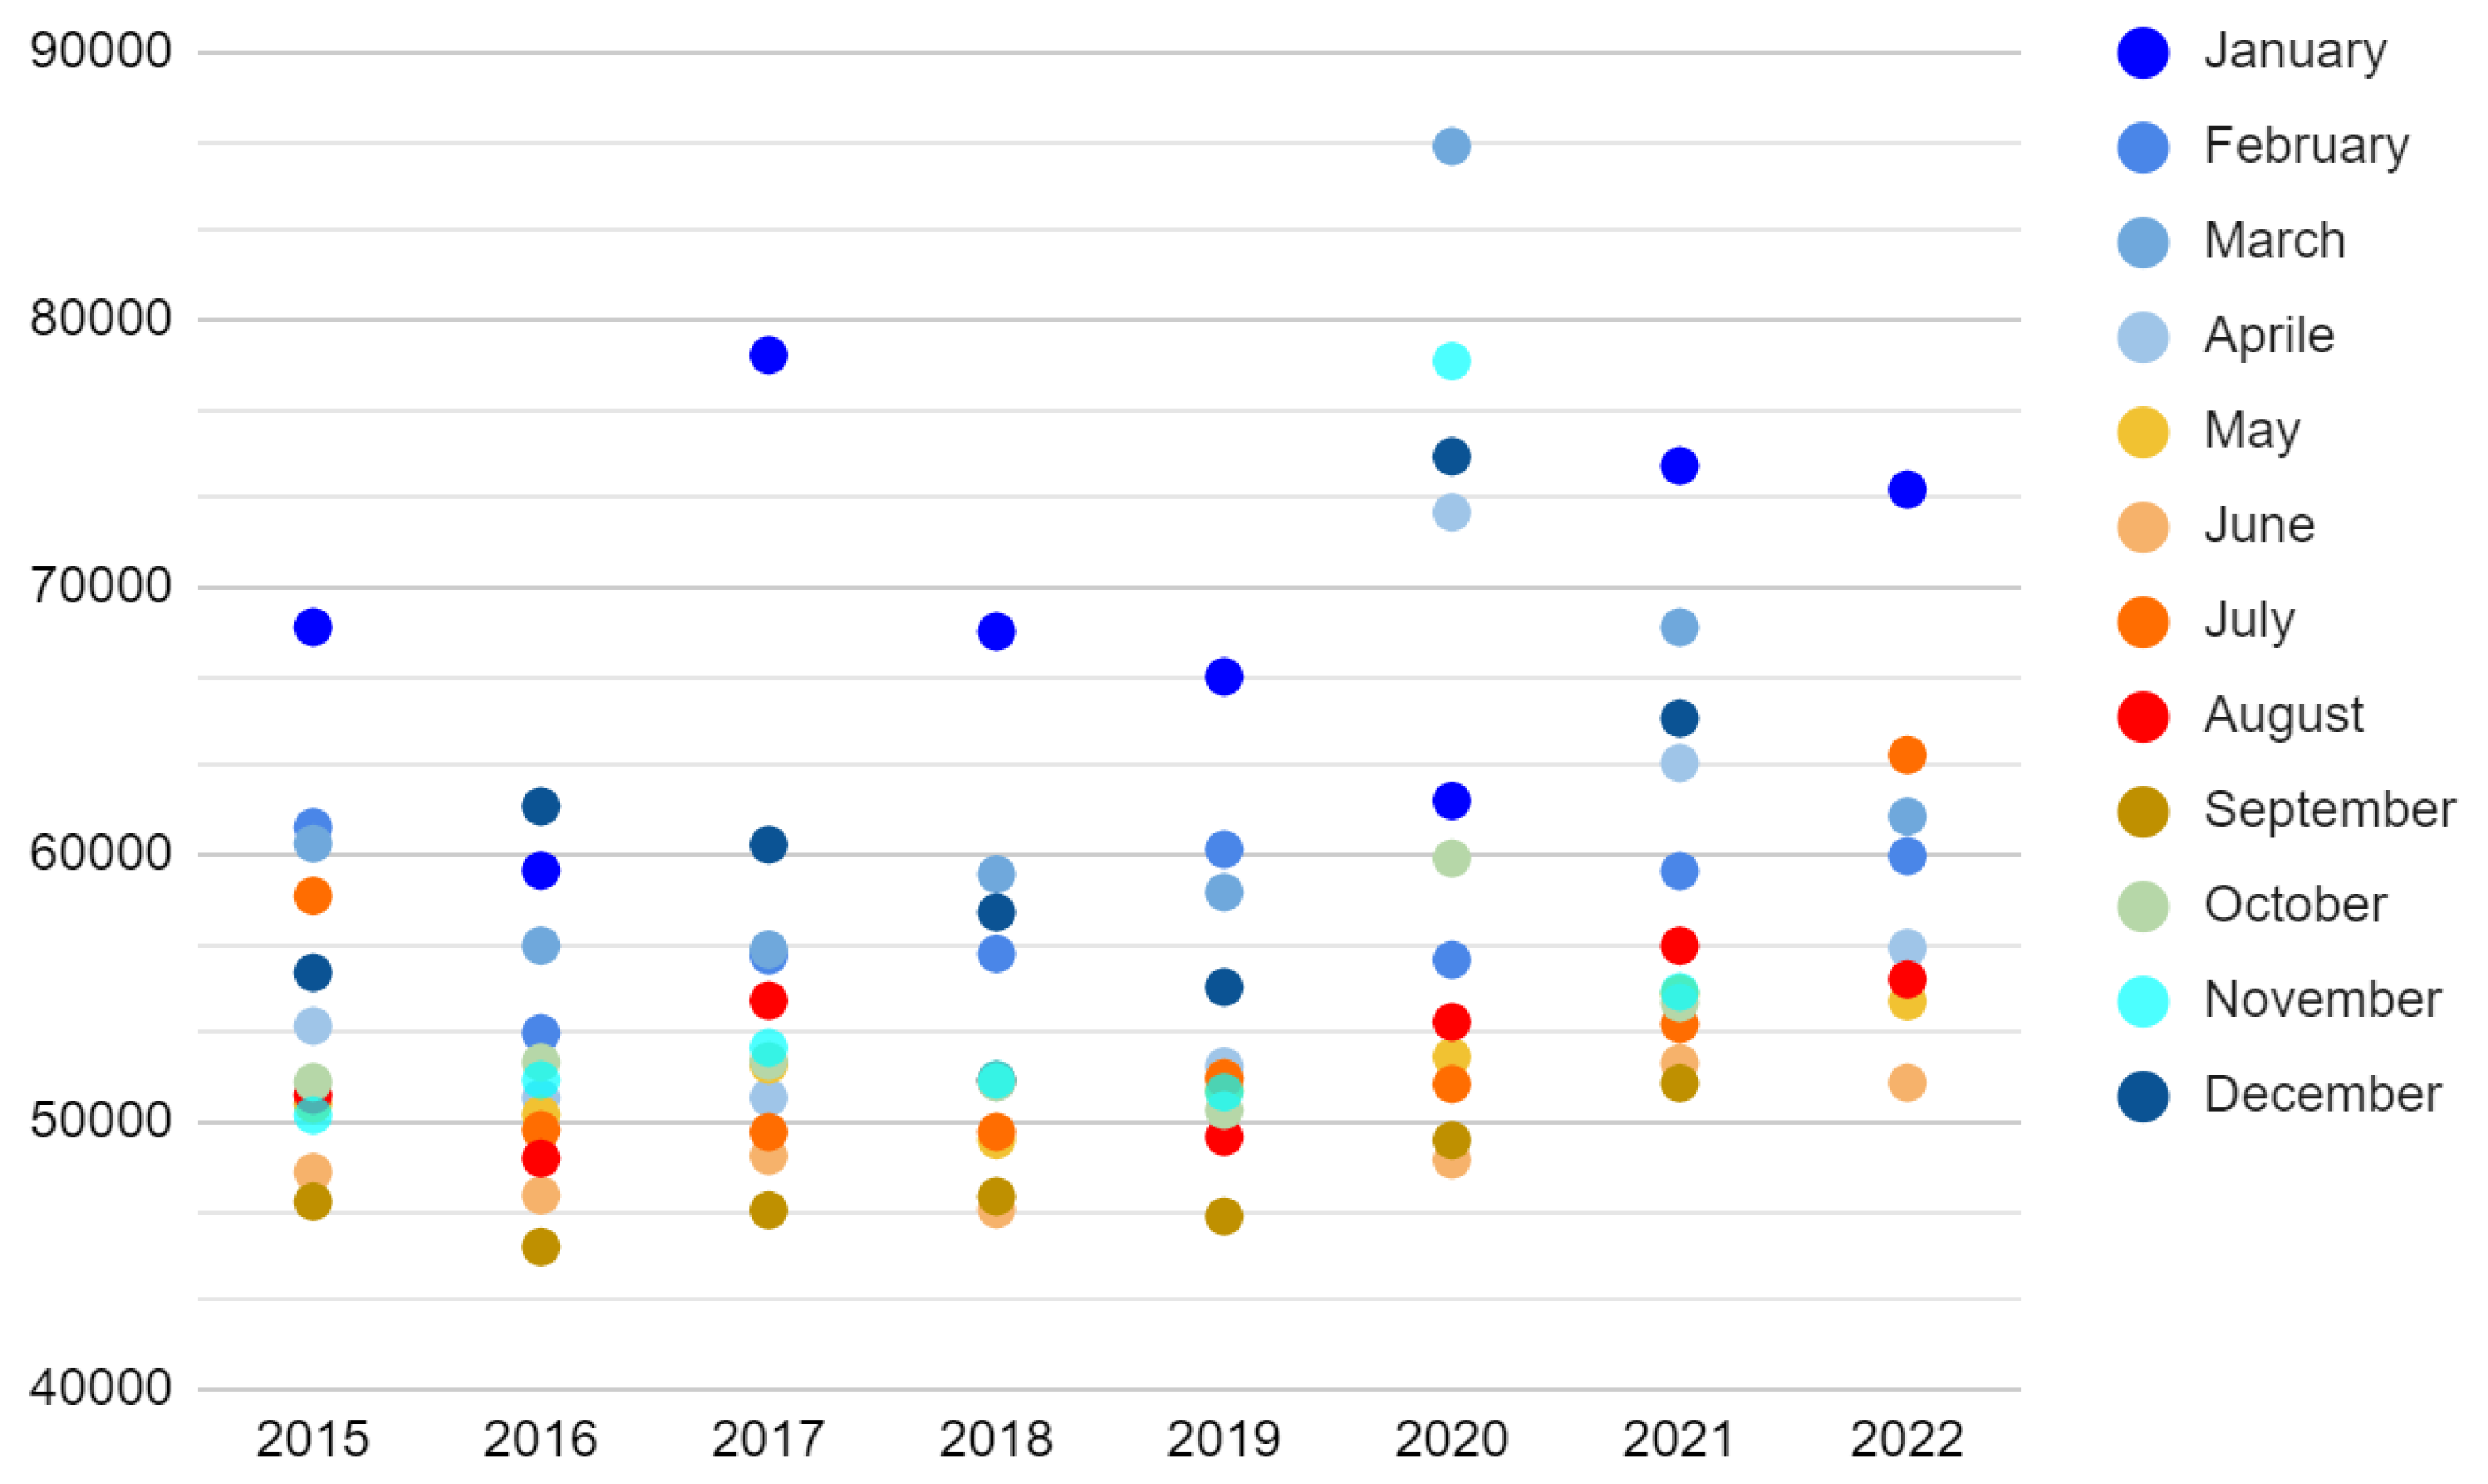
As shown in
Figure 1, the toll of total monthly deaths in Italy from 2015 to 2019 was aggravated by the arrival of the cold season (6 months, from November to April, average temperature < 20°C), changing from an average of about 50,000 to 57,500 (95% CI = [5,400; +inf[, Welch t-test S = 21).
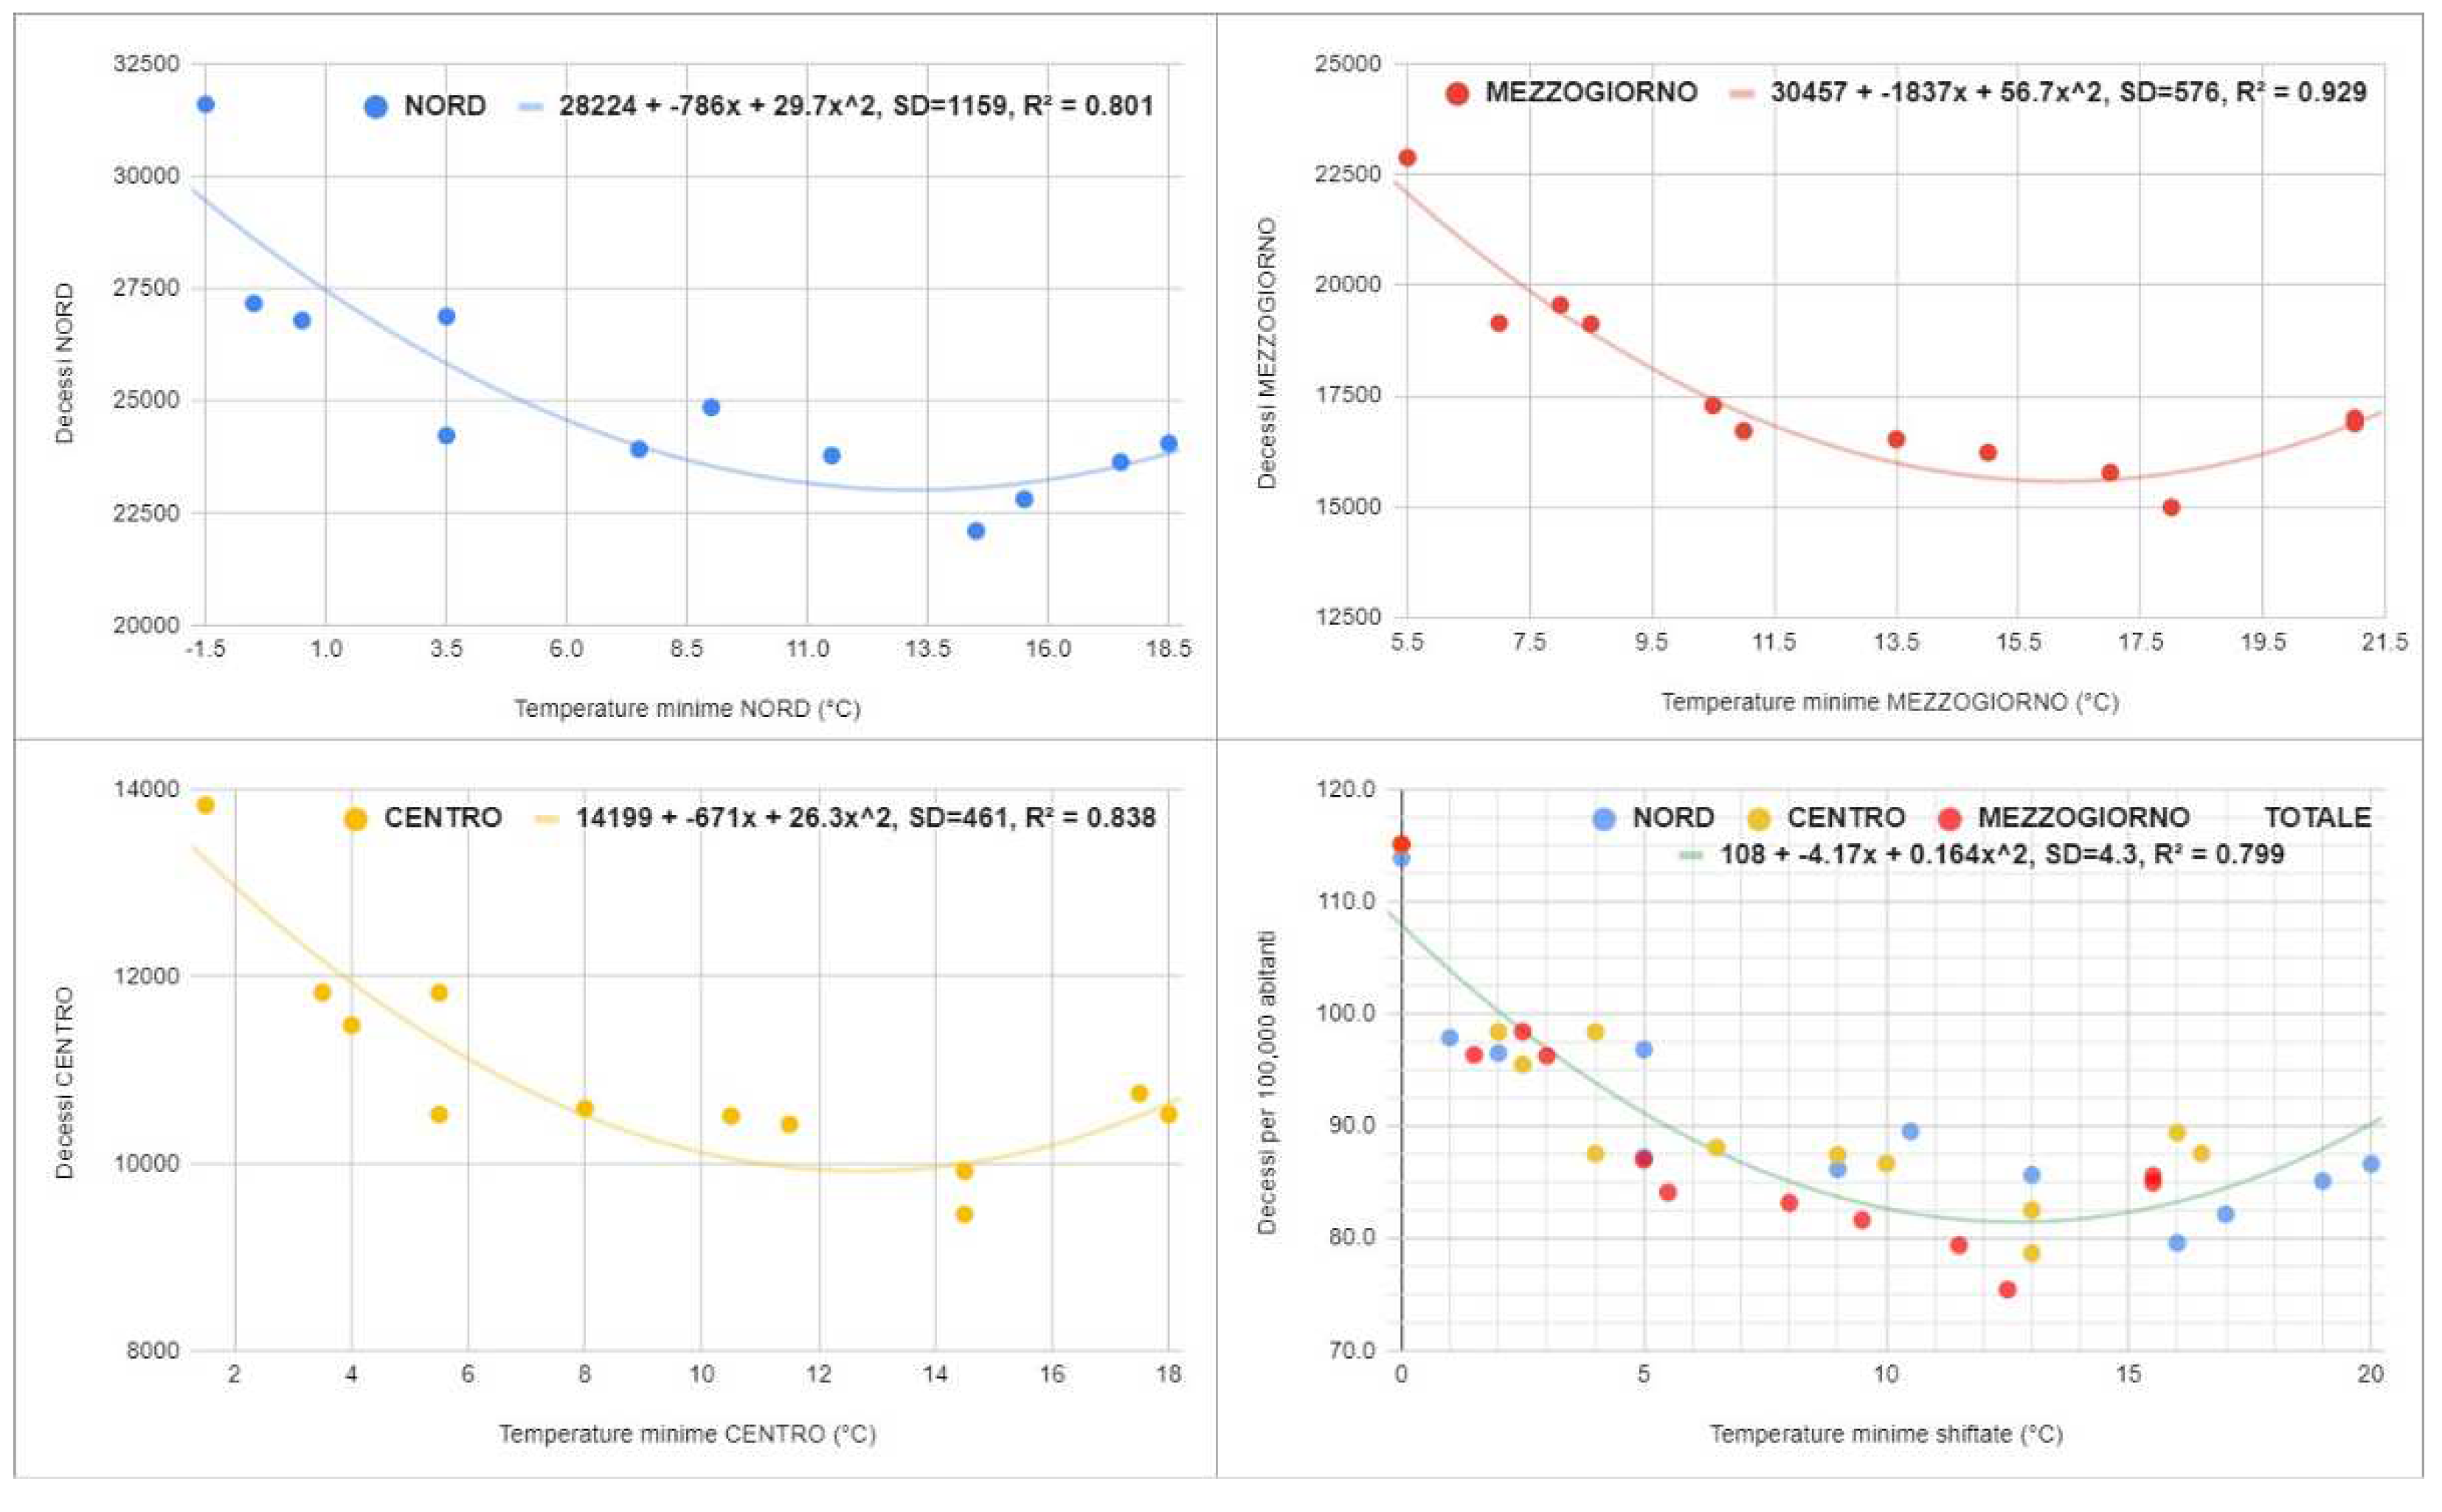
Therefore, the average annual increase in the cold season was 45,000 deaths (standard deviation = 4,700). During COVID-19, the figure worsened, touching 115,000 and 63,000 excess deaths in the cold seasons of 2020 and 2021 (two extremely surprising outliers, Grubbs t-test S > 52). Furthermore, despite the abnormal increase in mortality in July, the death toll is still higher during the cold months in 2022 (difference = 26,500 in the first 8 months). Considering the deaths per 100,000 inhabitants in the three main geographic macro-regions, namely North, Center, and South, the graphs in
Figure 2 were obtained: in particular, we can see a marked and surprising global correlation with the average minimum temperatures (Spearman r = -0.75, 95% CI = [-0.87; -0.56], S = 23).
The parabolic models of the form “|a|x2 - |b|x + |c|” describe the trends satisfactorily (minimum{R2} = 0.80). In all macro-regions, the curve decreases up to the fourth highest minimum temperature and then increases. Furthermore, although the trend is similar, all three curves are shifted to each other. This suggests that other seasonal factors may be involved in the phenomenon. Consequently, the increase in seasonal deaths due to COVID-19 must be considered in light of this epidemiological scenario.
2.2. Comparison between excess and COVID-19 deaths
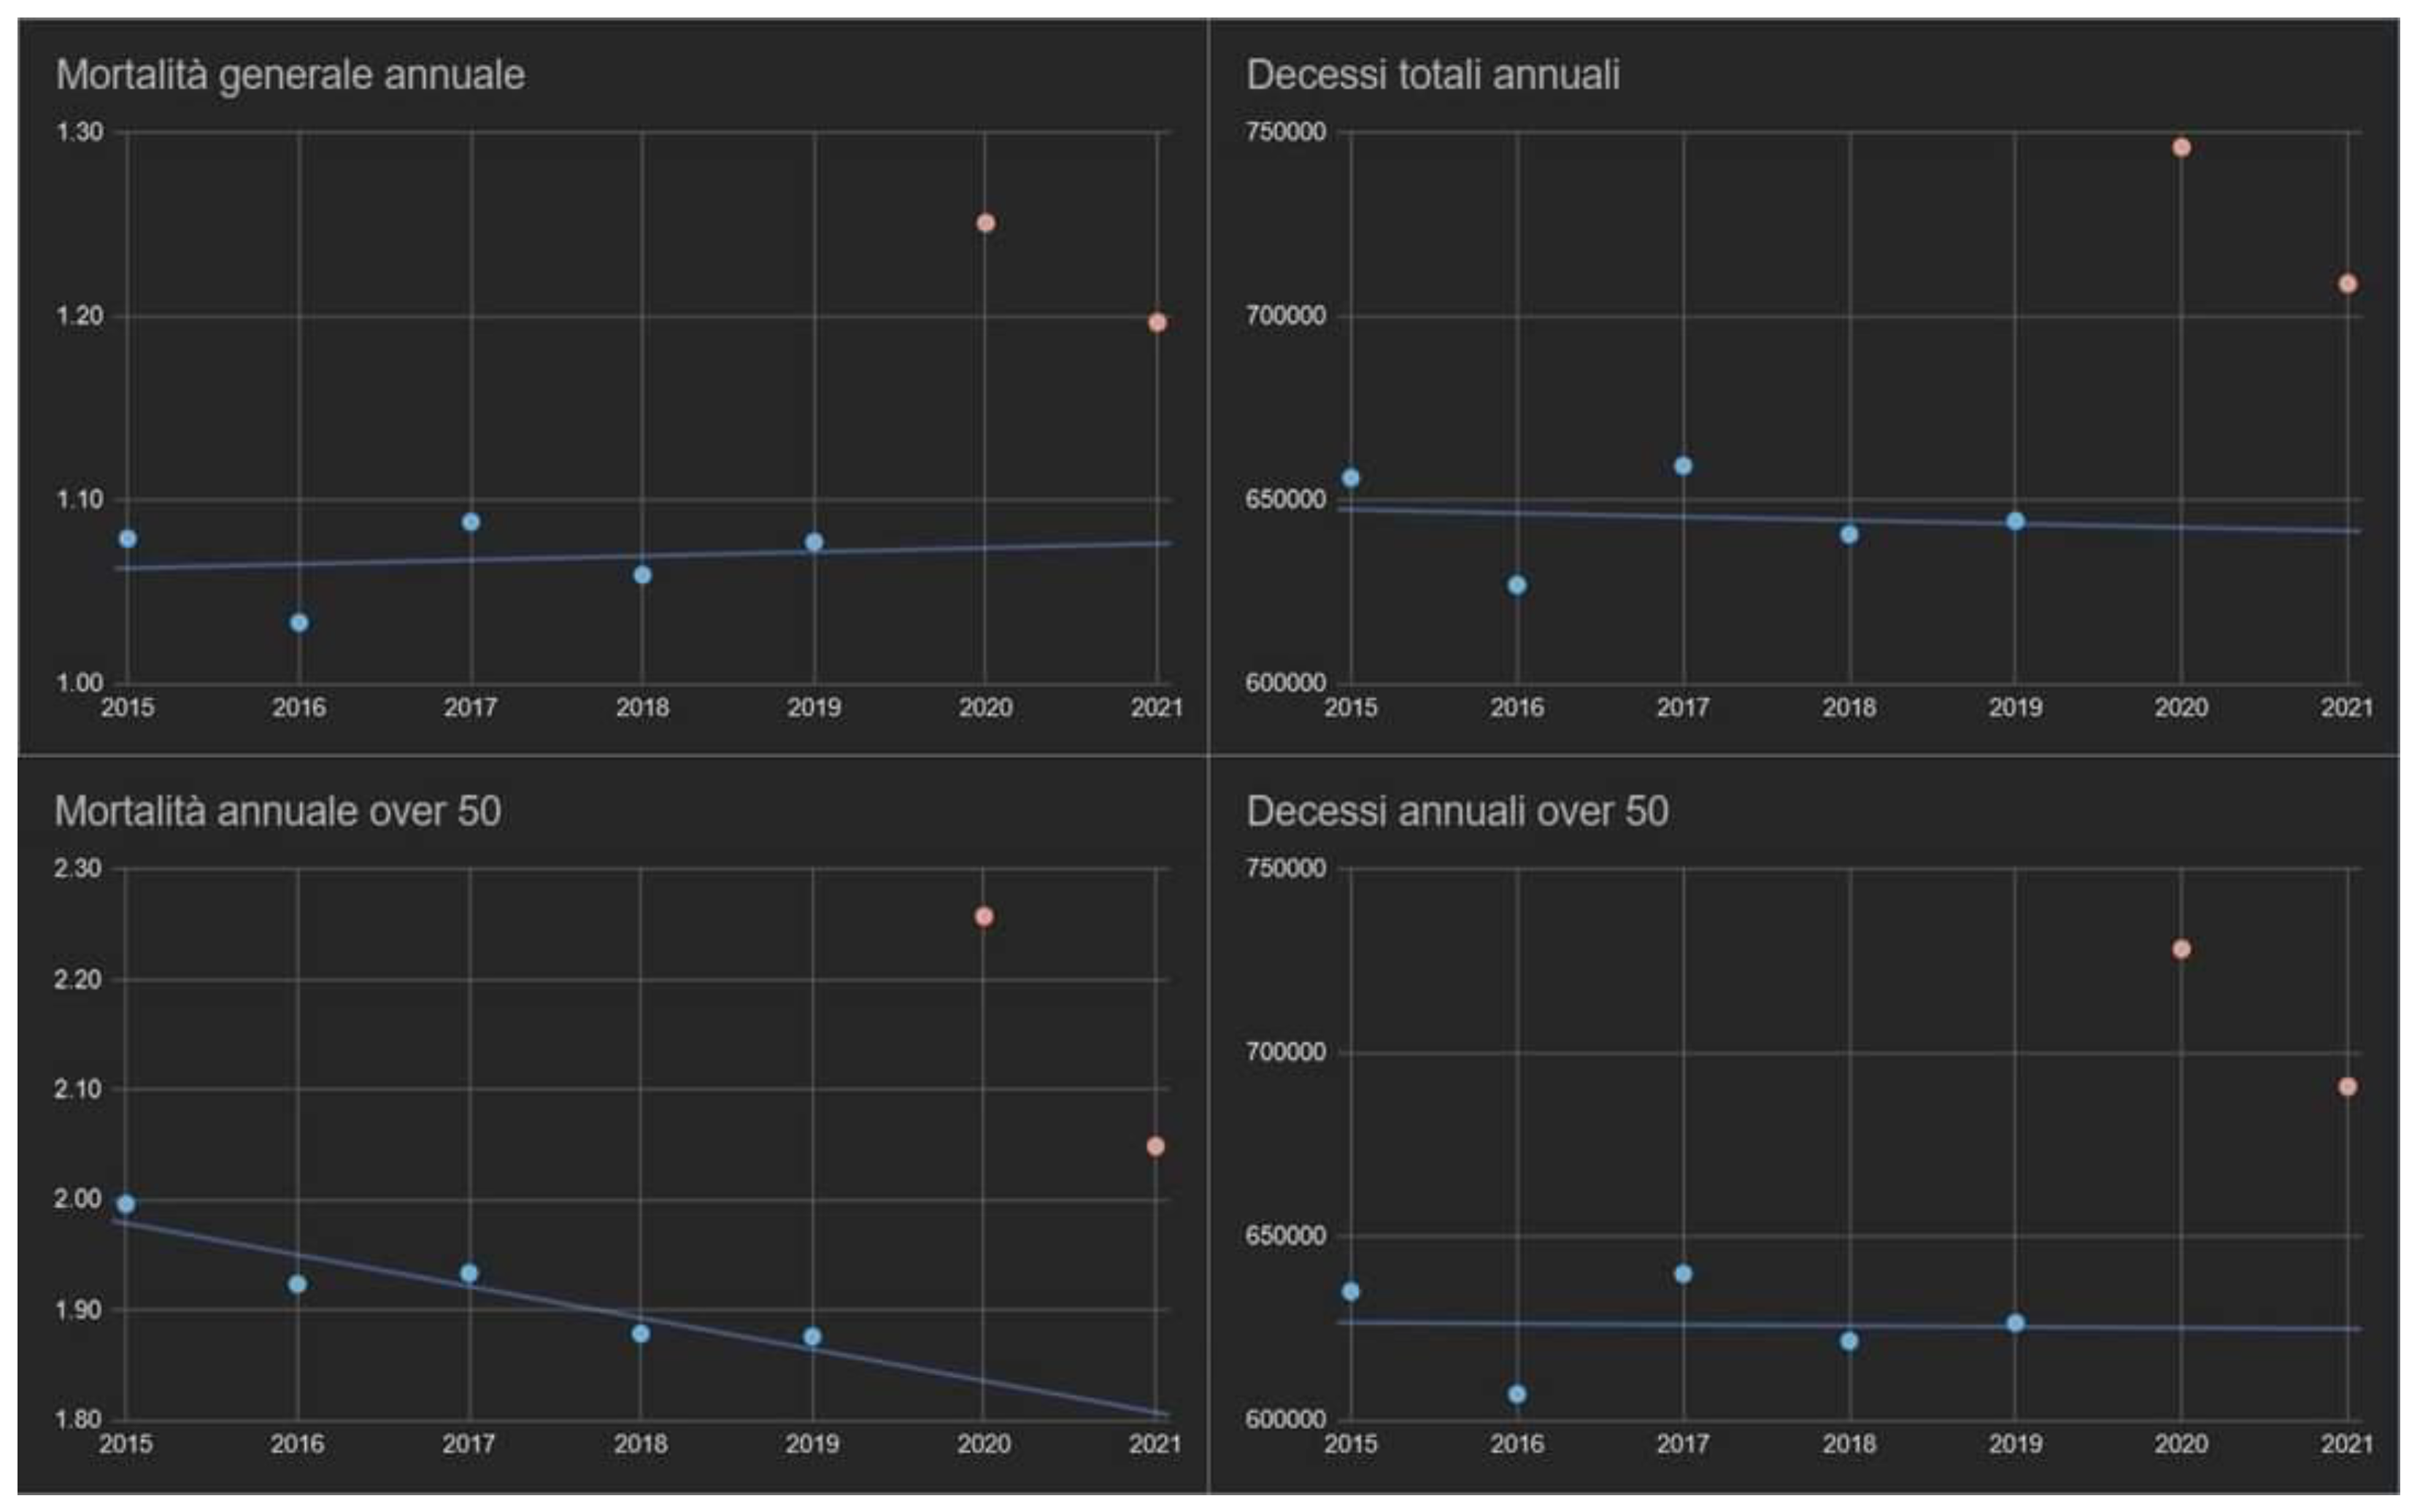
Table 1 shows the monthly distributions of excess mortality and compares them to official COVID-19 cases. The monthly excess deaths from March 2020 to August 2022, compared to the average of the same months during the 2015-2019 period, has a median of 4,200 (IQR = [2,800; 8,000]) and is statistically surprising (one sample Wilcoxon signed rank test S = 28). For the mere scruple, the annual mortality in the same years was also assessed (general and by age group,
Figure A1); the outcome confirmed the absence of trends capable of compromising the statistical significance of the tests adopted. In 2020, there was a discrepancy of over 26,000 deaths between excess deaths and those attributed to COVID-19 from March to December, with a monthly average of 3400 (95% CI = [-100; +inf[) moderately surprising (one sample Welch t-test S = 4). In 2021, the overall annual discrepancy was greatly reduced (only 170 deaths), but with two important notes to be made: the first is that, from January to April, there was a considerable excess of deaths linked to COVID-19 (almost 18,000 official deaths from COVID-19 more than the total surplus of deaths, one sample Wilcoxon signed rank test S = 4); the second is that, from the summer onwards, the opposite occurred (almost 18,000 excess deaths more than those certified by COVID-19, one sample Wilcoxon signed rank test S = 7).
Ergo, the apparent absence of discrepancies is linked to the opposite sign of the two halves of the year. A similar mortality situation occurred in 2022. In this case, two differences are highlighted: the July mortality anomaly and the decrease in swabs carried out during the year plus an increasing positivity (until reaching values similar to spring 2020 during the summer). The difference between cold and hot season mortalities was very marked and surprising in 2020 (mean difference = 14,000, 95% CI = [11,000, +inf[, S = 13) and in 2021 (mean difference = 6,800, 95% CI = [2,600, +inf[, S = 7), while it was less so in 2022 until August (mean difference = 3,400, 95% CI = [600, +inf[, S = 5). During the first three months of 2022, deaths from COVID-19 surpassed those in excess. The situation reversed from April onwards.
2.3. Relationships between COVID-19 deaths, seasonality, and temperature
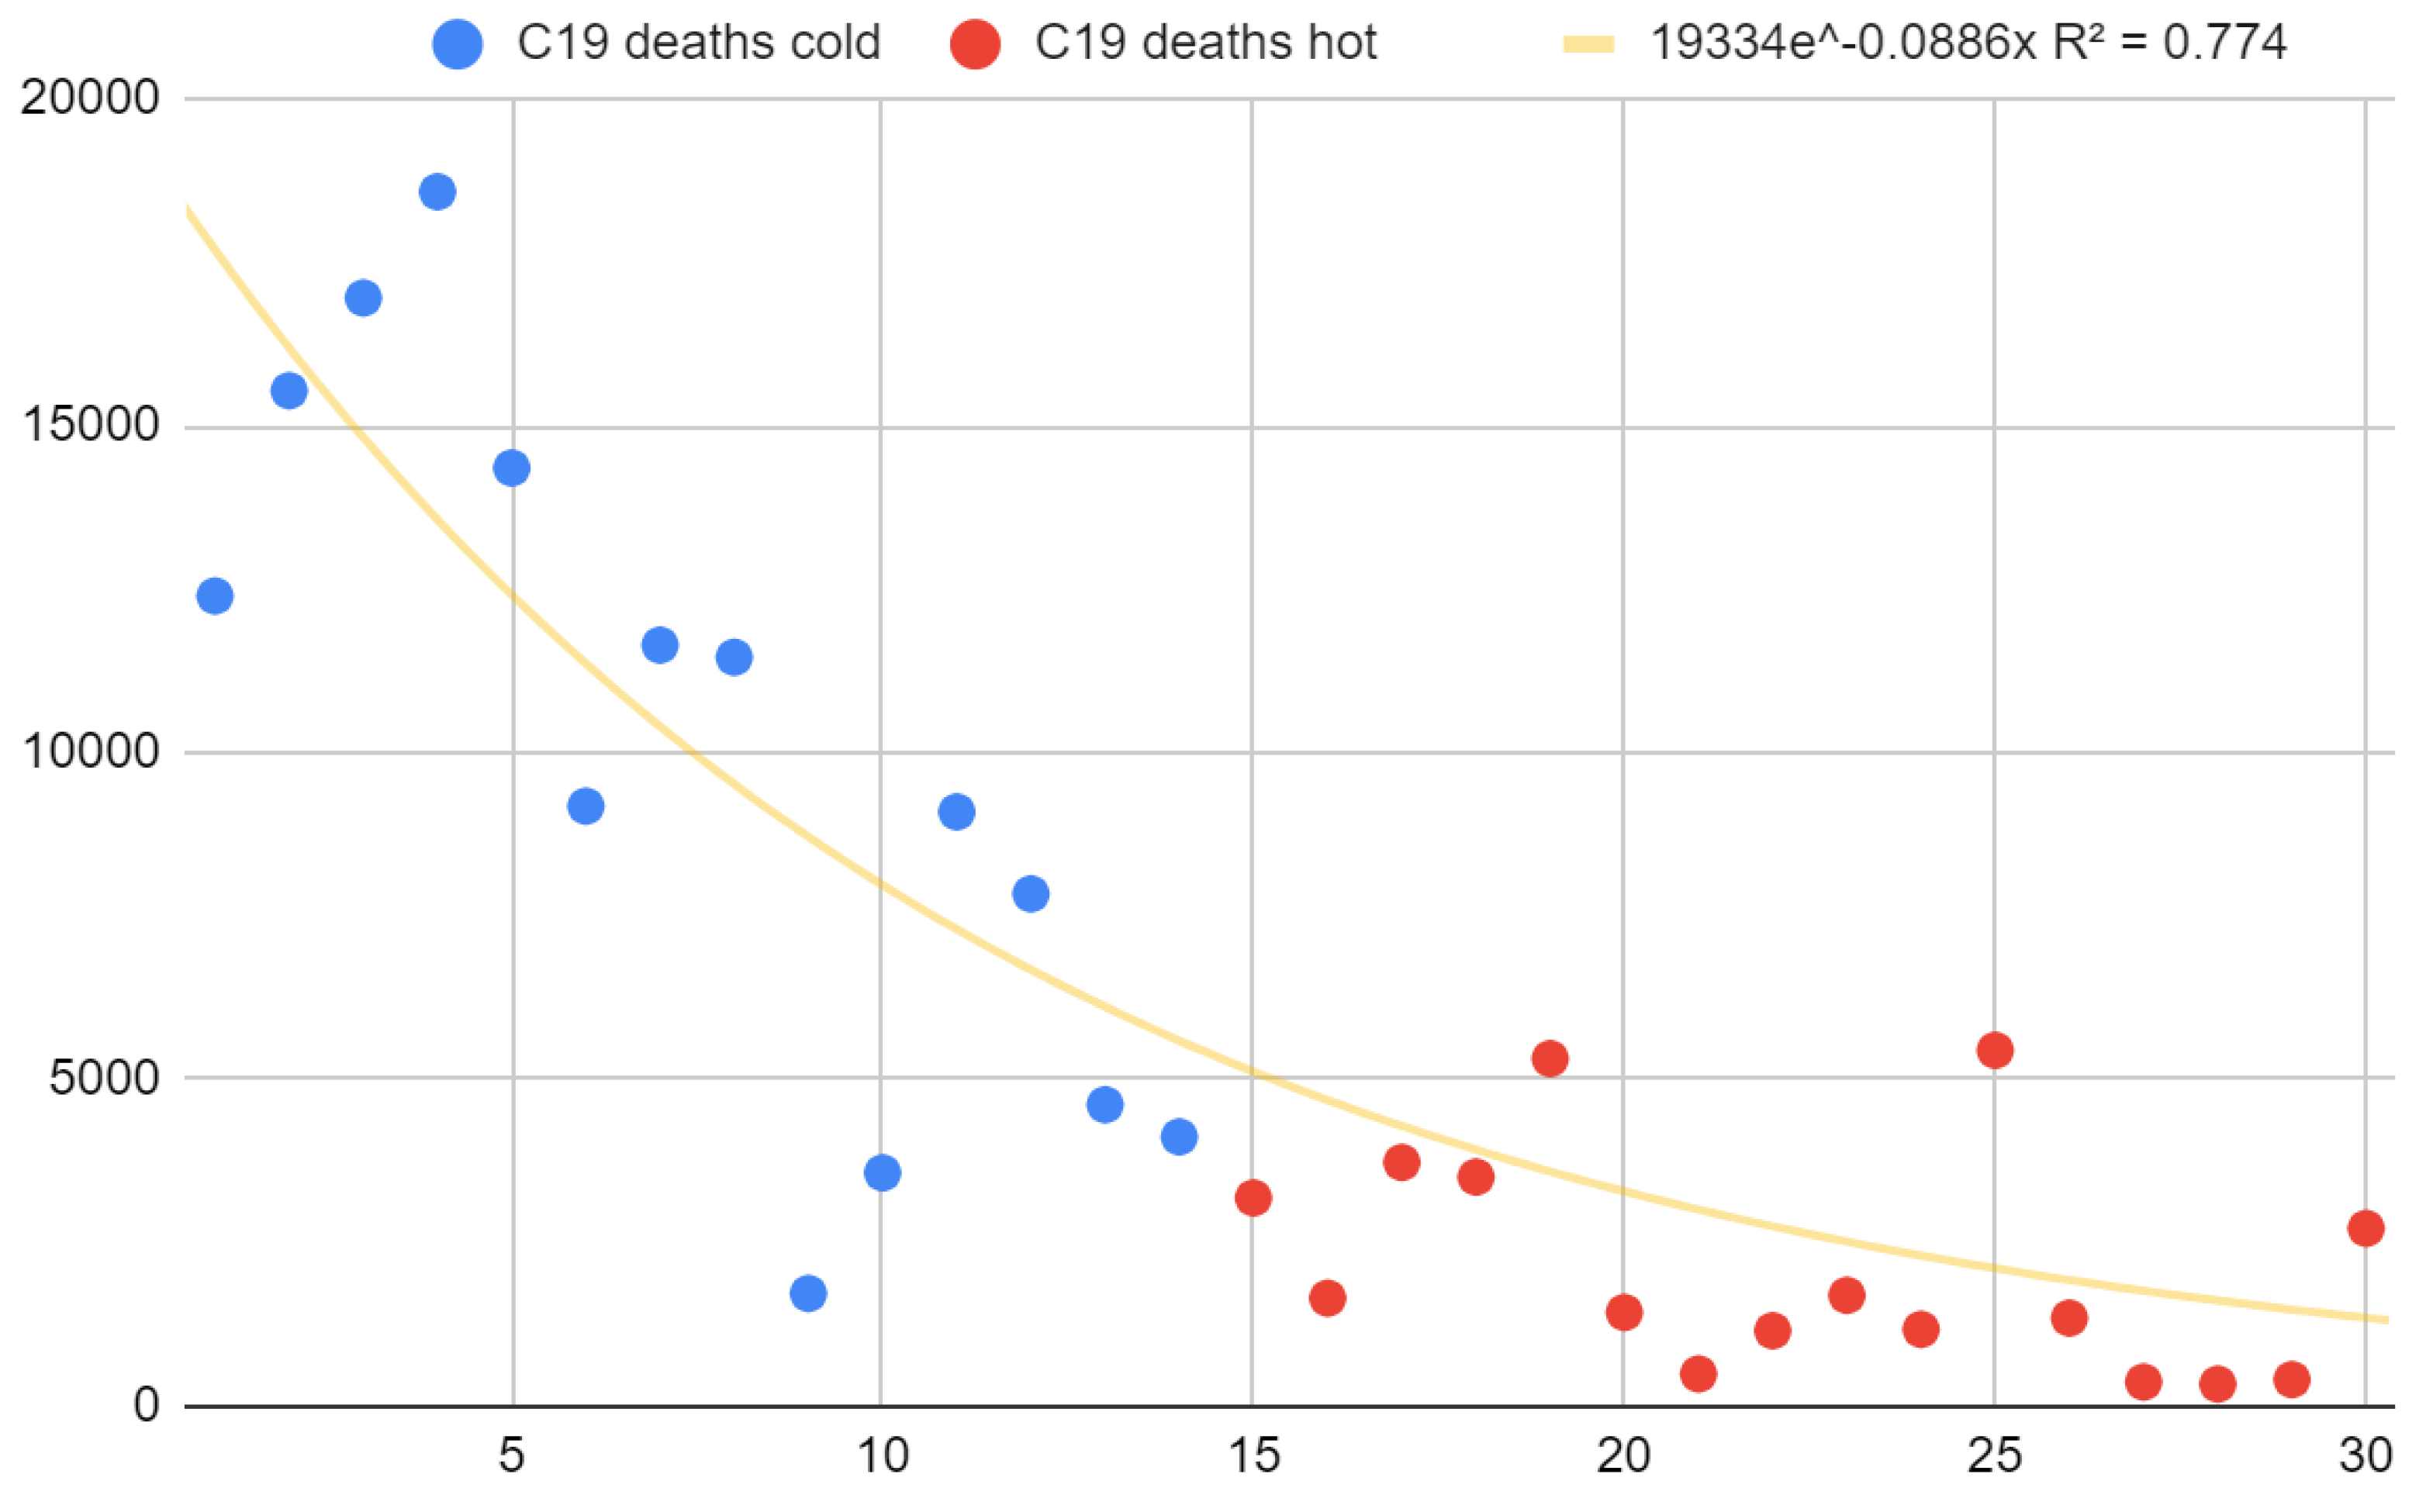
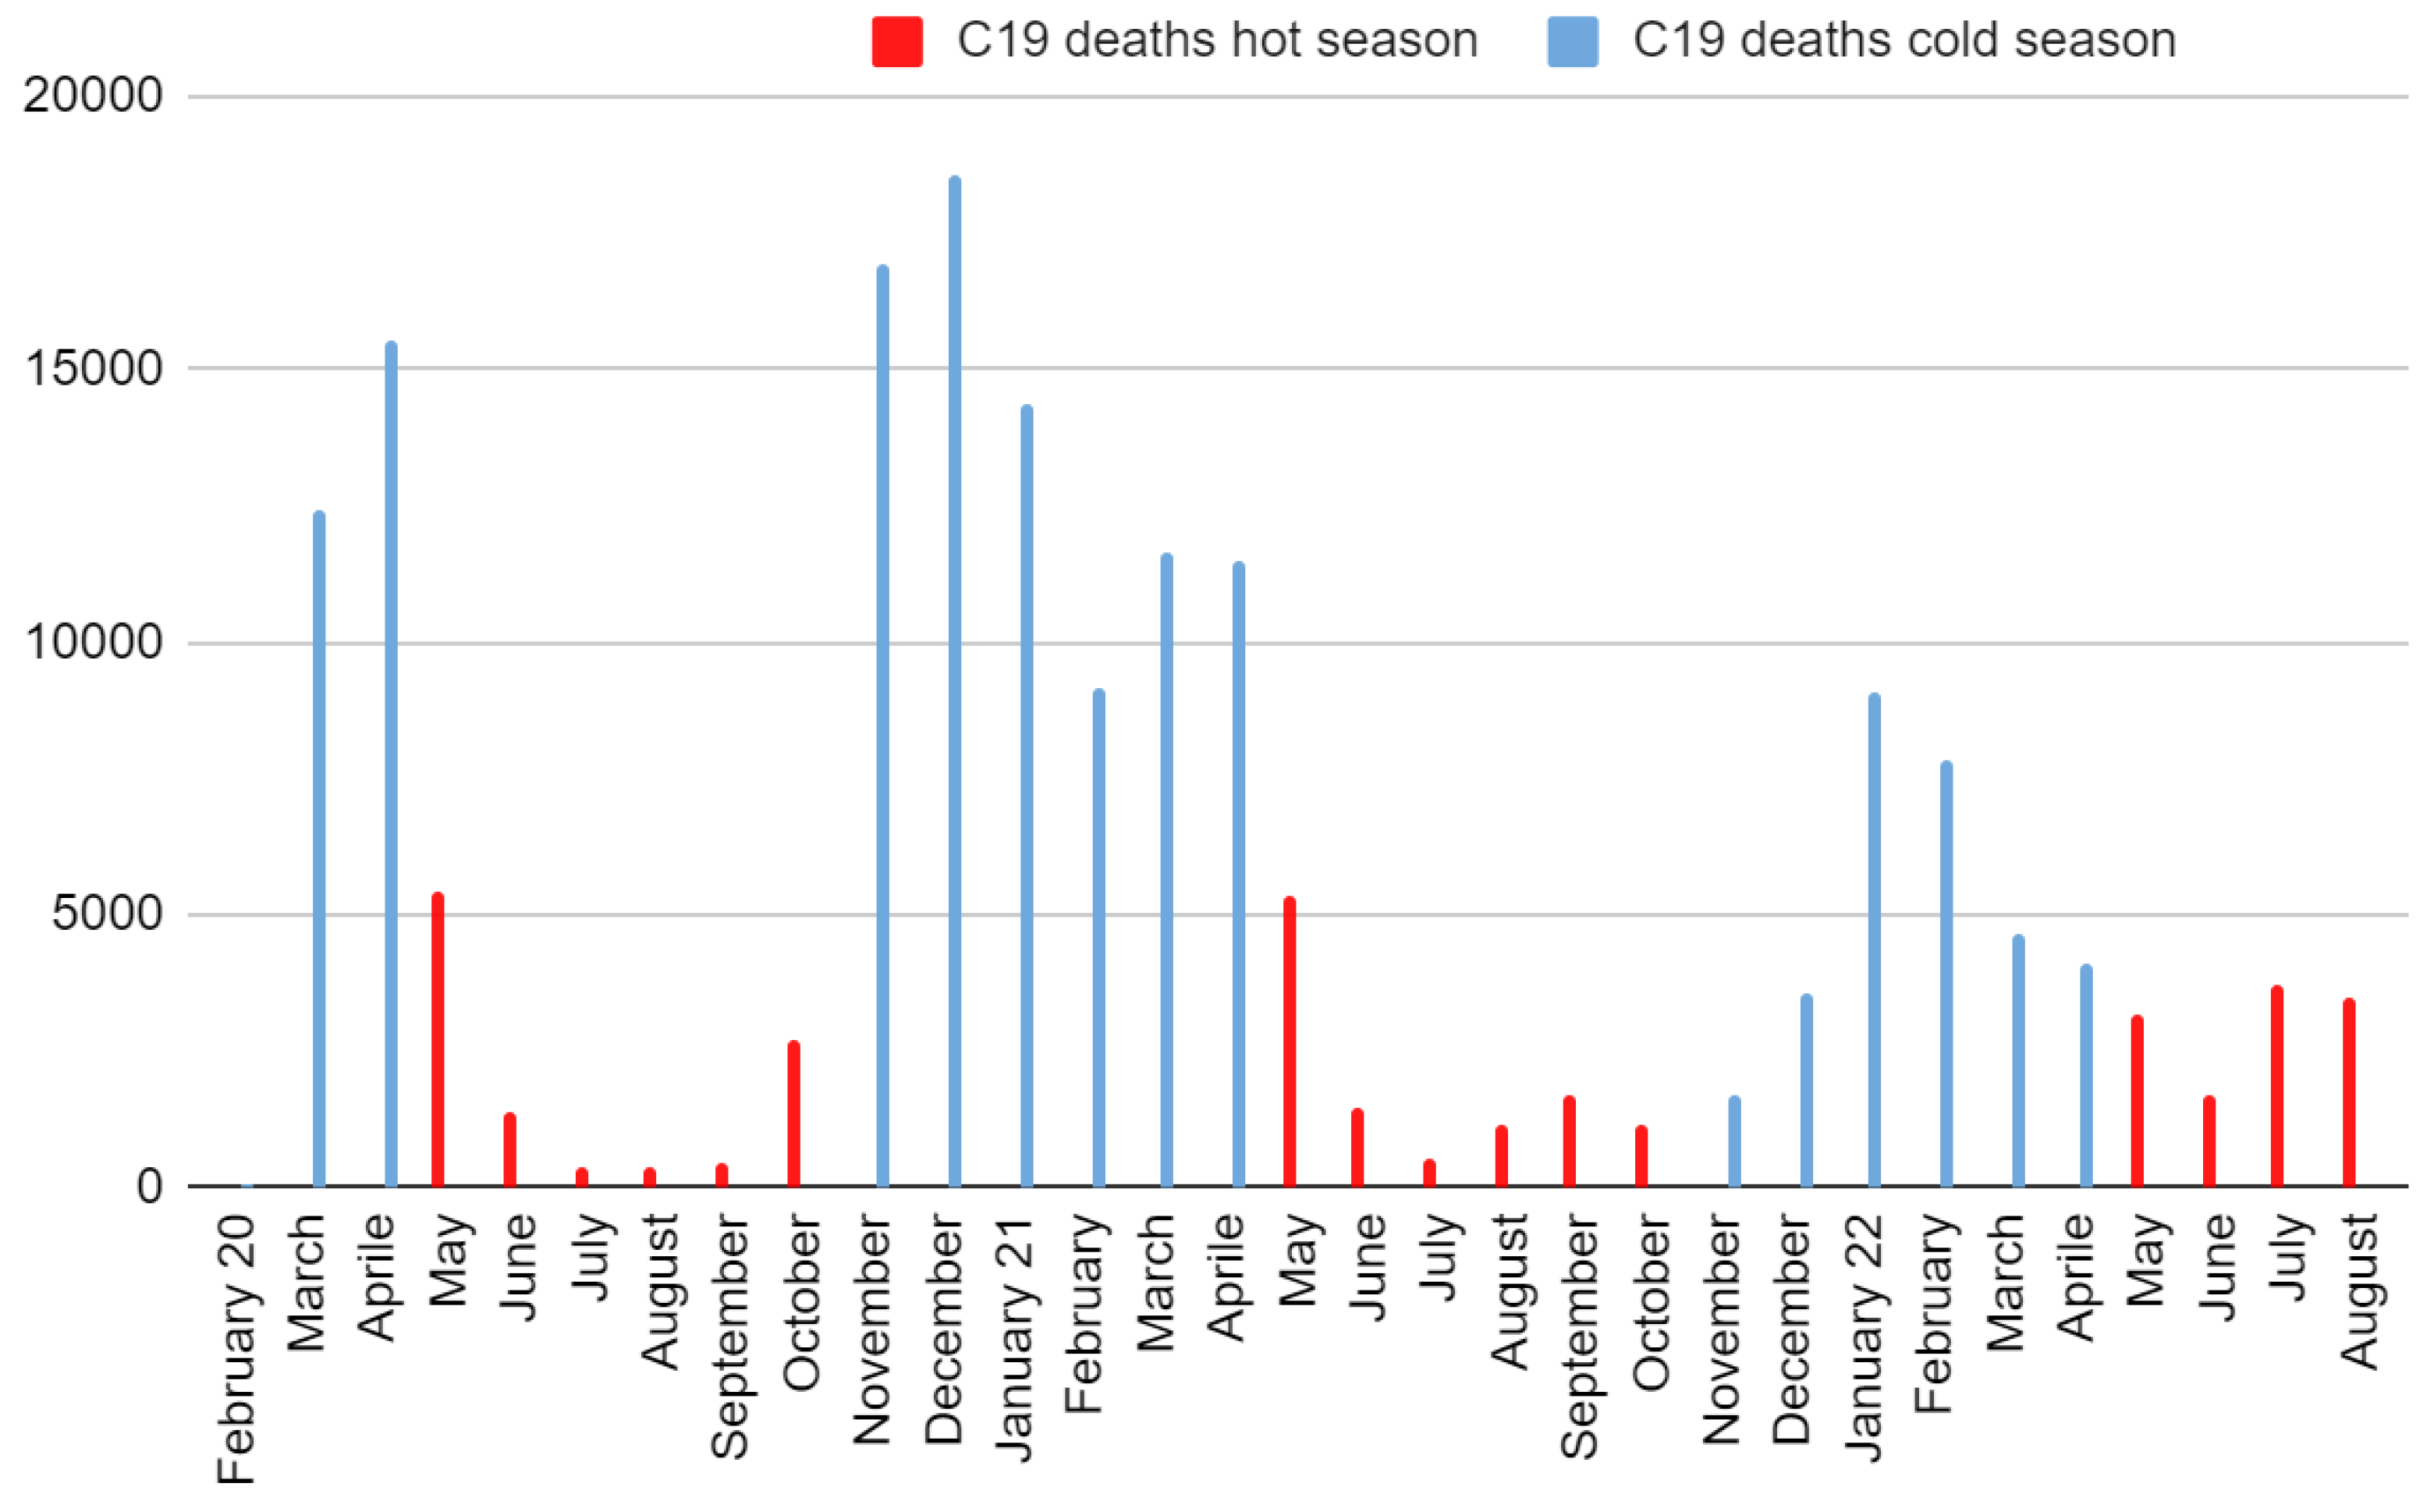
COVID-19 deaths also showed a pronounced seasonality, even if the latter was decreasing over time (
Figure 3). Deaths from COVID-19 in the cold months of 2020, 2021, and 2022 were aligned in the written order, while deaths from COVID-19 in the warm months of 2022, 2021, 2020 were aligned in the written order and positioned consecutively to those of the cold months (
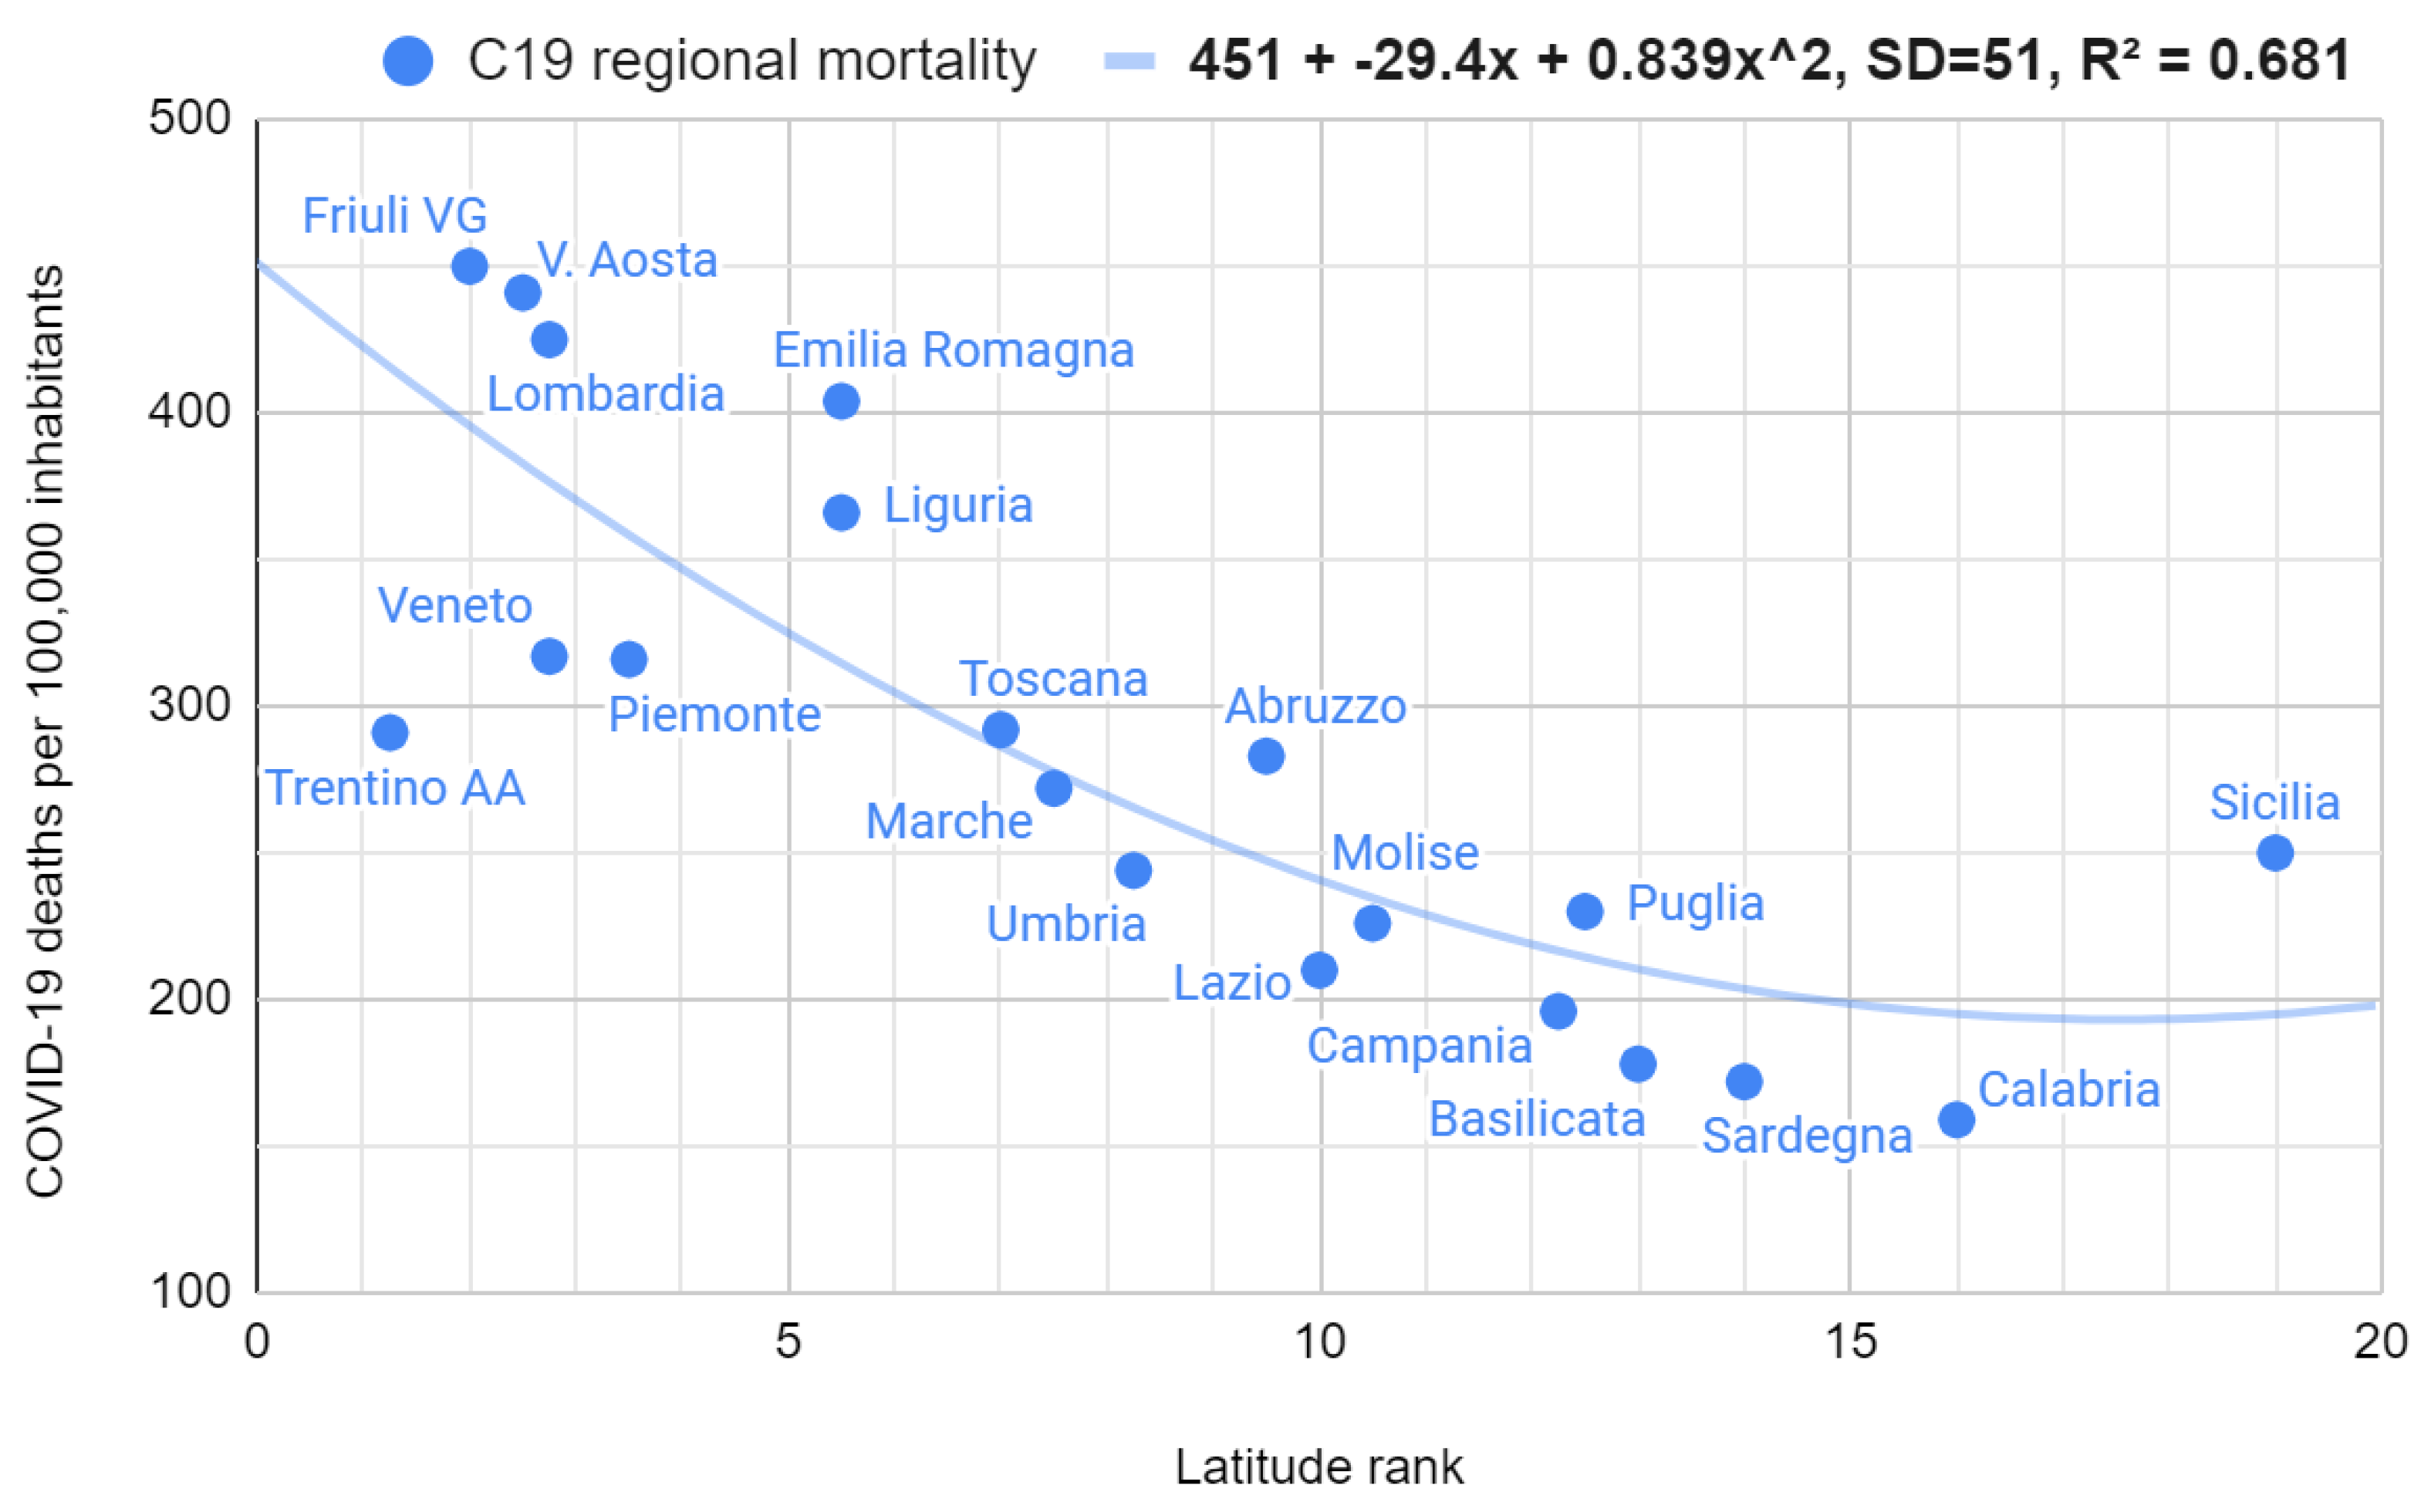
Figure A2). By doing so, it was possible to evaluate the overall trend to demonstrate the lowering of the seasonal effect with a single test, obtaining a markedly and surprisingly decreasing curve (Spearman r = -0.85, 95% CI = [-0.92; -0.70], S = 20). Overall COVID-19 mortality was strongly and surprisingly correlated with regional latitude (Spearman r = 0.86, 95% CI = [0.68; 0.94], S = 20). As with the mortality/temperature relationship, the best model fitting was parabolic (
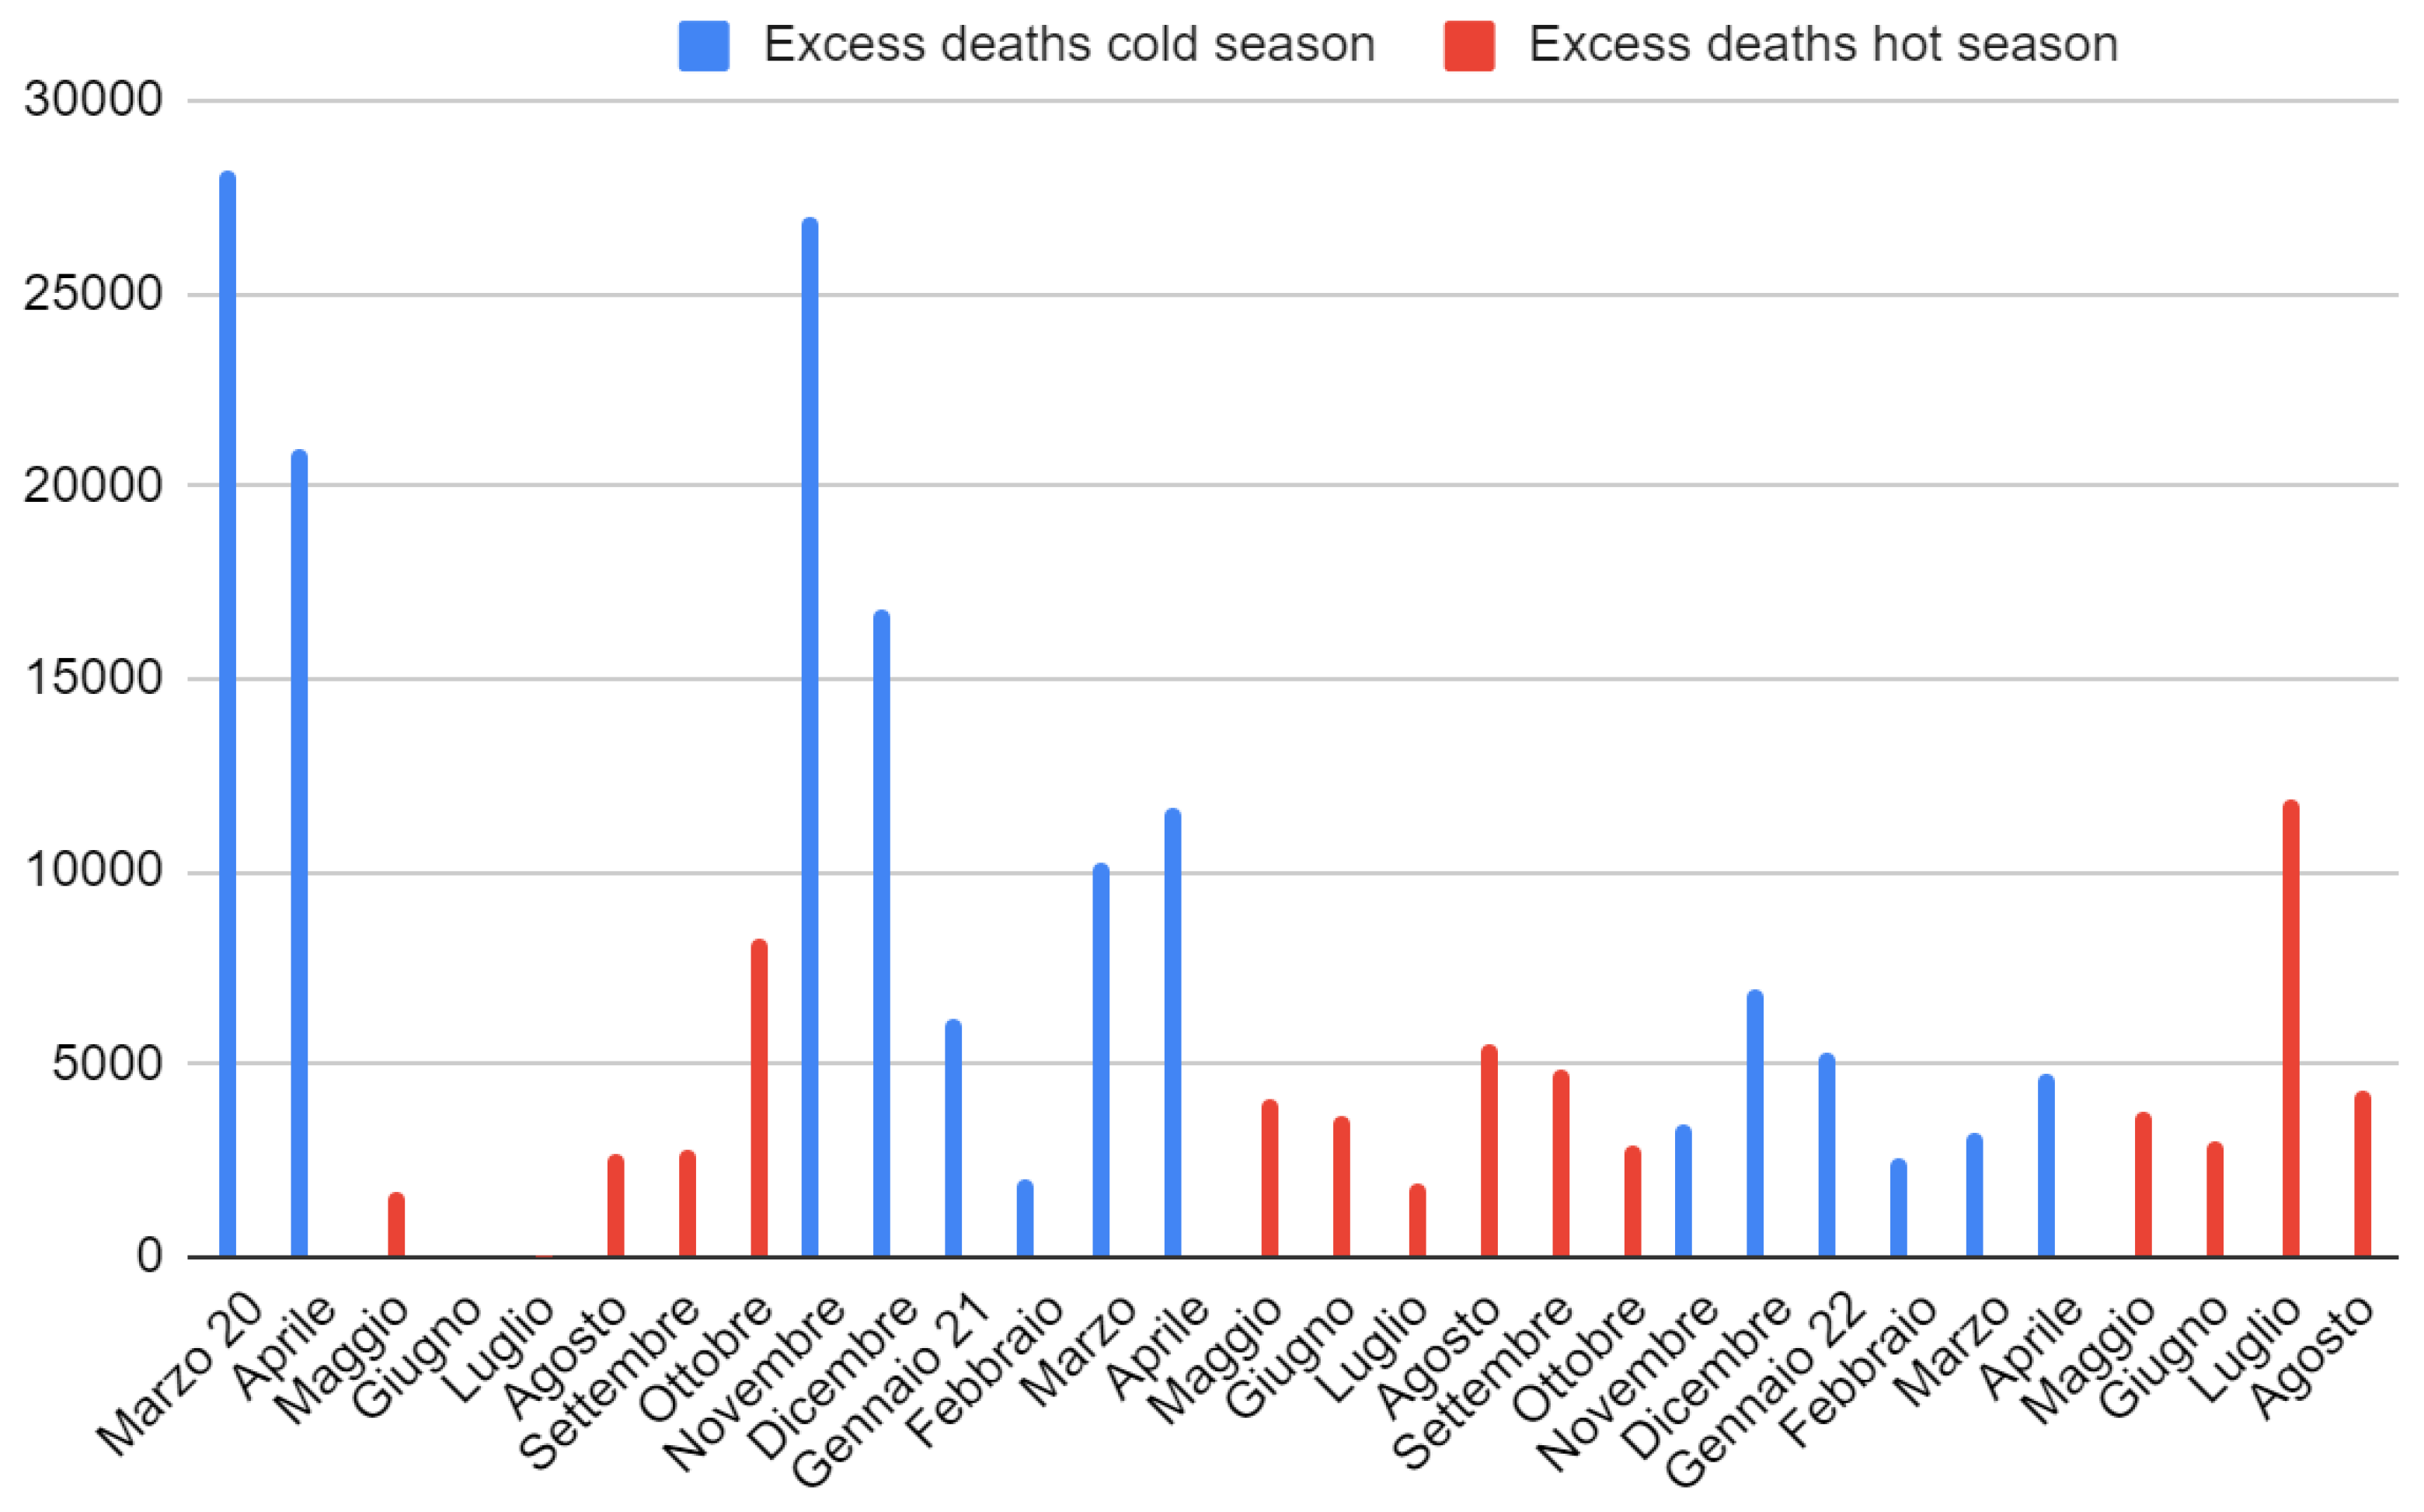
Figure 4). Finally, seasonality of excess deaths decreased until it disappeared completely during 2022 (deaths in the hot months exceeded those in the cold months,
Figure A3).
2.4. Changes in the exposed population
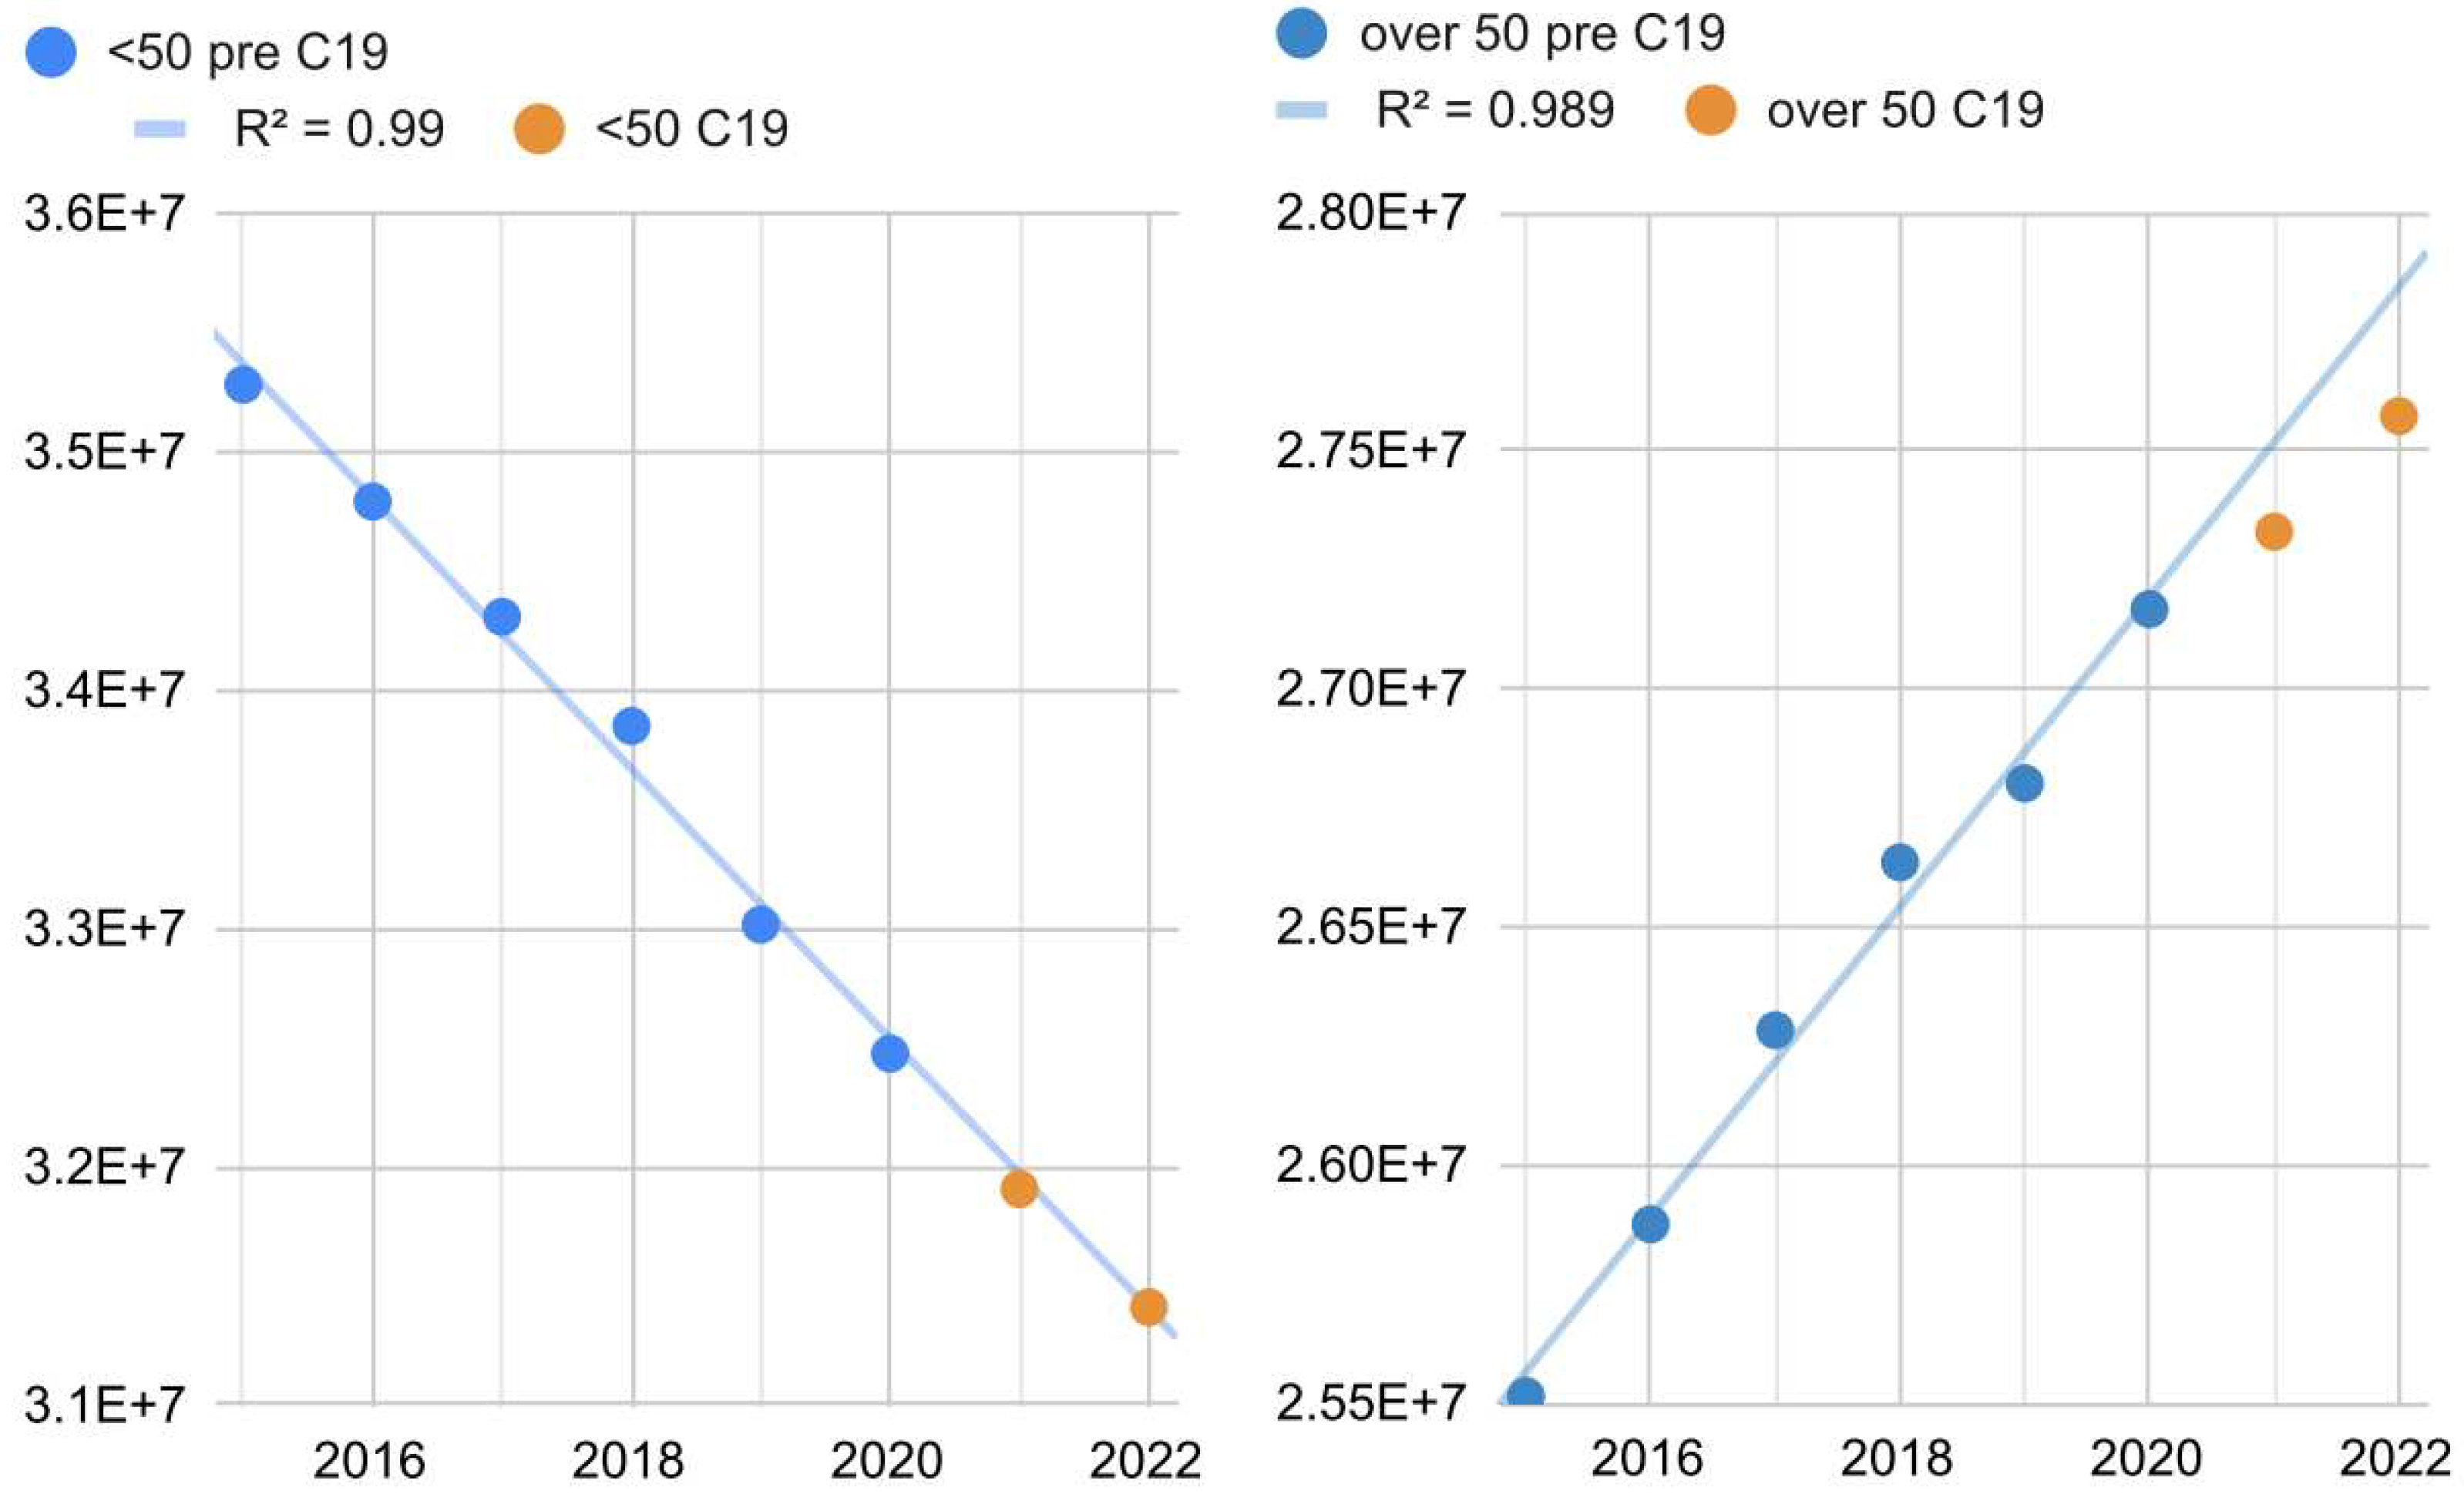
The under-50 population dimension is linearly declining over time, while the over-50 population dimension is linearly increasing over time (R = 0.99, 95% CI = [0.94, 1[,
Figure 5). As far as the population over 50 is concerned, a growing linear trend was observed up to 2020 (+330,000/year, 95% CI: = [290,000; 360,000], S = 22) and a slowdown from 2021 onwards. On the contrary, the population under 50 did not change its demographical behavior, diminishing by 570,000/year (95% CI = [-540,000; -600,000], S = 25).
2.5. Hypotheses supported by quantitative data
2.5.1. Hypothesis 1
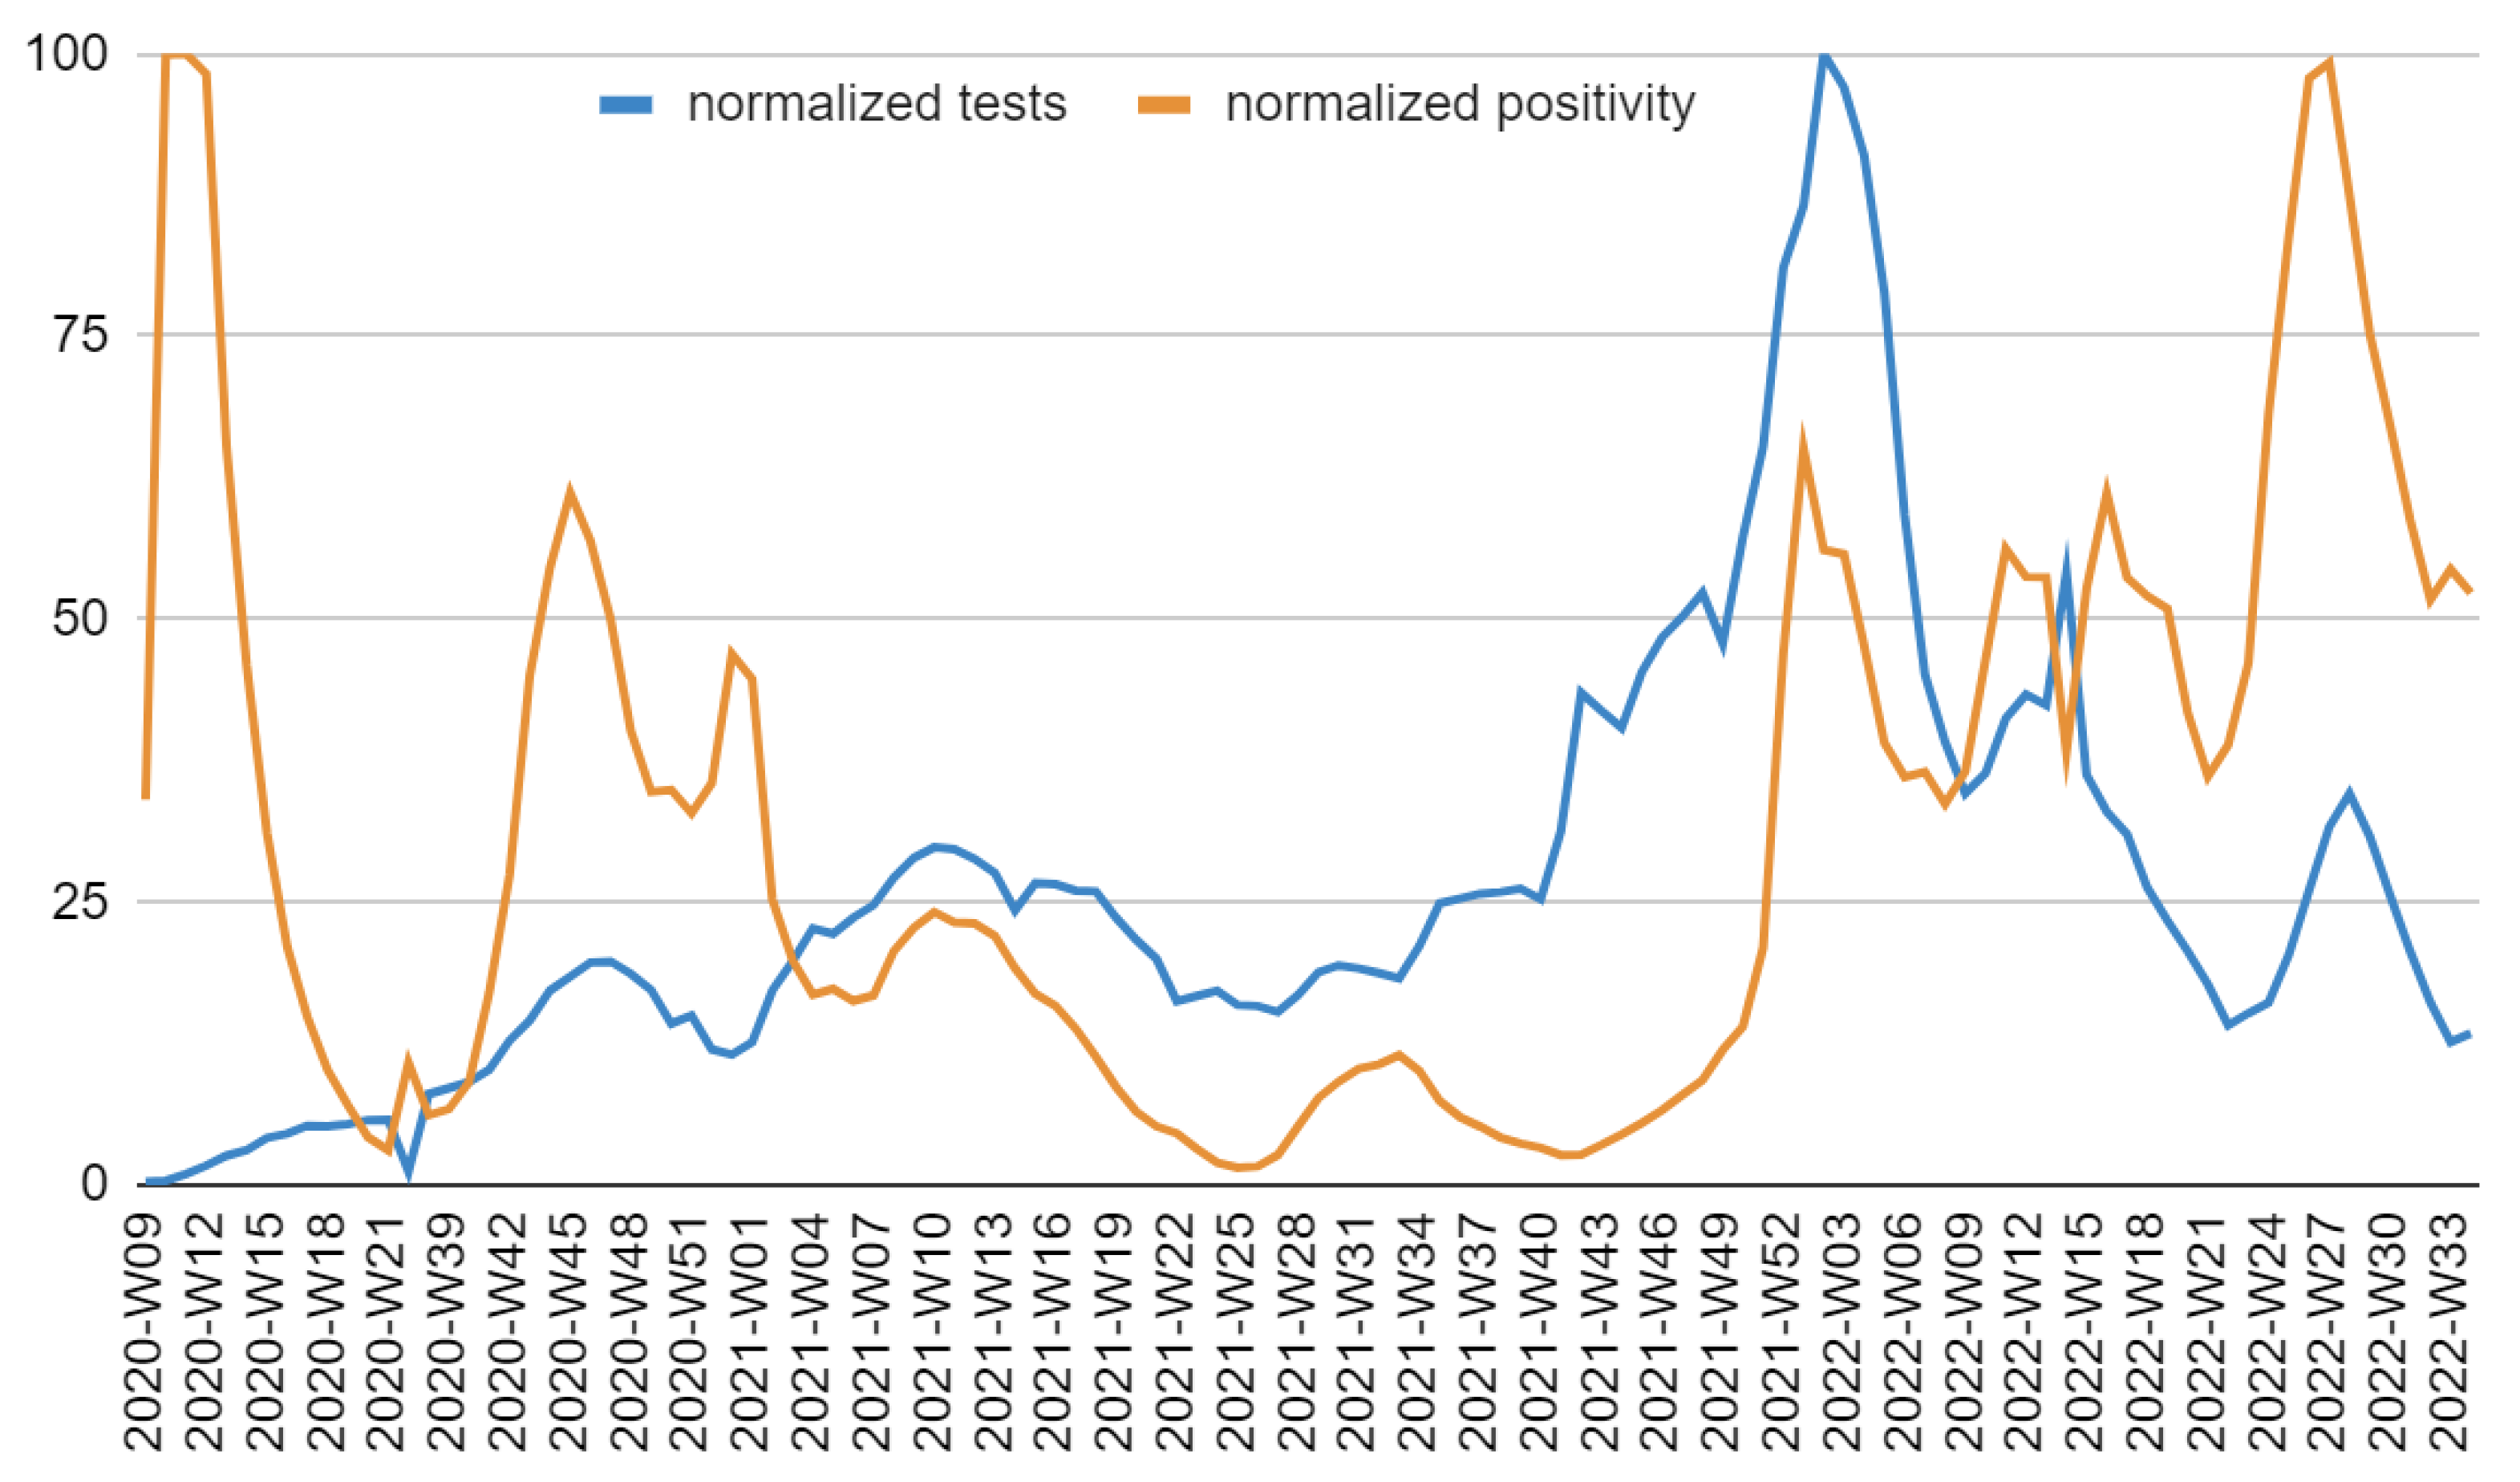
The difference between excess and COVID-19 deaths from March to December 2020 probably arises from insufficient testing capacity during the pandemic's early stages (
Figure A4).
2.5.2. Hypothesis 2
The 2021 situation is surprising due to the fact that there has been a considerable increase in the number of tests performed in the last 6 months (percentage difference = +53%, 95% CI = [27%; +inf[, Welch t-test S = 10) and the non-decrease of official COVID-19 cases, total (2.1 million vs 2.3 million) and monthly (79,000 vs 88,000, 95% CI = [-48,000; +inf[, Welch S < 2).
2.5.3. Hypothesis 3
The 2022 case is plausibly due to a combination of the anomalous waves of COVID-19 and heat [
23].
2.5.4. Hypothesis 4
Regarding the changes in the exposed population, although the Grubbs test found a little degree of surprise for the two potential simultaneous anomalies (S = 3) and a moderate degree of surprise for the single 2022 outlier (S = 5), the deviation from the line is such as to provoke the doubt that the predictions of excess deaths for 2021 and 2022 could be partially underestimated (residual 2021 = 2.9 standard deviations, residual 2022 = 4.2 standard deviations). This could help explain the higher number of COVID-19 deaths compared to the total excess deaths in the winter months but not the excess summer deaths during 2021 and 2022. As for July, the model shown in
Figure 2 explained about 4,000 excess deaths but not the other half. Observing July 2015, subject to a comparable heat wave, it was deduced that the model may have underestimated the deaths; other possible explanations concern the underestimation of deaths from COVID-19 and the overlap of hot temperatures and COVID-19 effects with a non-linear increase in deaths. However, according to official data, the seasonality of COVID-19 mortality has survived, although there has been a progressive increase in deaths during the warm seasons and a decrease during the cold ones (
Figure 3).
3. Discussion
In light of the previous literature on the topic, the findings of this research furnish solid evidence that environmental factors play, directly or indirectly, a substantial role in mortality in Italy. Specifically, in the five years preceding the COVID-19 pandemic, about 45,000 more deaths were recorded in the cold seasons than in the hot ones, corresponding to 7% of total annual deaths. Extensive SARS-CoV-2 infection further exacerbated such an epidemiological scenario, doubling this figure between 2020 and 2021. National mortality and deaths were strongly and surprisingly correlated with monthly minimum temperatures, although the curves showed slightly increasing trends approaching the four highest minimum temperatures. Concerning this last point, the best explanation is that such a rise in deaths is due to the maximum temperatures, whose growth coincided with the growth of the minimums (which made the latter reliable to make predictions). In this regard, it is noteworthy that the parabolic interpolation model provided an optimal approximation of this phenomenon, explaining more than 80% of the variability. The official deaths from COVID-19 also showed a substantial seasonality, although this has decreased over time. Moreover, COVID-19 regional mortality was considerably and significantly correlated with latitude, confirming its possible dependence on low temperatures and/or other closely related local factors. As of September 2022, the estimate of excess deaths showed partial seasonality up to the beginning of 2022 and lost this property during the summer (where deaths exceeded those of the cold months). Finally, the rapid aging of the population, in addition to a generational turnover problem, increases the annual number of individuals exposed to health problems.
Alongside this statistically clear evidence, some anomalies were identified. COVID-19 official deaths in the early stages of 2020 were underestimated mainly due to poor diagnostic testing capabilities. The variability of the testing rate and methods could have even further affected the estimate of official cases and deaths in the following years. During the winter months of 2021 and 2022, certified COVID-19 deaths surpassed the total excess deaths estimated by the comparison model. This scenario is compatible with the following hypotheses: i) deaths linked merely to COVID-19 have been overestimated, ii) there has been a decrease in deaths linked to other causes, iii) the population exposed to the main mortality causes varied unexpectedly. The first two hypotheses could concern an overlap of causes of mortality, such as the so-called “twindemic” (seasonal flu and COVID-19 co-infection) [
8]. Indeed, the population most exposed to the two diseases is similar, and COVID-19 could have been a simple concause of death (especially during the 2021-2022 winter). This explanation may be valid for the 2021-2022 winter but not for the 2020-2021 winter, where seasonal flu has reached historic lows due to the health countermeasures adopted for COVID-19 [
24]. In addition, the mortality difference between vaccinated and unvaccinated underlines that, in general, COVID-19 is a direct cause of excess mortality [
25]. Finally, other combinations of diseases – not just viral – and COVID-19 should also be considered. For instance, cold-related risk factors include cardiovascular stress, bronchoconstriction, suppression of mucociliary defenses, and other immunological reactions [
17]. As for the third hypothesis, there is partial evidence (high effect size but moderate significance) that the trend of the population over 50 may have changed since the arrival of the pandemic. The correctness of the latter result is further supported by the fact that it concerns the age group most exposed to COVID-19. In contrast, excess deaths were greater during the summer months. This scenario is compatible with the following hypotheses: i) the molecular swabs had a lower sensitivity to the variants of concern Delta and Omicron [
26,
27,
28,
29,
30], ii) the testing capabilities were not sufficient [
29,
30], iii) the course of COVID-19 in some of the patients recovered has led to a progressive worsening of their conditions until death (e.g., long-COVID, overload of health facilities, damage psychological) [
31,
32,
33], and iv) an anomalous cause of mortality has occurred (e.g., unexpectedly high temperatures) [
34]. The first hypothesis is implausible since this situation should have also happened in winter; however, the possibility of connections with subvariants remains. On the other hand, the second hypothesis is validated by the summer drop in diagnostic tests (especially during 2022, where the positivity rate was similar to that of the first wave). Finally, the third and fourth hypotheses are compatible with the epidemiological situation linked to the extreme heat wave detected (especially during July, i.e., the month with the highest excess deaths in 2022 until September 2022).
Regardless of the causal reasons, these findings indicate that the public health risk in Italy is much greater in the winter or during extremely hot periods. Current and future health policies must be calibrated on this evidence. Specifically, the healthcare system must be ready not only to handle a greater flow of patients in these specific situations but also to bear the impact of other novel diseases and epidemiological phenomena. Indeed, although the opinion of the scientific community on the seasonality of COVID-19 is not unanimous, up to now, the number of COVID-19 deaths in Italy has been markedly higher in the winter periods, which, in fact, poses a risk of overcrowding hospitals due to the combination of the novel pandemic with the other historical seasonal hazard factors. Furthermore, even assuming constant COVID-19 mortality during the year, the risk would still be higher during winter due to the decrease in the relative capacities of health care. Finally, this aspect is essential for public health in light of known future emergencies such as climate change.
This study is subject to limitations. First, the semi-exploratory character prevents certain causal conclusions from being drawn. Nonetheless, it should be remarked that the research hypotheses are well targeted on the existing literature, which makes these statistically solid findings capable of supporting more specific investigations. The importance of this simple approach is frequently disregarded or undervalued, to the extent that some authors dishonestly and detrimentally claim to have discovered substantial proof of causation even in cases where they did not [
35,
36]. Second, inter-regional situations have not been included in the models. Ergo, local epidemiological features may have partially confused the data or been overlooked. Finally, excess deaths and mortality evaluations are based on the counterfactual scenario “What would have happened without COVID-19?” [
36]. Comparing past and present periods assumes that, without the COVID-19 crisis, the two situations would have been similar. However, even if COVID-19 suddenly disappeared, this hypothesis would be violated since the disease has changed factors relevant to determining the epidemiological scenario (e.g., people's behavior and attitude). Hence, it is difficult to assess how much the violation of this assumption affected the results from 2021 onwards (2020 is undoubtedly less subjected to this problem). In this regard, it is necessary to underline that the more the years go by, the more uncertain the historical comparisons based on counterfactual scenarios will be.
4. Materials and Methods
Population. All subjects residing in Italy from January 2015 to August 2022 were included.
Data collection. The following data was used:
Total monthly and annual deaths from January 2015 to August 2022 in Italy were downloaded from the “Tableau Public” web page and from the web page “Decessi e cause di morte: cosa produce l’ISTAT” of the Istituto Nazionale di Statistica (ISTAT) [
18,
19].
COVID-19 new cases, deaths, and diagnostic tests from February 2020 to August 2022 in Italy were downloaded from the “Download COVID-19 data sets” web page of the “European Centre for Disease Prevention and Control” [
20].
Historical average maximum and minimum temperatures in Italy were downloaded from the “Il Meteo” web page of “iLMeteo s.r.l.” [
21].
Annual demographic size by age group (data as of January 1 of the current year) was downloaded from the “Dati ISTAT” web page of the Istituto Nazionale di Statistica (ISTAT) [
22].
Study design. This study is longitudinal retrospective. The distribution of deaths based on monthly temperatures from 2015 to 2019 was analyzed to highlight any correlations. A model was built to estimate the average death rate as a function of temperature in Italy and the three macro-areas “Nord,” “Centro,” and “Mezzogiorno.” The deaths during 2020, 2021, and 2022 were compared with those of the period 2015-2019 in order to highlight any anomalies caused by the COVID-19 crisis. The excess deaths obtained from the previous procedure were compared with COVID-19 confirmed deaths to highlight any discrepancies and correlations with monthly temperatures and regional latitude (a good indicator of regional temperatures). Diagnostic swabs, positivity rate, and demographic variations in the population were used to investigate possible causes of the discrepancies found. Finally, the seasonality of COVID-19 confirmed deaths and excess deaths were analyzed in order to find any seasonality.
5. Conclusions
This evidence support that the cold season constitutes a greater epidemiological risk than the hot season. Specifically, higher mortality is associated with low average minimum temperatures, although the death curve rises moderately in the warmer months. Mortality peaks are also detected in the presence of very high average maximum temperatures (in particular, above 30°C). Until August 2022, the COVID-19 pandemic caused a sharp seasonal increase in mortality, although that seasonality is decreasing. On the contrary, the increase in general mortality due to the complexity of the health crisis showed seasonality until 2021; in 2022, it was subject to other events, such as the combination of strong summer heat and COVID-19 waves (Omicron variants). Moreover, COVID-19 mortality notably increases with latitude. Finally, unexpected interactions between epidemiological variables, such as co-infections, comorbidities, and cold-induced risk factors but also reduced risk factors (e.g., due to pandemic-related health countermeasures), and changes in the most exposed population (e.g., due to population demographic changes, COVID-19 vaccination coverage changes, or SARS-CoV-2 new variants), could play a relevant role in determining the severity of the health crisis. This could also help explain the differences between COVID-19 deaths and excess deaths. For these reasons, it is essential to consider that: i) the epidemiological risk is seasonal and cold seasons are markedly more dangerous for public health, ii) the impact of COVID-19 on public health could be strongly influenced by both environmental/seasonal and virological variables (e.g., mutations, immunological memory), iii) the increase in temperatures due to climate change can create summer mortality peaks. Health authorities are called to develop policies that take these factors into account since the epidemiological risk cannot be disjointed from the local epidemiological context. This is even more urgent considering the rapid annual aging of the population. In particular, health systems need to be strengthened during cold seasons and in anticipation of heat waves during summer. At the same time, the scientific community must interpret the debate on the COVID-19 seasonality in light of such evidence and analyses. Future research should investigate the causal interrelation between all these epidemiological factors, considering the system's complexity to create an all-encompassing model for prediction and surveillance.
Author Contributions
AR is the sole author.
Funding
This study did not receive fundings.
Data Availability Statement
All the data used is reported in the manuscript or can be found in the sources listed in the references.
Conflicts of Interest
The author declares he has no conflict of interest.
Appendix A
Figure A1.
Annual deaths and mortality in Italy from 2015 to 2021.
Figure A1.
Annual deaths and mortality in Italy from 2015 to 2021.
Figure A2.
Degrowth of the seasonal effect of COVID-19 on mortality from March 2020 to August 2022.
Figure A2.
Degrowth of the seasonal effect of COVID-19 on mortality from March 2020 to August 2022.
Figure A3.
Trend of monthly excess deaths from March 2020 to August 2022 in Italy.
Figure A3.
Trend of monthly excess deaths from March 2020 to August 2022 in Italy.
Figure A4.
Diagnostic tests for SARS-CoV-2 and positivity: normalized weekly values in Italy up to July 2022. The maximum positivity was 28%, while the maximum test frequency was almost 12,900 tests per 100,000 inhabitants.
Figure A4.
Diagnostic tests for SARS-CoV-2 and positivity: normalized weekly values in Italy up to July 2022. The maximum positivity was 28%, while the maximum test frequency was almost 12,900 tests per 100,000 inhabitants.
References
- Zang ST, Luan J, Li L, Yu HX, Wu QJ, Chang Q, Zhao YH. Ambient air pollution and COVID-19 risk: Evidence from 35 observational studies. Environ Res. 2022 Mar;204(Pt B):112065. [CrossRef]
- Hernandez Carballo I, Bakola M, Stuckler D. The impact of air pollution on COVID-19 incidence, severity, and mortality: A systematic review of studies in Europe and North America. Environ Res. 2022 Aug 27;215(Pt 1):114155. [CrossRef]
- D'Amico F, Marmiere M, Righetti B, Scquizzato T, Zangrillo A, Puglisi R, Landoni G. COVID-19 seasonality in temperate countries. Environ Res. 2022 Apr 15;206:112614. [CrossRef]
- Yin C, Zhao W, Pereira P. Meteorological factors' effects on COVID-19 show seasonality and spatiality in Brazil. Environ Res. 2022 May 15;208:112690. [CrossRef]
- Fontal A, Bouma MJ, San-José A, López L, Pascual M, Rodó X. Climatic signatures in the different COVID-19 pandemic waves across both hemispheres. Nat. Comput. Sci. 2021 Oct 21;1:655–665. [CrossRef]
- Majumder P, Ray PP. A systematic review and meta-analysis on correlation of weather with COVID-19. Sci Rep. 2021 May 24;11(1):10746. [CrossRef]
- Cappi R, Casini L, Tosi D, Roccetti M. Questioning the seasonality of SARS-COV-2: a Fourier spectral analysis. BMJ Open. 2022 Apr 20;12(4):e061602. [CrossRef]
- Callaway, E. Will there be a COVID winter wave? What scientists say. Nature. 2022 Oct 3. [CrossRef]
- de Frel DL, Atsma DE, Pijl H, Seidell JC, Leenen PJM, Dik WA, van Rossum EFC. The Impact of Obesity and Lifestyle on the Immune System and Susceptibility to Infections Such as COVID-19. Front Nutr. 2020 Nov 19;7:597600. [CrossRef]
- Bajpai G, Nahrendorf M. Infectious and lifestyle modifiers of immunity and host resilience. Immunity. 2021 Jun 8;54(6):1110-1122. [CrossRef]
- Gold MS, Sehayek D, Gabrielli S, Zhang X, McCusker C, Ben-Shoshan M. COVID-19 and comorbidities: a systematic review and meta-analysis. Postgrad Med. 2020 Nov;132(8):749-755. [CrossRef]
- Singh MK, Mobeen A, Chandra A, Joshi S, Ramachandran S. A meta-analysis of comorbidities in COVID-19: Which diseases increase the susceptibility of SARS-CoV-2 infection? Comput Biol Med. 2021 Mar;130:104219. [CrossRef]
- Ng WH, Tipih T, Makoah NA, Vermeulen JG, Goedhals D, Sempa JB, Burt FJ, Taylor A, Mahalingam S. Comorbidities in SARS-CoV-2 Patients: a Systematic Review and Meta-Analysis. mBio. 2021 Feb 9;12(1):e03647-20. [CrossRef]
- Cheng S, Zhao Y, Wang F, Chen Y, Kaminga AC, Xu H. Comorbidities' potential impacts on severe and non-severe patients with COVID-19: A systematic review and meta-analysis. Medicine (Baltimore). 2021 Mar 26;100(12):e24971. [CrossRef]
- Puri A, He L, Giri M, Wu C, Zhao Q. Comparison of comorbidities among severe and non-severe COVID-19 patients in Asian versus non-Asian populations: A systematic review and meta-analysis. Nurs Open. 2022 Jan;9(1):733-751. [CrossRef]
- Centers for Disease Control and Prevention. People with Certain Medical Conditions. https://www.cdc.gov/coronavirus/2019-ncov/index.html; latest access Oct 2, 2022.
- Gasparrini A, Guo Y, Hashizume M, Lavigne E, Zanobetti A, Schwartz J, Tobias A, Tong S, Rocklöv J, Forsberg B, Leone M, De Sario M, Bell ML, Guo YL, Wu CF, Kan H, Yi SM, de Sousa Zanotti Stagliorio Coelho M, Saldiva PH, Honda Y, Kim H, Armstrong B. Mortality risk attributable to high and low ambient temperature: a multicountry observational study. Lancet. 2015 Jul 25;386(9991):369-75. [CrossRef]
- Istituto Nazionale di Statistica. Andamento dei decessi nel periodo 2015-2021: base dati integrata della mortalità giornaliera comunale. https://public.tableau.com/app/profile/istat.istituto.nazionale.di.statistica/viz/Andamentodeidecessi2015-2021_/Andamentodeidecessi; latest access Oct 1, 2022.
- Istituto Nazionale di Statistica. Decessi e cause di morte: cosa produce l’ISTAT. https://www.istat.it/it/archivio/240401; last access Oct 1, 2022.
- European Centre for Disease Prevention and Control. Download COVID-19 data sets. https://www.ecdc.europa.eu/en/covid-19/data; latest access Oct 1, 2022.
- Il Meteo. Medie Climatiche Italia. https://www.ilmeteo.it/portale/medie-climatiche/; latest access 1/10/2022.
- Istituto Nazionale di Statistica. Popolazione residente al 1° gennaio. http://dati.istat.it/Index.aspx?QueryId=42869; latest access Oct 1, 2022.
- Badellino, L. Meteo. Luglio 2022 in Italia più caldo del 2003, ma non è il più caldo di sempre. Ecco come è andata. 3Bmeteo. 2022 Aug 06. https://www.3bmeteo.com/giornale-meteo/meteo--luglio-2022-in-italia-pi-ugrave--caldo-del-2003--ma-non--egrave--il-pi-ugrave--caldo-di-sempre--ecco-come--egrave--andata-628048; latest access Oct 1, 2022.
- Olsen SJ, Azziz-Baumgartner E, Budd AP, Brammer L, Sullivan S, Pineda RF, Cohen C, Fry AM. Decreased influenza activity during the COVID-19 pandemic-United States, Australia, Chile, and South Africa, 2020. Am J Transplant. 2020 Dec;20(12):3681-3685. [CrossRef]
- Istituto Superiore di Sanità. COVID-19: sorveglianza, impatto delle infezioni ed efficacia vaccinale. Report Esteso ISS - Aggiornamento nazionale 14/09/2022 – ore 12:00. 2022 Sep 16. https://www.epicentro.iss.it/coronavirus/bollettino/Bollettino-sorveglianza-integrata-COVID-19_14-settembre-2022.pdf; latest access Sep 26, 2022.
- Food and Drug Administration. SARS-CoV-2 Viral Mutations: Impact on COVID-19 Tests. https://www.fda.gov/medical-devices/coronavirus-covid-19-and-medical-devices/sars-cov-2-viral-mutations-impact-covid-19-tests; latest access Sep 30, 2022.
- Jindal H, Jain S, Suvvari TK, Kutikuppala L, Rackimuthu S, Rocha ICN, Goyal S, Radha. False-Negative RT-PCR Findings and Double Mutant Variant as Factors of an Overwhelming Second Wave of COVID-19 in India: an Emerging Global Health Disaster. SN Compr Clin Med. 2021;3(12):2383-2388. [CrossRef]
- Nahin S, Amin MA. Persistent COVID-19 negative report of a physician in Bangladesh living and visiting in Red-listed country with some special precaution followed. Clin Case Rep. 2022 Mar 11;10(3):e05579. [CrossRef]
- European Centre for Disease Prevention and Control. Methods for the detection and characterisation of SARS-CoV-2 variants – second update. https://www.ecdc.europa.eu/en/publications-data/methods-detection-and-characterisation-sars-cov-2-variants-second-update; latest access Oct 1, 2022.
- European Centre for Disease Prevention and Control and World Health Organization. Metzger CMJA, Lienhard R, Seth-Smith HMB, Roloff T, Wegner F, Sieber J, Bel M, Greub G, Egli A. PCR performance in the SARS-CoV-2 Omicron variant of concern? Swiss Med Wkly. 2021 Dec 10;151:w30120. [CrossRef]
- Poloni TE, Medici V, Zito A, Carlos AF. The long-COVID-19 in older adults: facts and conjectures. Neural Regen Res. 2022 Dec;17(12):2679-2681. [CrossRef]
- Amore S, Puppo E, Melara J, Terracciano E, Gentili S, Liotta G. Impact of COVID-19 on older adults and role of long-term care facilities during early stages of epidemic in Italy. Sci Rep. 2021 Jun 15;11(1):12530. [CrossRef]
- Chojnicki M, Neumann-Podczaska A, Seostianin M, Tomczak Z, Tariq H, Chudek J, Tobis S, Mozer-Lisewska I, Suwalska A, Tykarski A, Merks P, Kropińska S, Sobieszczańska M, Romanelli F, Wieczorowska-Tobis K. Long-Term Survival of Older Patients Hospitalized for COVID-19. Do Clinical Characteristics upon Admission Matter? Int J Environ Res Public Health. 2021 Oct 12;18(20):10671. [CrossRef]
- Istituto Nazionale di Statistica. Aggiornamento della base dati di mortalità totale giornaliera comunale, gennaio-giugno e luglio 2022. https://www.istat.it/it/archivio/274010; latest access Oct 5, 2022.
- Lash TL, Fox MP, MacLehose RF, Maldonado G, McCandless LC, Greenland S. Good practices for quantitative bias analysis. Int J Epidemiol. 2014 Dec;43(6):1969-85. [CrossRef]
- Rovetta, A. Annual Excess Crude Mortality in Europe during the COVID-19 Pandemic: A Longitudinal Joinpoint Regression Analysis of Historical Trends from 2000 to 2021. COVID. 2022 Dec 15;2(12):1778-1786. [CrossRef]
|
Disclaimer/Publisher’s Note: The statements, opinions and data contained in all publications are solely those of the individual author(s) and contributor(s) and not of MDPI and/or the editor(s). MDPI and/or the editor(s) disclaim responsibility for any injury to people or property resulting from any ideas, methods, instructions or products referred to in the content. |
© 2023 by the authors. Licensee MDPI, Basel, Switzerland. This article is an open access article distributed under the terms and conditions of the Creative Commons Attribution (CC BY) license (http://creativecommons.org/licenses/by/4.0/).
