Submitted:
18 March 2023
Posted:
20 March 2023
You are already at the latest version
Abstract
Keywords:
1. Introduction
2. Relevant Literature Review
2.1. Financial risk network at the firm or sector level
2.2. Financial risk network using a bivariate approach
2.3. Financial market risk network using a multivariate system approach
3. Data and Method
3.1. Data
3.2. Methodology
4. Empirical Results
4.1. Upside and downside VaR measurement results
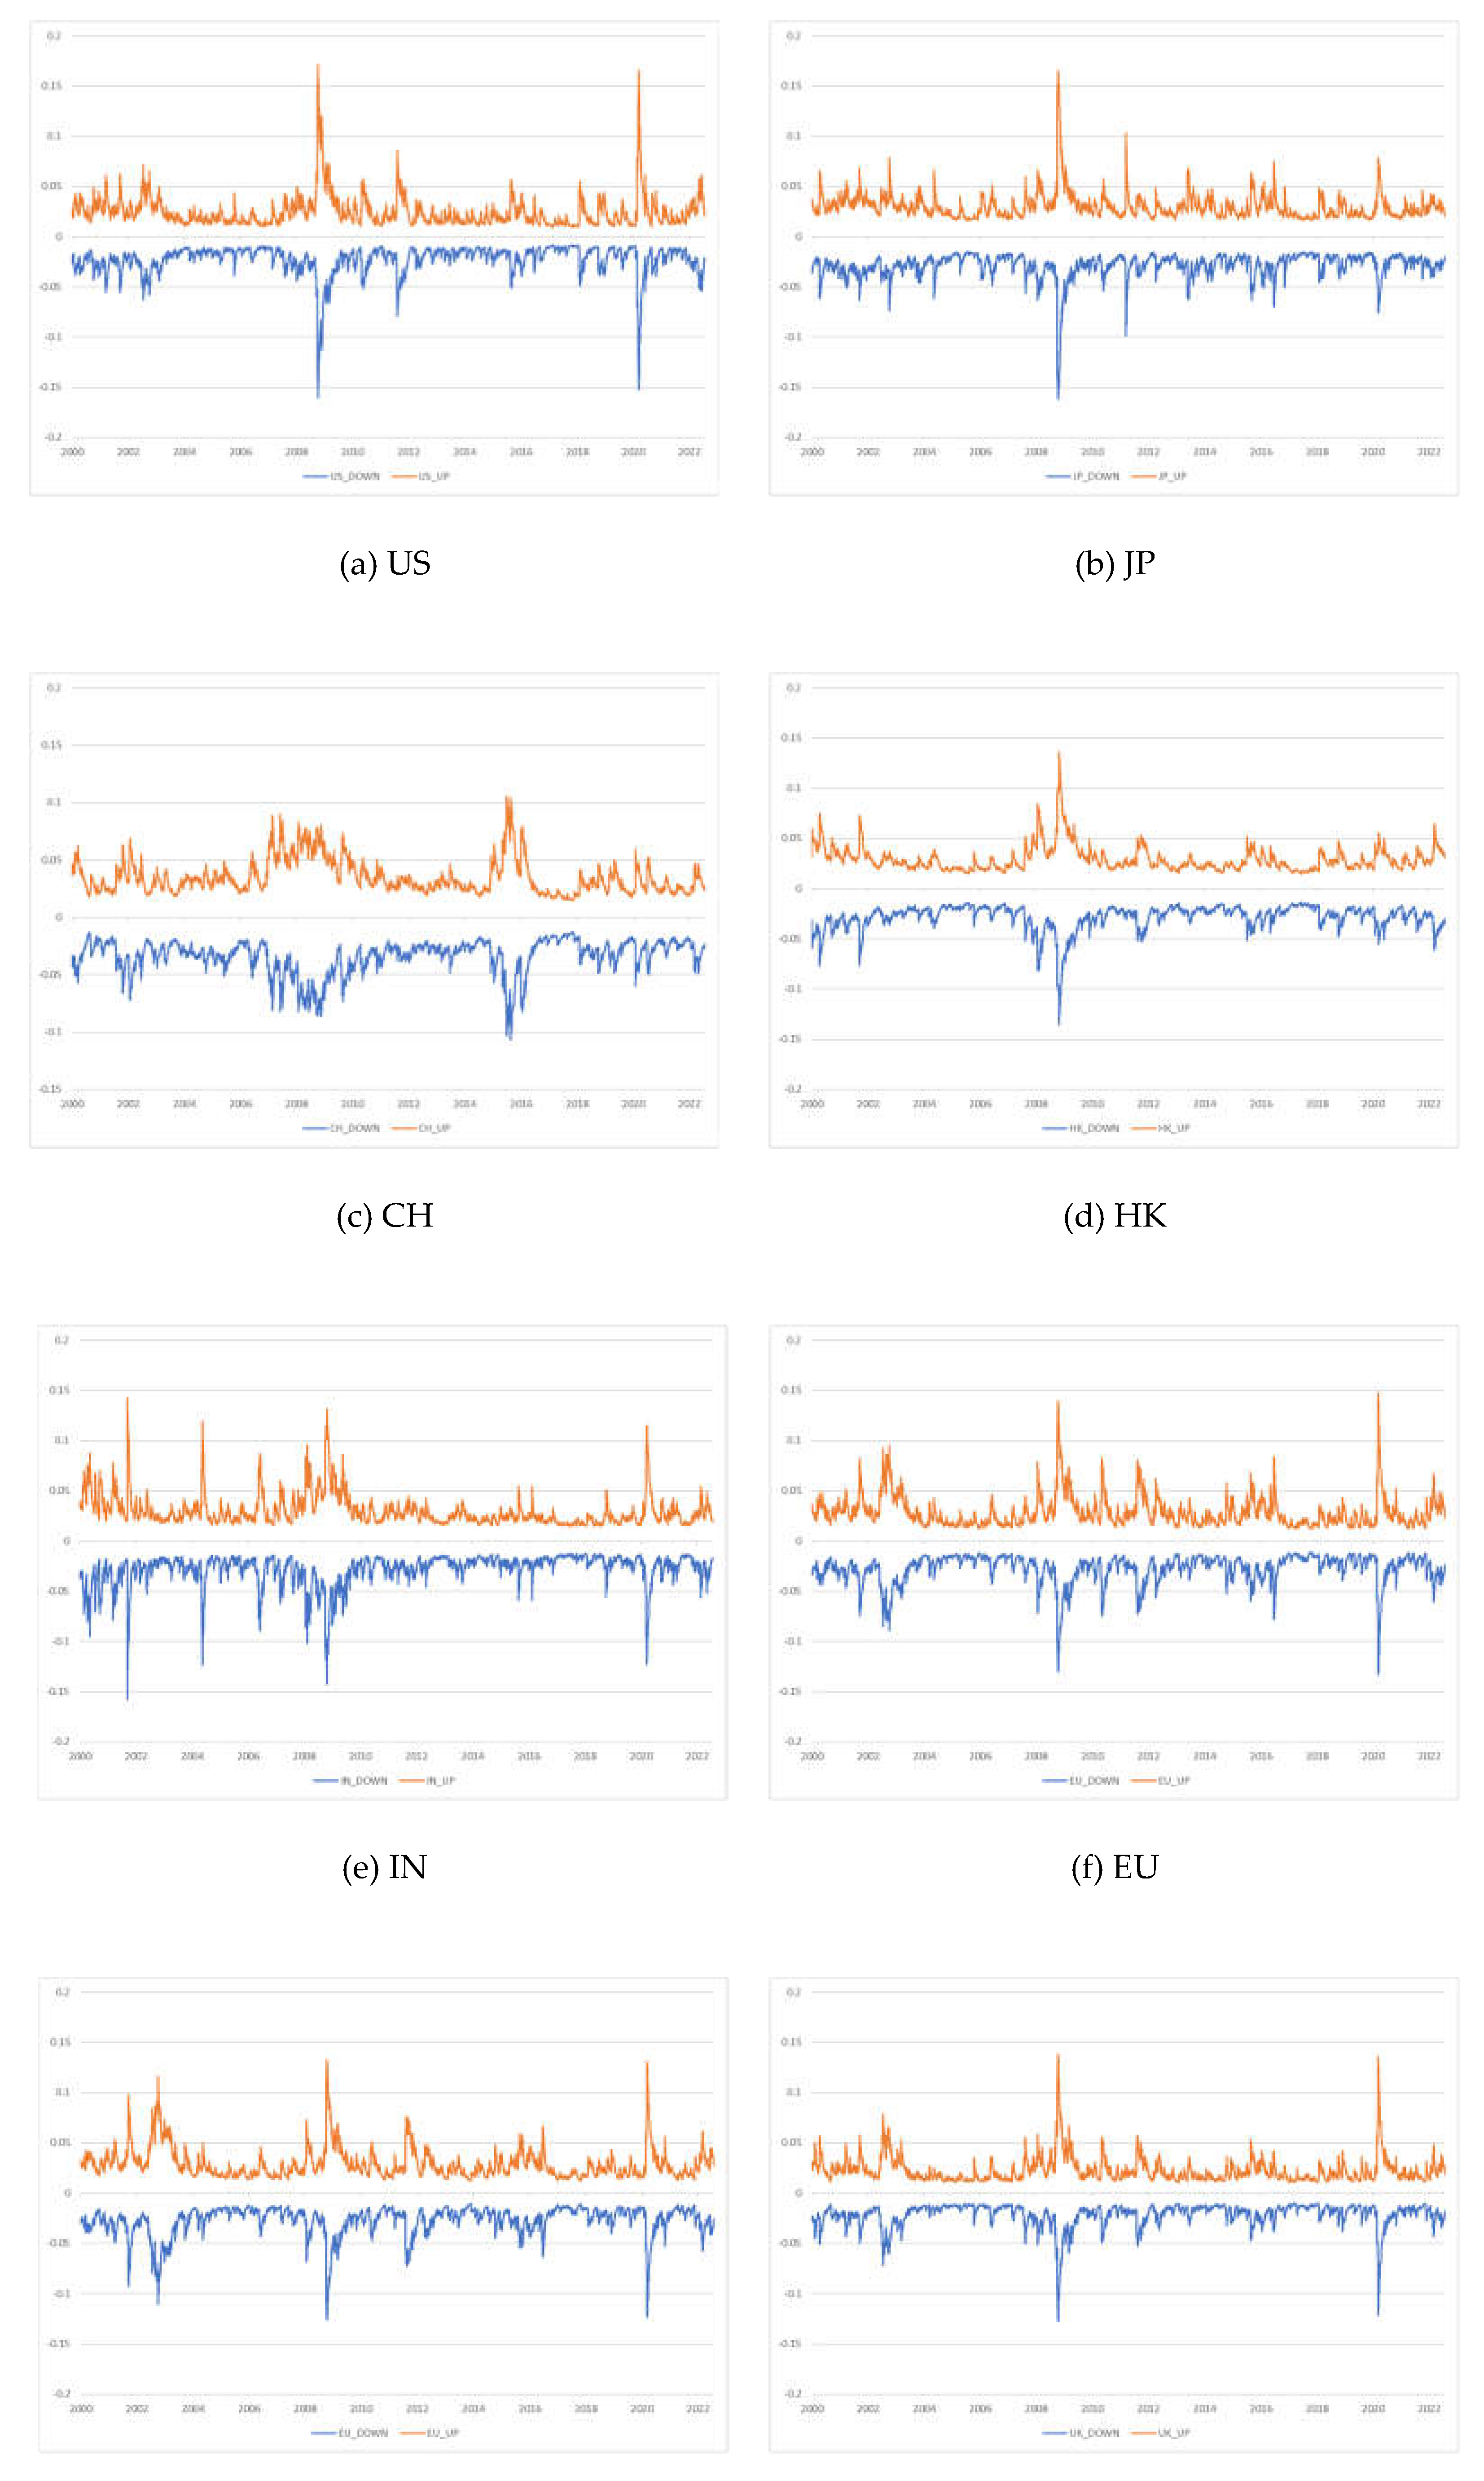
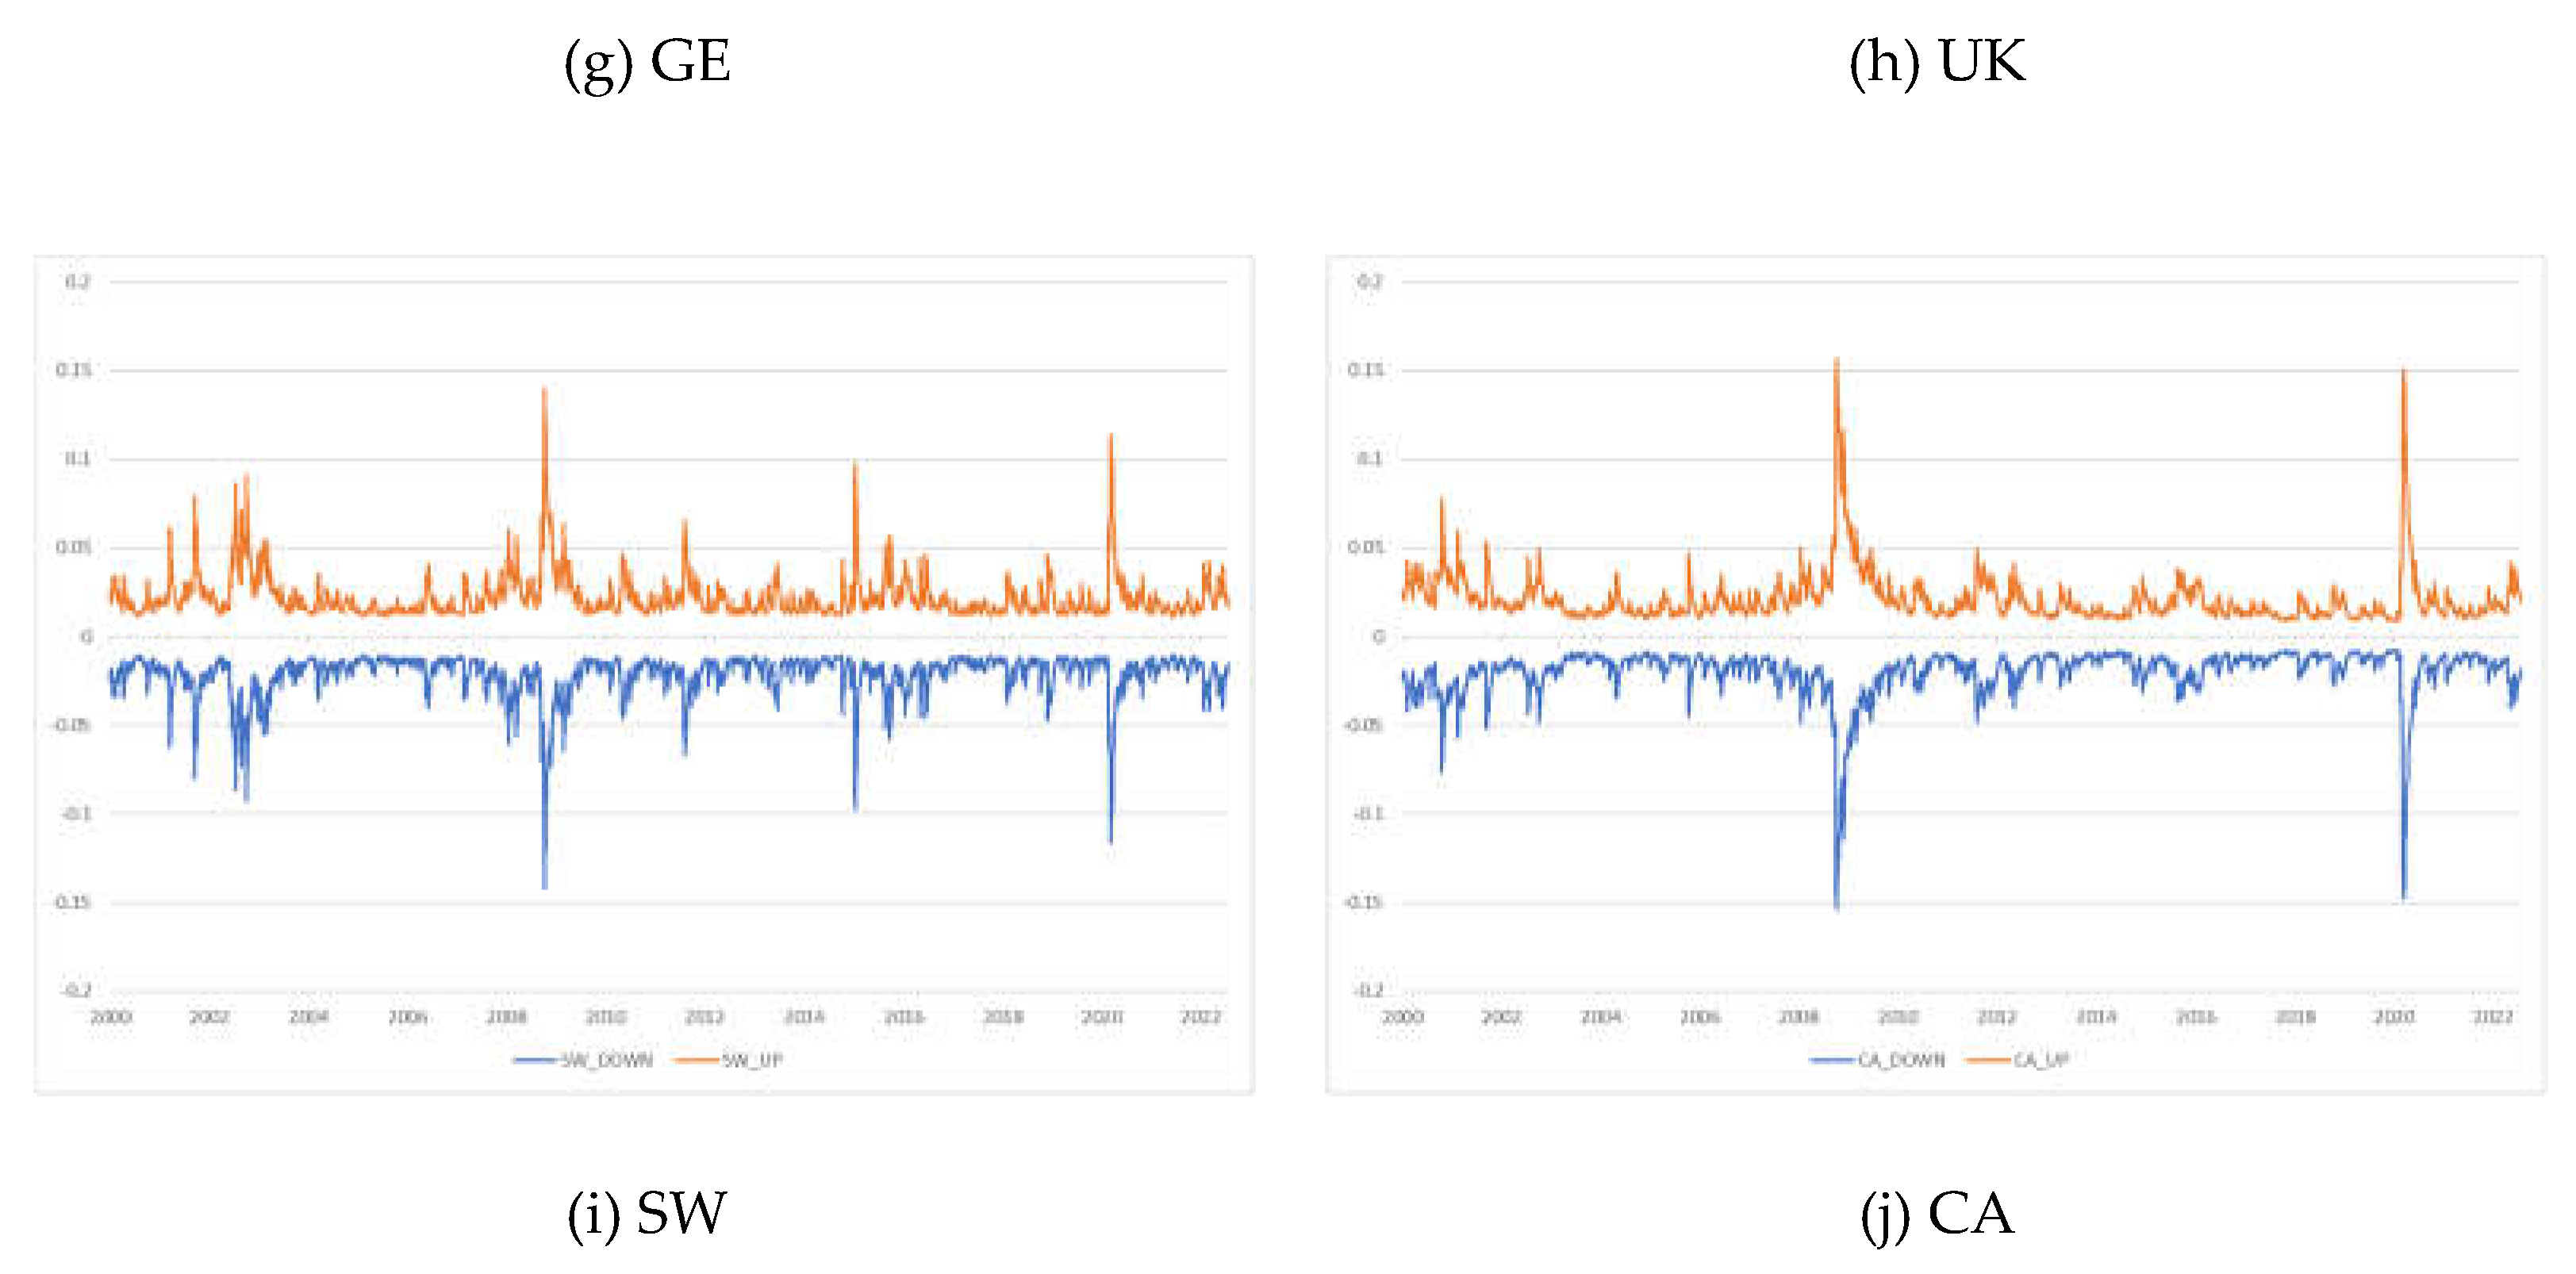
4.2. Connectedness results
5. Conclusions
Author Contributions
Funding
Data Availability Statement
Conflicts of Interest
References
- Abdul Karim, B.; Shabri Abd. Majid, M. Does trade matter for stock market integration? Studies in Economics and Finance 2010, 27(1), 47–66. [Google Scholar] [CrossRef]
- Albuquerque, R.; Loayza, N.; Servén, L. World market integration through the lens of foreign direct investors. Journal of International Economics 2005, 66(2), 267–295. [Google Scholar] [CrossRef]
- Bracker, K.; Docking, D.S.; Koch, P.D. Economic determinants of evolution in international stock market integration. Journal of Empirical Finance 1999, 6(1), 1–27. [Google Scholar] [CrossRef]
- Zhang, W.; Zhuang, X.; Wang, J.; Lu, Y. Connectedness and systemic risk spillovers analysis of Chinese sectors based on tail risk network. North American Journal of Economics and Finance 2020, 54, 101248. [Google Scholar] [CrossRef]
- Arreola Hernandez, J.; Kang, S.H.; Jiang, Z.; Yoon, S.-M. Spillover network among economic sentiment and economic policy uncertainty in Europe. Systems 2022, 10(4), 93. [Google Scholar] [CrossRef]
- Dong, X.; Li, C.; Yoon, S.-M. Exogenous shocks, dynamic correlations, and portfolio risk management for the Asian emerging and other global developed and emerging stock markets. Applied Economics 2020, 52(43), 4745–4764. [Google Scholar] [CrossRef]
- Dong, X.; Song, L.; Yoon, S.-M. How have the dependence structures between stock markets and economic factors changed during the COVID-19 pandemic? North American Journal of Economics and Finance 2021, 58, 101546. [Google Scholar] [CrossRef]
- Gupta, R.; Guidi, F. Cointegration relationship and time varying co-movements among Indian and Asian developed stock markets. International Review of Financial Analysis 2012, 21, 10–22. [Google Scholar] [CrossRef]
- Hanif, W.; Hernandez, J.A.; Troster, V.; Kang, S.H.; Yoon, S.-M. Nonlinear dependence and spillovers between cryptocurrency and global/regional equity markets. Pacific-Basin Finance Journal 2022, 74, 101822. [Google Scholar] [CrossRef]
- Hardouvelis, G.A.; Malliaropulos, D.; Priestley, R. EMU and European stock market integration. Journal of Business 2006, 79(1), 365–392. [Google Scholar] [CrossRef]
- Hedström, A.; Zelander, N.; Junttila, J.; Uddin, G.S. Emerging market contagion under geopolitical uncertainty. Emerging Markets Finance and Trade 2020, 56(6), 1377–1401. [Google Scholar] [CrossRef]
- BenSaïda, A.; Hernandez, J.A.; Litimi, H.; Yoon, S.-M. The influence of oil, gold and stock market index on US equity sectors. Applied Economics 2022, 54(6), 719–732. [Google Scholar] [CrossRef]
- Wu, F. Stock market integration in East and Southeast Asia: The role of global factors. International Review of Financial Analysis 2020, 67, 101416. [Google Scholar] [CrossRef]
- Youssef, M.; Mokni, K.; Ajmi, A.N. Dynamic connectedness between stock markets in the presence of the COVID-19 pandemic: Does economic policy uncertainty matter? Financial Innovation 2021, 7, 13. [Google Scholar] [CrossRef] [PubMed]
- Diebold, F.X.; Yilmaz, K. Measuring financial asset return and volatility spillovers, with application to global equity markets. Economic Journal 2009, 119(534), 158–171. [Google Scholar] [CrossRef]
- Zhou, X.; Zhang, W.; Zhang, J. Volatility spillovers between the Chinese and world equity markets. Pacific-Basin Finance Journal 2012, 20(2), 247–270. [Google Scholar] [CrossRef]
- Tsai, I.C. Spillover of fear: Evidence from the stock markets of five developed countries. International Review of Financial Analysis 2014, 33, 281–288. [Google Scholar] [CrossRef]
- Liow, K.H. Volatility spillover dynamics and relationship across G7 financial markets. North American Journal of Economics and Finance 2015, 33, 328–365. [Google Scholar] [CrossRef]
- Cepoi, C.O. Asymmetric dependence between stock market returns and news during COVID-19 financial turmoil. Finance Research Letters 2020, 36, 101658. [Google Scholar] [CrossRef]
- Su, X. Measuring extreme risk spillovers across international stock markets: A quantile variance decomposition analysis. North American Journal of Economics and Finance 2020, 51, 101098. [Google Scholar] [CrossRef]
- Izzeldin, M.; Muradoğlu, Y.G.; Pappas, V.; Sivaprasad, S. The impact of Covid-19 on G7 stock markets volatility: Evidence from a ST-HAR model. International Review of Financial Analysis 2021, 74, 101671. [Google Scholar] [CrossRef] [PubMed]
- Liu, Y.; Wei, Y.; Wang, Q.; Liu, Y. International stock market risk contagion during the COVID-19 pandemic. Finance Research Letters 2022, 45, 102145. [Google Scholar] [CrossRef] [PubMed]
- Acharya, V.; Engle, R.; Richardson, M. Capital shortfall: A new approach to ranking and regulating systemic risks. American Economic Review 2012, 102(3), 59–64. [Google Scholar] [CrossRef]
- Andrieş, A.M.; Ongena, S.; Sprincean, N.; Tunaru, R. Risk spillovers and interconnectedness between systemically important institutions. Journal of Financial Stability 2022, 58, 100963. [Google Scholar] [CrossRef]
- Cui, X.; Yang, L. Systemic risk and idiosyncratic networks among global systemically important banks. International Journal of Finance & Economics. 2022, forthcoming. [CrossRef]
- Nguyen, L.H.; Nguyen, L.X.; Tan, L. Tail risk connectedness between US industries. International Journal of Finance & Economics 2021, 26(3), 3624–3650. [Google Scholar] [CrossRef]
- Du, Y.; Zhang, X.; Ding, Z.; Yang, X. Multiscale tail risk connectedness of global stock markets: A LASSO-based network topology approach. Complexity 2022, 2022, 7635144. [Google Scholar] [CrossRef]
- Tian, M.; Jiang, Y.; Wang, B.; Dong, Y.; Chen, Y.; Shi, B. Downside and upside risk spillovers from commercial banks into China’s financial system: A new copula quantile regression-based CoVaR model. Economic Research-Ekonomska Istraživanja 2023, 36(1), 2120037. [Google Scholar] [CrossRef]
- Glosten, L.R.; Jagannathan, R.; Runkle, D.E. On the relation between the expected value and the volatility of the nominal excess return on stocks. Journal of Finance 1993, 48(5), 1779–1801. [Google Scholar] [CrossRef]
- Diebold, F.X.; Yilmaz, K. Better to give than to receive: Predictive directional measurement of volatility spillovers. International Journal of Forecasting 2012, 28(1), 57–66. [Google Scholar] [CrossRef]
- Diebold, F.X.; Yılmaz, K. On the network topology of variance decompositions: Measuring the connectedness of financial firms. Journal of Econometrics 2014, 182(1), 119–134. [Google Scholar] [CrossRef]
- Wu, F. Sectoral contributions to systemic risk in the Chinese stock market. Finance Research Letters 2019, 31, 386–390. [Google Scholar] [CrossRef]
- Wu, F.; Zhang, D.; Zhang, Z. Connectedness and risk spillovers in China’s stock market: A sectoral analysis. Economic Systems 2019, 43(3–4), 100718. [Google Scholar] [CrossRef]
- Zhang, D.; Hu, M.; Ji, Q. Financial markets under the global pandemic of COVID-19. Finance Research Letters 2020, 36, 101528. [Google Scholar] [CrossRef] [PubMed]
- Arreola Hernandez, J.; Kang, S.H.; McIver, R.P.; Yoon, S.-M. Network interdependence and optimization of bank portfolios from developed and emerging Asia Pacific countries. Asia-Pacific Financial Markets 2021, 28(4), 613–647. [Google Scholar] [CrossRef]
- Ngene, G.M. What drives dynamic connectedness of the US equity sectors during different business cycles? North American Journal of Economics and Finance 2021, 58, 101493. [Google Scholar] [CrossRef]
- Wu, F.; Zhang, D.; Ji, Q. Systemic risk and financial contagion across top global energy companies. Energy Economics 2021, 97, 105221. [Google Scholar] [CrossRef]
- Shen, Y.-Y.; Jiang, Z.-Q.; Ma, J.-C.; Wang, G.-J.; Zhou, W.-X. Sector connectedness in the Chinese stock markets. Empirical Economics 2022, 62(2), 825–852. [Google Scholar] [CrossRef]
- Chi, K.T.; Liu, J.; Lau, F.C. A network perspective of the stock market. Journal of Empirical Finance 2010, 17(4), 659–667. [Google Scholar] [CrossRef]
- Giroud, X.; Mueller, H.M. Firms' internal networks and local economic shocks. American Economic Review 2019, 109(10), 3617–3649. [Google Scholar] [CrossRef]
- Zhou, Y.; Chen, Z.; Liu, Z. Dynamic analysis and community recognition of stock price based on a complex network perspective. Expert Systems with Applications 2023, 213, 118944. [Google Scholar] [CrossRef]
- Granger, C.W.J. Investigating causal relations by econometric models and cross-spectral methods. Econometrica 1969, 37(3), 424–438. [Google Scholar] [CrossRef]
- Billio, M.; Getmansky, M.; Lo, A.W.; Pelizzon, L. Econometric measures of connectedness and systemic risk in the finance and insurance sectors. Journal of Financial Economics 2012, 104(3), 535–559. [Google Scholar] [CrossRef]
- Výrost, T.; Lyócsa, Š.; Baumöhl, E. Granger causality stock market networks: Temporal proximity and preferential attachment. Physica A 2015, 427, 262–276. [Google Scholar] [CrossRef]
- Wang, G.-J.; Xie, C.; He, K.; Stanley, H.E. Extreme risk spillover network: Application to financial institutions. Quantitative Finance 2017, 17(9), 1417–1433. [Google Scholar] [CrossRef]
- Shannon, C.E. A mathematical theory of communication. Bell System Technical Journal 1948, 27(3), 379–423. [Google Scholar] [CrossRef]
- Schreiber, T. Measuring information transfer. Physical Review Letters 2000, 85(2), 461–464. [Google Scholar] [CrossRef] [PubMed]
- Sensoy, A.; Sobaci, C.; Sensoy, S.; Alali, F. Effective transfer entropy approach to information flow between exchange rates and stock markets. Chaos, Solitons & Fractals 2014, 68, 180–185. [Google Scholar] [CrossRef]
- Gong, C.; Tang, P.; Wang, Y. Measuring the network connectedness of global stock markets. Physica A 2019, 535, 122351. [Google Scholar] [CrossRef]
- Nicola, G.; Cerchiello, P.; Aste, T. Information network modeling for US banking systemic risk. Entropy 2020, 22(11), 1331. [Google Scholar] [CrossRef]
- García-Medina, A.; Luu Duc Huynh, T. What drives bitcoin? An approach from continuous local transfer entropy and deep learning classification models. Entropy 2021, 23(12), 1582. [Google Scholar] [CrossRef]
- Tiwari, A.K.; Jena, S.K.; Abakah, E.J.A.; Yoon, S.-M. Does the dynamics between government bond and equity markets validate the adaptive market hypothesis? Evidence from transfer entropy. Applied Economics 2023, forthcoming. [Google Scholar] [CrossRef]
- Münnix, M.C.; Schäfer, R. A copula approach on the dynamics of statistical dependencies in the US stock market. Physica A 2011, 390(23–24), 4251–4259. [Google Scholar] [CrossRef]
- Changqing, L.; Chi, X.; Cong, Y.; Yan, X. Measuring financial market risk contagion using dynamic MRS-Copula models: The case of Chinese and other international stock markets. Economic Modelling 2015, 51, 657–671. [Google Scholar] [CrossRef]
- Xixi, L.; Qiang, W.; Suling, J. Analysis of topological properties of complex network of Chinese stock based on Copula tail correlation. Paper presented at the 2017 International conference on service systems and service management, 2017.
- Wen, F.; Yang, X.; Zhou, W.X. Tail dependence networks of global stock markets. International Journal of Finance & Economics 2019, 24(1), 558–567. [Google Scholar] [CrossRef]
- Mensi, W.; Hernandez, J.A.; Yoon, S.-M.; Vo, X.V.; Kang, S.H. Spillovers and connectedness between major precious metals and major currency markets: The role of frequency factor. International Review of Financial Analysis 2021, 74, 101672. [Google Scholar] [CrossRef]
- Arreola Hernandez, J.; Kang, S.H.; Yoon, S.-M. Spillovers and portfolio optimization of precious metals and global/regional equity markets. Applied Economics 2022, 54(20), 2320–2342. [Google Scholar] [CrossRef]
- Kang, S.H.; Hernandez, J.A.; Rehman, M.U.; Shahzad, S.J.H.; Yoon, S.-M. Spillovers and hedging between US equity sectors and gold, oil, Islamic stocks and implied volatilities. Resources Policy 2023, 81, 103286. [Google Scholar] [CrossRef]
- Demirer, M.; Diebold, F.X.; Liu, L.; Yilmaz, K. Estimating global bank network connectedness. Journal of Applied Econometrics 2018, 33(1), 1–15. [Google Scholar] [CrossRef]
- Baruník, J.; Křehlík, T. Measuring the frequency dynamics of financial connectedness and systemic risk. Journal of Financial Econometrics 2018, 16(2), 271–296. [Google Scholar] [CrossRef]
- Baruník, J.; Kocenda, E. Total, asymmetric and frequency connectedness between oil and forex markets. CESifo Working Paper, No. 7756, Center for Economic Studies and ifo Institute (CESifo), Munich, 2019. [CrossRef]
- Chatziantoniou, I.; Gabauer, D.; Marfatia, H.A. Dynamic connectedness and spillovers across sectors: Evidence from the Indian stock market. Scottish Journal of Political Economy 2022, 69(3), 283–300. [Google Scholar] [CrossRef]
- Zhou, D.-h.; Liu, X.-x.; Tang, C.; Yang, G.-y. Time-varying risk spillovers in Chinese stock market–New evidence from high-frequency data. North American Journal of Economics and Finance 2023, 64, 101870. [Google Scholar] [CrossRef]
- Alshater, M.M.; Polat, O.; El Khoury, R.; Yoon, S.-M. Dynamic connectedness among regional FinTech indices in times of turbulences. Applied Economics Letters 2023, forthcoming. [Google Scholar] [CrossRef]
- Adrian, T.; Brunnermeier, M.K. CoVaR. American Economic Review 2016, 106(7), 1705–1741. [Google Scholar] [CrossRef]
- Al-Yahyaee, K.H.; Shahzad, S.J.H.; Mensi, W.; Yoon, S.-M. Is there a systemic risk between Sharia, Sukuk, and GCC stock markets? A ΔCoVaR risk metric-based copula approach. International Journal of Finance & Economics 2021, 26(2), 2904–2926. [Google Scholar] [CrossRef]
- Wu, J.; Zhang, C.; Chen, Y. Analysis of risk correlations among stock markets during the COVID-19 pandemic. International Review of Financial Analysis 2022, 83, 102220. [Google Scholar] [CrossRef] [PubMed]
- Hanif, W.; Hernandez, J.A.; Mensi, W.; Kang, S.H.; Uddin, G.S.; Yoon, S.-M. Nonlinear dependence and connectedness between clean/renewable energy sector equity and European emission allowance prices. Energy Economics 2021, 101, 105409. [Google Scholar] [CrossRef]
- Baruník, J.; Kočenda, E.; Vácha, L. Asymmetric connectedness on the US stock market: Bad and good volatility spillovers. Journal of Financial Markets 2016, 27, 55–78. [Google Scholar] [CrossRef]
- BenSaïda, A. Good and bad volatility spillovers: An asymmetric connectedness. Journal of Financial Markets 2019, 43, 78–95. [Google Scholar] [CrossRef]
- Li, W. COVID-19 and asymmetric volatility spillovers across global stock markets. North American Journal of Economics and Finance 2021, 58, 101474. [Google Scholar] [CrossRef]
- Mensi, W.; Maitra, D.; Vo, X.V.; Kang, S.H. Asymmetric volatility connectedness among main international stock markets: A high frequency analysis. Borsa Istanbul Review 2021, 21(3), 291–306. [Google Scholar] [CrossRef]
- Mensi, W.; Nekhili, R.; Vo, X.V.; Suleman, T.; Kang, S.H. Asymmetric volatility connectedness among US stock sectors. North American Journal of Economics and Finance 2021, 56, 101327. [Google Scholar] [CrossRef]
- Shahzad, S.J.H.; Naeem, M.A.; Peng, Z.; Bouri, E. Asymmetric volatility spillover among Chinese sectors during COVID-19. International Review of Financial Analysis 2021, 75, 101754. [Google Scholar] [CrossRef] [PubMed]
- Koop, G.; Pesaran, M.H.; Potter, S.M. Impulse response analysis in nonlinear multivariate models. Journal of Econometrics 1996, 74(1), 119–147. [Google Scholar] [CrossRef]
- Pesaran, H.H.; Shin, Y. Generalized impulse response analysis in linear multivariate models. Economics Letters 1998, 58(1), 17–29. [Google Scholar] [CrossRef]
- Zhang, W.; Zhuang, X.; Wu, D. Spatial connectedness of volatility spillovers in G20 stock markets: Based on block models analysis. Finance Research Letters 2020, 34, 101274. [Google Scholar] [CrossRef]
- Zhang, Y.; Chen, R.; Ma, D. A weighted and directed perspective of global stock market connectedness: A variance decomposition and GERGM framework. Sustainability 2020, 12(11), 4605. [Google Scholar] [CrossRef]
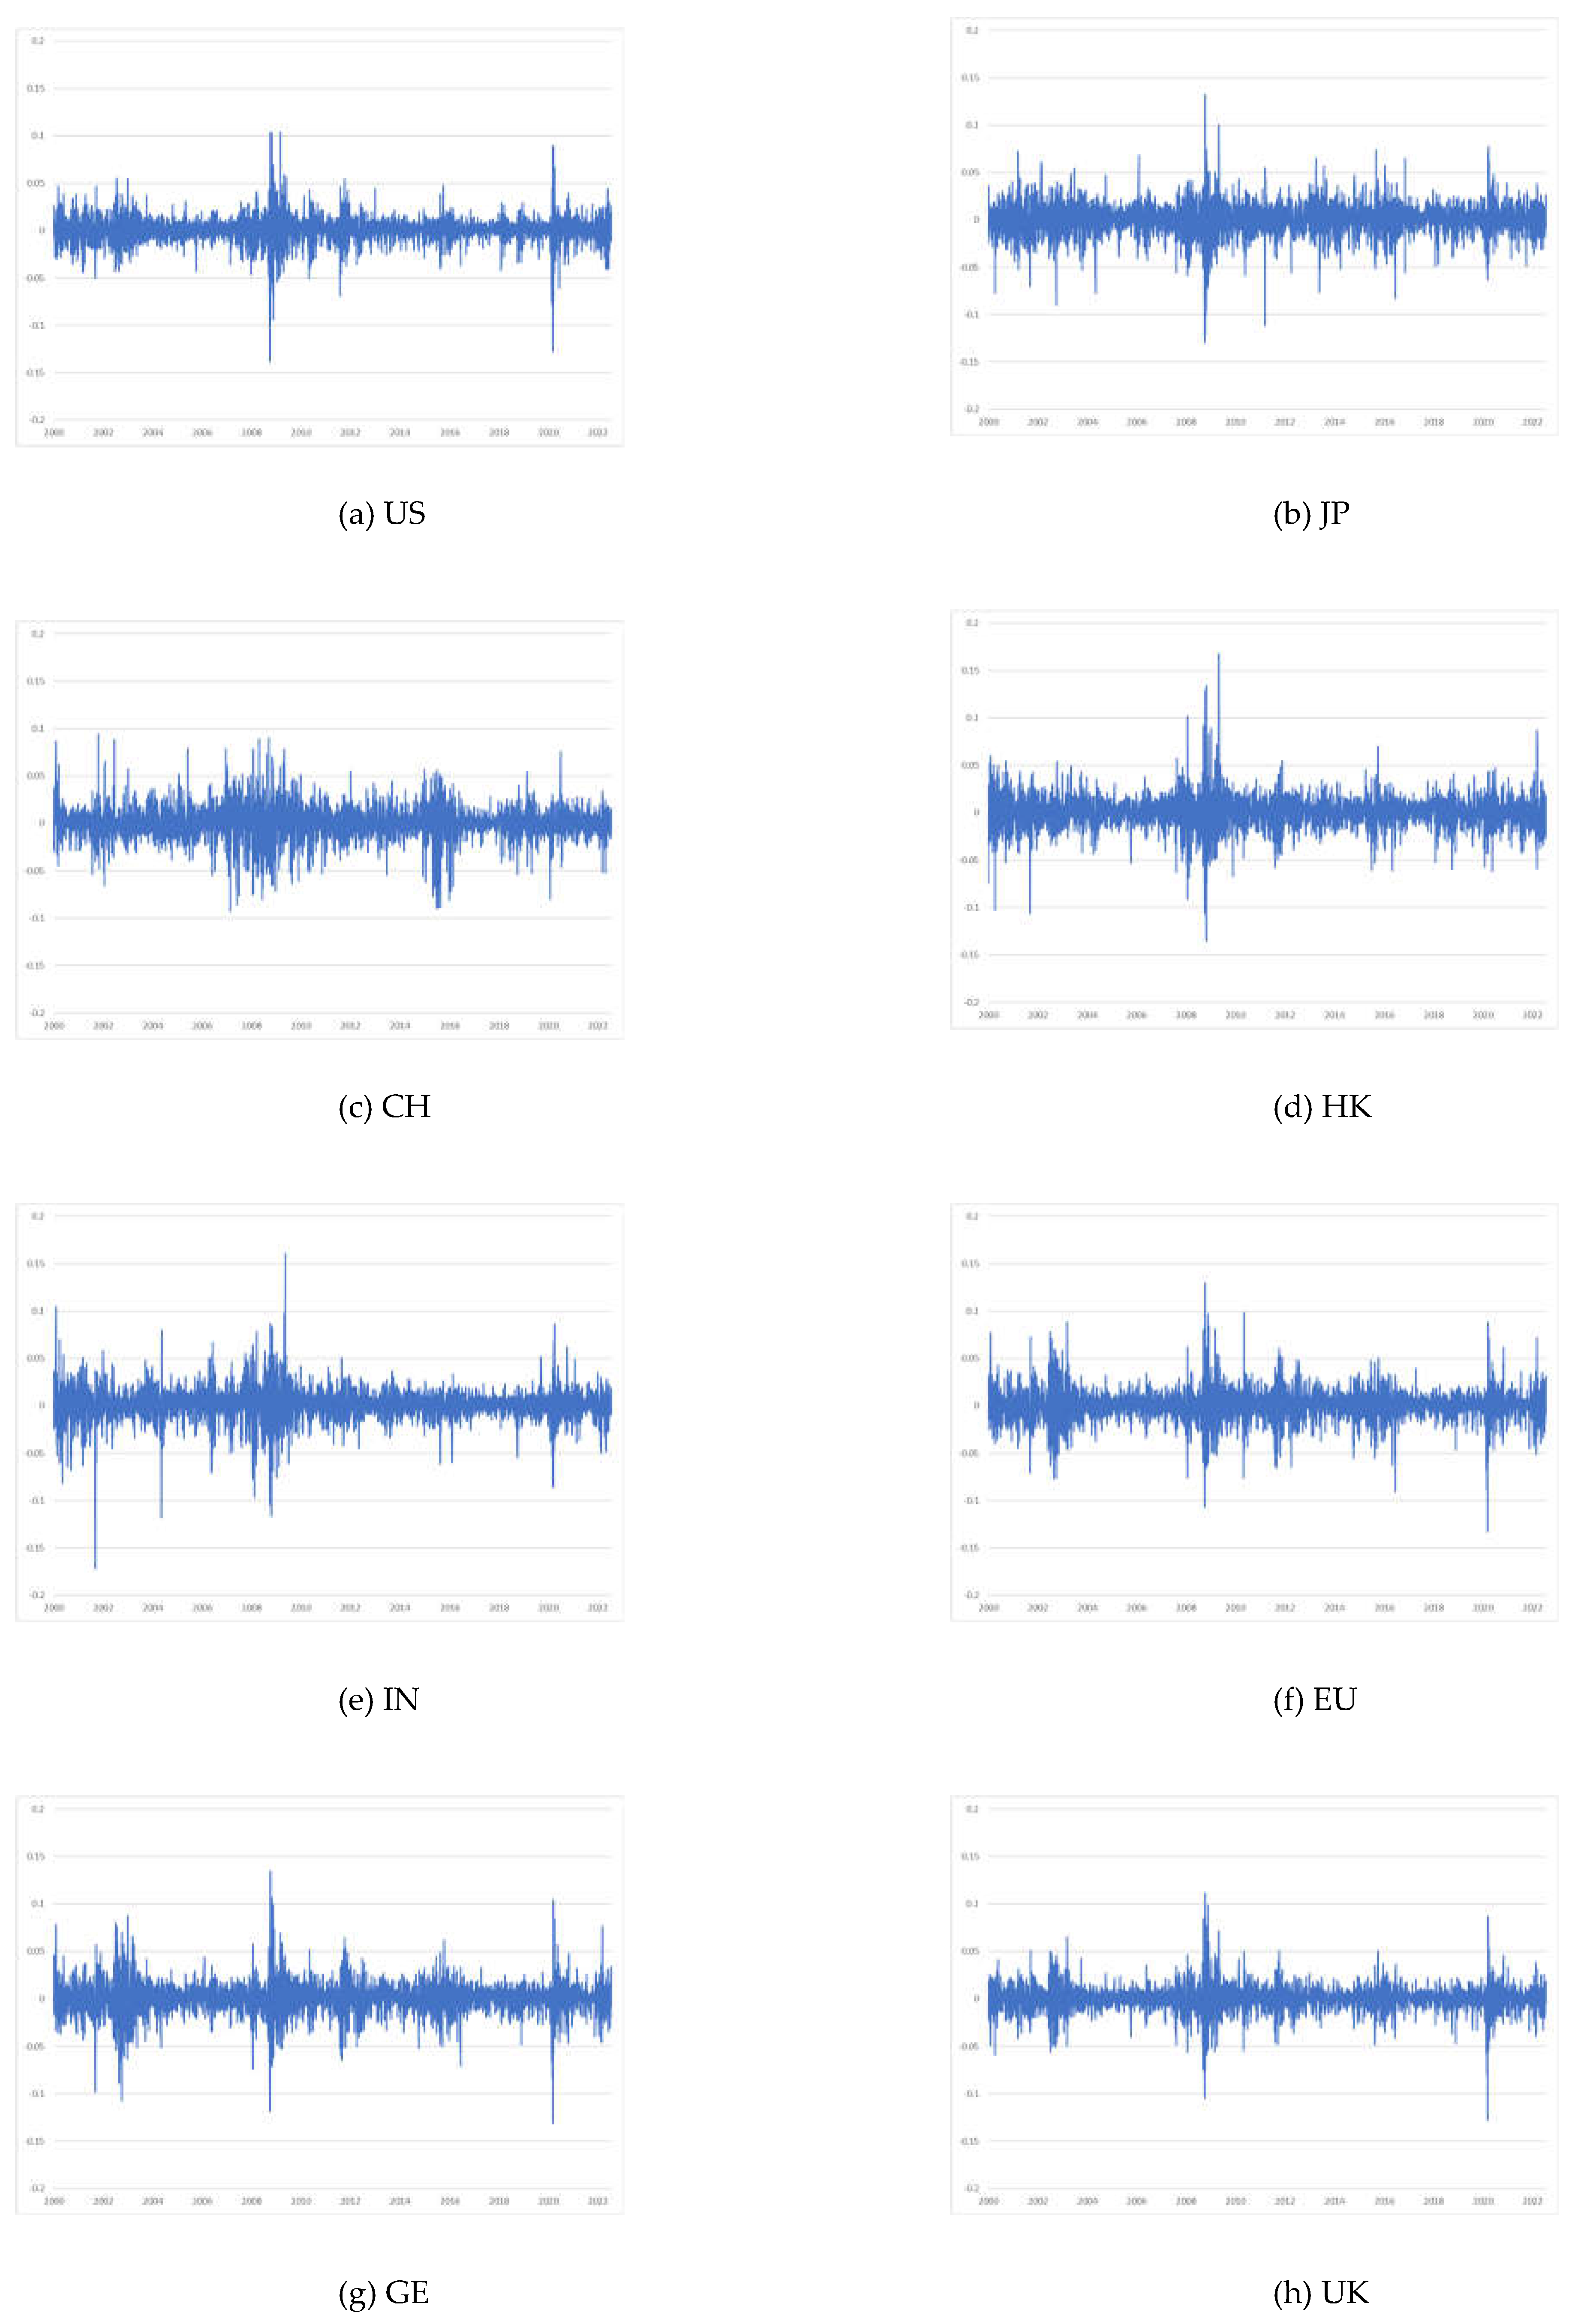
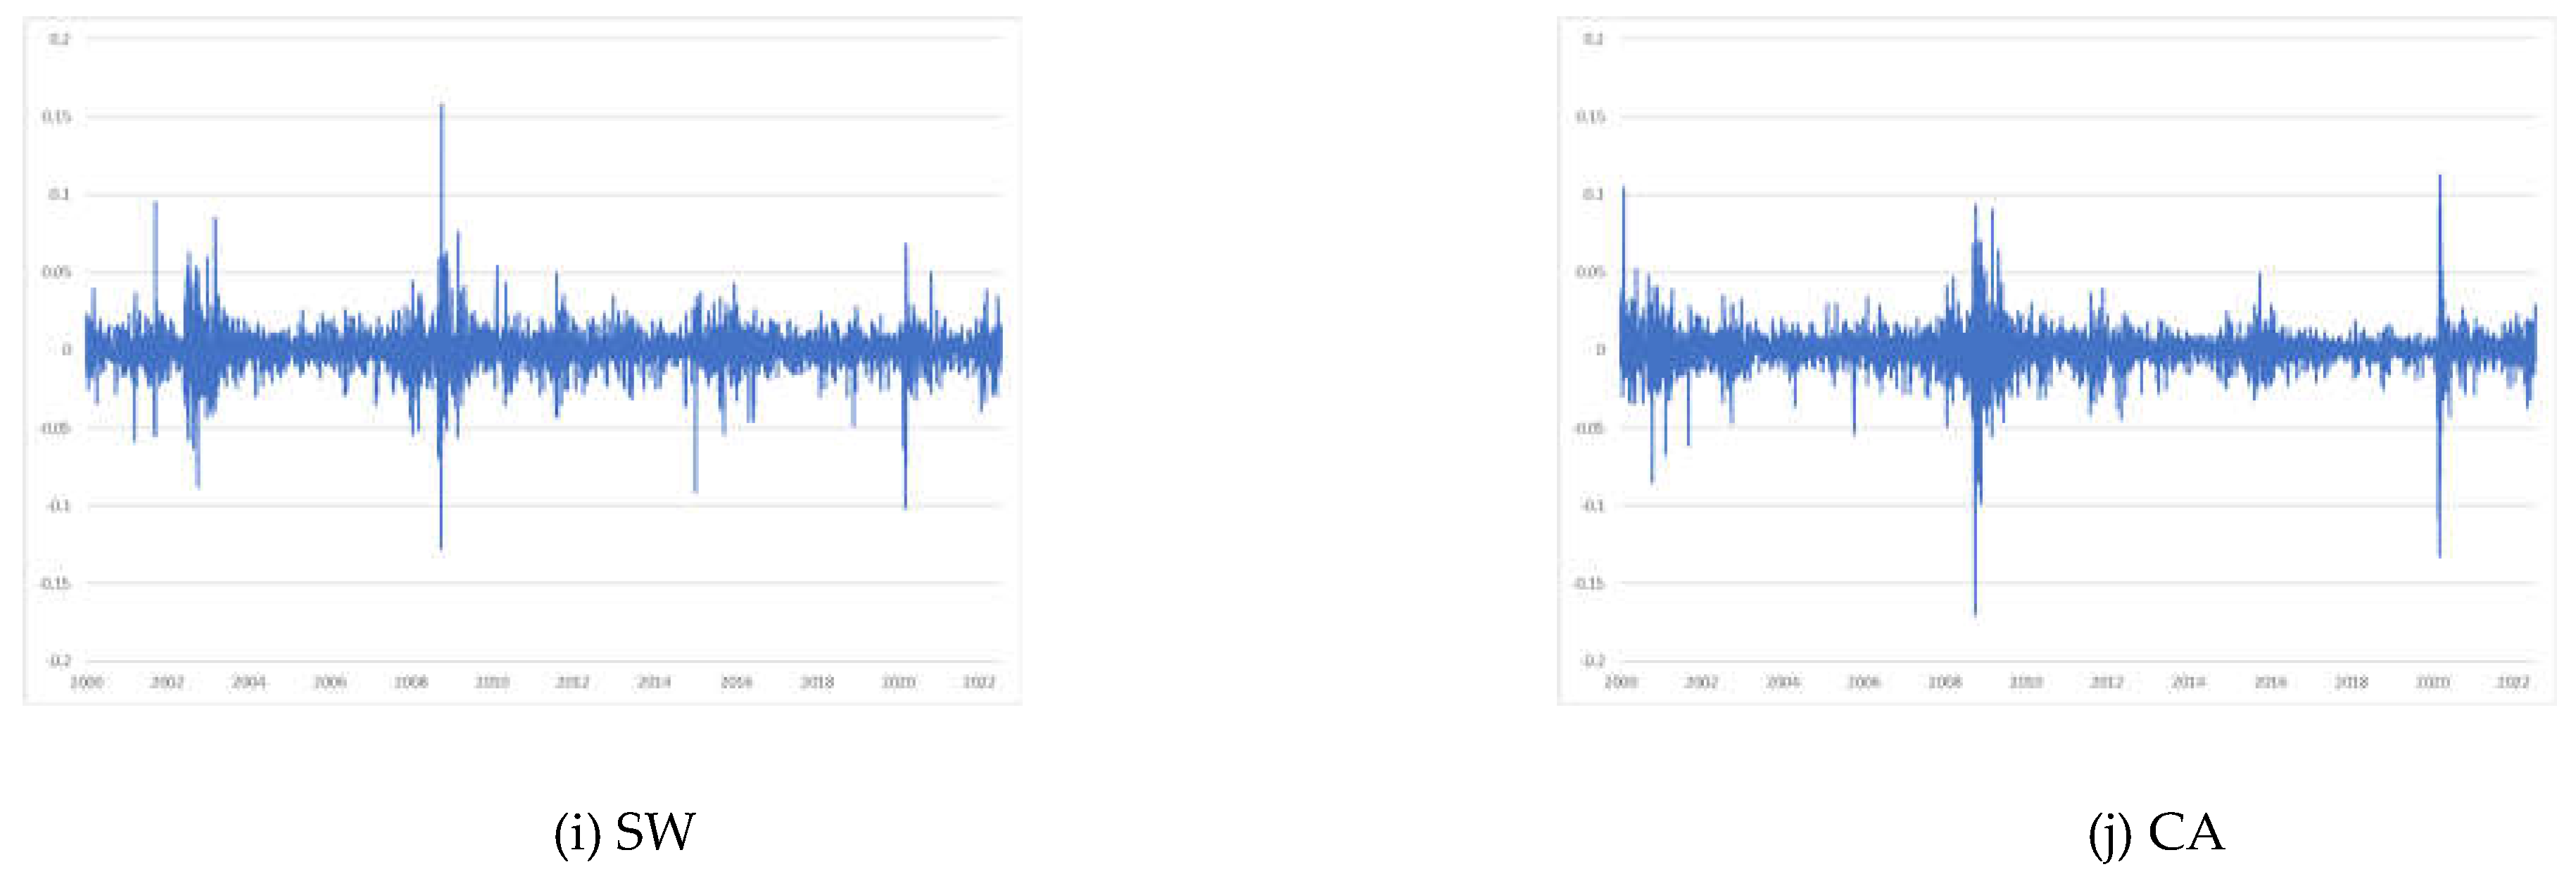
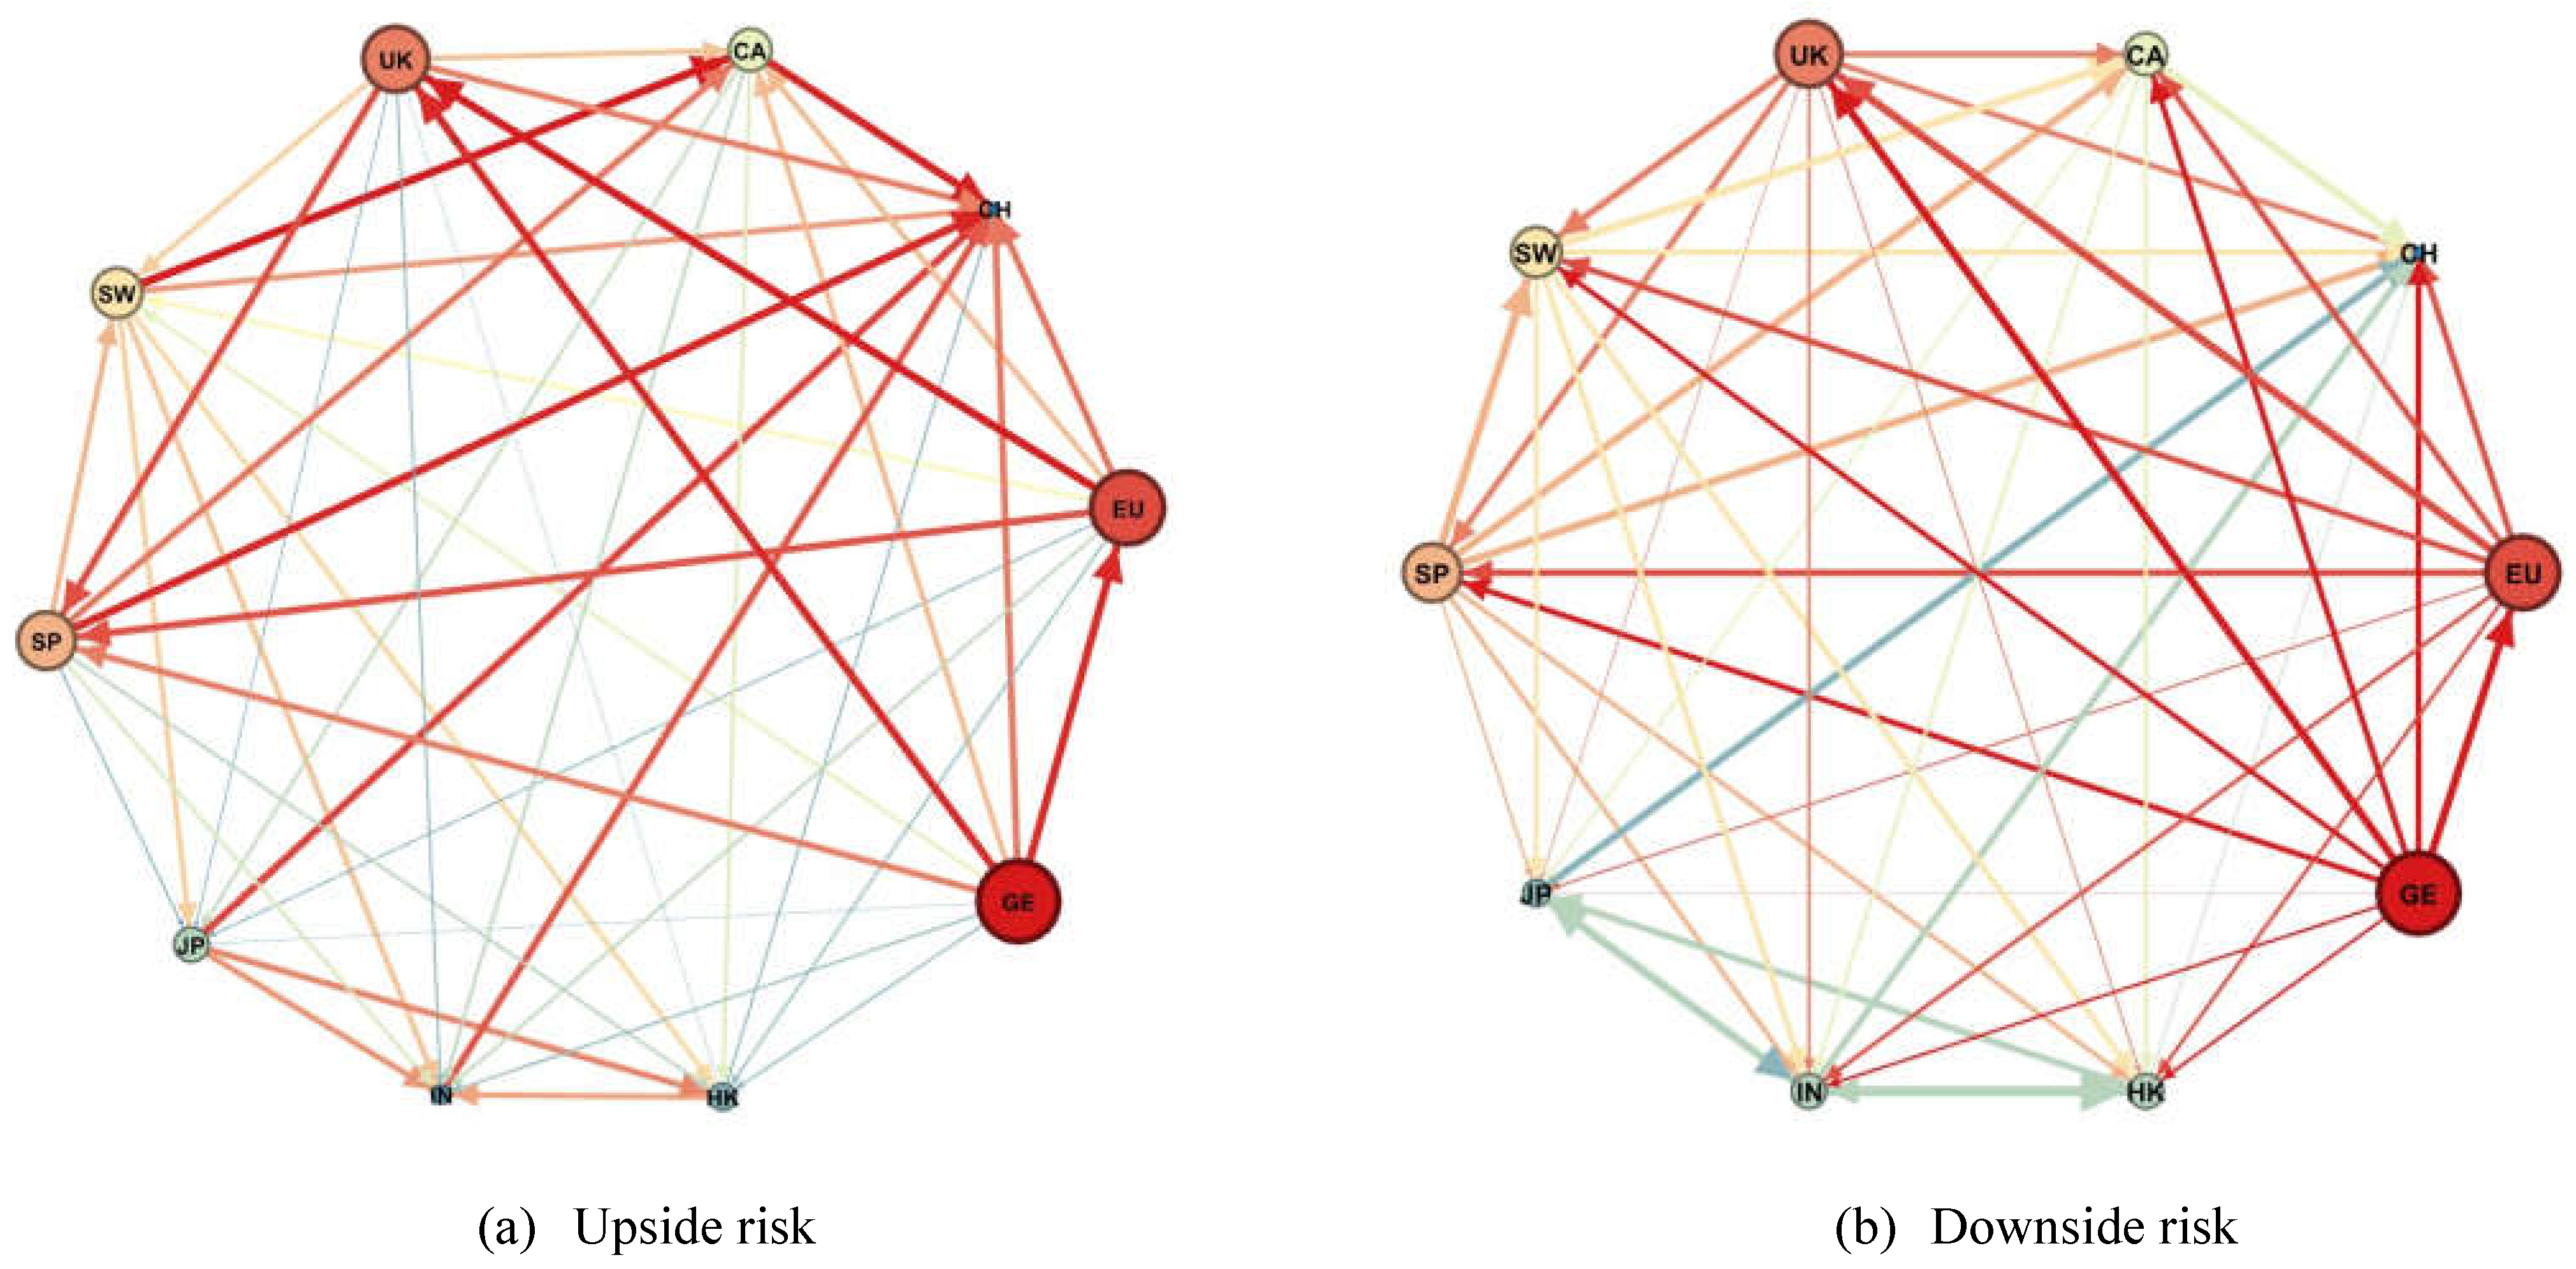
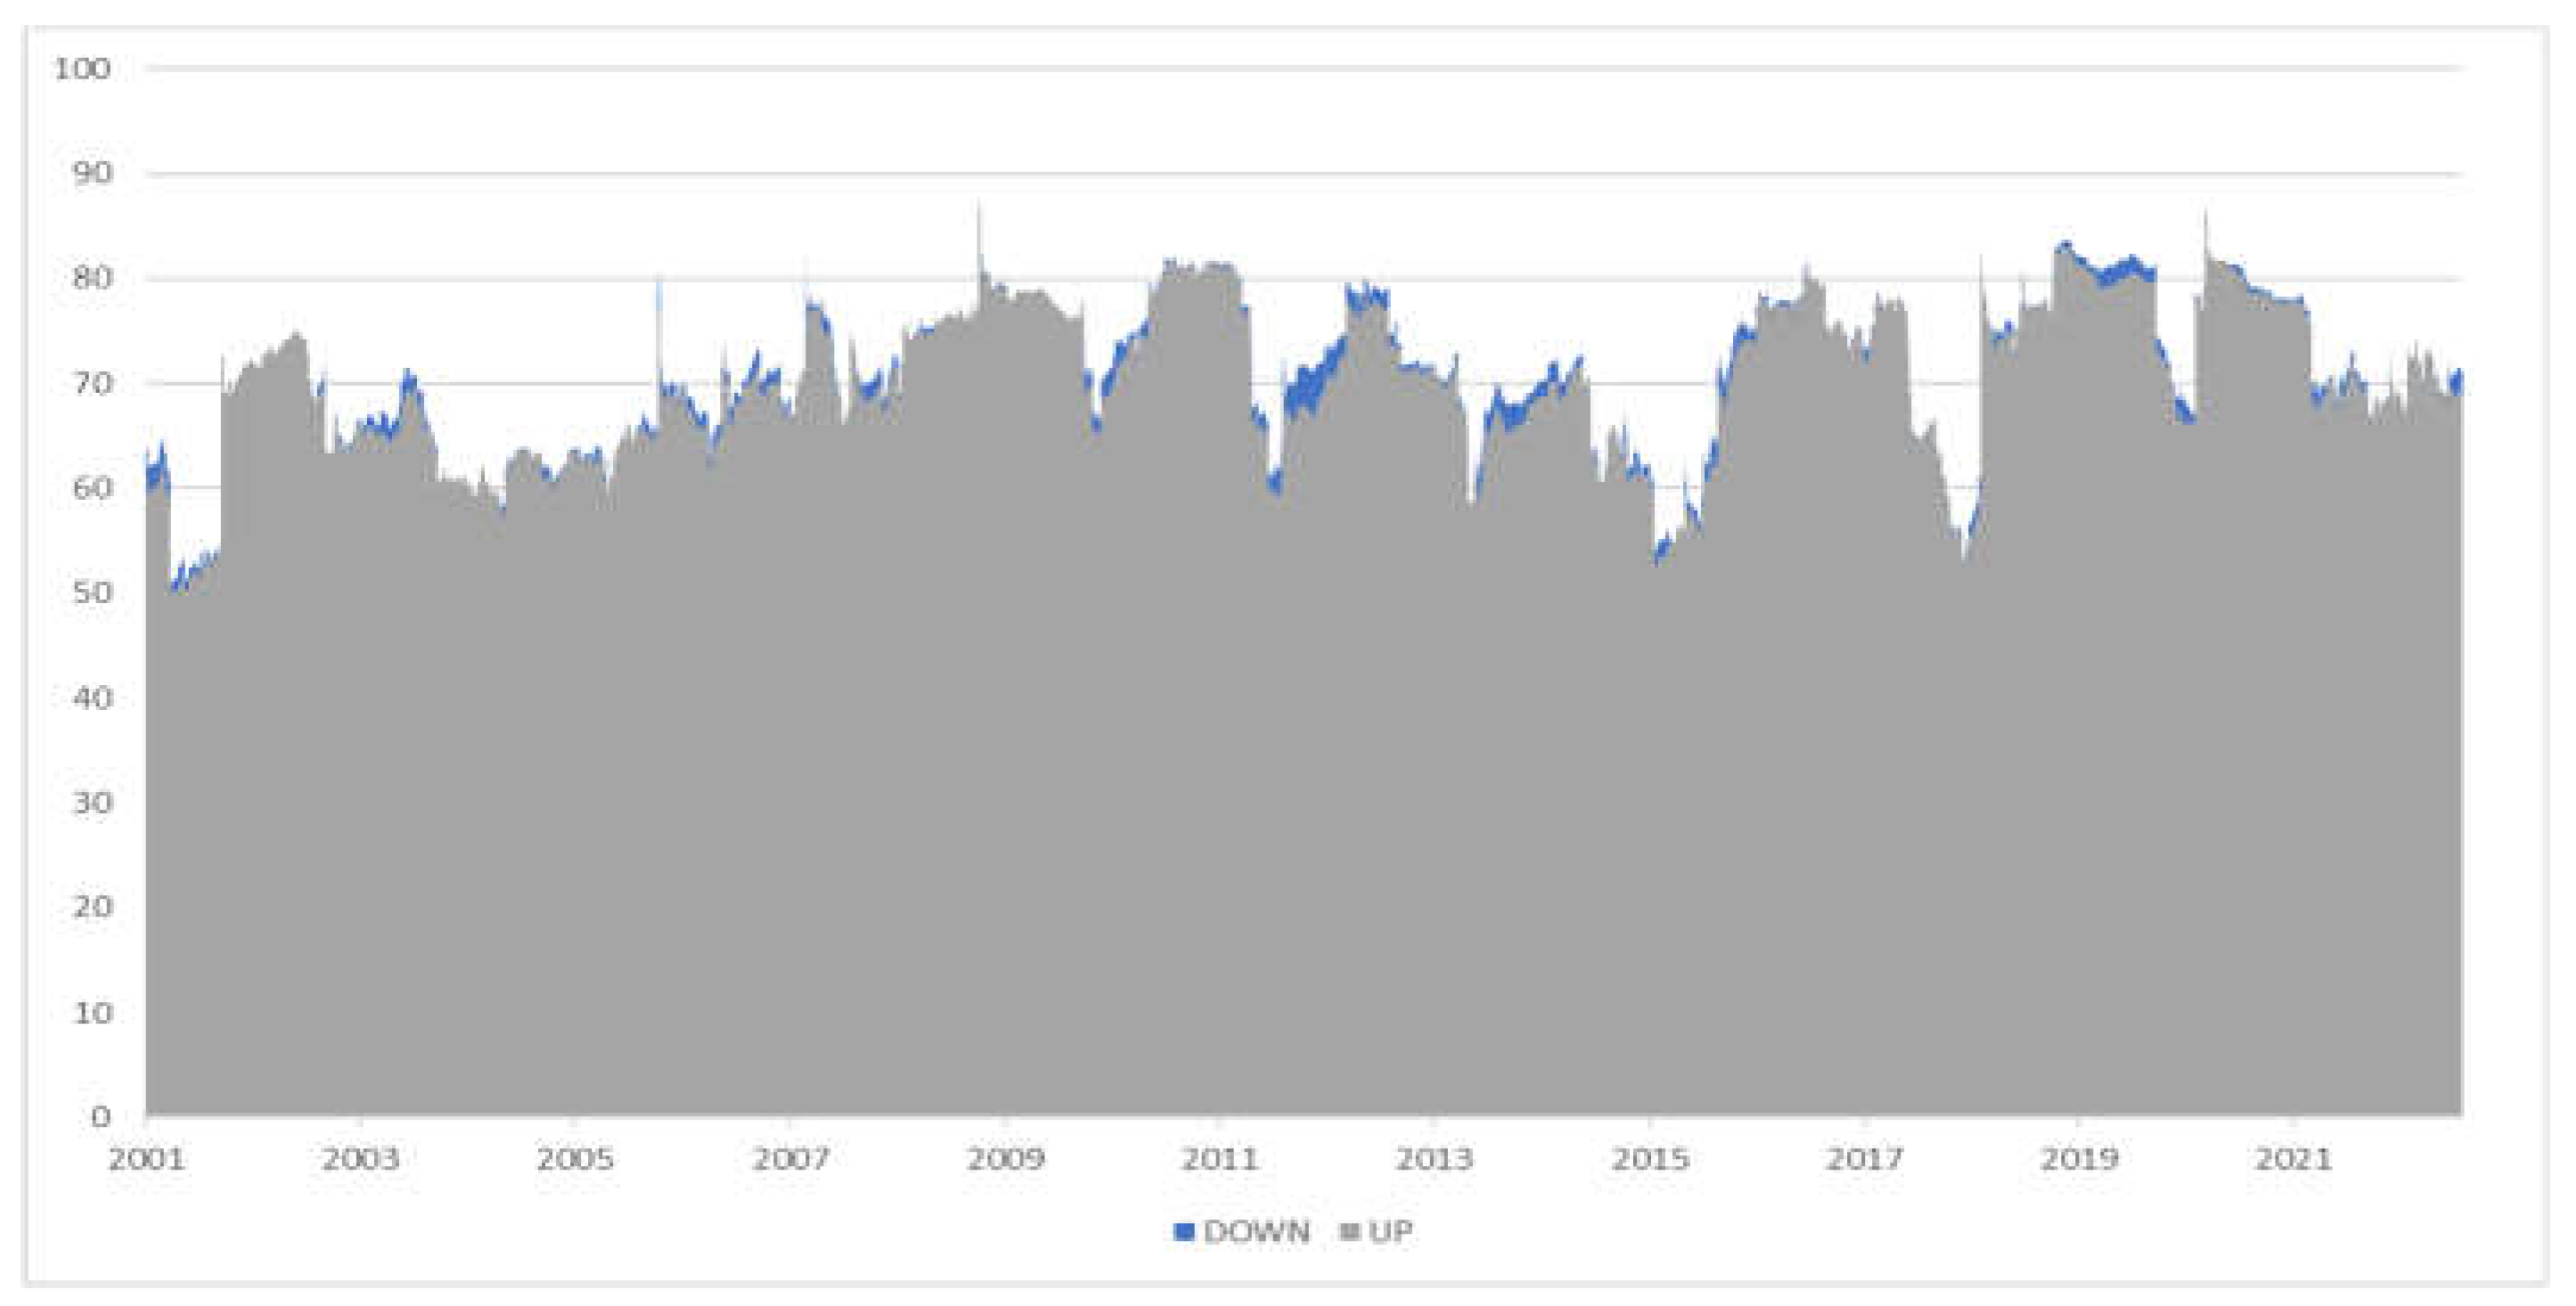
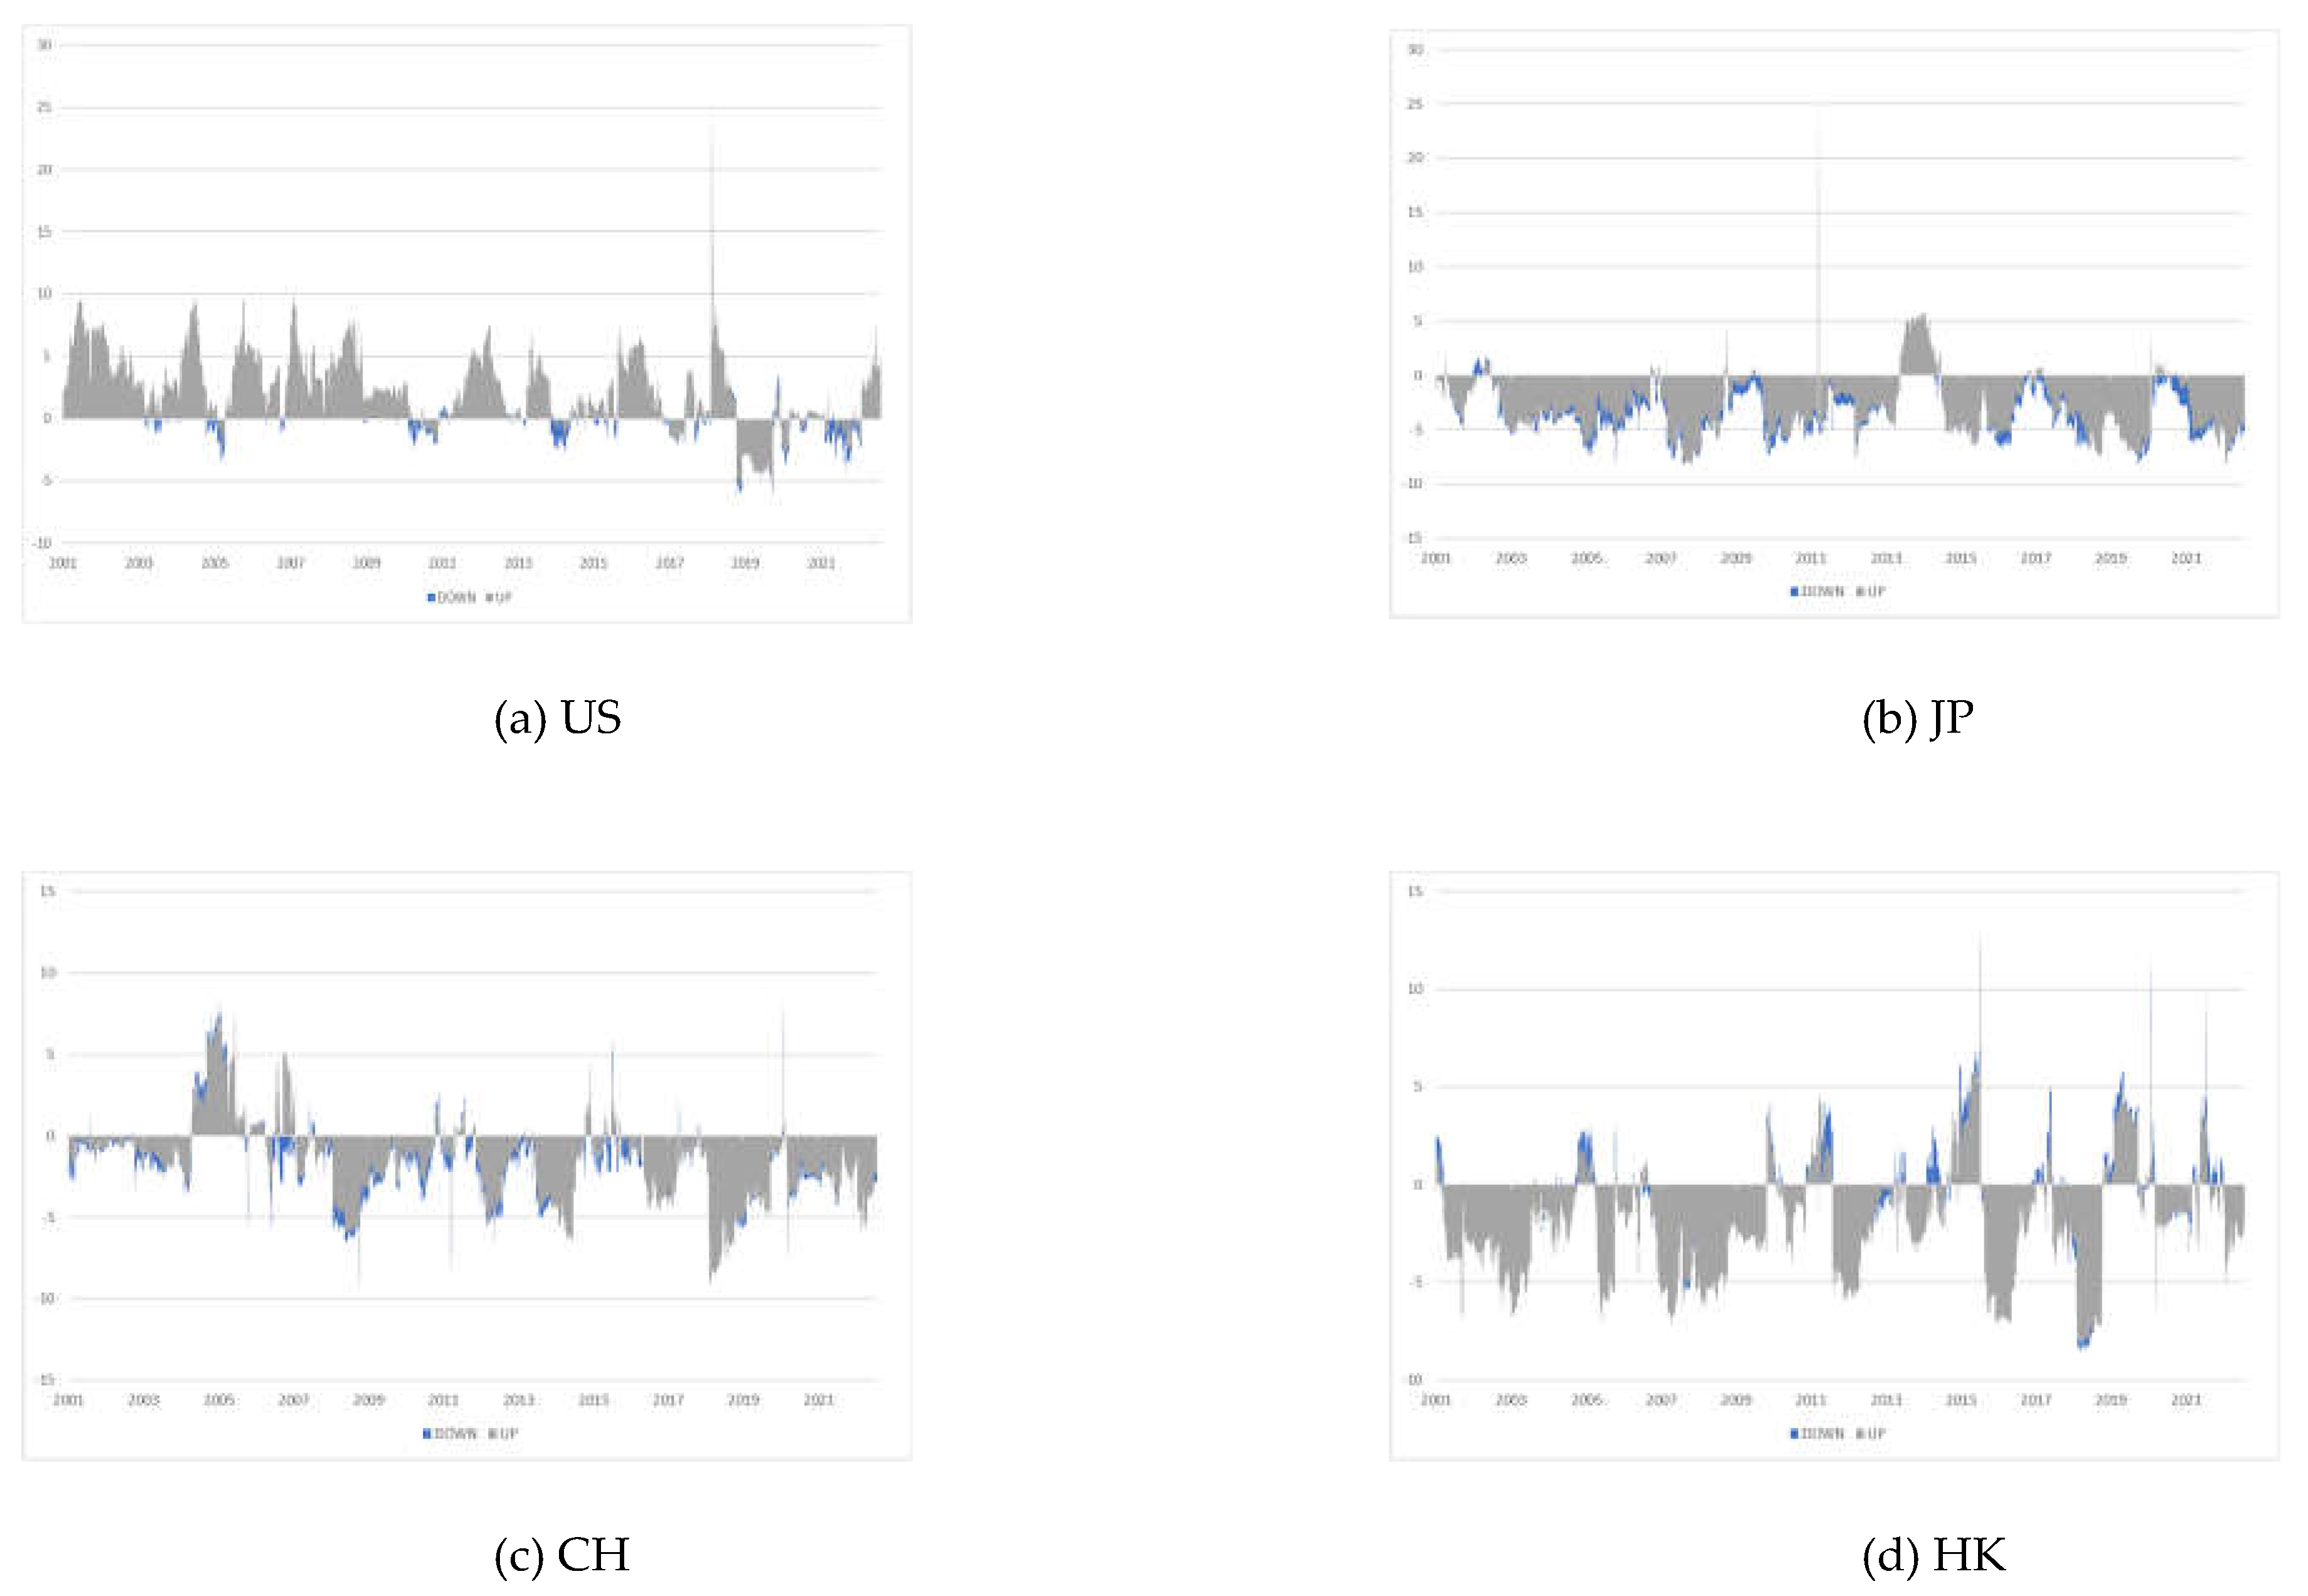
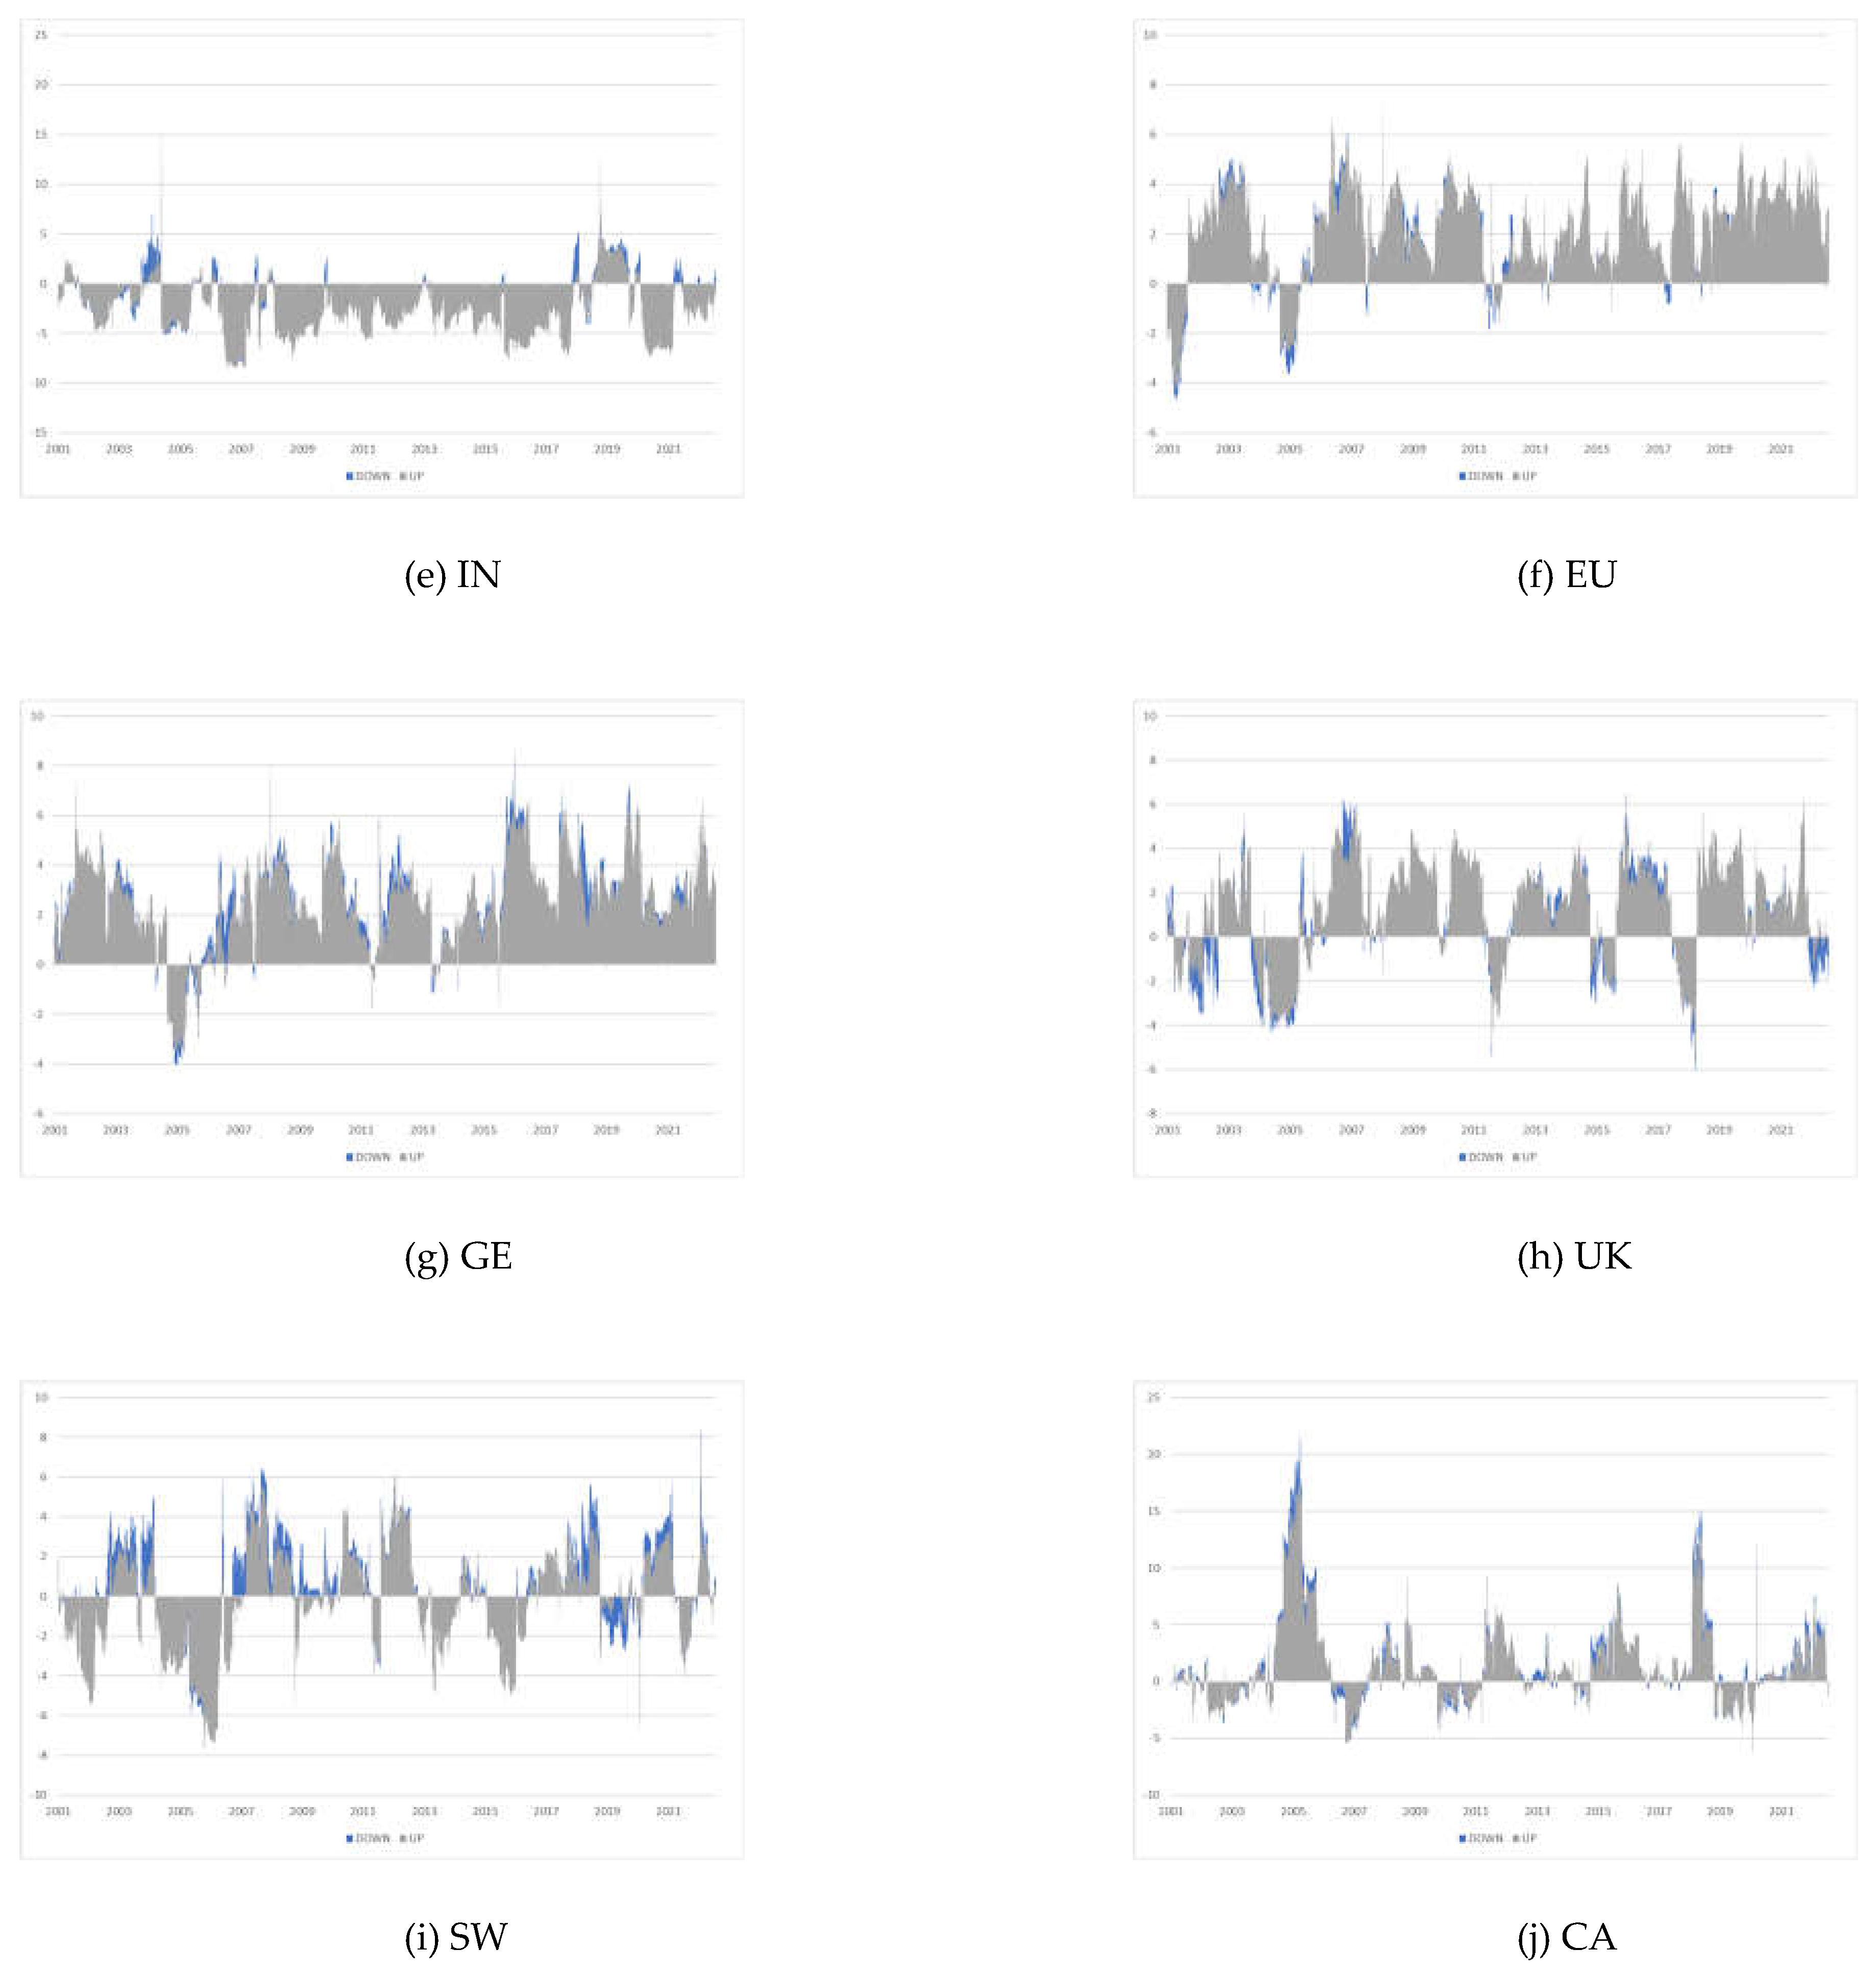
| Minimum | Maximum | Mean | Standard Deviation | Skewness | Kurtosis | J-B | ADF | |
| US | −0.1378 | 0.1042 | 0.0002 | 0.0136 | −0.5470 | 14.6547 | 26144*** | −32.9848*** |
| JP | −0.1292 | 0.1323 | 0.0001 | 0.0161 | −0.4801 | 9.8654 | 9168*** | −67.6401*** |
| CH | −0.0926 | 0.0940 | 0.0002 | 0.0167 | −0.2386 | 7.6583 | 4183*** | −67.3128*** |
| HK | −0.1358 | 0.1680 | 0.0000 | 0.0161 | 0.1181 | 12.7150 | 18017*** | −66.5190*** |
| IN | −0.1718 | 0.1611 | 0.0005 | 0.0162 | −0.4024 | 13.3090 | 20400*** | −66.2381*** |
| EU | −0.1324 | 0.1295 | 0.0000 | 0.0160 | −0.1547 | 9.5916 | 8308*** | −68.4671*** |
| GE | −0.1305 | 0.1346 | 0.0002 | 0.0163 | −0.1927 | 9.9620 | 9276*** | −32.2282*** |
| UK | −0.1276 | 0.1111 | 0.0000 | 0.0131 | −0.3189 | 12.3819 | 16871*** | −69.8792*** |
| SW | −0.1274 | 0.1576 | 0.0001 | 0.0128 | −0.1021 | 16.2633 | 33571*** | −67.4280*** |
| CA | −0.1700 | 0.1129 | 0.0002 | 0.0125 | −1.1556 | 25.6797 | 99156*** | −32.6103*** |
| US | JP | CH | HK | IN | EU | GE | UK | SW | CA | From | |
| US | 24.86 | 3.17 | 0.73 | 3.49 | 3.06 | 12.46 | 13.01 | 13.43 | 9.94 | 15.84 | 74.12 |
| JP | 8.73 | 26.25 | 1.38 | 9.07 | 4.75 | 10.47 | 12.05 | 10.45 | 8.45 | 8.40 | 73.33 |
| CH | 1.59 | 2.24 | 67.02 | 10.56 | 3.15 | 3.30 | 3.29 | 3.64 | 3.66 | 1.56 | 27.71 |
| HK | 7.30 | 7.52 | 3.78 | 29.22 | 9.13 | 8.41 | 9.10 | 10.97 | 6.27 | 8.30 | 71.22 |
| IN | 6.82 | 4.89 | 1.52 | 10.80 | 36.85 | 7.14 | 8.58 | 8.27 | 5.53 | 9.58 | 61.82 |
| EU | 10.50 | 4.21 | 0.85 | 3.89 | 2.86 | 21.57 | 19.55 | 15.47 | 13.10 | 8.00 | 78.05 |
| GE | 10.42 | 4.54 | 0.76 | 3.98 | 3.26 | 18.91 | 22.46 | 14.21 | 12.82 | 8.65 | 77.20 |
| UK | 11.14 | 3.59 | 0.94 | 4.66 | 3.29 | 15.81 | 14.84 | 22.34 | 13.33 | 10.05 | 77.53 |
| SW | 10.18 | 4.83 | 0.91 | 3.59 | 2.83 | 15.45 | 16.03 | 14.98 | 24.26 | 6.95 | 76.80 |
| CA | 16.80 | 3.04 | 0.72 | 4.33 | 4.83 | 10.42 | 11.20 | 12.51 | 7.59 | 28.56 | 72.13 |
| To | 90.82 | 43.22 | 10.29 | 45.24 | 28.74 | 105.13 | 109.00 | 106.46 | 74.82 | 76.18 | 68.99 |
| Net | 16.70 | -30.11 | -17.42 | -25.97 | -49.31 | 27.08 | 31.47 | 29.66 | 2.69 | 7.19 |
| US | JP | CH | HK | IN | EU | GE | UK | SW | CA | From | |
| US | 25.88 | 3.61 | 0.54 | 2.54 | 2.01 | 13.24 | 13.59 | 14.08 | 8.90 | 15.60 | 75.14 |
| JP | 9.87 | 26.67 | 1.06 | 7.14 | 3.58 | 11.12 | 12.48 | 11.03 | 8.53 | 8.52 | 73.75 |
| CH | 1.07 | 2.09 | 72.29 | 9.87 | 3.05 | 2.38 | 2.44 | 2.62 | 3.11 | 1.08 | 32.98 |
| HK | 7.69 | 9.18 | 3.71 | 28.78 | 8.06 | 8.63 | 9.05 | 10.98 | 5.75 | 8.17 | 70.78 |
| IN | 6.59 | 5.88 | 1.73 | 10.59 | 38.18 | 6.81 | 8.10 | 8.25 | 4.80 | 9.08 | 63.15 |
| EU | 11.99 | 4.58 | 0.61 | 2.73 | 1.77 | 21.95 | 20.09 | 16.04 | 12.16 | 8.08 | 78.43 |
| GE | 11.65 | 4.92 | 0.59 | 2.87 | 2.26 | 19.51 | 22.80 | 14.78 | 12.04 | 8.56 | 77.54 |
| UK | 12.88 | 4.06 | 0.69 | 3.40 | 2.18 | 16.44 | 15.39 | 22.47 | 12.29 | 10.19 | 77.66 |
| SW | 11.67 | 5.35 | 0.74 | 2.40 | 1.81 | 16.02 | 16.39 | 15.51 | 23.20 | 6.90 | 75.74 |
| CA | 17.41 | 3.56 | 0.61 | 3.70 | 4.02 | 10.96 | 11.46 | 13.16 | 7.24 | 27.87 | 71.44 |
| To | 83.48 | 38.02 | 11.59 | 54.37 | 37.15 | 102.38 | 107.65 | 103.93 | 80.69 | 77.34 | 69.66 |
| Net | 8.34 | -35.72 | -21.39 | -16.41 | -41.28 | 23.95 | 29.99 | 28.19 | 9.25 | 7.68 |
Disclaimer/Publisher’s Note: The statements, opinions and data contained in all publications are solely those of the individual author(s) and contributor(s) and not of MDPI and/or the editor(s). MDPI and/or the editor(s) disclaim responsibility for any injury to people or property resulting from any ideas, methods, instructions or products referred to in the content. |
© 2023 by the authors. Licensee MDPI, Basel, Switzerland. This article is an open access article distributed under the terms and conditions of the Creative Commons Attribution (CC BY) license (http://creativecommons.org/licenses/by/4.0/).


