1. Introduction
Water is a natural resource that requires specific treatments to be eligible for human consumption. This treatment involves the use of physical and chemical processes that result in treated water and a waste product called drinking water treatment plant sludge (DWTS).
DWTS have the characteristics of raw water and the products used in the treatment. During the coagulation, step in the conventional treatment system, salts such as Al2(SO4)3, AlCl₃ and FeCl3 are added to agglomerate the impurity particles and eliminate them during sedimentation and filtration [1]. The composition of these coagulants may confer toxic properties to DWTS. If indiscriminately discarded into the environment, such as in a water source, it can impair the algal growth and cause fish death [2,3,4]. Studies have shown that the presence of certain bacterial genera in sludge can generate poisonous metabolites, causing severe and even fatal digestive, neurological, and skin diseases in humans [5]. Approximately 500 m³/s of water is used for drinking water production in Brazil, which is expected to increase by 26% by 2030 owing to the growth of the urban population [6]. During this process, DWTS generation is estimated to range from 260,000 to 800,000 m³/day [7]. Although Brazilian legislation recommends the reuse or recycling of solid waste to reduce its environmental impacts [8], most of the DWTS generated in Brazil are still discharged into rivers [9].
Therefore, alternatives for the reuse or recycling of DWTS are important to reduce their impact on the environment. The chemical composition of the sludge, primarily silicates, salts aluminum and metal oxides, allows its use in construction materials as a substitute for sand in the production of concrete, in addition to the production of cement and clinker, and partial replacement of soils to produce ceramics for various purposes [10,11,12]. DWTS have been used in the production of structural ceramics [13,14,15], floor and wall tiles [16,17], lightweight aggregates [18], and ceramic blocks [19,20,21,22].
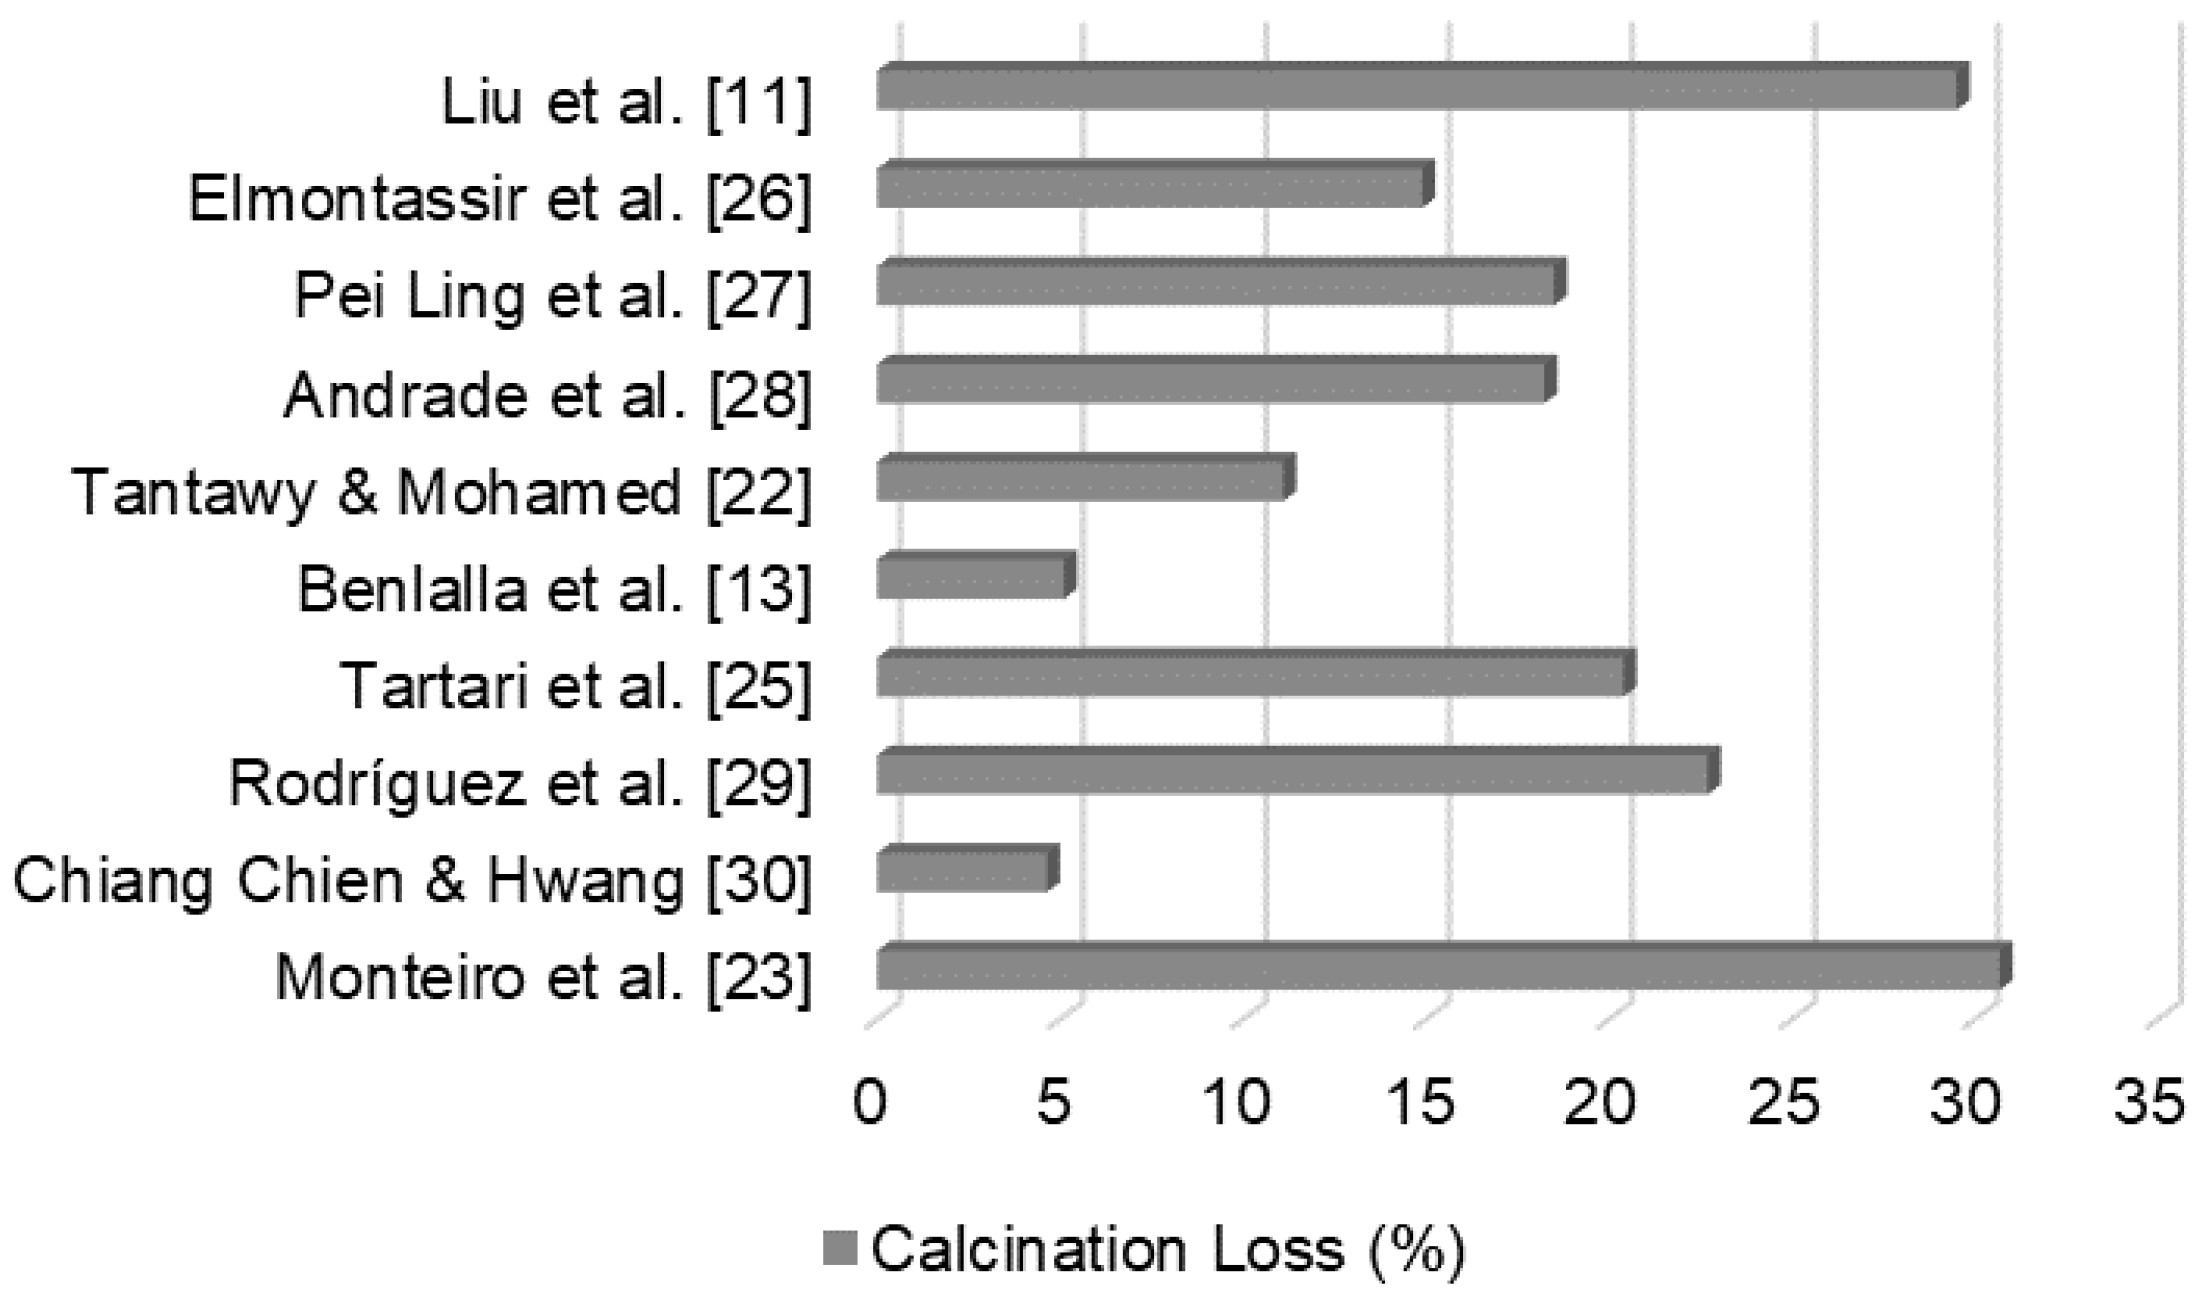
DWTS has a high organic matter content, as shown in
Figure 1, with results from calcination loss (C.L.) obtained in previous studies. Thermogravimetric tests indicated that mass loss occurred at three average temperatures [23]. The first was associated with the elimination of hygroscopic water at approximately 100 °C, second with the oxidation of organic matter at 300 °C, and third with the dihydroxylation of kaolinite at approximately 500 °C. In DWTS, the largest fraction of mass loss, about 80% of the total, occurs at 300 °C range because of its high organic content. The organic matter in DWTS indicates organic waste from raw water [24]. In a study conducted by other authors, a high mass loss of specimens produced with mixtures of soil and DWTS was responsible for increased water absorption and reduced strength, when compared with that of the reference sample, owing to the high C.L. (30.67%) [23]. Therefore, the use of DWTS is not recommended as a major component in mixtures with soil for ceramic production [25].
Another important physical characteristic of DWTS is its similarity to silty sand, resulting in poor plastic and partially cohesive behavior [17,31]. Coarse silt particles and their low water absorption capacity reduce the plasticity of mixtures with DWTS [32]. However, the combination with highly plastic soils favors the organization of the particles in the ceramic body, facilitating the drying process, avoiding cracking, and resulting in, the loss of strength [33].
The way DWTS is used in ceramic production is not a consensus among the authors. The substitution of conventional raw materials with DWTS is based on their chemical similarity; however, properties such as grain size directly affect the quality of the produced ceramic bodies.
The preparation of DWTS after its collection from the treatment plants includes drying the sludge in air or kilns and grinding it, facilitating transportation and enabling regularity and control of the particle size for recycling. In previous studies, the justification for the choice of the particle size resulting from DWTS processing has received little attention, defined randomly or not discriminated. Smaller grains facilitate glass phase formation during calcination of the ceramic, reducing its porosity and increasing its strength [19]. Nevertheless, the variety of sludge particle sizes used in various studies shows that smaller particles do not always exhibit the best performance.
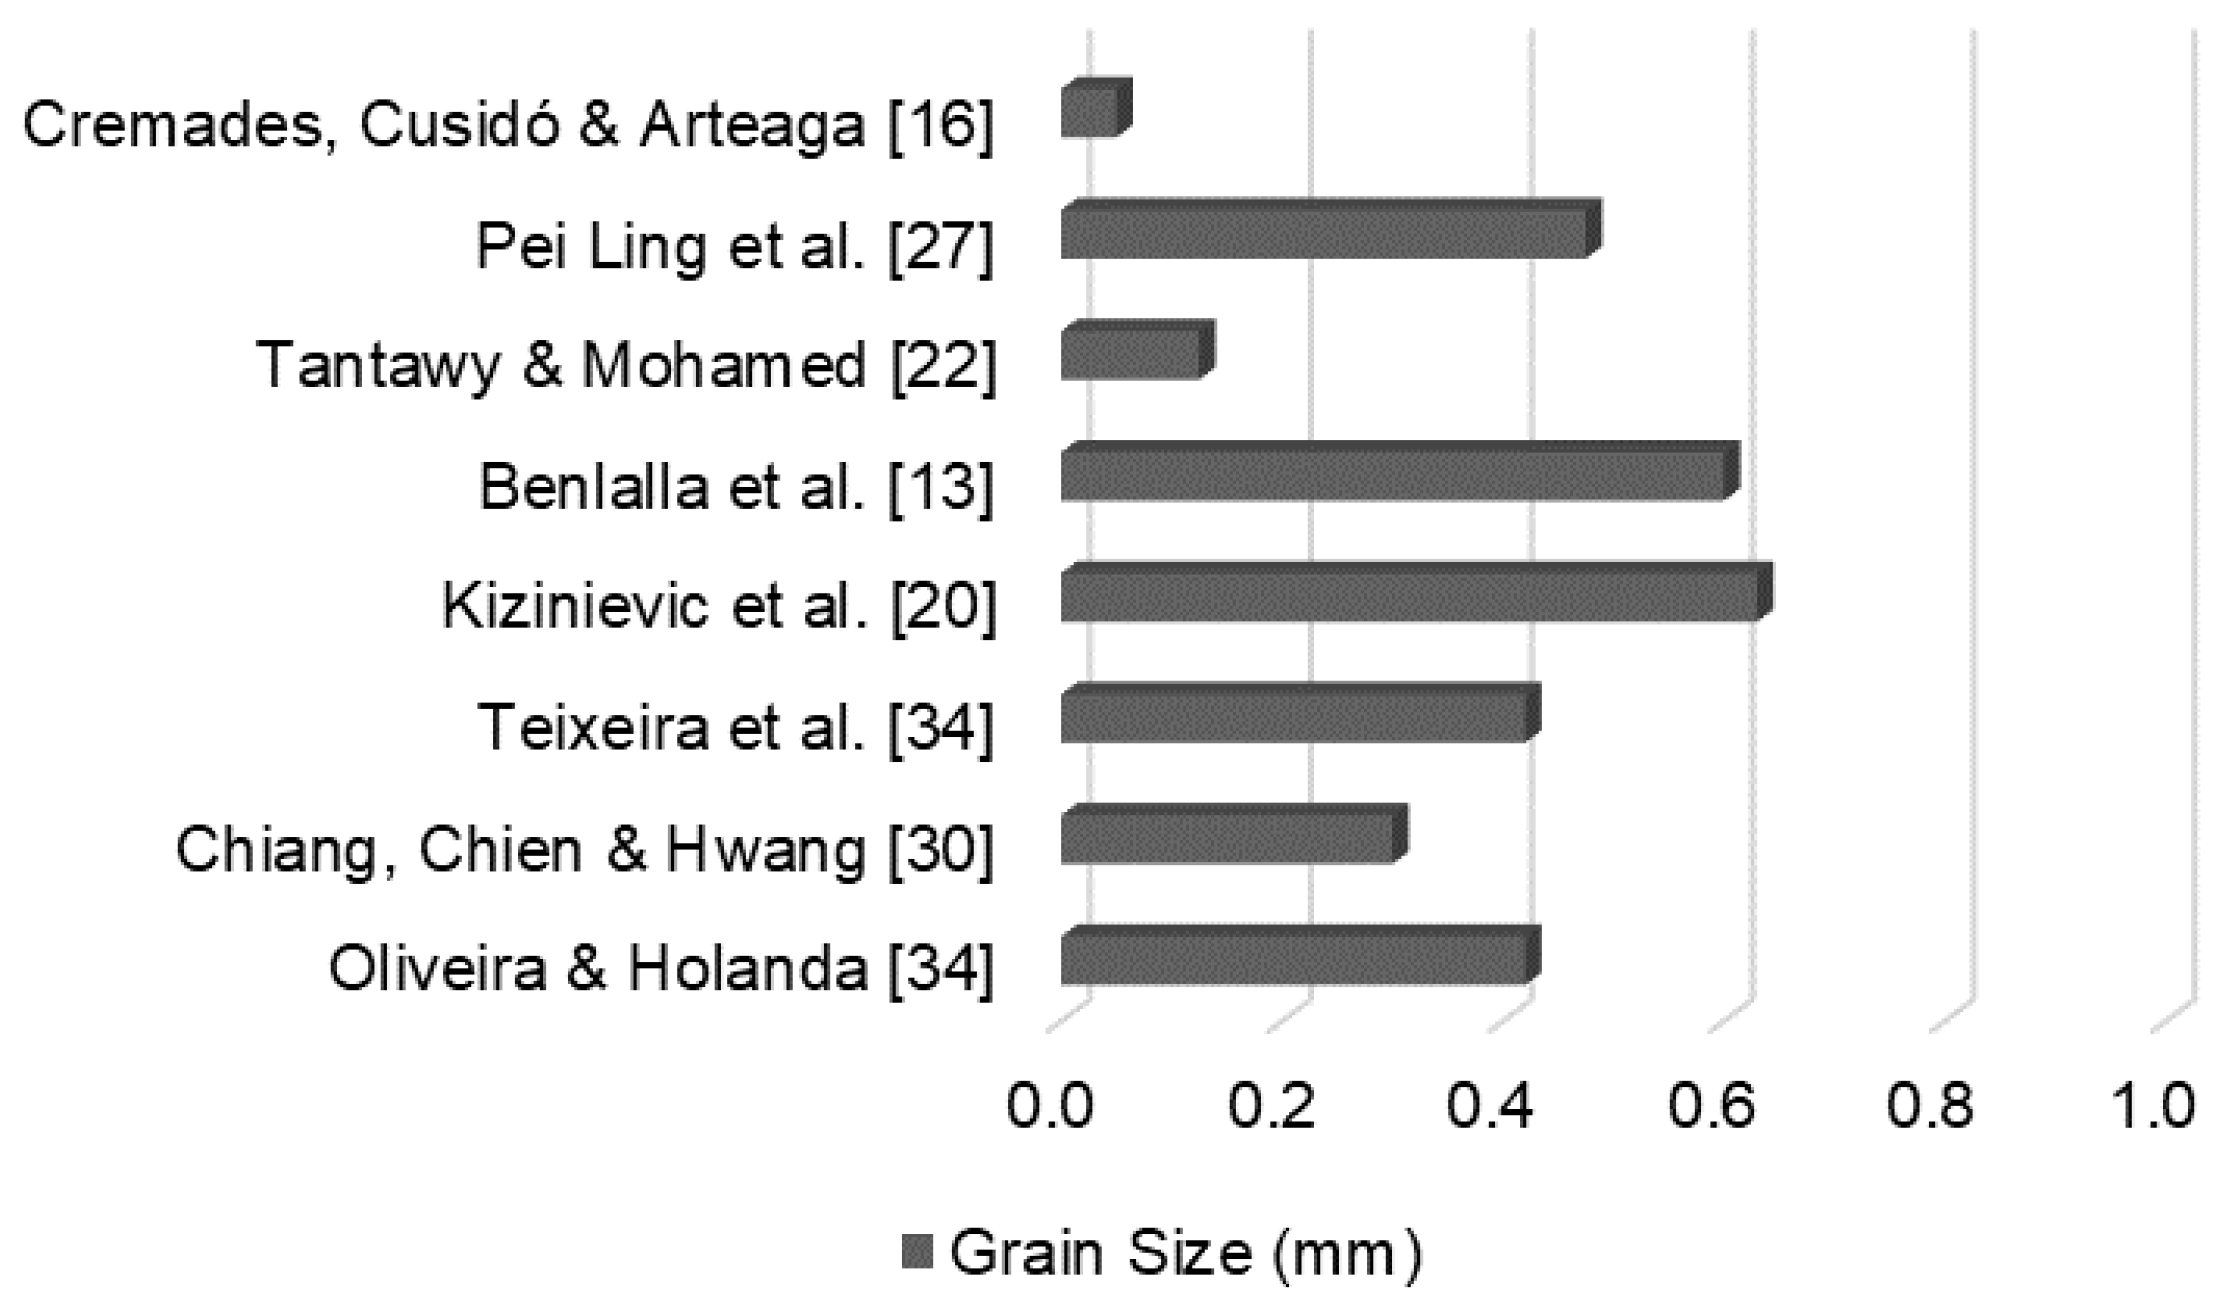
Figure 2 shows the maximum grain diameters used in certain studies with DWTS replacing soils for ceramic material production.
DWTS processed in similar ways, including drying and grinding, resulted in different properties. In one study, the authors stated that the incorporation of ground DWTS increased the fraction of particles smaller than 0.002 mm the mixture, thereby increasing its plasticity [34]. The replacement of up to 15% soil with DWTS did not significantly change the properties of ceramics calcined at temperatures between 850 and 1050 °C. Similarly, another study replaced clay ground sludge with a 0.42 mm fraction and reported a reduction in the quality of ceramic bodies calcined at 1000 °C [35]. The specimens exhibited double the water absorption and half the flexural strength of the reference samples with 15% soil replacement by DWTS. Another study using grain ground to a maximum diameter of 0.63 mm showed that the DWTS retains more water owing to its colloidal properties, doubling the water absorption values of specimens produced with 40% DWTS, calcined at 1000 °C [20].
DWTS can be processed in several ways, however, studies combining different processing methods are scarce. These variations make it difficult to compare the results, impairing the understanding of the way and the extent to which the characteristics of DWTS influence the quality of ceramic bodies.
The ceramic industry is the main supplier of bricks for masonry in Brazil, with an estimated production of 140 million tons of red ceramic products [36]. The purpose of using DWTS is to dispose of waste and reduce the demand for soil in ceramic production, but the challenge is to obtain mixtures that result in strength and durability equivalent to conventional ceramics.
This study evaluates how the partial replacement of clay by DWTS influences the properties of ceramics produced, investigating the interference of DWTS organic matter content and particle size, and the combination these. The results obtained in the physical and mineralogical tests of the specimens with the binary mixtures were compared with specimens prepared only with soil.
2. Materials and Methods
2.1. Raw Materials
This study used two soils identified as C1 and C2 and classified as fine soils by the Unified Soil Classification System (USCS) [37]. Theses soils were obtained from pottery in the Metropolitan Region of Recife (RMR), northeastern Brazil. According to the SUCS, C1 is a low plasticity clay (CL) and C2 is a low plasticity silt (ML). The DWTS was obtained from Botafogo Water Treatment Plant (DWTP), also located in the RMR. The DWTP Botafogo is responsible for treating about 95,000 m³ of water per day. The raw water received undergoes the conventional treatment method and uses Al2(SO4)3 as the coagulant. The sludge was collected during the densification stage that was performed using dewatering bags.
2.2. Processing and Characterization
Soil samples C1 and C2 were air-dried to a hygroscopic humidity. Tests for the grain size, liquidity limit, and plasticity limit were performed according to the Brazilian standards [38,39,40]. The particle size composition of the raw DWTS was obtained using a particle size analyzer because dried sludge tends to form lumps.
The physical properties of the soil and DWTS were similar (
Table 1). The specific mass was the same; however, the DWTS had a higher percentage of grains in the silt and sand size range. When mixed with water, DWTS has characteristics similar to sand, with low cohesion between grains. The Atterberg limit tests show that the DWTS has no plasticity limit (PL) or liquidity limit (LL).
The oxide concentrations of DWTS and soil, after dry in an oven (105 ± 5 °C) and milled (0,075 mm) samples, were determined by quantitative analysis using a Rigaku X-ray fluorescence spectrometer (model: ZSX Primus II) equipped with an Rh tube and seven analyzer crystals (
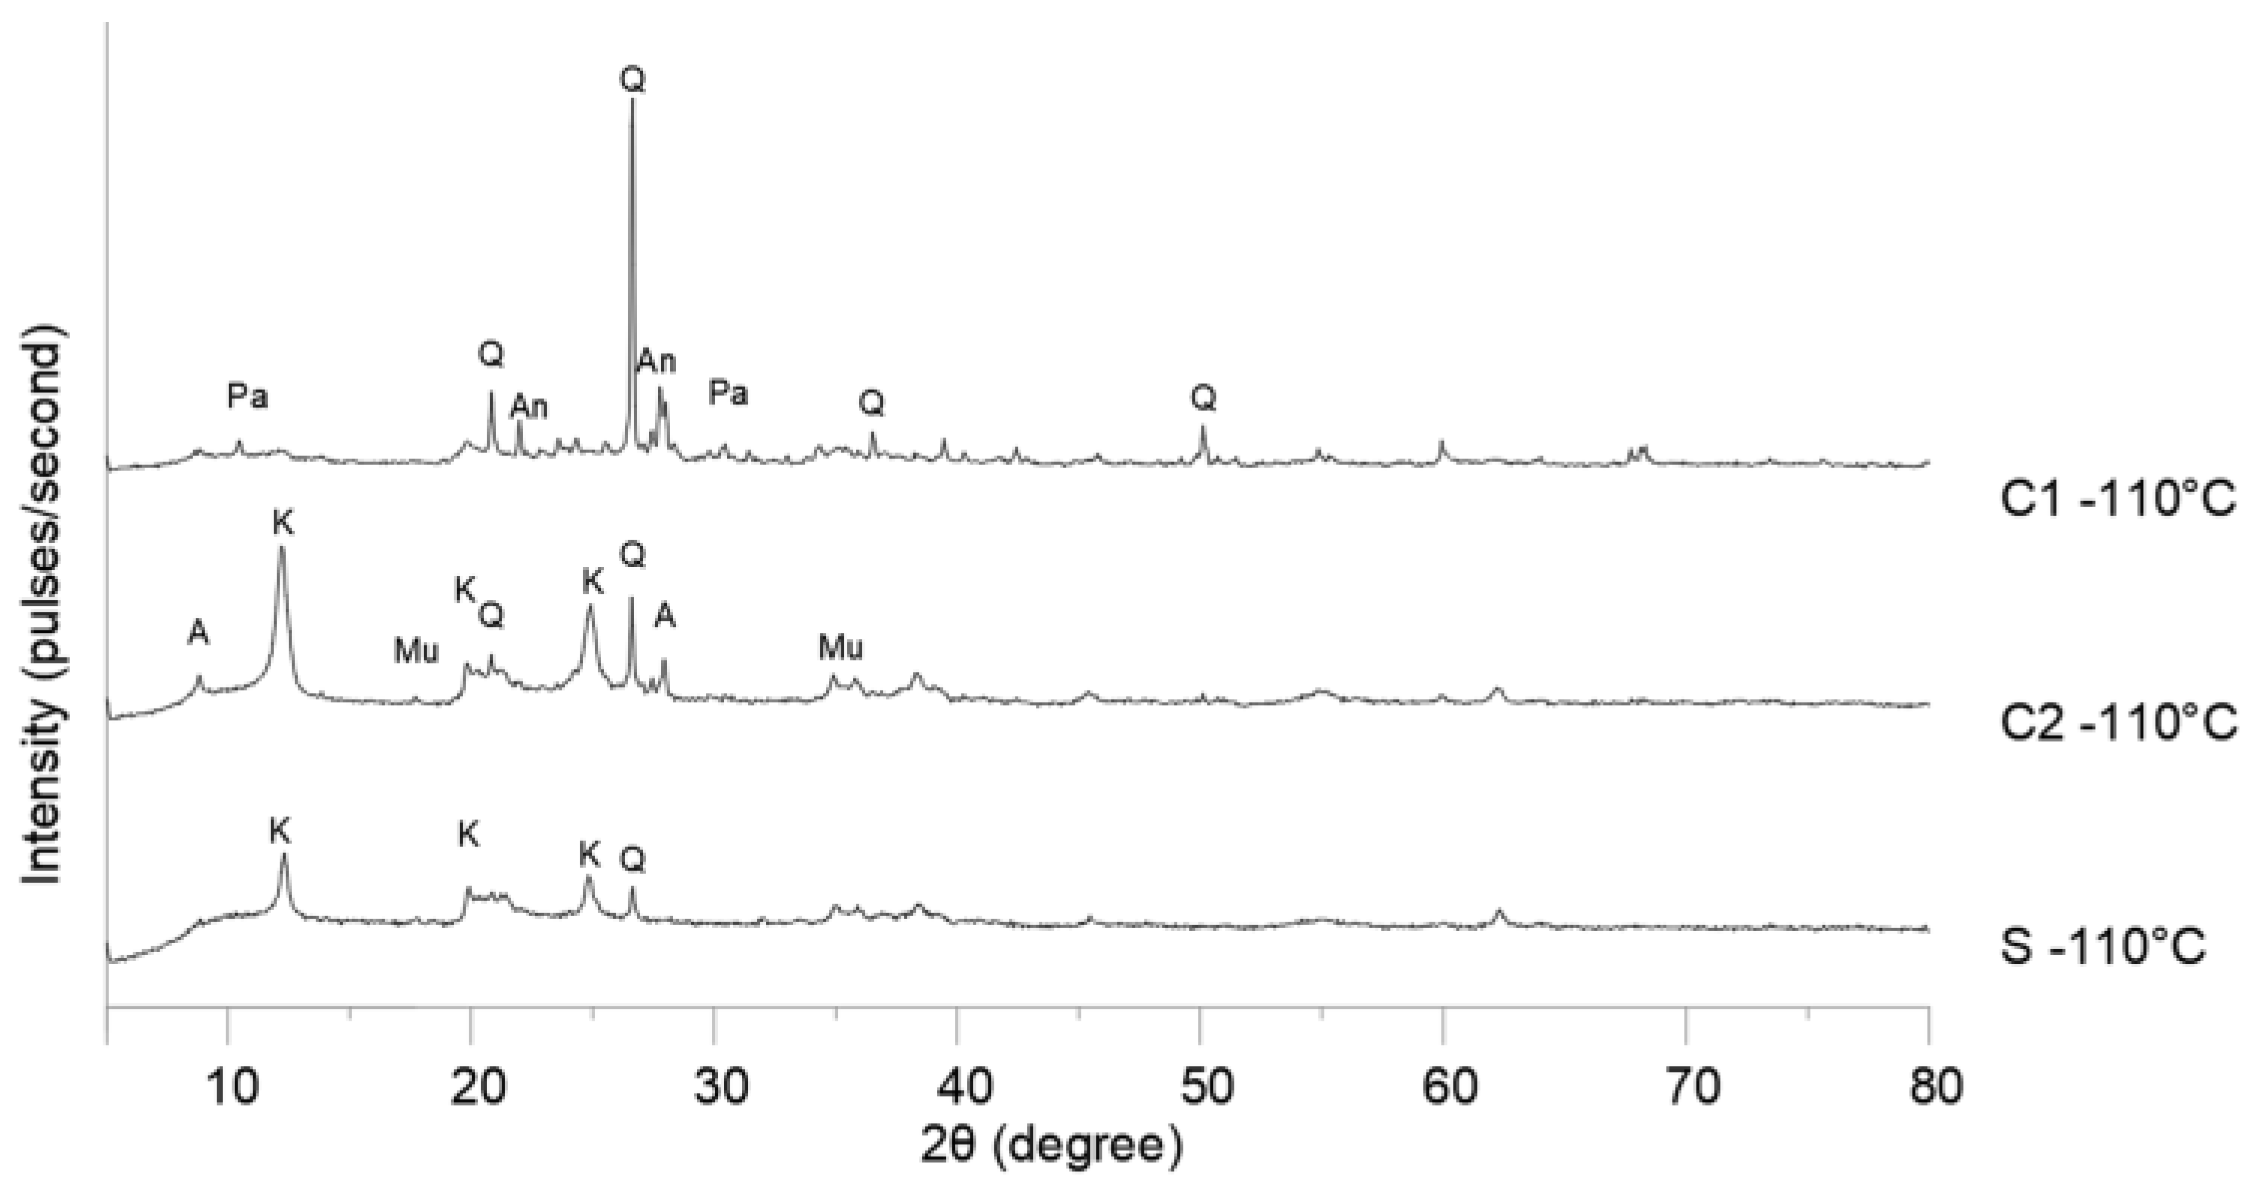
Table 2). The mineralogical composition of the samples was determined using a Bruker X-ray diffractometer (model: D2 PHASER). A 3 mm bulkhead was used with a 1.00 mm beam and rotation speed of 15 rad/s. The scan used was with 2θ ranging from 5° to 80°, with a step of 0.05 every 0.575 s, for all samples (
Figure 3).
The analysis of
Table 2 indicates that the soils and DWTS typically have the same oxides, SiO
2, Al
2O
3, and Fe
2O
3. The content of fluxing agents (Na
2O, MgO, K
2O, CaO, and Fe
2O
3) in C1 (15.3%) was higher than that in C2 (12.2%). The presence of fluxing agents facilitates melting by reducing the temperature required for the formation of the glassy phases during calcination [41]. The high Al
2O
3 content of DWTS was due to the use of aluminum sulfate for water treatment, and the high Fe
2O
3 content was due to the quality of the raw water. The C.L. of DWTS was higher than that of clays, which is consistent with previous studies [25,42,43,44].
The diffraction patterns of the raw materials (
Figure 3) confirmed the chemical analysis, with the presence of quartz in all samples. Quartz hinders sintering and can impair the mechanical strength of ceramics [45,46]. The melting temperature of quartz is very high (1710 °C), and under normal conditions of calcination of ceramic materials in the construction industry, this temperature hardly exceeds 1200 °C. The anorthite found in C1 was also resistant to temperature changes. Minerals such as kaolinite and muscovite, found in C2 and S, decomposed with increasing temperature and reduced density, resulting in porosity in ceramic bodies [42,45,47]. The combination of quartz and kaolinite was responsible for the low interaction between the grains in the mixtures because both have little affinity for water [27].
2.3. DWTS Improvement
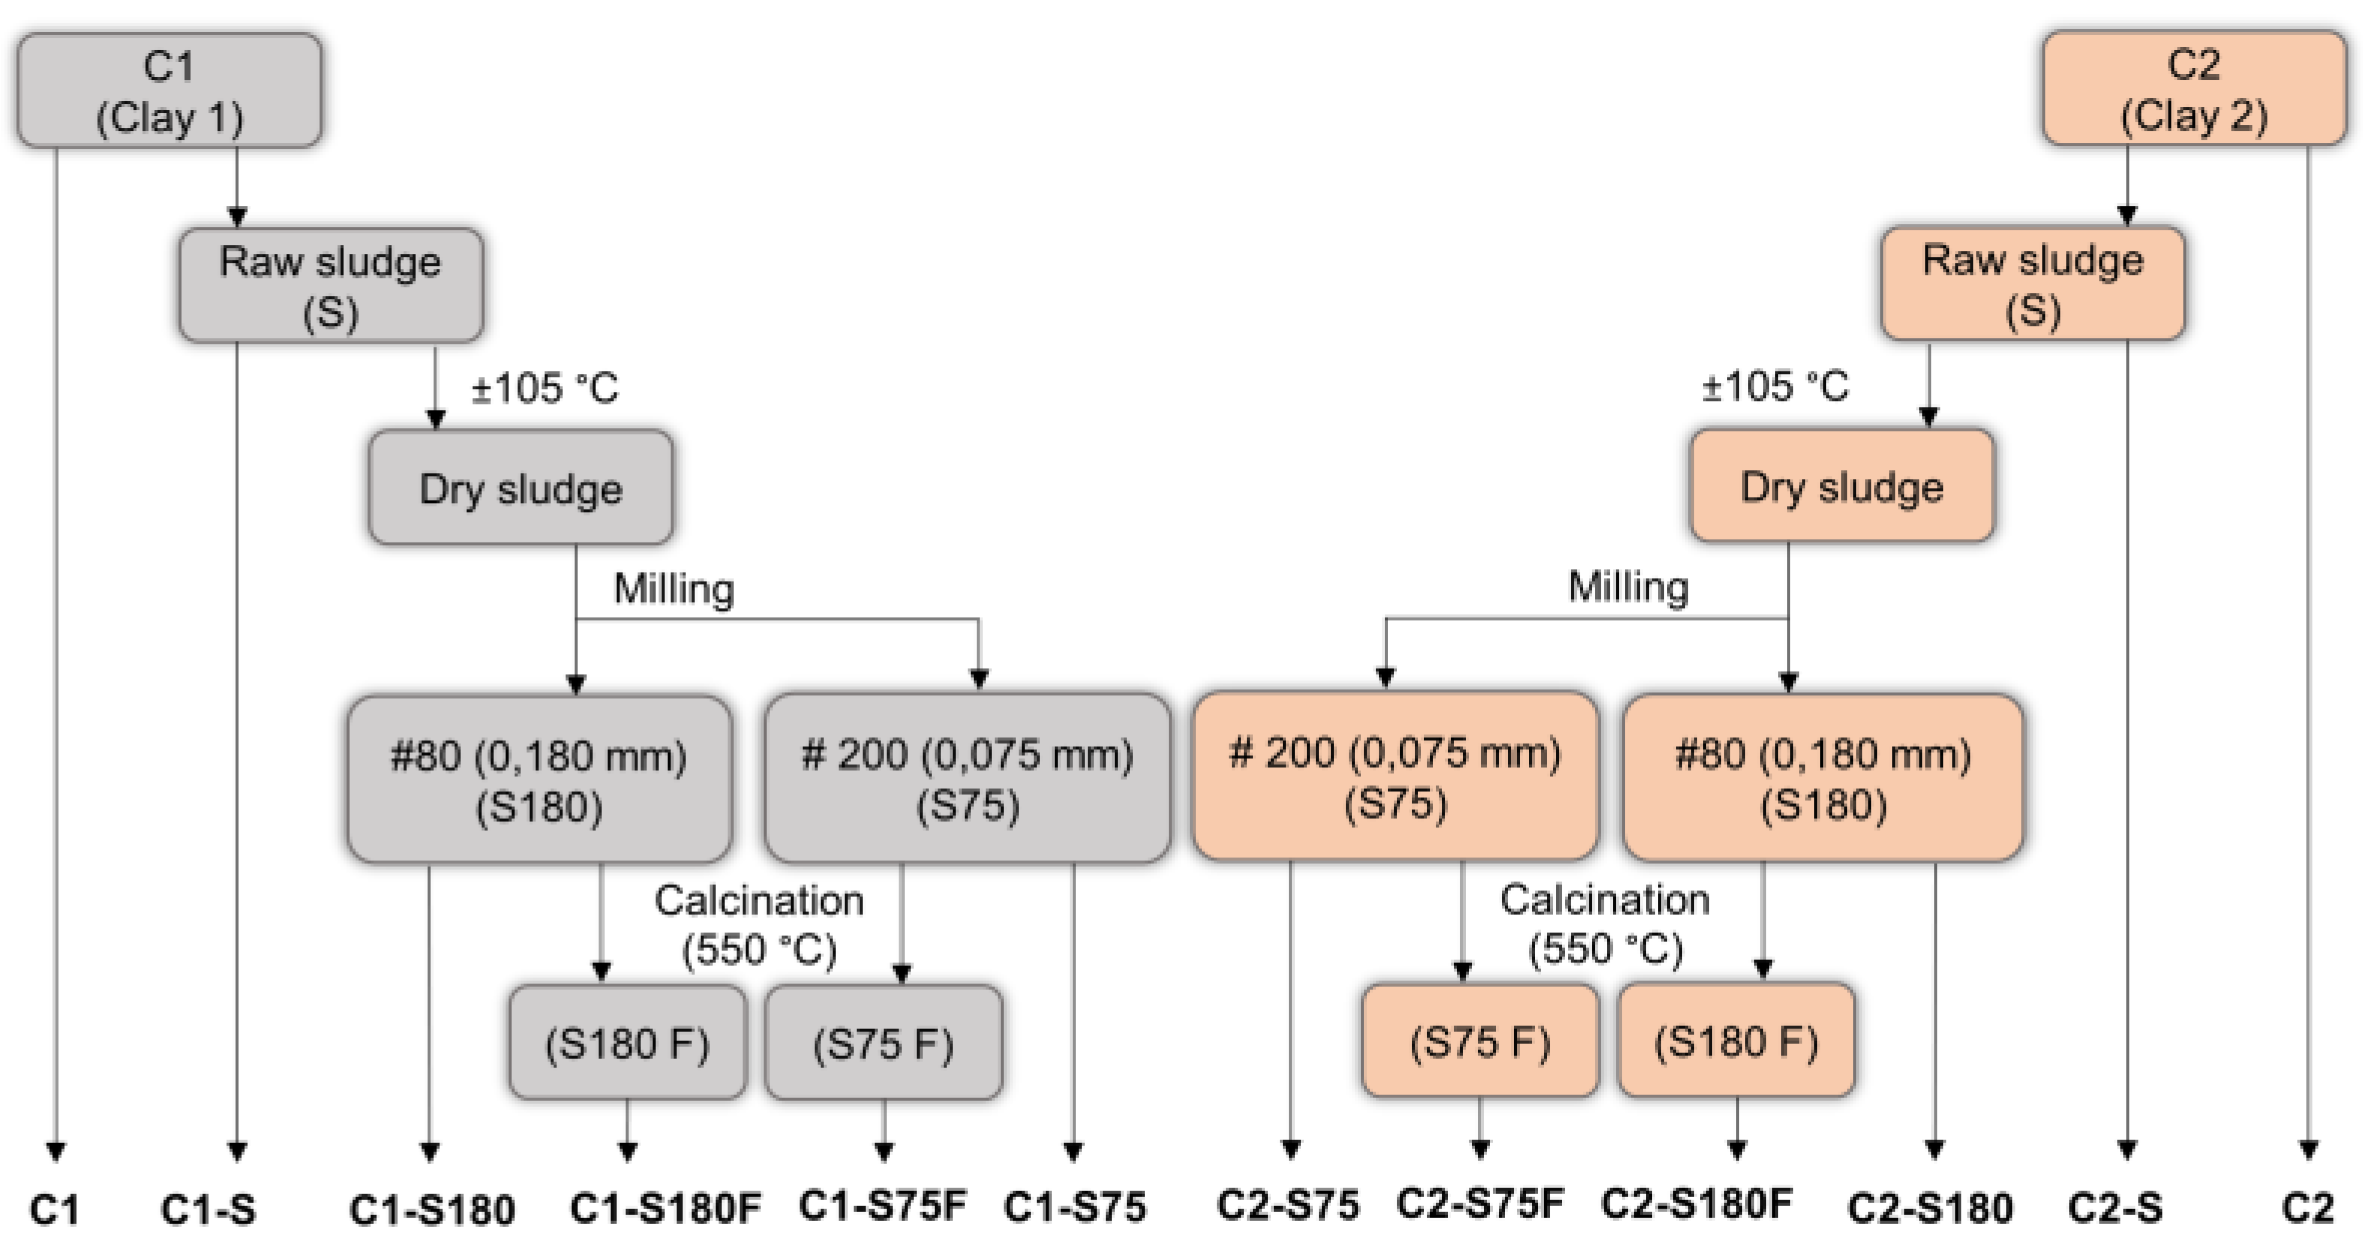
In this study, a part of the DWTS was used in its original form, with about 80% moisture, called raw sludge (S). The other part was oven-dried at 105 ± 5 °C at constant weight. Half of the oven-dried part was manually crushed and sieved, and the fraction that passed through the 80 mesh sieve (0.180 mm) was called S180. The other half was crushed using a ball mill and sieved, and the fraction that passed through a 200 mesh sieve (0.075 mm) was named S75. Samples of S180 and S75 were calcined in a 550 °C muffle furnace to remove organic matter [32,34,48]. The calcined samples were named S180F and S75F. Thus, the studies were conducted by partially replacing clay with five sludge samples: S, S180, S75, S180F, and S75F.
Figure 4 shows a flowchart for the preparation of the mixtures.
2.4. Preparing the Mixtures
The mixtures were prepared according to the Winkler diagram that uses a combination of percentages of the grain sizes of the materials and suggests where these masses should be used [49]. Thus, the DWTS replaced 5, 10, and 20% of C1. After 20% replacement of soil by DWTS, the material produced is not recommended for use. The same procedure was adopted for C2.
Table 3 lists the compositions of each mixture.
2.5Preparation of the Specimens
The production of the specimens followed the usual methodology for clay characterization, which consists of moistening the samples, molding, and calcination, to perform the physical and mineralogical tests [50]. This method uses small portions of soil to determine the important properties of ceramics after calcination, such as shrinkage, water absorption, flexural tensile strength, specific mass, and mineralogical composition. The amount of water employed was approximately half of the PL obtained; therefore, the PL of each studied mixture was determined (
Figure 5).
The graphs in
Figure 5 correlate the sludge content with the plasticity limits of the mixture. Despite the lower PL values of C1 (25.34%) compared with C2 (32.99%), the characterization of the soils, as presented in
Table 2, indicated that the PI of C1 (18.76%) was higher than that of C2 (14.61%). Hence, C1 was more plastic than C2. This characteristic indicated the greater presence of clay minerals in C1; this was also confirmed by granulometry because C1 had a greater fraction of grains in the clay range than C2.
Larger grains increase the need for water to develop plasticity [49]. Replacing soil with sludge increases PL because sludge has more grains in the silt and sand ranges than both soils.
Mixtures prepared with C1 showed a slight variation in PL between the study improvement methods around 4% (C1–S75F and C1–S180 with 20% DWTS). In C2, the difference between the PL of C2–S180F and C2–S75 was 10%. This variation was related to the increase in the sand fraction, facilitating the evaporation of water even when managing the mixtures during the tests.
The PL values of the mixtures prepared with S were higher than those of the other mixtures owing to their high initial humidity (82.2%). The ease of water retention observed in S may increase the temperature of the system during drying, causing internal stresses and greater volumetric shrinkage of ceramic bodies.
Dry mass portions of 8 ± 5 g of each mixture and the reference soils (C1 and C2) were used, and an amount of water equal to 50 ± 5% of PL was added. The mixtures were manually homogenized. The 60 × 20 × 5 mm prismatic specimens were pressed with a force of 20 MPa. After molding, the specimens were air dried for 24 h and then placed in an oven at 105 ± 5 °C for 24 h.
The specimens were calcined at 950 °C in a muffle furnace at a heating rate of 10 °C/min. The maximum temperature was maintained for 1 h, followed by cooling to room temperature. Density, linear shrinkage, water absorption, and flexural strength tests were conducted after calcination (ABNT, 2017, 2009). X-ray diffraction tests were conducted to determine the mineralogical composition of the samples (D2 PHASER – Bruker) and scanning electron microscopy (SEM) was performed on the fracture surface of the specimens using a JEOL model JSM 6460 scanning microscope.
3. Results and Discussion
3.1. Mineralogical Properties
During calcination, phases are formed that influence the properties of ceramic bodies, increasing their density and strength.
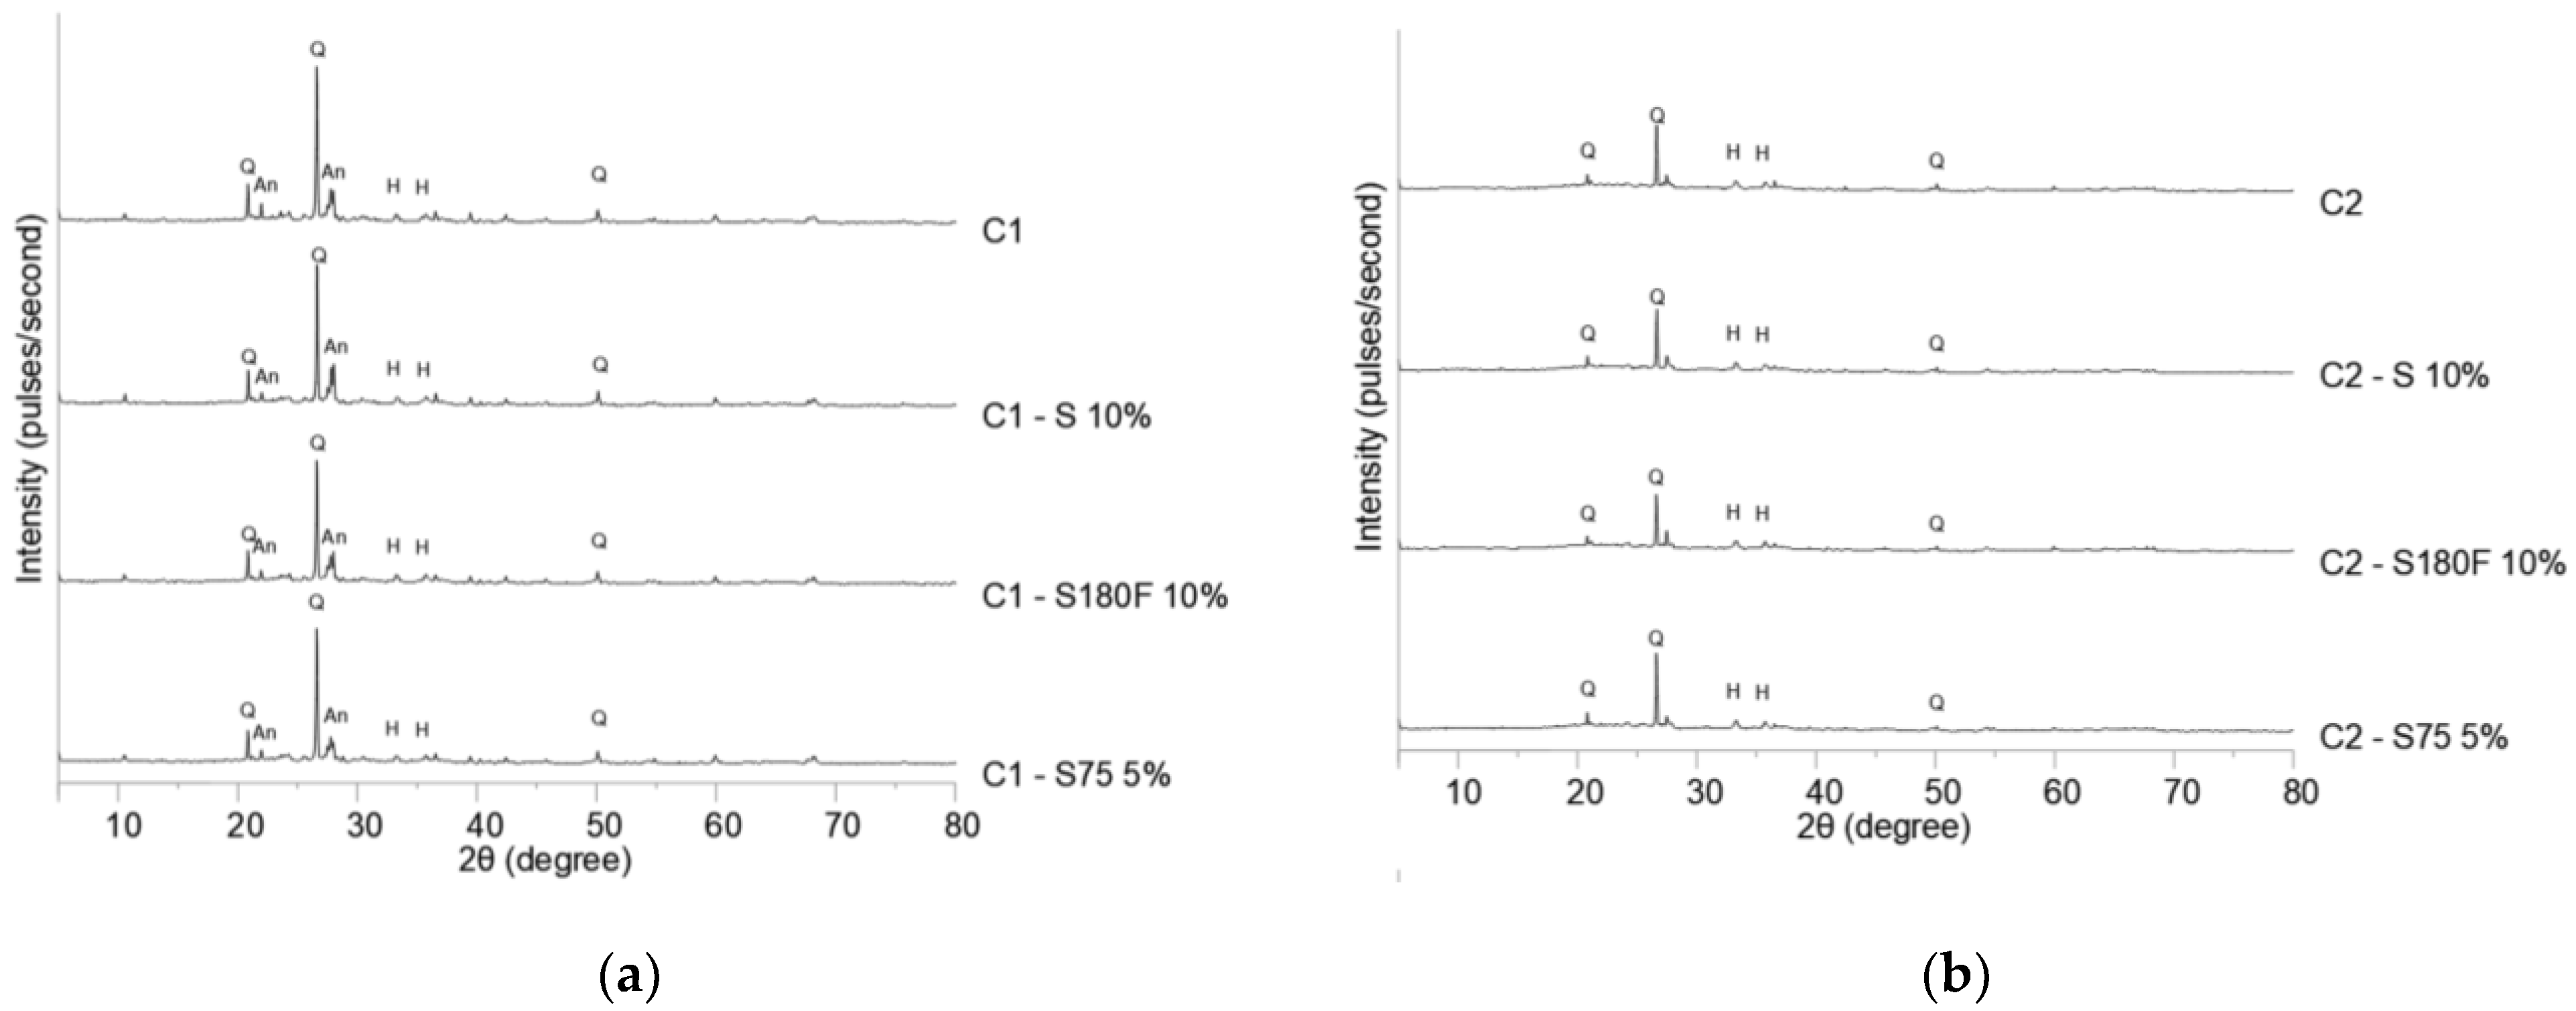
Figure 6 shows the diffractograms of the calcined mixture of specimens. In view of the substantial number of mixtures and percentages, those that could show the effects of DWTS granulometry and calcination were chosen.
Replacing soil with DWTS did not cause significant changes in mineralogy, forming the same phases in mixtures with or without DWTS. The mixtures produced with C1 (
Figure 5a) showed peaks of quartz, anorthite, and hematite. The diffraction peaks observed in the C1–S 10% sample were more prominent than those in the other samples. This might be related to an increase in the temperature of the system owing to the high content of organics and higher humidity of the mixture [51,52]. The diffractograms of the samples produced with C2 showed peaks of quartz and hematite because kaolinite and mica were consumed with increasing temperature (480 °C and 850-940 °C, respectively). Notably, the diffraction peaks of the C2–S180F 10% sample were less evident than those of the others, suggesting that the calcination of DWTS hindered the glass phase formation process. Nevertheless, the low intensity of the peaks indicated low crystallinity of the sample.
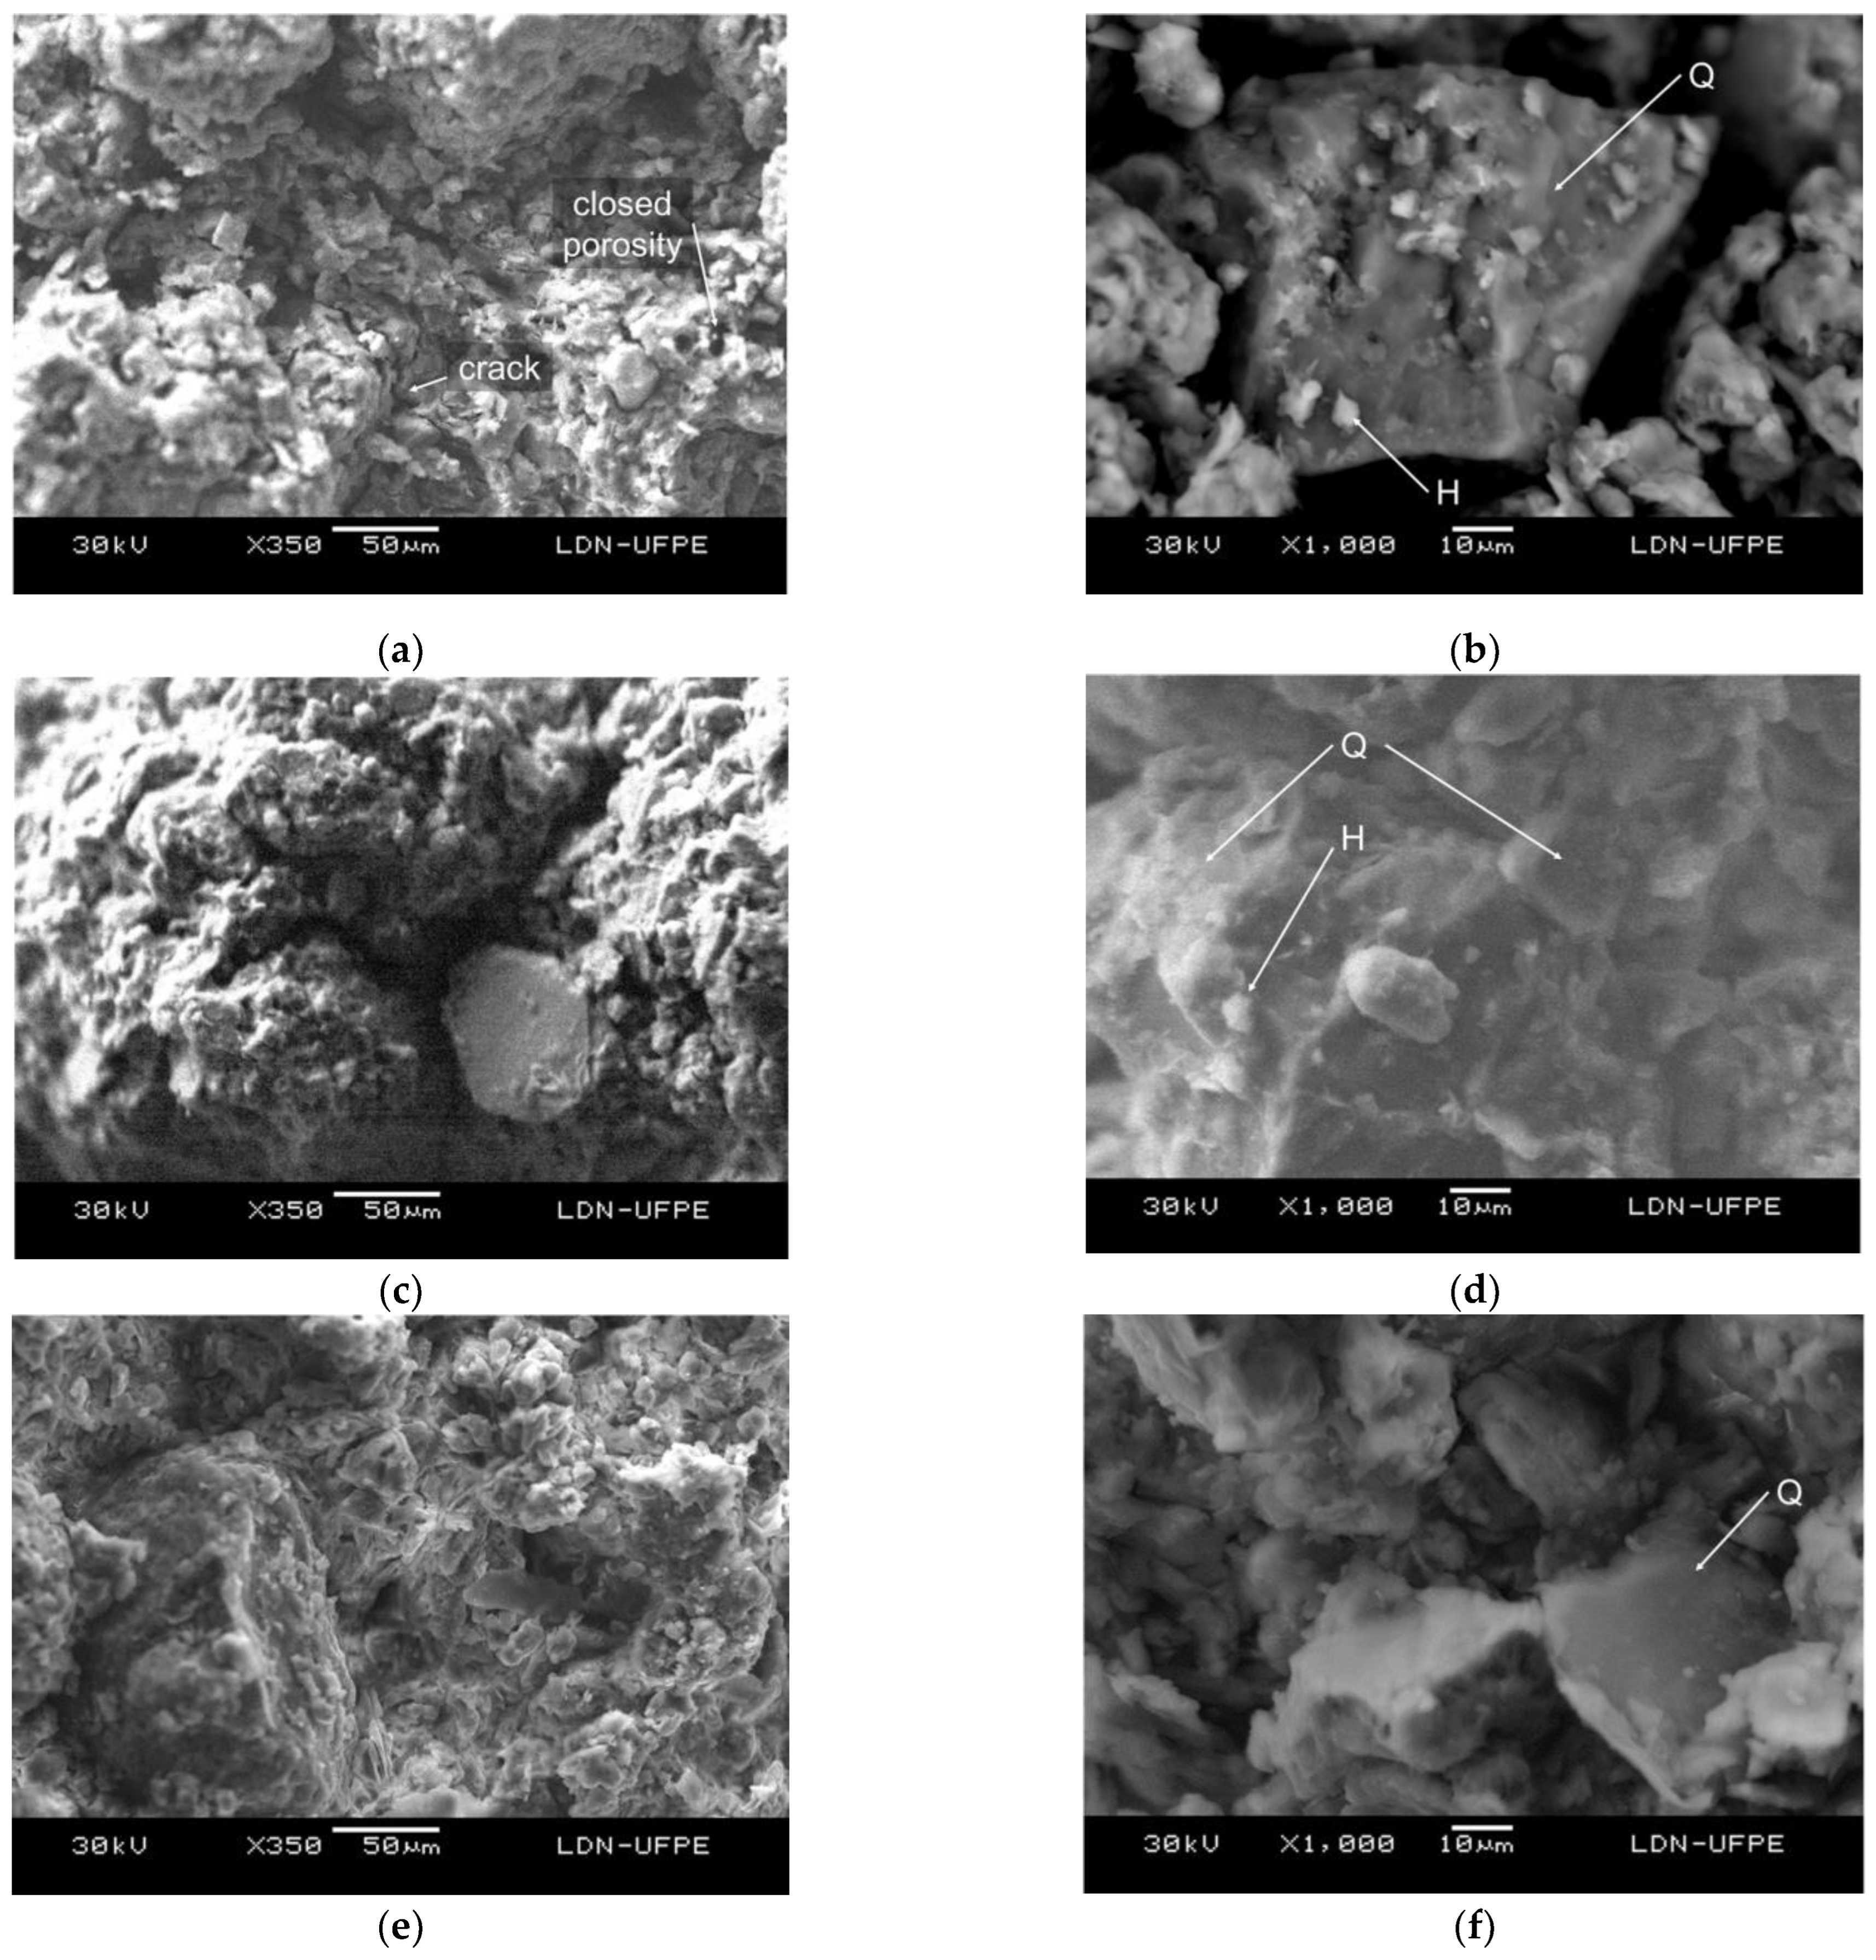
The SEM images showed the granular appearance of the specimens (
Figure 7).
Figure 7 (a) shows a micrograph of sample C1, showing the cracks and pore formation resulting from the elimination of soil organics.
Figure 7 (b) shows quartz crystals with a trigonal structure covered with hematite. The displaced crystals indicate the fragility of the structure owing to the low cohesion of the minerals and high open porosity. The micrograph of sample C1–S 10% (
Figure 7 c, d) shows the low interaction between the quartz grains and the ceramic structure that, however, is better than that in sample C1–S75 10% because of the temperature increase in the system, as previously described in 3.1. The close-up image shows that the structures of samples C1 (
Figure 7 b) and C1–S 10% (
Figure 7 d) are similar; however, sample C1–S 10% has more cohesion between its particles.
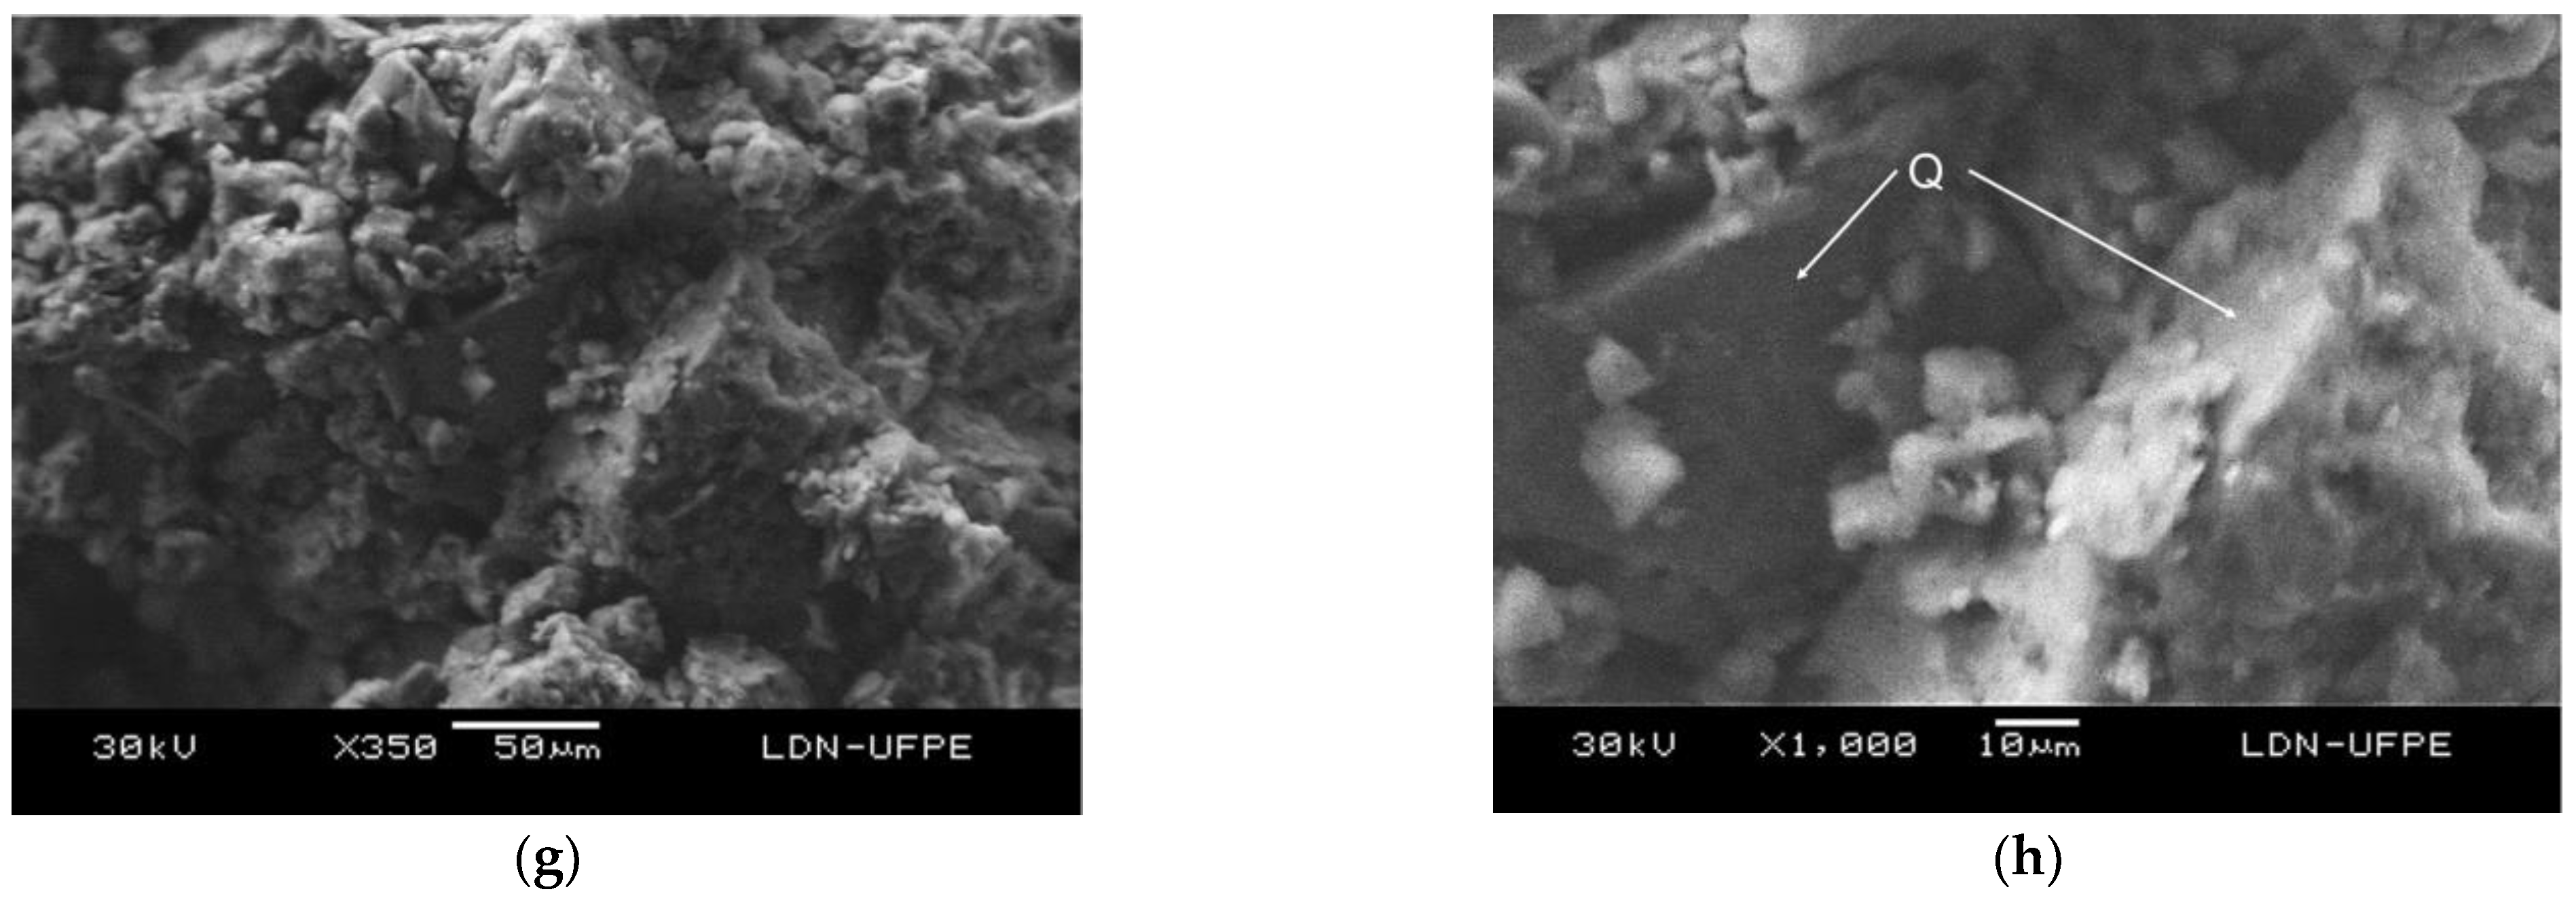
The micrograph of sample C2 shows granulation, indicating poor sintering. There was a high closed porosity resulting from the elimination of organics and kaolinite (
Figure 7e). Similarly, the micrograph of sample C2–S180F 20% shows poorly cohesive grains and low crystallization, causing the appearance of an open porosity owing to little contact between the grains. The elimination of organics did not result, visually, in a reduction in the porosity. The presence of quartz minerals observed in the close-up images confirms the low affinity of this mineral to the ceramic structure (
Figure 7 f, h) [15].
3.2. Physical and Mechanical Properties
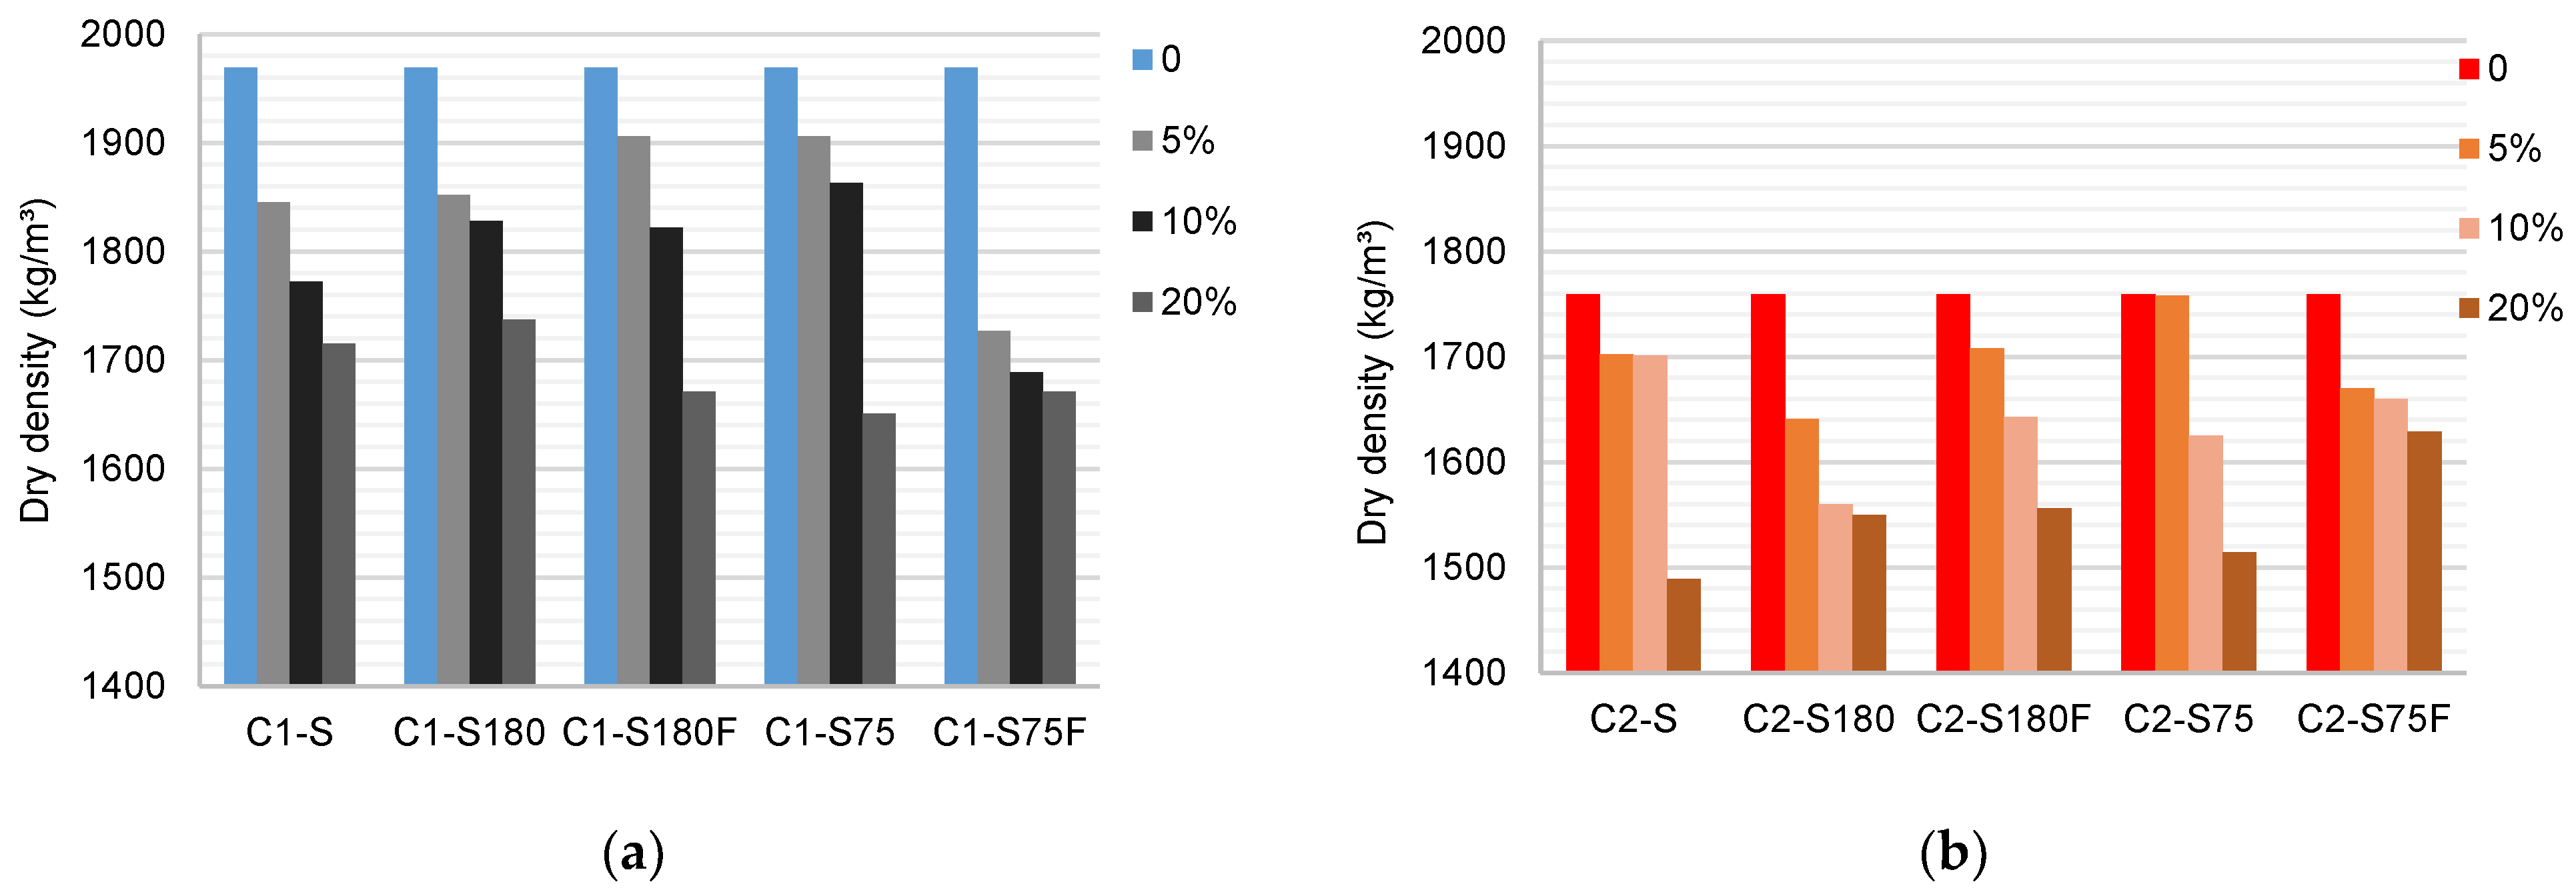
The results of the dry density tests are shown in
Figure 8. The density of the reference specimen C1 was 1969 kg/m³. This value reduces with the replacement of C1 by the DWTS in any improvement method. The experiments showed that samples with smaller grains (C1–S75) had a higher density than those with larger grains (C1–S180). The calcination of DWTS reduced the density of specimens produced with S75 by about 9% for 5 and 10% DWTS but had little influence on the density of specimens produced with S180. The lowest densities were observed for C1–S75F 5% (1727 kg/m
3), a reduction of 12% compared to C1. When 20% sludge was used, little interference was observed among the improvement methods. The specimens produced with S also exhibited a reduction in density.
The density of the ceramic bodies produced with C2 was lower than that produced with C1 (1759 kg/m³). Density reduced for all improvement methods and percentages of DWTS used. A comparison of samples S75 and S180 indicated that the reduction in the grain size increased the density when 5 and 10% DWTS was used (7 and 4%, respectively), with minor changes when the percentage was 20%. Calcination of DWTS, in contrast to that observed in C1, increased the density by approximately 4% when comparing the values with and without calcination.
Density tests showed that the presence of the DWTS reduces the density of the specimens. Although the organic matter present in the DWTS contributed to the temperature increase in the system during calcination [53], the addition of organics to the clay mass was associated with progressive mass loss. However, the calcination of the sludge did not positively influence the density increase, suggesting that the DWTS grain size had a greater influence on the density results. The use of S180 increased the sand fraction by reducing silt and clay fractions. The increase in the fraction was a negative factor for C1 and C2 because the contact between the grains was reduced during calcination. The use of 20% DWTS had similar effects on all processing methods, corroborating the influence of particle size composition and the variation in chemical and mineralogical composition to reduce the density of the specimens.
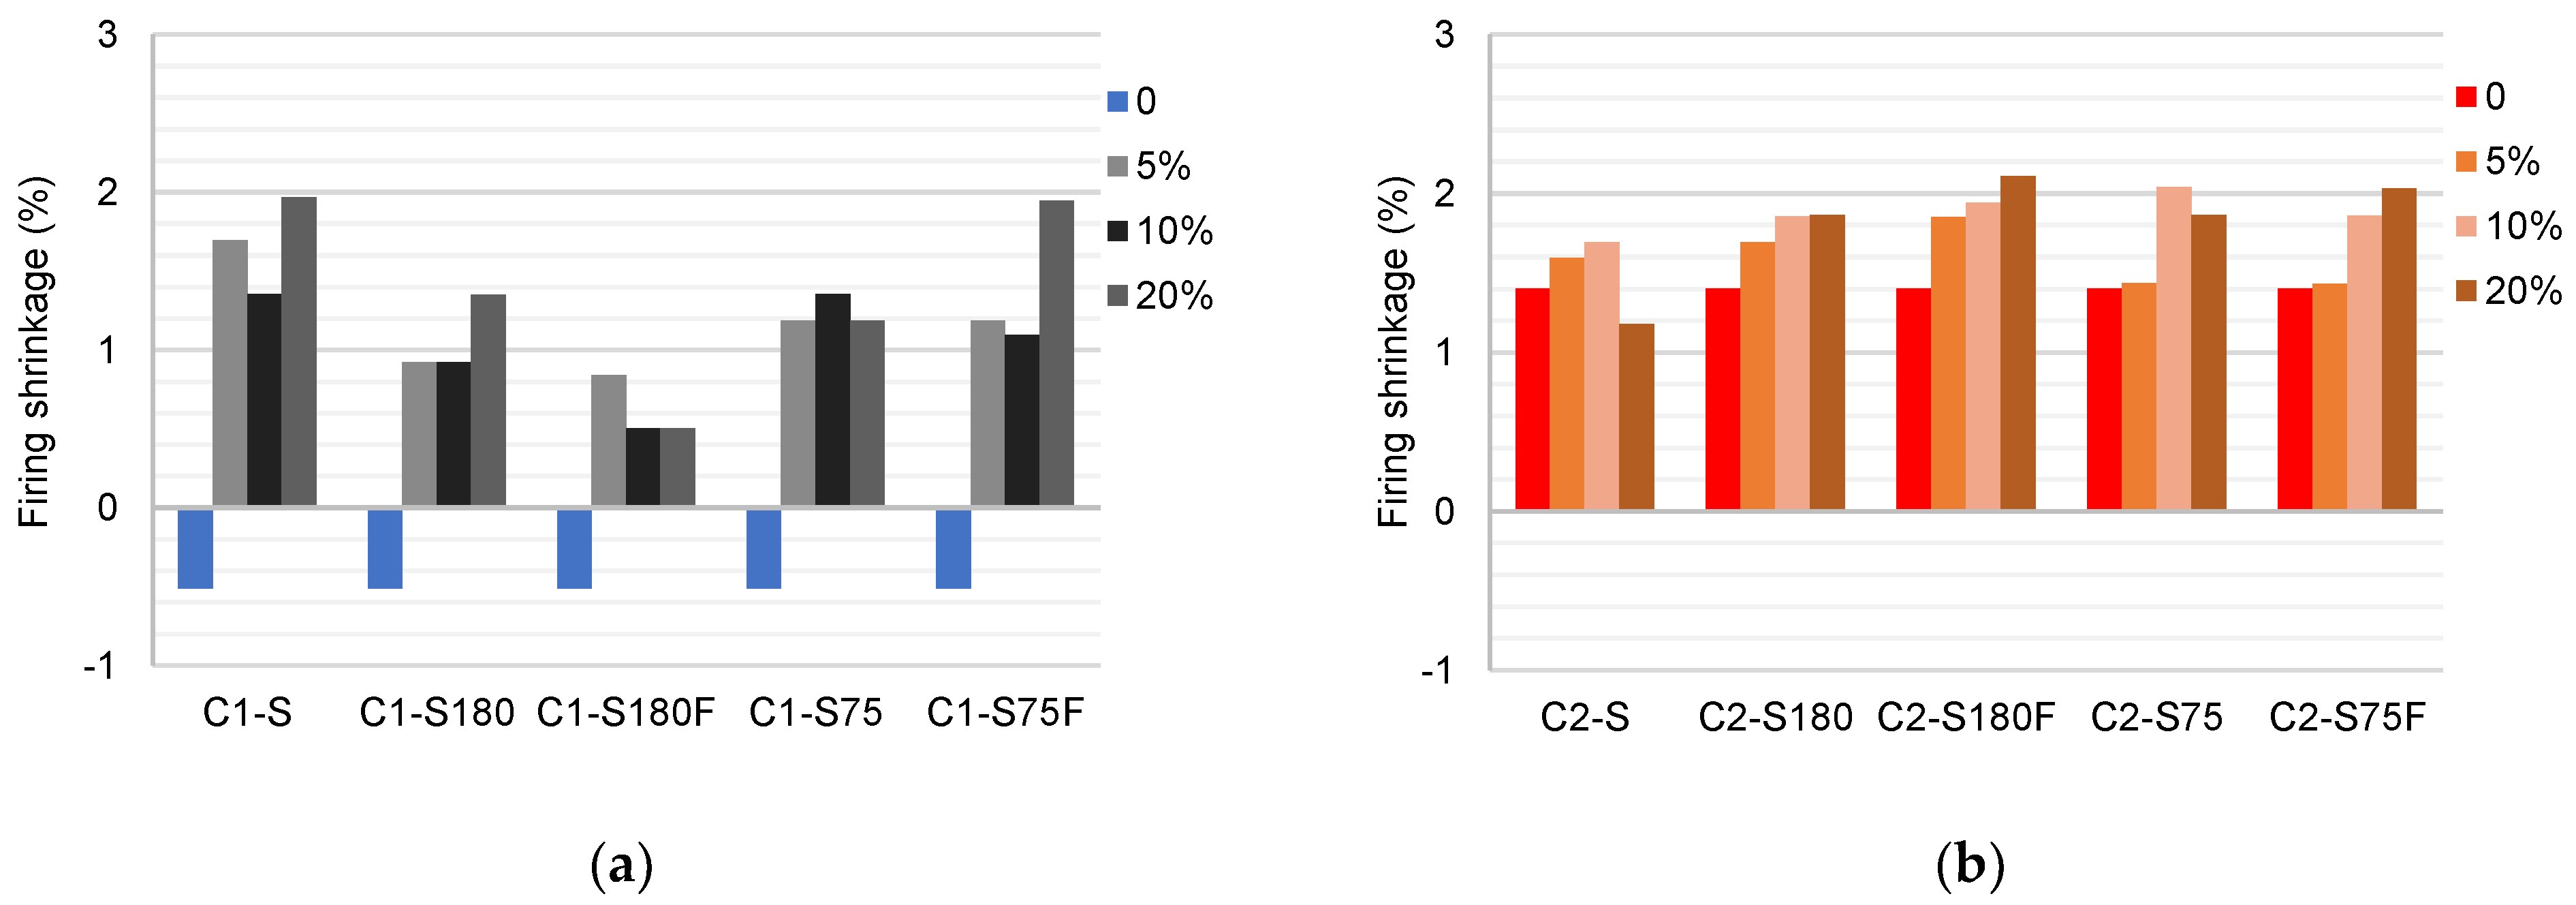
The results of the linear shrinkage tests after calcination are shown in
Figure 9. Sample C1 expanded by about 0.5% after calcination. The addition of DWTS to the mixtures increased the shrinkage. The highest values were obtained from the specimens produced with S and were related to the high organic content of the raw DWTS. A comparison of the results of C1–S75 and C1–S180 indicated an increase in shrinkage with a reduction in the grain size. Sample C1–S75 exhibited a shrinkage of about 50% higher than that of C1–S180 with 10% DWTS. This behavior was associated with the greater interaction of the particles when a DWTS with a smaller grain size was used [22]. The calcination of DWTS reduced shrinkage in the samples produced with 5, 10, and 20% of S180 mixed with C1. Lower shrinkage percentages suggested less liquid-phase formation during calcination [54].
The shrinkage after calcination observed in C2 was higher than that in C1 (1.4%). This value might be related to the presence of kaolinitic minerals in C2 that expand at elevated temperatures [43]. DWTS increased the shrinkage of the specimens, with few differences between the processing methods.
The linear shrinkage results after calcination showed that the presence of DWTS increased the shrinkage of the samples, and this was related to the organic content of DWTS, particle size, and mineralogical composition of the sludge. Kaolinite in the DWTS contributed to the shrinkage increase, being more influential in C1 than in C2. The calcination of DWTS contributed to the reduction in shrinkage in the ceramic bodies, indicating lower formation of the glassy phase. This observation indicated that, although harmful, the organic matter present in the DWTS contributed to the densification of ceramics and should not be discarded. The effect of S75 on C1 showed that the reduction in the grain size increased the shrinkage values, thus improving the particle size distribution. In C2, the lower relevance of the grain size in the results suggested that the sludge had little influence on the improvement in particle size composition.
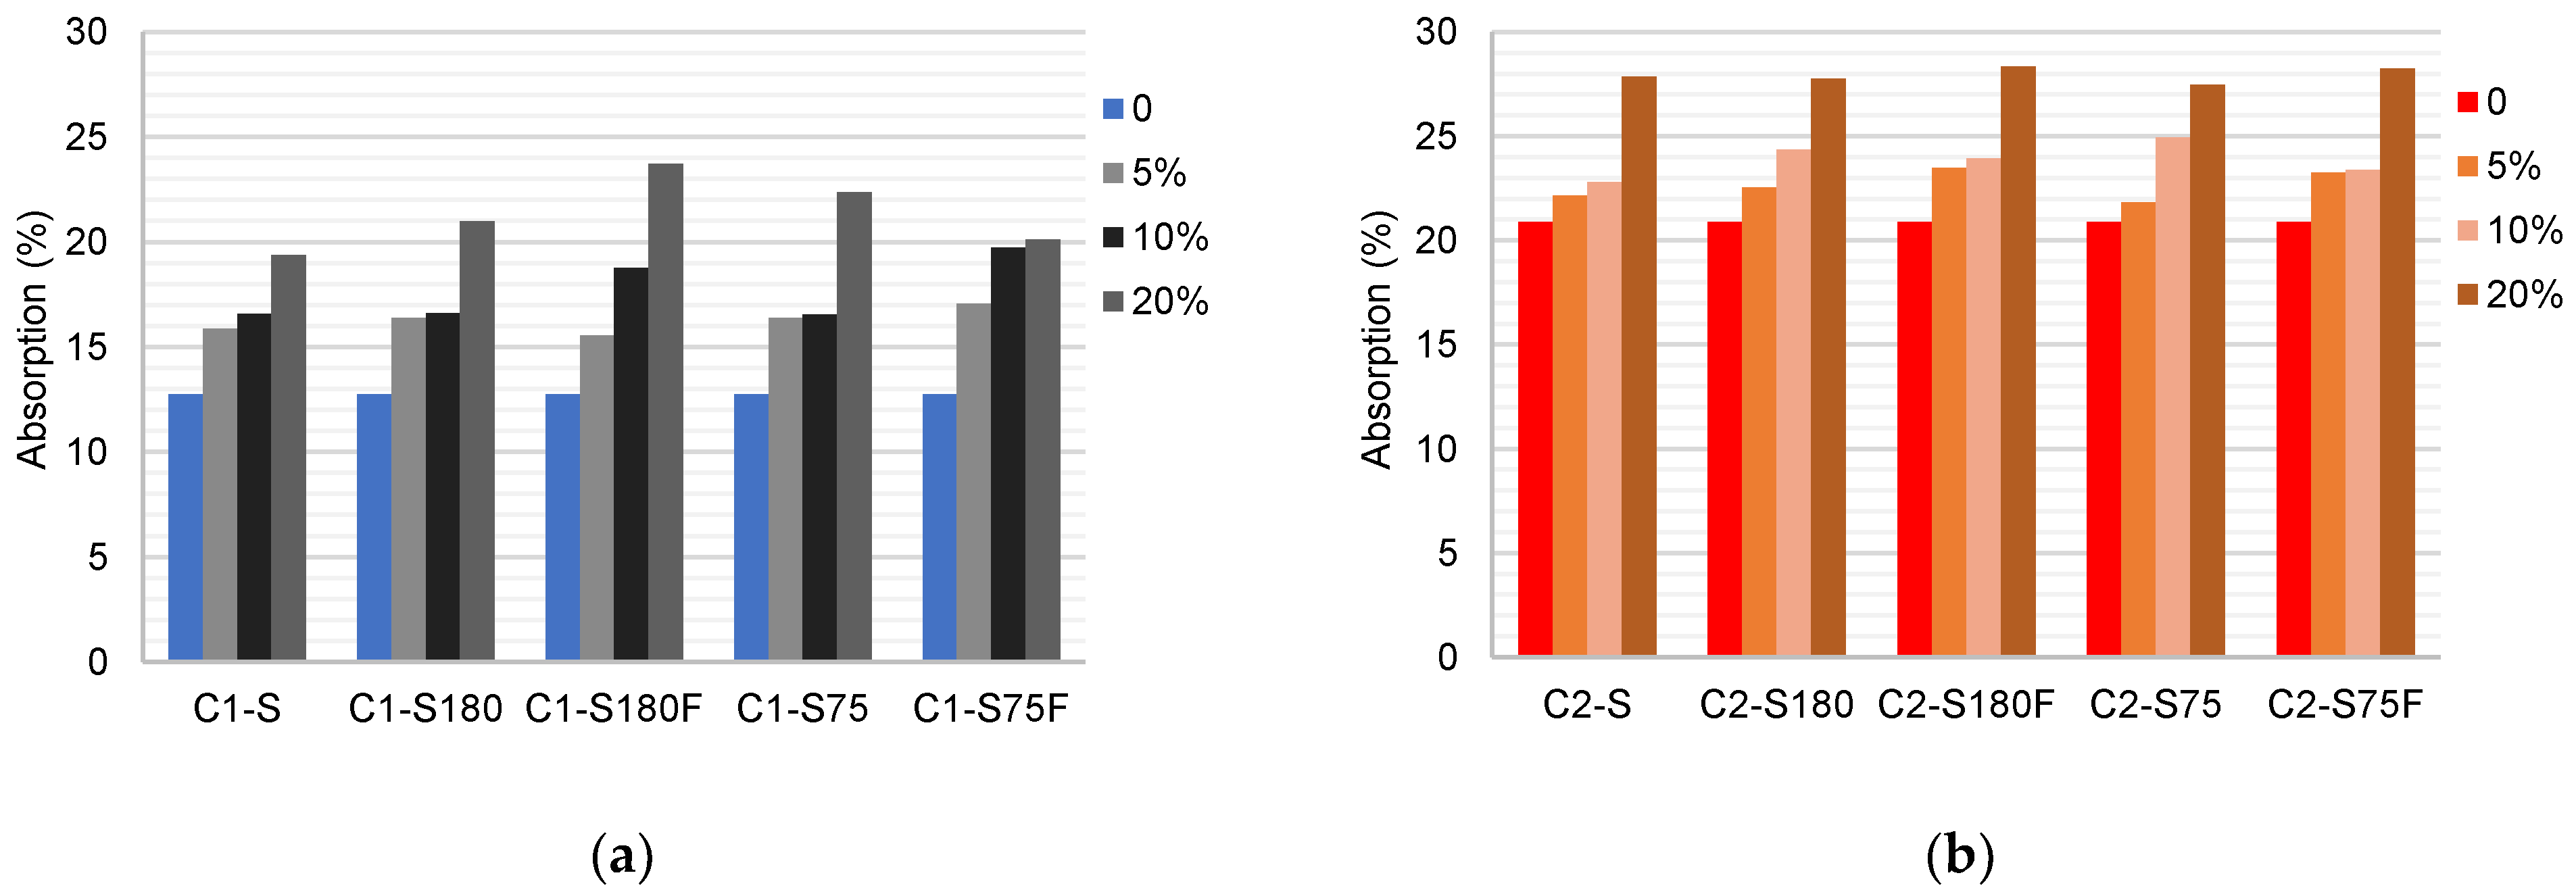
The results of the water absorption tests are in
Figure 10. The water absorption of C1 was 12.75%, reaching 23.71% when replaced with 20% DWTS (S180F). A comparison of the results of C1–S75 and C1–S180 indicated that there was a slight variation in absorption as a function of the change in the particle size. The use of calcined sludge increased absorption when 10% DWTS was used. The tests performed with C2 showed that its water absorption capacity was higher than that of C1. C2 water absorption increased gradually when the soil was replaced with DWTS. There was a minor difference between the results according to variations in processing.
The water absorption results confirmed the observations in the previous tests. The replacement of soil by DWTS increased the absorption of the specimens owing to the increase in porosity and decrease in density. This behavior was expected because of the reduced clay content of the mixtures with DWTS.
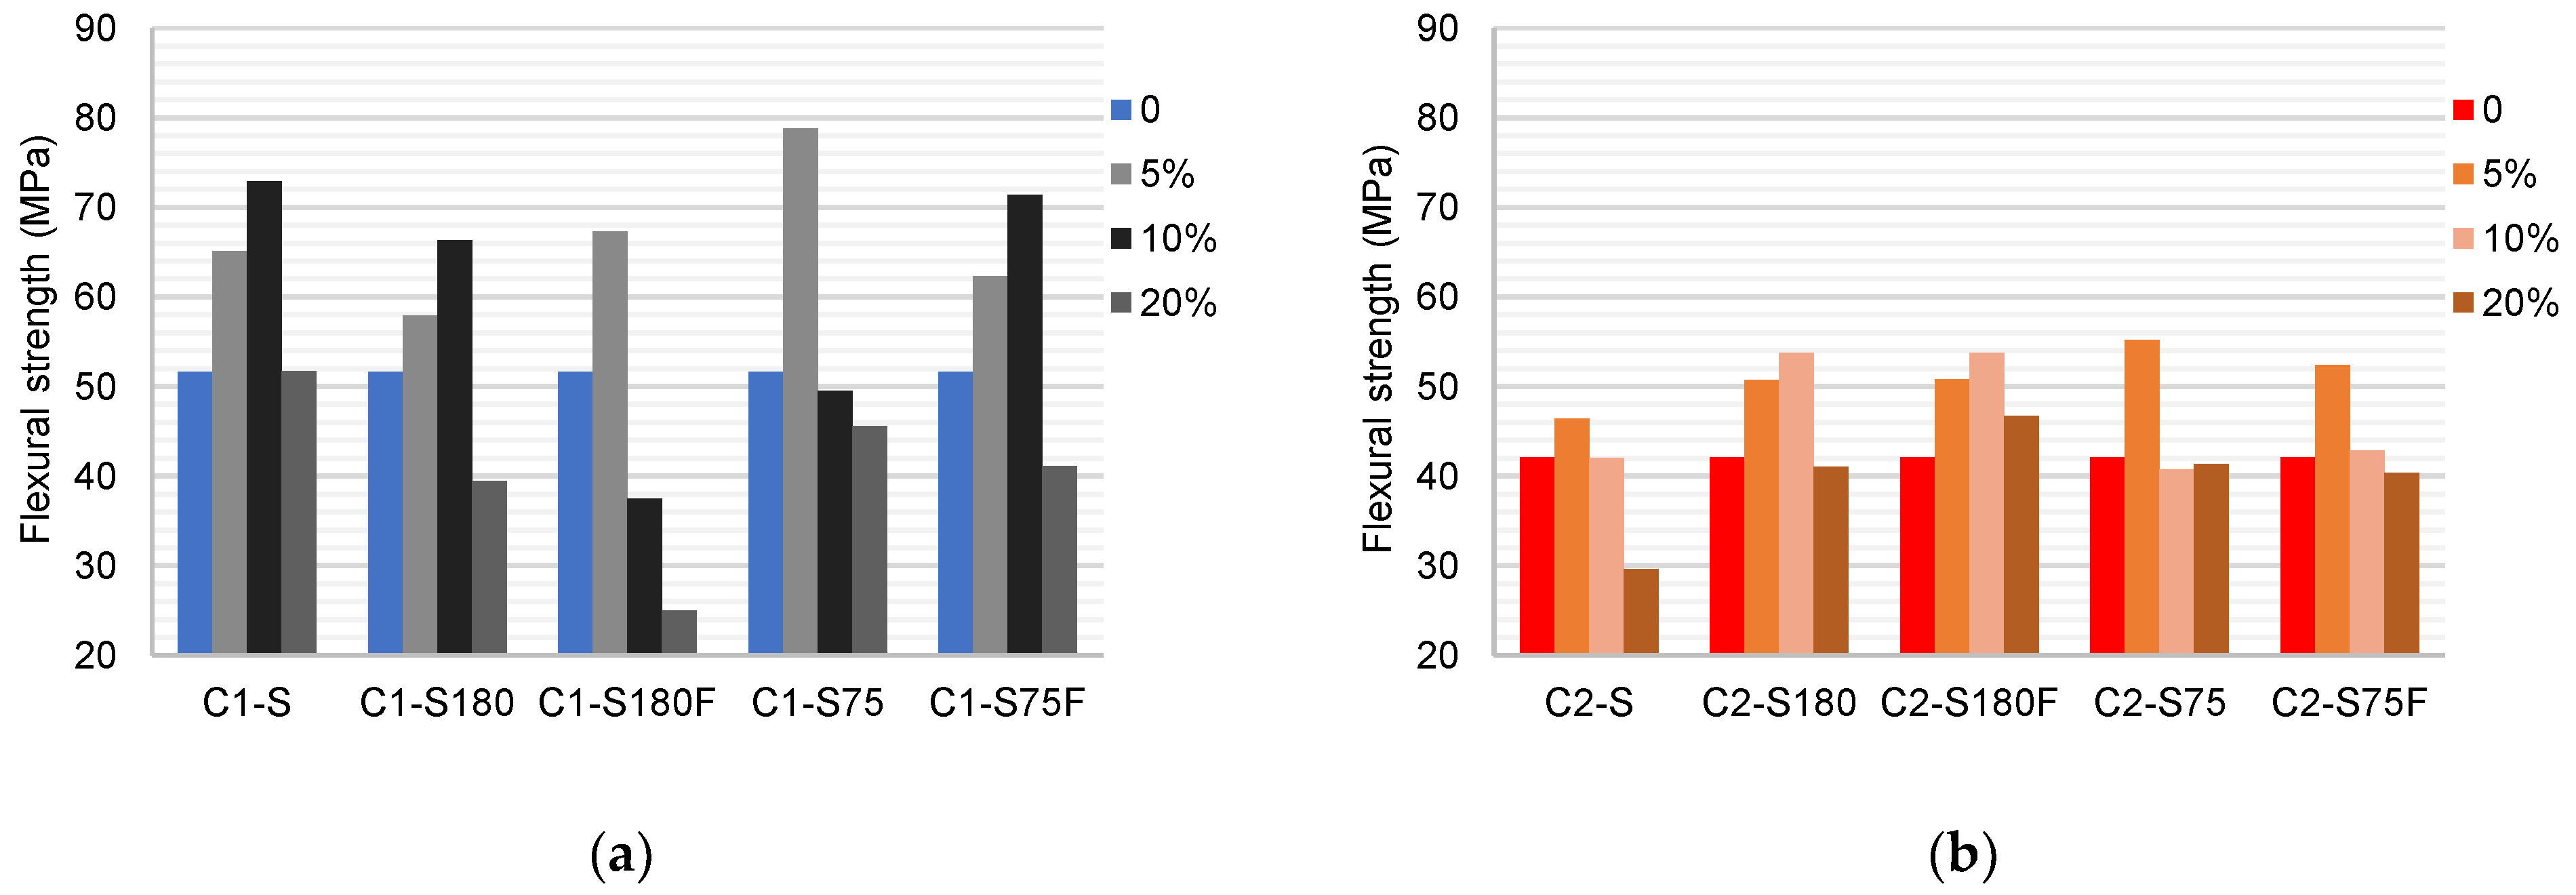
The results of the flexural tensile strength tests are presented in
Figure 11. The flexural strength of the specimens produced with C1 (51.57 MPa) was higher than that with C2 (42.08 MPa). This difference was due to the higher presence of flow agents and the clay fraction of C1. These characteristics provided C1 with greater cohesion between its grains and facilitated the formation of glassy phases during calcination.
Specimens produced with C1 increased in strength when the soil was replaced with DWTS up to 10%. Subsequently, the strength decreased. The use of 5% DWTS showed that the grain size reduction had a positive effect on the strength increase, with values for C1–S75 being about 51% higher than those for C1–S180. This effect was reduced when higher percentages of DWTS were used. The calcination of sludge has different effects depending on the percentage and granulometry used. Calcination reduces the strength of the samples compared with uncalcined samples.
In the specimens produced with C2, an increase of up to 13% was observed (C2–S75 5%). Increasing the percentage of DWTS in the mixtures reduced the strength by up to 13% (C2–S 20%). The grain size reduction had little influence on the specimens, being slightly positive when comparing the results with those of S75 and S180. The calcination of the sludge did not show a linear behavior compared with S75 and S75F but showed a positive influence when comparing the results with S180 and S180F. Notably, the presence of calcined DWTS caused a greater variation in strength than that by the reduction in the grain size in C2.
Despite similar trends, C1 and C2 exhibit properties that may highlight their results. In C1 DWTS increased the strength owing to the increase in fluxing agent content. The reduction in strength with 20% DWTS was due to the reduction in the clay content that reduced the interaction between the particles. Even with the density reduction and increased absorption caused by the DWTS in C2, the increased Fe2O3 content in C2 favored the formation of hematite, a product that influences glass phase formation, resulting in strong conglomerates [55]. This might explain the reason for the increase in porosity caused by DWTS not significantly affecting the strength of the specimens.
4. Conclusions
The evaluation of the method of incorporation of DWTS into clay can be useful in explaining the way it interferes with the quality of ceramic bodies.
The experiment demonstrated that after drying the sludge, grinding to obtain finer granulations, with particles smaller than 200 µm, favored physical interactions through the packing of the grains. The properties of the more clayey soil (C1) improved, contributing to the increase in the mechanical strength. The density values indicated the densification of the ceramic body.
Although the literature indicates that the organic matter present in DWTS is the main cause for the loss of mechanical properties, its elimination did not contribute positively to the improvement in the quality of the ceramic bodies. The elimination of organic material resulted in ceramic bodies with a high water absorption and low density, caused by the reduction in the temperature of the system during calcination compared with that of samples with non-calcined DWTS.
The physical and mechanical properties of the specimens produced with raw sludge (S) were similar to those of the specimens processed with DWTS. The higher shrinkage and lower water absorption indicate a higher densification of the ceramics produced with this sample.
Ceramic specimens with more than 10% DWTS tended to behave similarly, irrespective of the processing method used. This observation indicated that the chemical and mineralogical compositions of the DWTS functioned as the main influencers of the ceramic properties when the slurry content in the mixture increased. The reduction in clay minerals impaired the chemical interactions between grains, affecting the formation of glassy phases during calcination. Comparing the two soils studied, notably, the interference of the percentage of DWTS in the flux agent content of C1 caused a greater variation in its properties compared with the variations caused by the DWTS content in C2.
Thus, the processing of DWTS in the replacement of soils for ceramic production should observe the granulometric composition of the replaced soil, giving preference to the use of smaller grains, up to 10% substitution. A balance must also be sought with respect to the clay content and flux agents such that a slight variation exists in its chemical composition, avoiding significant changes in the ceramics produced with DWTS. Preference should be given to the use of raw sludge, attempting not to dry it completely for ceramic production and avoiding the loss of its colloidal properties. The use of raw sludge reduces energy expenditure by drying and grinding, in addition to facilitating the introduction of this material in the production process.
Acknowledgments
The authors of this paper want to express their gratitude to the Foundation of support to science and technology of the State of Pernambuco—FACEPE for providing financial support.
Conflicts of Interest
The authors declare no conflict of interest.
References
- Fisher F.D. Drinking water treatment plant residuals management: Summary of Residuals Generation, Treatment, and Disposal at Large Community Water Systems. UESPA: Washington DC, U.S, 2011; pp. 1-378.
- George D.B.; Berk S.G.; Adams V.D.; Ting, R.S.; Roberts, R.O.; Parks, L.H.; Lott, R. C. Toxicity of alum sludge extracts to a freshwater alga, protozoan, fish, and marine bacterium. Arch. Environ. Con. Tox. 1995, 29, 149–158. [CrossRef]
- Mortula M.; Bard S.M.; Walsh M.E.; Gagnon G.A.; (2009) Aluminum toxicity and ecological risk assessment of dried alum residual into surface water disposal. Can. J. Civil Eng. 2009, 36, 127–136. [CrossRef]
- Yuan N.; Wang C.; Wendling L.A.; Pei Y. (2017) Ecotoxicological assessment of dewatered drinking water treatment residue for environmental recycling. Environ. Technol. (United Kingdom) 2017, 38, 2241–2252. [CrossRef]
- Xu H.; Pei H.; Jin Y.; Ma; C.;Wang; Y.; Sun; J. High-throughput sequencing reveals microbial communities in drinking water treatment sludge from six geographically distributed plants, including potentially toxic cyanobacteria and pathogens. Sci. Total Environ. 2018, 634, 769–779. [CrossRef]
- ANA, Situation Water Resources Brazil (in Portuguese). 11rd ed; ANA: Brasília, Brazil, 2019; pp. 1-100.
- Fiore F.A., Rodgher S., Ito C.Y.K., Bardini, V.S.S.; Klinsky L.M.G. Quality of surface water and generation of sludge at water treatment plants. Rev. Ambient. Água 2020, 15: e2565. [CrossRef]
- Brazil, Law 14026 of July 15, 2020 (in Portuguese). Brazil: Brasília, Brazil, 2020; Avaliable online: https://www.planalto.gov.br/ccivil_03/_ato2019-2022/2020/lei/l14026.htm (accessed on 7 mar. 2023).
- Katayama V.T.; Montes C.P.; Ferraz T.H.; Morita D.M. Quantification of sludge production from full cycle water treatment plants: A critical analysis (in Portuguese). Eng. Sanit. e Ambient. 2015, 20, 559–569. [CrossRef]
- Godoy L.G.G.; Rohden A.B.; Garcez M.R.; Costa E.B.; Dalt, S.; Andrade, J.J.O. Valorization of water treatment sludge waste by application as supplementary cementitious material. Constr. Build. Mater. 2019, 223, 939–950. [CrossRef]
- Liu Y.; Zhuge Y.; Chow C.W.K.; Li D.; Pham P.N.; Huang J.; Siddique R. Properties and microstructure of concrete blocks incorporating drinking water treatment sludge exposed to early-age carbonation curing. J. Clean. Prod. 2020, 261, 121257. [CrossRef]
- Wang L., Zou F., Fang X., Tsang D.C.W.; Ponn C.S.; Leng Z.; Baek K.A novel type of controlled low strength material derived from alum sludge and green materials. Constr. Build. Mater. 2018, 165, 792–800. [CrossRef]
- Benlalla A.; Elmoussaouiti M.; Dahhou M.; Assafi M. Utilization of water treatment plant sludge in structural ceramics bricks. Appl. Clay Sci. 2015, 118, 171–177. [CrossRef]
- Orlov A.; Belkanova M.; Vatin N. (2020) Structural ceramics modified by water treatment plant sludge. Mater. 2020, 13, 1–11. [CrossRef]
- Teixeira S.R.; De Souza S.A.; De Souza N.R.; Aléssio, P.; Santos, G.T.A. Effect of the addition of sludge from water treatment plants on the properties of structural ceramic material. Ceramica 2006, 52, 215–220. [CrossRef]
- Cremades L.V.V.; Cusidó J.A.A.; Arteaga F. (2018) Recycling of sludge from drinking water treatment as ceramic material for the manufacture of tiles. J. Clean. Prod. 2018, 201, 1071–1080. [CrossRef]
- Torres P.; Hernández D.; Paredes D. Productive use of sludge from a drinking water treatment plant for manufacturing ceramic bricks. Rev. Ing. de Construccion 2012, 27, 145–154. [CrossRef]
- Huang C.H., Wang S.Y. (2013) Application of water treatment sludge in the manufacturing of lightweight aggregate. Constr. Build. Mater. 2013, 43, 174–183. [CrossRef]
- Algamal Y.; Khalil N.M.; Saleem Q.M. (2018) Usage of the sludge from water treatment plant in brick-making industry. J. Chem. Technol. Metall. 2018, 53, 504–510.
- Kizinievič O.; Žurauskiene R.; Kizinievič V.; Žurauskas R. (2013) Utilization of sludge waste from water treatment for ceramic products. Constr. Build. Mater. 2013, 41, 464–473. [CrossRef]
- Oliveira E.A.; Leite J.C. (2018) Use of Clay Sludge Water Treatment Plant Sludge to Produce Ceramic Brick. Int. J. Adv. Eng. Res. Sci. 2013, 5, 281–293. [CrossRef]
- Tantawy M.A.; Mohamed R.S. Middle Eocene clay from Goset Abu Khashier: Geological assessment and utilization with drinking water treatment sludge in brick manufacture. Appl. Clay Sci. 2017, 138, 114–124. [CrossRef]
- Monteiro S.N.; Alexandre J.; Margem J.I. (2008) Incorporation of sludge waste from water treatment plant into red ceramic. Constr. Build. Mater. 2008, 22, 1281–1287. [CrossRef]
- Ackah, L.A.; Guru, R.; Peiravi, M.; Mohanty, M.; Ma, X.; Kumar, S.; Liu, J. Characterization of Southern Illinois Water Treatment Residues for Sustainable Applications. Sustainability 2018, 10, 1374. [CrossRef]
- Tartari R.; Díaz-Mora N.; Módenes A.N.; Pianaro S.A. (2011) Generated sludge at water treatment station Tamanduá, Foz do Iguaçu, PR, as additive in red clay for ceramics: Part I: characterization of sludge and clay Paraná third plateau (in Portuguese) Ceramica 2011, 57,288–293. [CrossRef]
- Elmontassir H.; Zaki K.; Wassate B.; Gouzoli N.; Afdali M.; Karhat Y. Characterization of sludge from the treatment of drinking water and their valuation in the treatment of leachate. Sci. Study Res. Chem. Chem. Eng. Biotechnol. Food Ind. 2019, 20:89–102.
- Pei Ling Y.; Ooi C.H.; Matsumoto A.; Yeoh F.Y. Properties evaluation and fabrication of green clay reformulated from water sludge. Ceram. Int. 2018, 44:1411–1419. [CrossRef]
- Oliveira Andrade J.J.; Silva S.R.; Wenzel M.C.; Rocha, G.H.; Silva, S.R. Performance of rendering mortars containing sludge from water treatment plants as fine recycled aggregate. J. Clean. Prod. 2018, 192, 159–168. [CrossRef]
- Rodríguez H.N.; Martínez-Ramírez S.; Blanco-Varela M.T.; Guillem M.; Puig J.; Larrotcha E.; Flores J. (2011) Evaluation of spray-dried sludge from drinking water treatment plants as a prime material for clinker manufacture. Cement Concrete Comp. 2011, 33, 267–275. [CrossRef]
- Chiang K.Y.; Chien K.L.; Hwang S.J. Study on the characteristics of building bricks produced from reservoir sediment. J. Hazard. Mater. 2008, 159, 499–504. [CrossRef]
- Ahmad T.; Ahmad K.; Alam M. Sludge quantification at water treatment plant and its management scenario. Environ. Monit. Assess. 2008, 89(9), 453. [CrossRef]
- Ling Y.P.; Tham R.H.; Lim S.M.; Fahim M.; Ooi C.; Krishnan P.; Matsumoto A.; Yeoh F. Evaluation and reutilization of water sludge from freshwater processing plant as a green clay substituent. Appl. Clay Sci. 2017, 143, 300–306. [CrossRef]
- Tartari R.; Módenes A.N.; Pianaro S.A.; Díaz-Mora N. Sludge generated in the water treatment plant Tamanduá, Foz do Iguaçu, PR, as an additive in clay for red ceramic: Part II: incorporation of sludge mixed with clay to produce red ceramic (in Portuguese). Ceramica 2011, 57, 387–394. [CrossRef]
- Oliveira E.M.S.; Holanda J.N.F. Influence of the addition of water treatment sludge on the properties and microstructure of red ceramic. Ceramica 2008, 54, 167–173. [CrossRef]
- Teixeira S.R.; Santos G.T.A; Souza A.E.; Alessio P.; Souza S.A.; Souza N.R. The effect of incorporation of a Brazilian water treatment plant sludge on the properties of ceramic materials. Appl. Clay Sci. 2011, 53, 561–565. [CrossRef]
- MME - Ministério de Minas e Energia. Mineral Sector report. Available online: http://www.mme.gov.br/documents/78404/0/BOLETIM+SETOR+MINERAL.pdf/acb1ca8d-b2bd-825c-03e8-939e87f94682 (acessed on 5 Jan. 2021).
- Pinto C.S. (2006) Basic course in soil mechanics in 16 lessons, 3rd ed (in Portuguese); Oficina de Textos: São Paulo, Brazil, 2006; pp 1–368.
- ABNT. NBR 7180: Soil – Plasticity limit determination (in Portuguese); ABNT: Rio de Janeiro, Brazil, 2016; pp 1–3.
- ABNT. NBR 6459: Soil – Liquid limit determination (in Portuguese); ABNT: Rio de Janeiro, Brazil, 2016; pp 1–5.
- ABNT. NBR 7181: Soil – Grain size analysis (in Portuguese); ABNT: Rio de Janeiro, Brazil, 2016; pp 1–12.
- Goel G.; Kalamdhad A.S.; An investigation on use of paper mill sludge in brick manufacturing. Constr. Build. Mater. 2017, 148:334–343. [CrossRef]
- Mymrin V.; Alekseev K.; Fortini O.M.; Catai R.E.; Rissardi, J.L.; Malinetti, A.; Pedroso D.E.; Izzo R.L.S. Water cleaning sludge as principal component of composites to enhance mechanical properties of ecologically clean red ceramics. J. Clean. Prod. 2017, 145, 367–373. [CrossRef]
- Ramirez Zamora R.M.; Ayala F.E.; Garcia L.C.; Moreno A.D.; Schouwenaars R. Optimization of the preparation conditions of ceramic products using drinking water treatment sludges. J. Environ. Sci. Health - Toxic/Hazard. Subst. Environ. Eng. 2008 43, 1562–1568. [CrossRef]
- Pinheiro R.M.; Vieira C.M.F.; Rodriguez R.S.; Monteiro S.N. Recycling of waste from the paper production into red ceramic (in Portuguese). Rev. Mater. 2008, 13, 220–227. [CrossRef]
- Malaiskiene J.; MacIulaitis R.; Kicaite A. Dependence of ceramics physical-mechanical properties on chemical and mineralogical composition. Constr. Build. Mater. 2011, 25, 3168–3174. [CrossRef]
- Muñoz Velasco P.; Morales Ortíz M.P.; Letelier V.; Mendívil Giró M.A. Fired clay bricks made by adding wastes assessment of the impact on physical, mechanical and thermal properties. Constr. Build. Mater. 2016, 125, 241–252. [CrossRef]
- Vieira C.M.; Margem J.I.; Monteiro S.N. (2008) Microstructural changes of clayey ceramic incorporated with filter sludge from water treatment plant. Rev. Mater. 2008, 13, 275–281.
- Kizinievič O.; Kizinievič V.; Boris R.; Boris R.; Girskas G.; Malaiškienė J. Eco-efficient recycling of drinking water treatment sludge and glass waste: development of ceramic bricks. J. Mater. Cycles Waste Manag. 2017, 20:1228–1238. [CrossRef]
- Wolff E.; Schwabe W.K.; Conceição S.V. Utilization of water treatment plant sludge in structural ceramics. J. Clean. Prod. 2015, 96, 282–289. [CrossRef]
- Santos P.S. Tecnologia de Argilas, aplicada às argilas brasileiras, 2nd ed (in Portuguese); Edgard Blucher: São Paulo, Brazil, 1989; pp. 1–408.
- da Silva Nascimento J.J.; Luna C.B.B.; Costa R.F.; Barbieri L.F.P.; Bezerra E.W.O. Evaluation of red clay and ball clay drying using transient three-dimensional mathematical modeling: volumetric shrinkage and moisture content. Mater. Res. Express 2019, 6, 095206. [CrossRef]
- Vieira S.C.; Ramos A.S.; Vieira M.T. Mullitization kinetics from silica- and alumina-rich wastes. Ceram. Int. 2007, 33, 59–66. [CrossRef]
- Ukwatta A.; Mohajerani A.; Setunge S.; Eshtiaghi N. Possible use of biosolids in fired-clay bricks. Constr. Build. Mater. 2015, 91, 86–93. [CrossRef]
- Eliche-Quesada D.; Azevedo-Da Cunha R.; Corpas-Iglesias F.A. Effect of sludge from oil refining industry or sludge from pomace oil extraction industry addition to clay ceramics. Appl. Clay Sci. 2015, 114, 202–211. [CrossRef]
- Yatsenko N.D.; Yatsenko E.A.; Zakarlyuka S.G. Phase composition and properties of building ceramic as a function of the contents of calcium carbonates and iron oxides. Glass Ceram+ 2017, 73, 319–322. [CrossRef]
Figure 1.
DWTS calcination loss (%).
Figure 1.
DWTS calcination loss (%).
Figure 2.
DWTS maximum grain size (mm).
Figure 2.
DWTS maximum grain size (mm).
Figure 3.
Diffraction patterns of raw materials. Legend: A, Albite; An, Anorthite; H, Hematite; K, Kaolinite; Mu, Muscovite; P, Pargasite; Q, Quartz.
Figure 3.
Diffraction patterns of raw materials. Legend: A, Albite; An, Anorthite; H, Hematite; K, Kaolinite; Mu, Muscovite; P, Pargasite; Q, Quartz.
Figure 4.
Preparation of the formulated mixtures.
Figure 4.
Preparation of the formulated mixtures.
Figure 5.
Plasticity limits of formulated mixtures: (a) C1 mixtures; (b) C2 mixtures.
Figure 5.
Plasticity limits of formulated mixtures: (a) C1 mixtures; (b) C2 mixtures.
Figure 6.
Diffraction pattern of calcinated samples: (a) C1 samples; (b) C2 samples. Legend: An, anorthite; H, hematite; Q, quartz.
Figure 6.
Diffraction pattern of calcinated samples: (a) C1 samples; (b) C2 samples. Legend: An, anorthite; H, hematite; Q, quartz.
Figure 7.
SEM micrographs of the fracture surface of the samples sintered at 950 °C: (a) C1 ×350, (b) C1 ×1000, (c) C1–S 10% ×350, (d) C1–S 10% ×1000, (e) C2 ×350, (f) C2 ×1000, (g) C2–S180F 20% ×350, and (h) C2–S180F 20% ×1000.
Figure 7.
SEM micrographs of the fracture surface of the samples sintered at 950 °C: (a) C1 ×350, (b) C1 ×1000, (c) C1–S 10% ×350, (d) C1–S 10% ×1000, (e) C2 ×350, (f) C2 ×1000, (g) C2–S180F 20% ×350, and (h) C2–S180F 20% ×1000.
Figure 8.
Mean values of the density of the ceramic bodies (kg/m³): (a) C1 samples; (b) C2 samples.
Figure 8.
Mean values of the density of the ceramic bodies (kg/m³): (a) C1 samples; (b) C2 samples.
Figure 9.
Mean values of the linear shrinkage after firing of the ceramic bodies (%): (a) C1 samples; (b) C2 samples.
Figure 9.
Mean values of the linear shrinkage after firing of the ceramic bodies (%): (a) C1 samples; (b) C2 samples.
Figure 10.
Mean values of the water absorption of the ceramic bodies (%): (a) C1 samples; (b) C2 samples.
Figure 10.
Mean values of the water absorption of the ceramic bodies (%): (a) C1 samples; (b) C2 samples.
Figure 11.
Mean values of the flexural strength of the ceramic bodies (MPa): (a) C1 samples; (b) C2 samples.
Figure 11.
Mean values of the flexural strength of the ceramic bodies (MPa): (a) C1 samples; (b) C2 samples.
Table 1.
Raw materials properties.
Table 1.
Raw materials properties.
| Test/Properties |
C1 |
C2 |
DWTS |
| Specific gravity (kg/m³) |
2650 |
2660 |
2650 |
| Liquid limit (LL) (%) |
39.65 |
47.14 |
- |
| Plastic limit (PL) (%) |
20.89 |
32.53 |
- |
| Plasticity index (PI) (%) |
18.76 |
14.61 |
- |
| Gravel content (2.0–6.0 mm) (%) |
0.05 |
2.24 |
- |
| Sand content (2.0–0.06 mm) (%) |
22.9 |
43.83 |
12.41 |
| Silt content (0.06–0.002 mm) (%) |
16.07 |
10.09 |
87.16 |
| Clay content (<0.002 mm) (%) |
60.98 |
43.85 |
0.44 |
Table 2.
Chemical analysis of clay and DWTP sludge (wt.%).
Table 2.
Chemical analysis of clay and DWTP sludge (wt.%).
| Parameter |
SiO2
|
Al2O3
|
Fe2O3
|
Na2O |
MgO |
P2O5
|
SO3
|
K2O |
CaO |
TiO2
|
MnO |
BaO |
Other |
C.L.* |
| C1 |
54.02 |
21.82 |
7.02 |
0.96 |
2.09 |
0.23 |
0.1 |
2.81 |
2.42 |
0.98 |
0.12 |
0.12 |
0.16 |
7.15 |
| C2 |
44.61 |
30.13 |
9.33 |
0.27 |
0.82 |
0.07 |
0.05 |
1.28 |
0.5 |
1.04 |
- |
0.07 |
0.1 |
11.73 |
| DWTS |
28.33 |
29.6 |
13.6 |
0.02 |
0.08 |
0.3 |
0.55 |
0.19 |
0.14 |
0.6 |
- |
- |
0.08 |
26.51 |
Table 3.
Composition of soil and DWTS mixtures.
Table 3.
Composition of soil and DWTS mixtures.
| Mixture |
Materials (wt. %) |
| |
C1 |
C2 |
S180 |
S180F |
S75 |
S75F |
S |
| C1 |
100 |
– |
– |
– |
– |
– |
– |
| C1–S |
95–80 |
– |
– |
– |
– |
– |
5–20 |
| C1–S180 |
95–80 |
– |
5–20 |
– |
– |
– |
– |
| C1–S180F |
95–80 |
– |
– |
5–20 |
– |
– |
– |
| C1–S75 |
95–80 |
– |
– |
– |
5–20 |
– |
– |
| C1–S75F |
95–80 |
– |
– |
– |
– |
5–20 |
– |
| C2 |
– |
100 |
– |
– |
– |
– |
– |
| C2–S |
– |
95–80 |
– |
– |
– |
– |
5–20 |
| C2–S180 |
– |
95–80 |
5–20 |
– |
– |
– |
– |
| C2–S180F |
– |
95–80 |
– |
5–20 |
– |
– |
– |
| C2–S75 |
– |
95– 80 |
– |
– |
5–20 |
– |
– |
| C2–S75F |
– |
95–80 |
– |
– |
– |
5–20 |
– |
|
Disclaimer/Publisher’s Note: The statements, opinions and data contained in all publications are solely those of the individual author(s) and contributor(s) and not of MDPI and/or the editor(s). MDPI and/or the editor(s) disclaim responsibility for any injury to people or property resulting from any ideas, methods, instructions or products referred to in the content. |
© 2023 by the authors. Licensee MDPI, Basel, Switzerland. This article is an open access article distributed under the terms and conditions of the Creative Commons Attribution (CC BY) license (http://creativecommons.org/licenses/by/4.0/).
