Submitted:
17 March 2023
Posted:
21 March 2023
You are already at the latest version
Abstract
Keywords:
1. Introduction
2. samples and experiment
2.1. Sample Information
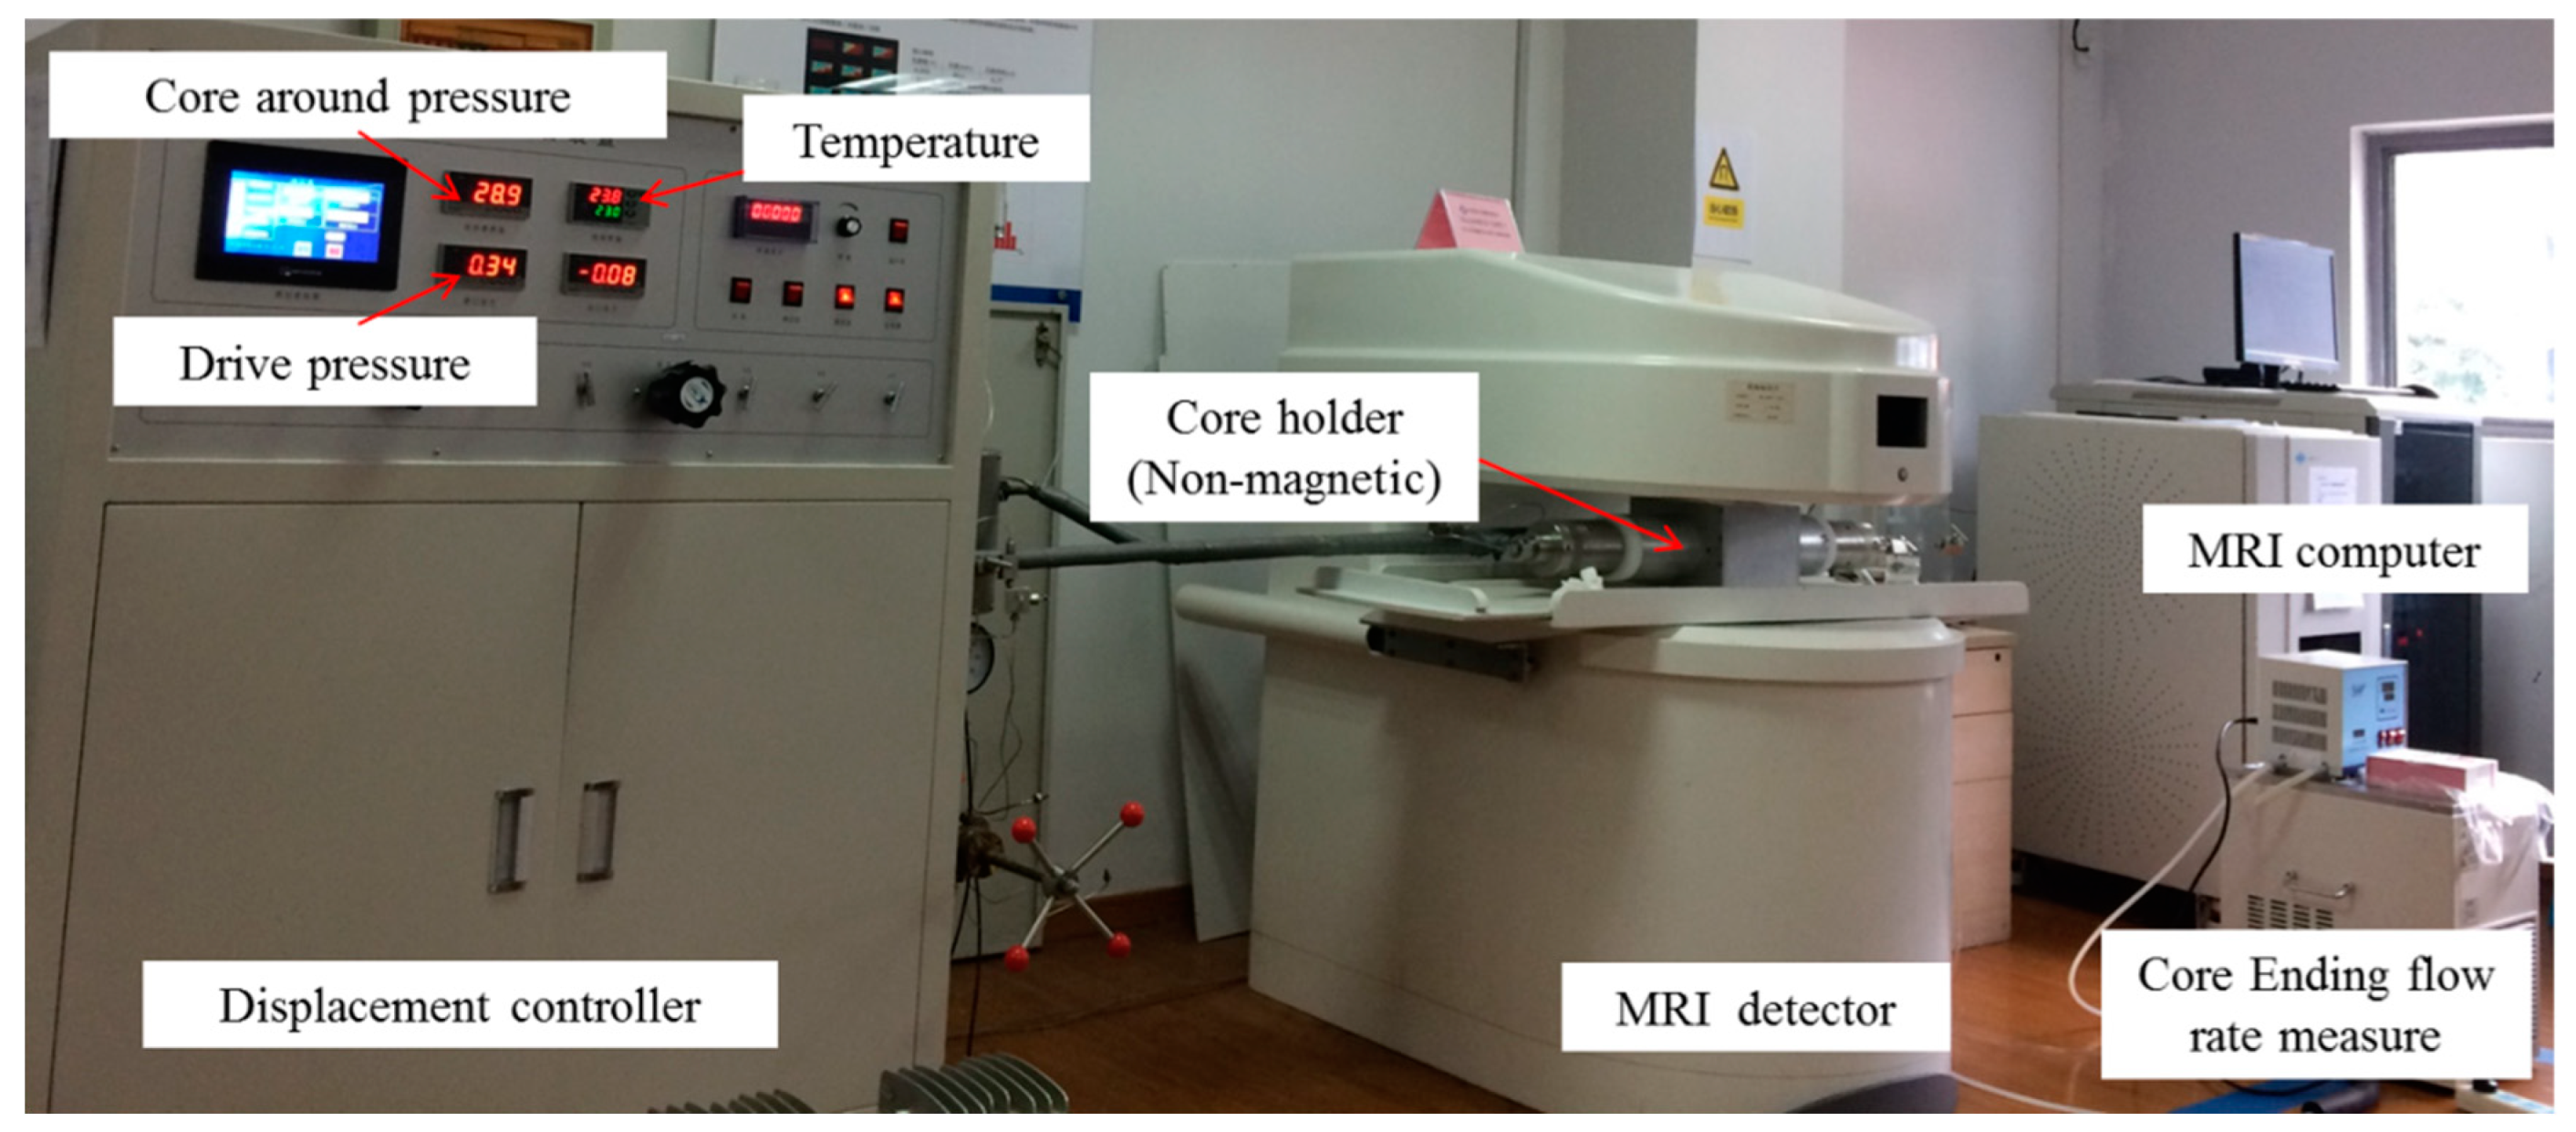
2.2. Experiment
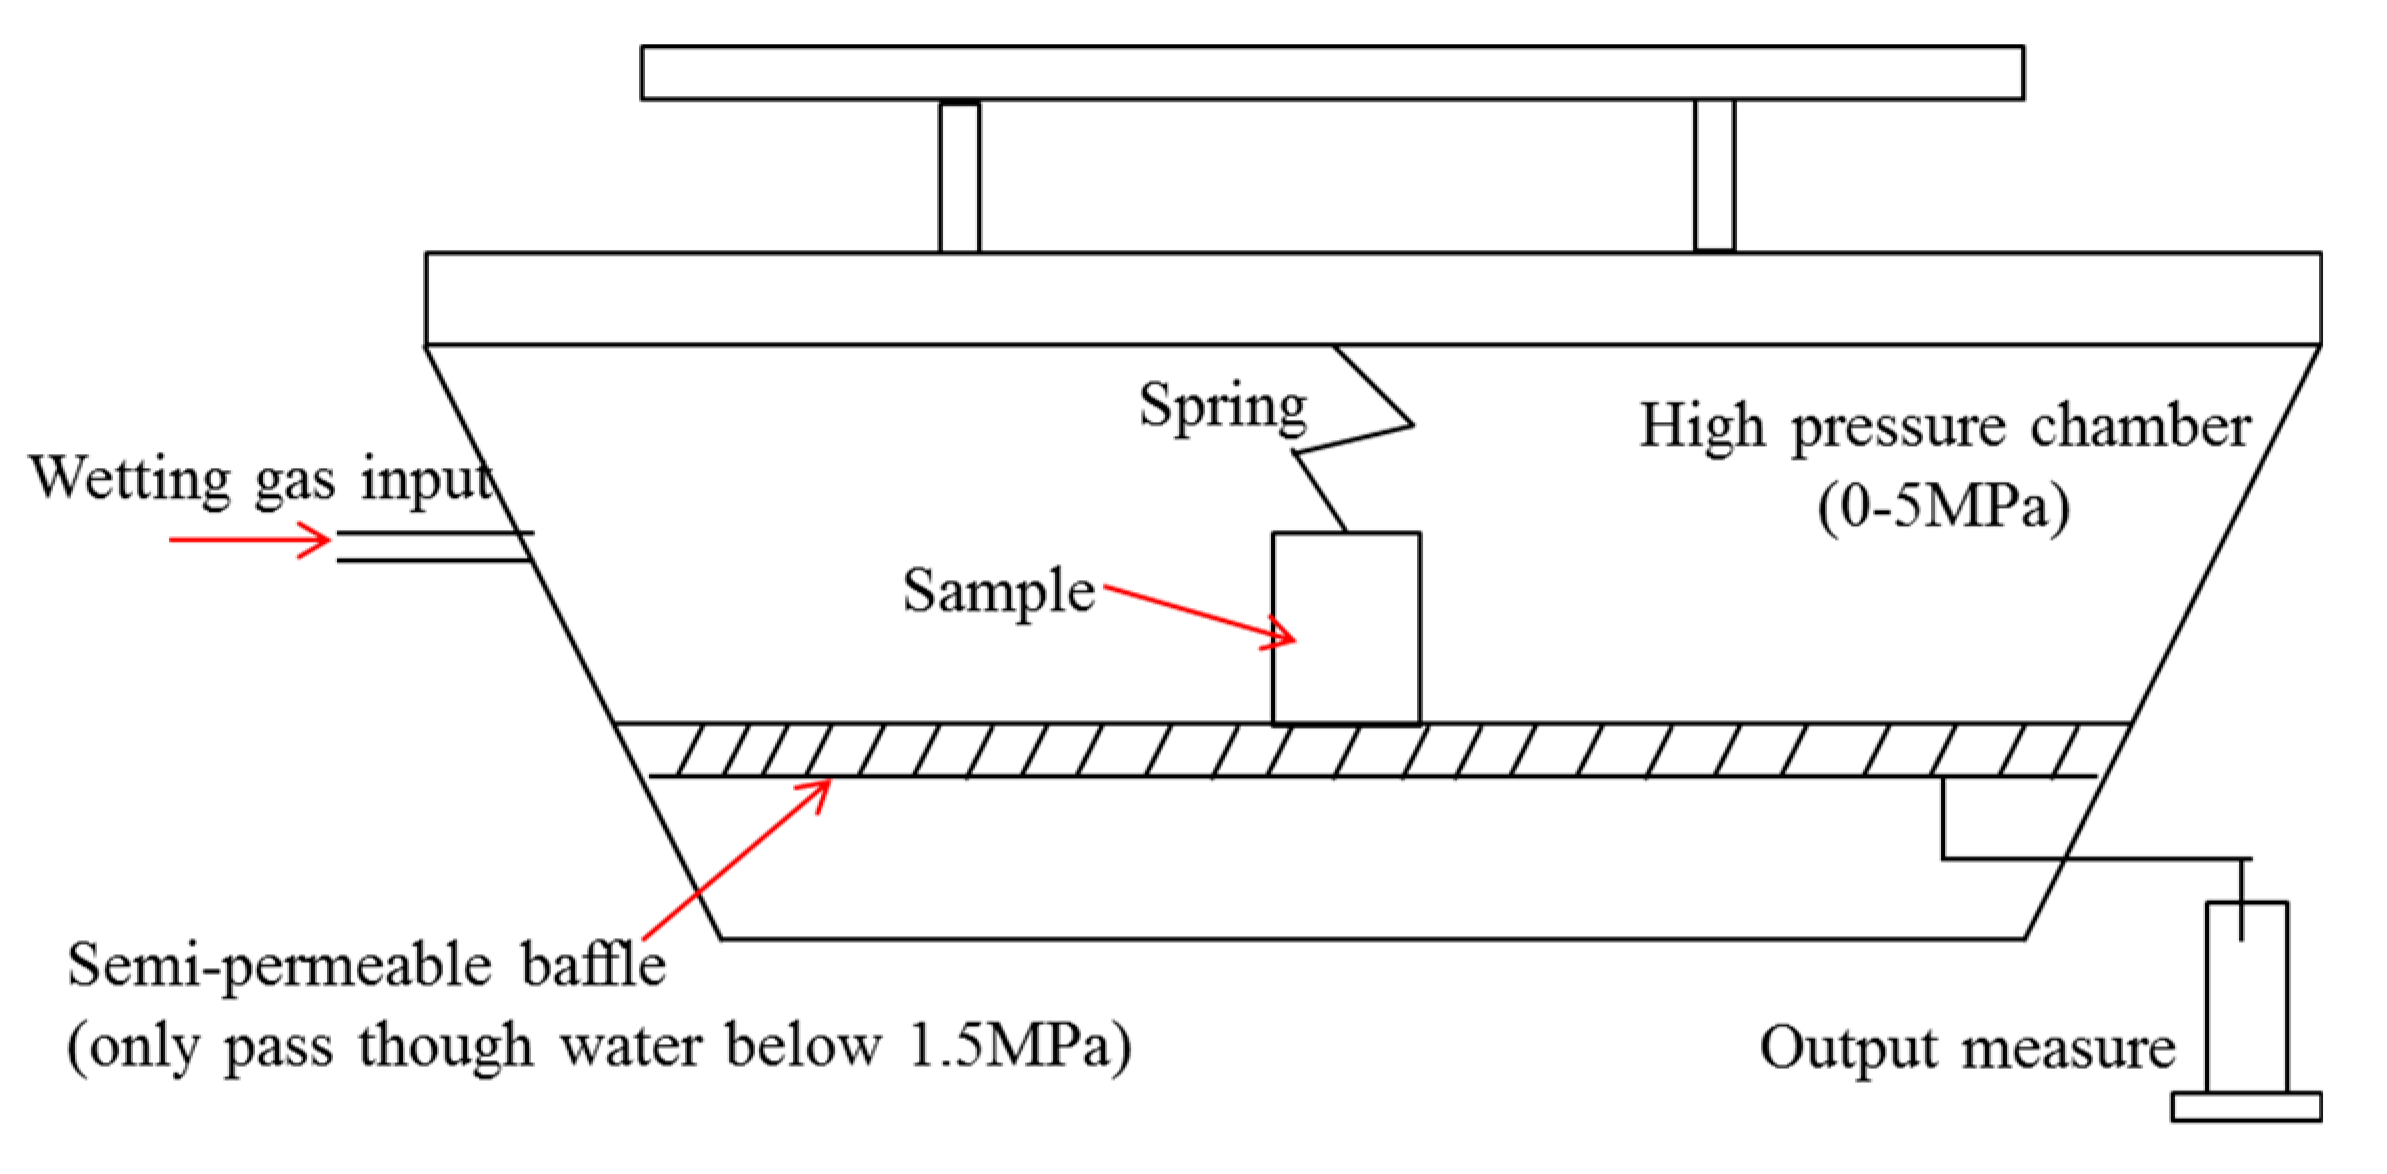
3. result
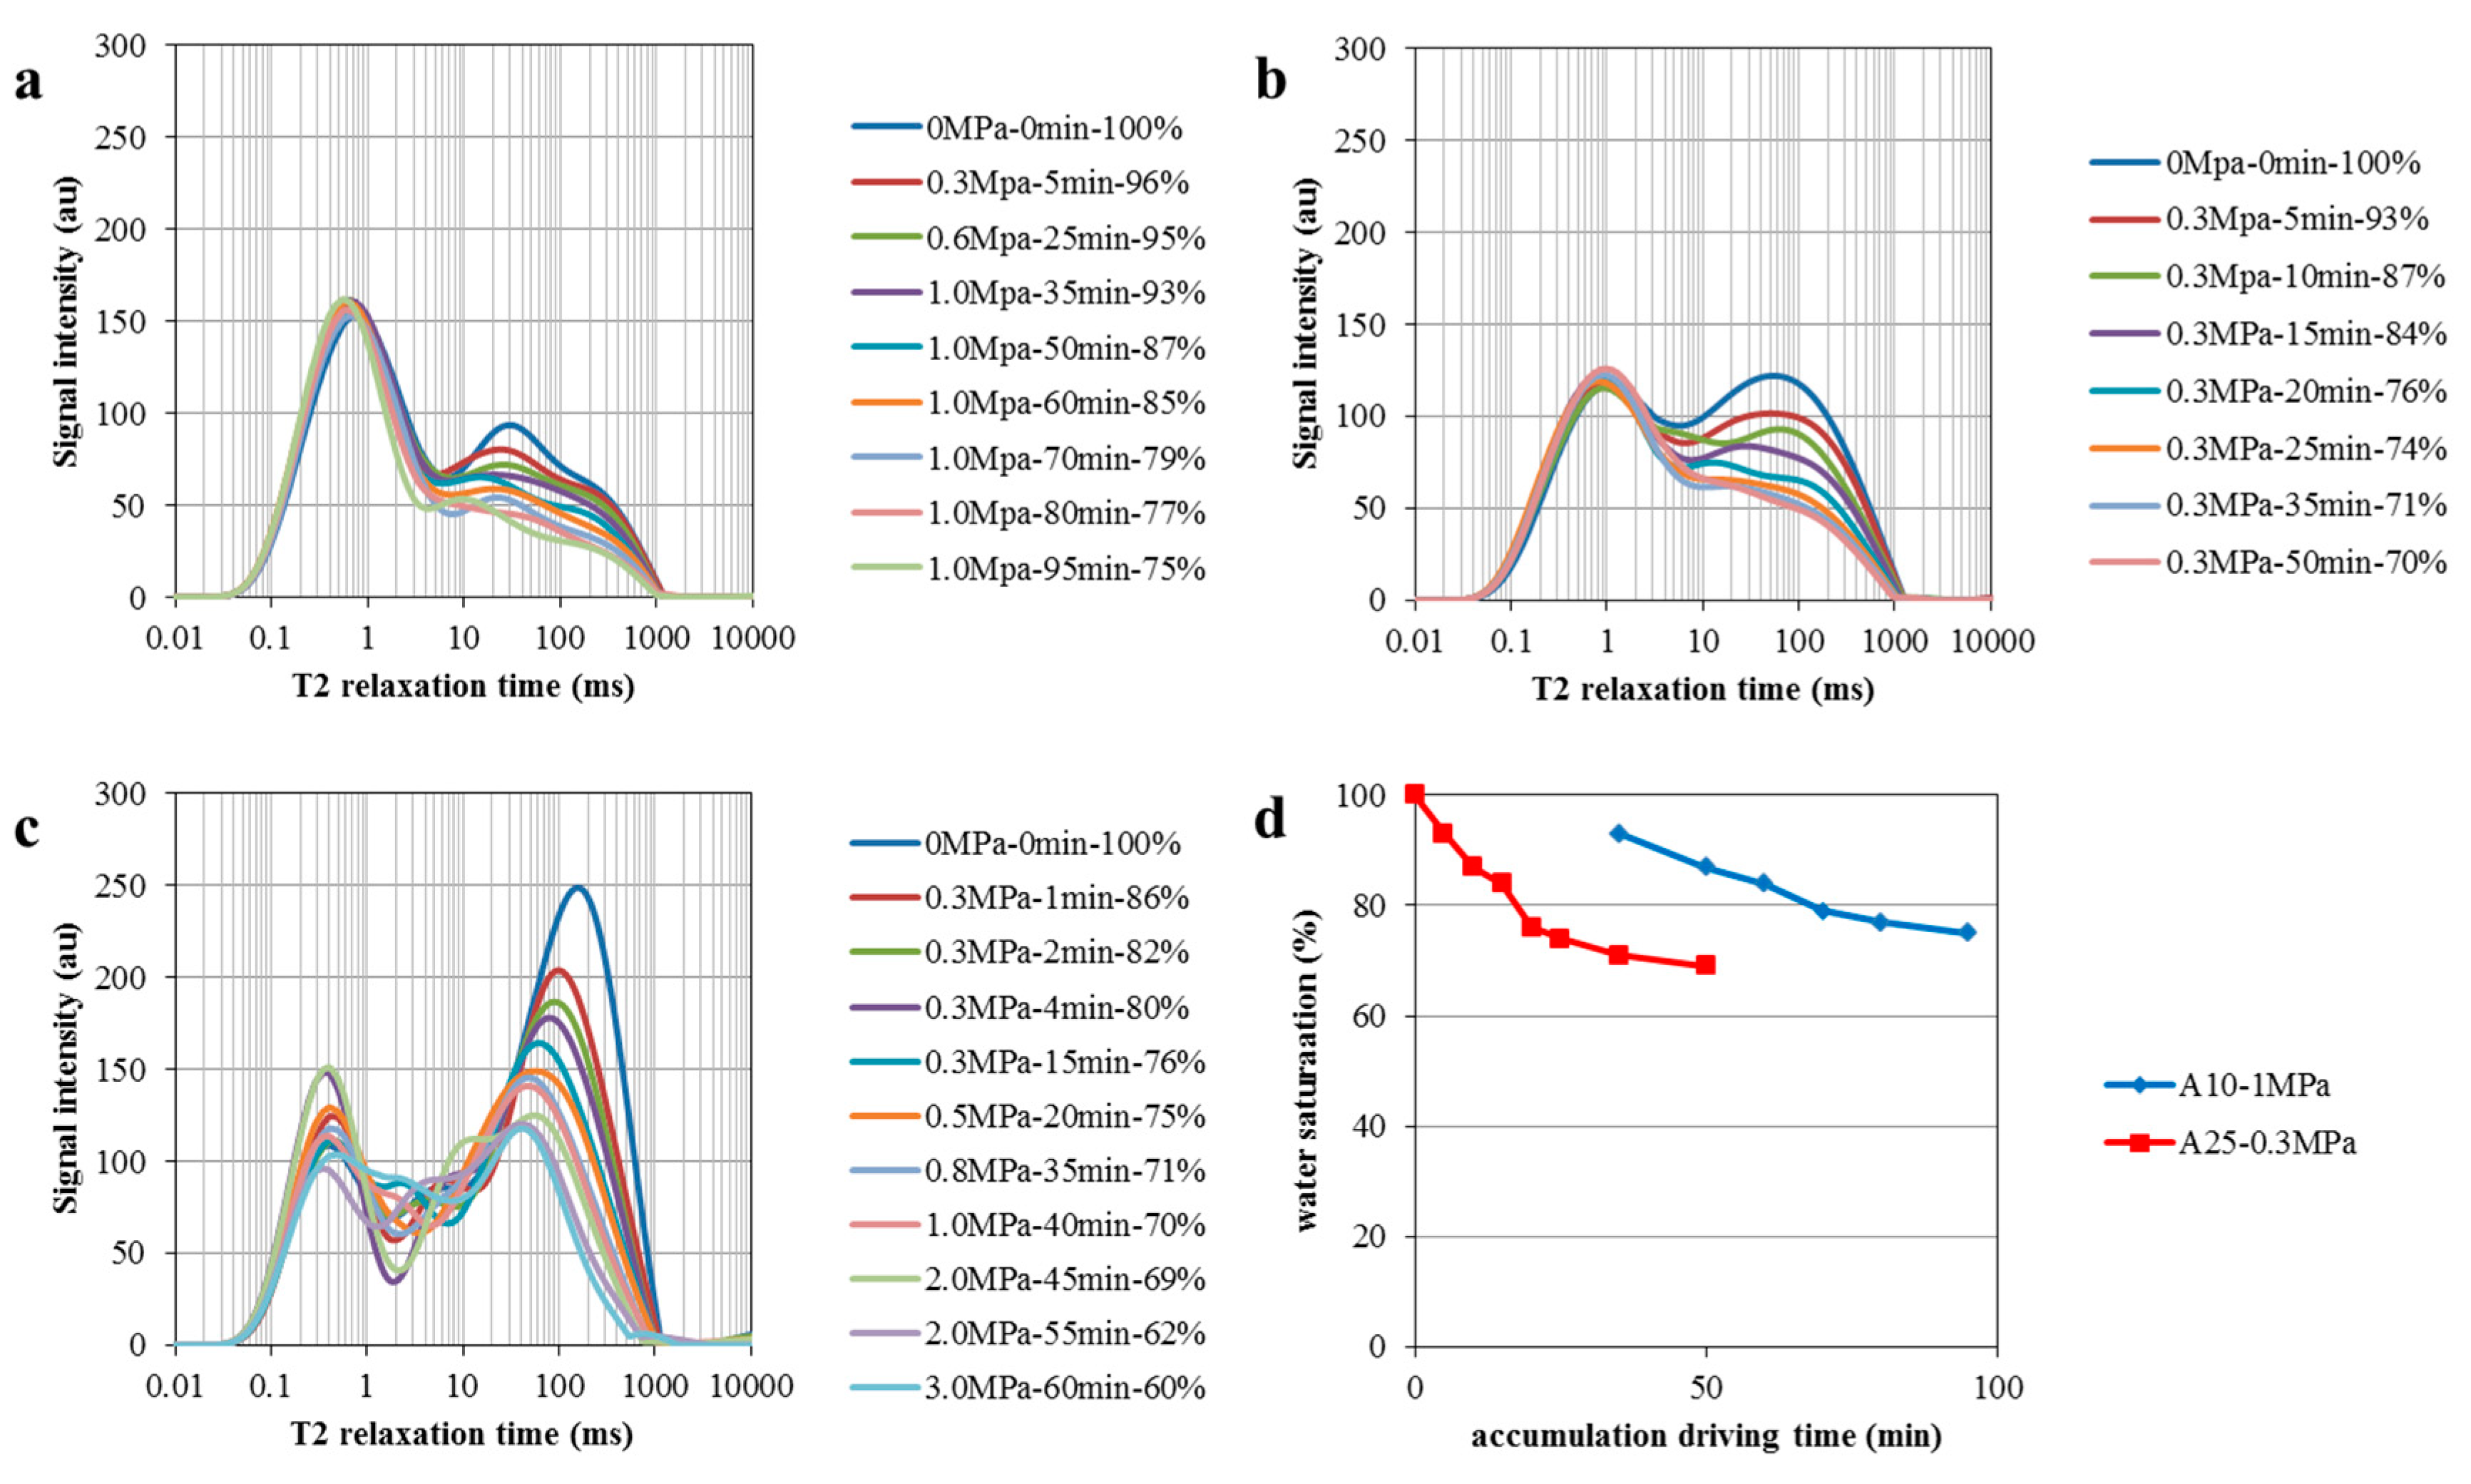
3.1. migration layer charging result
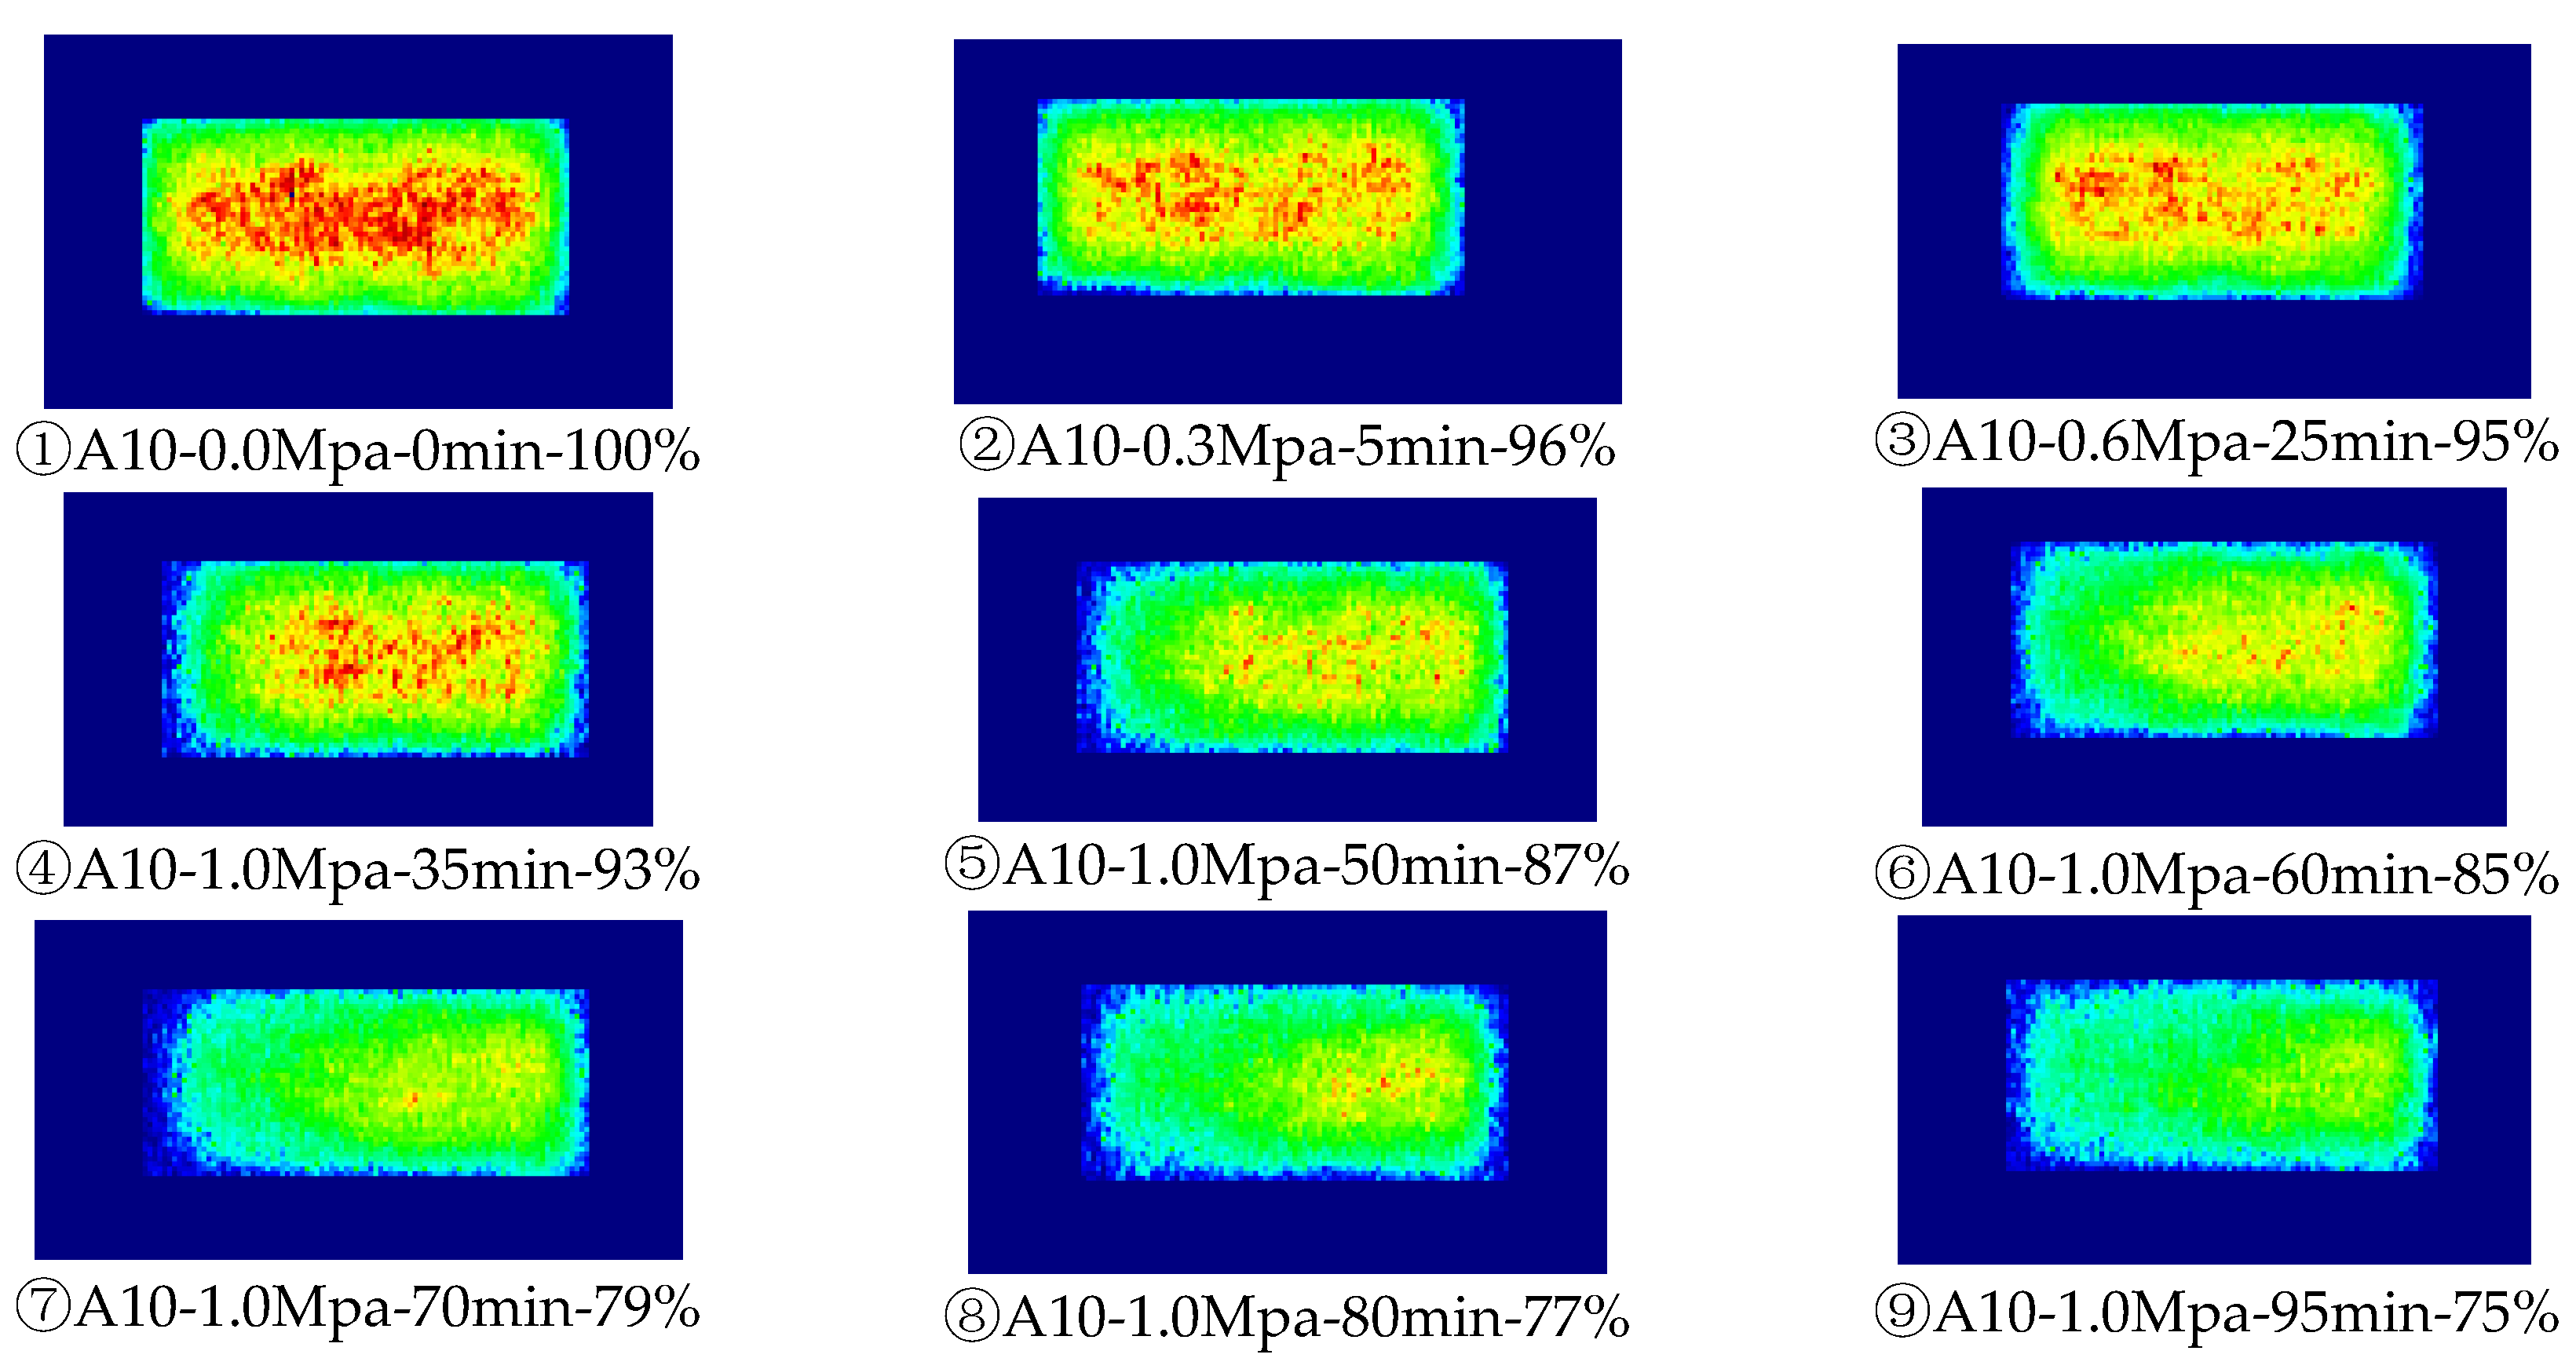
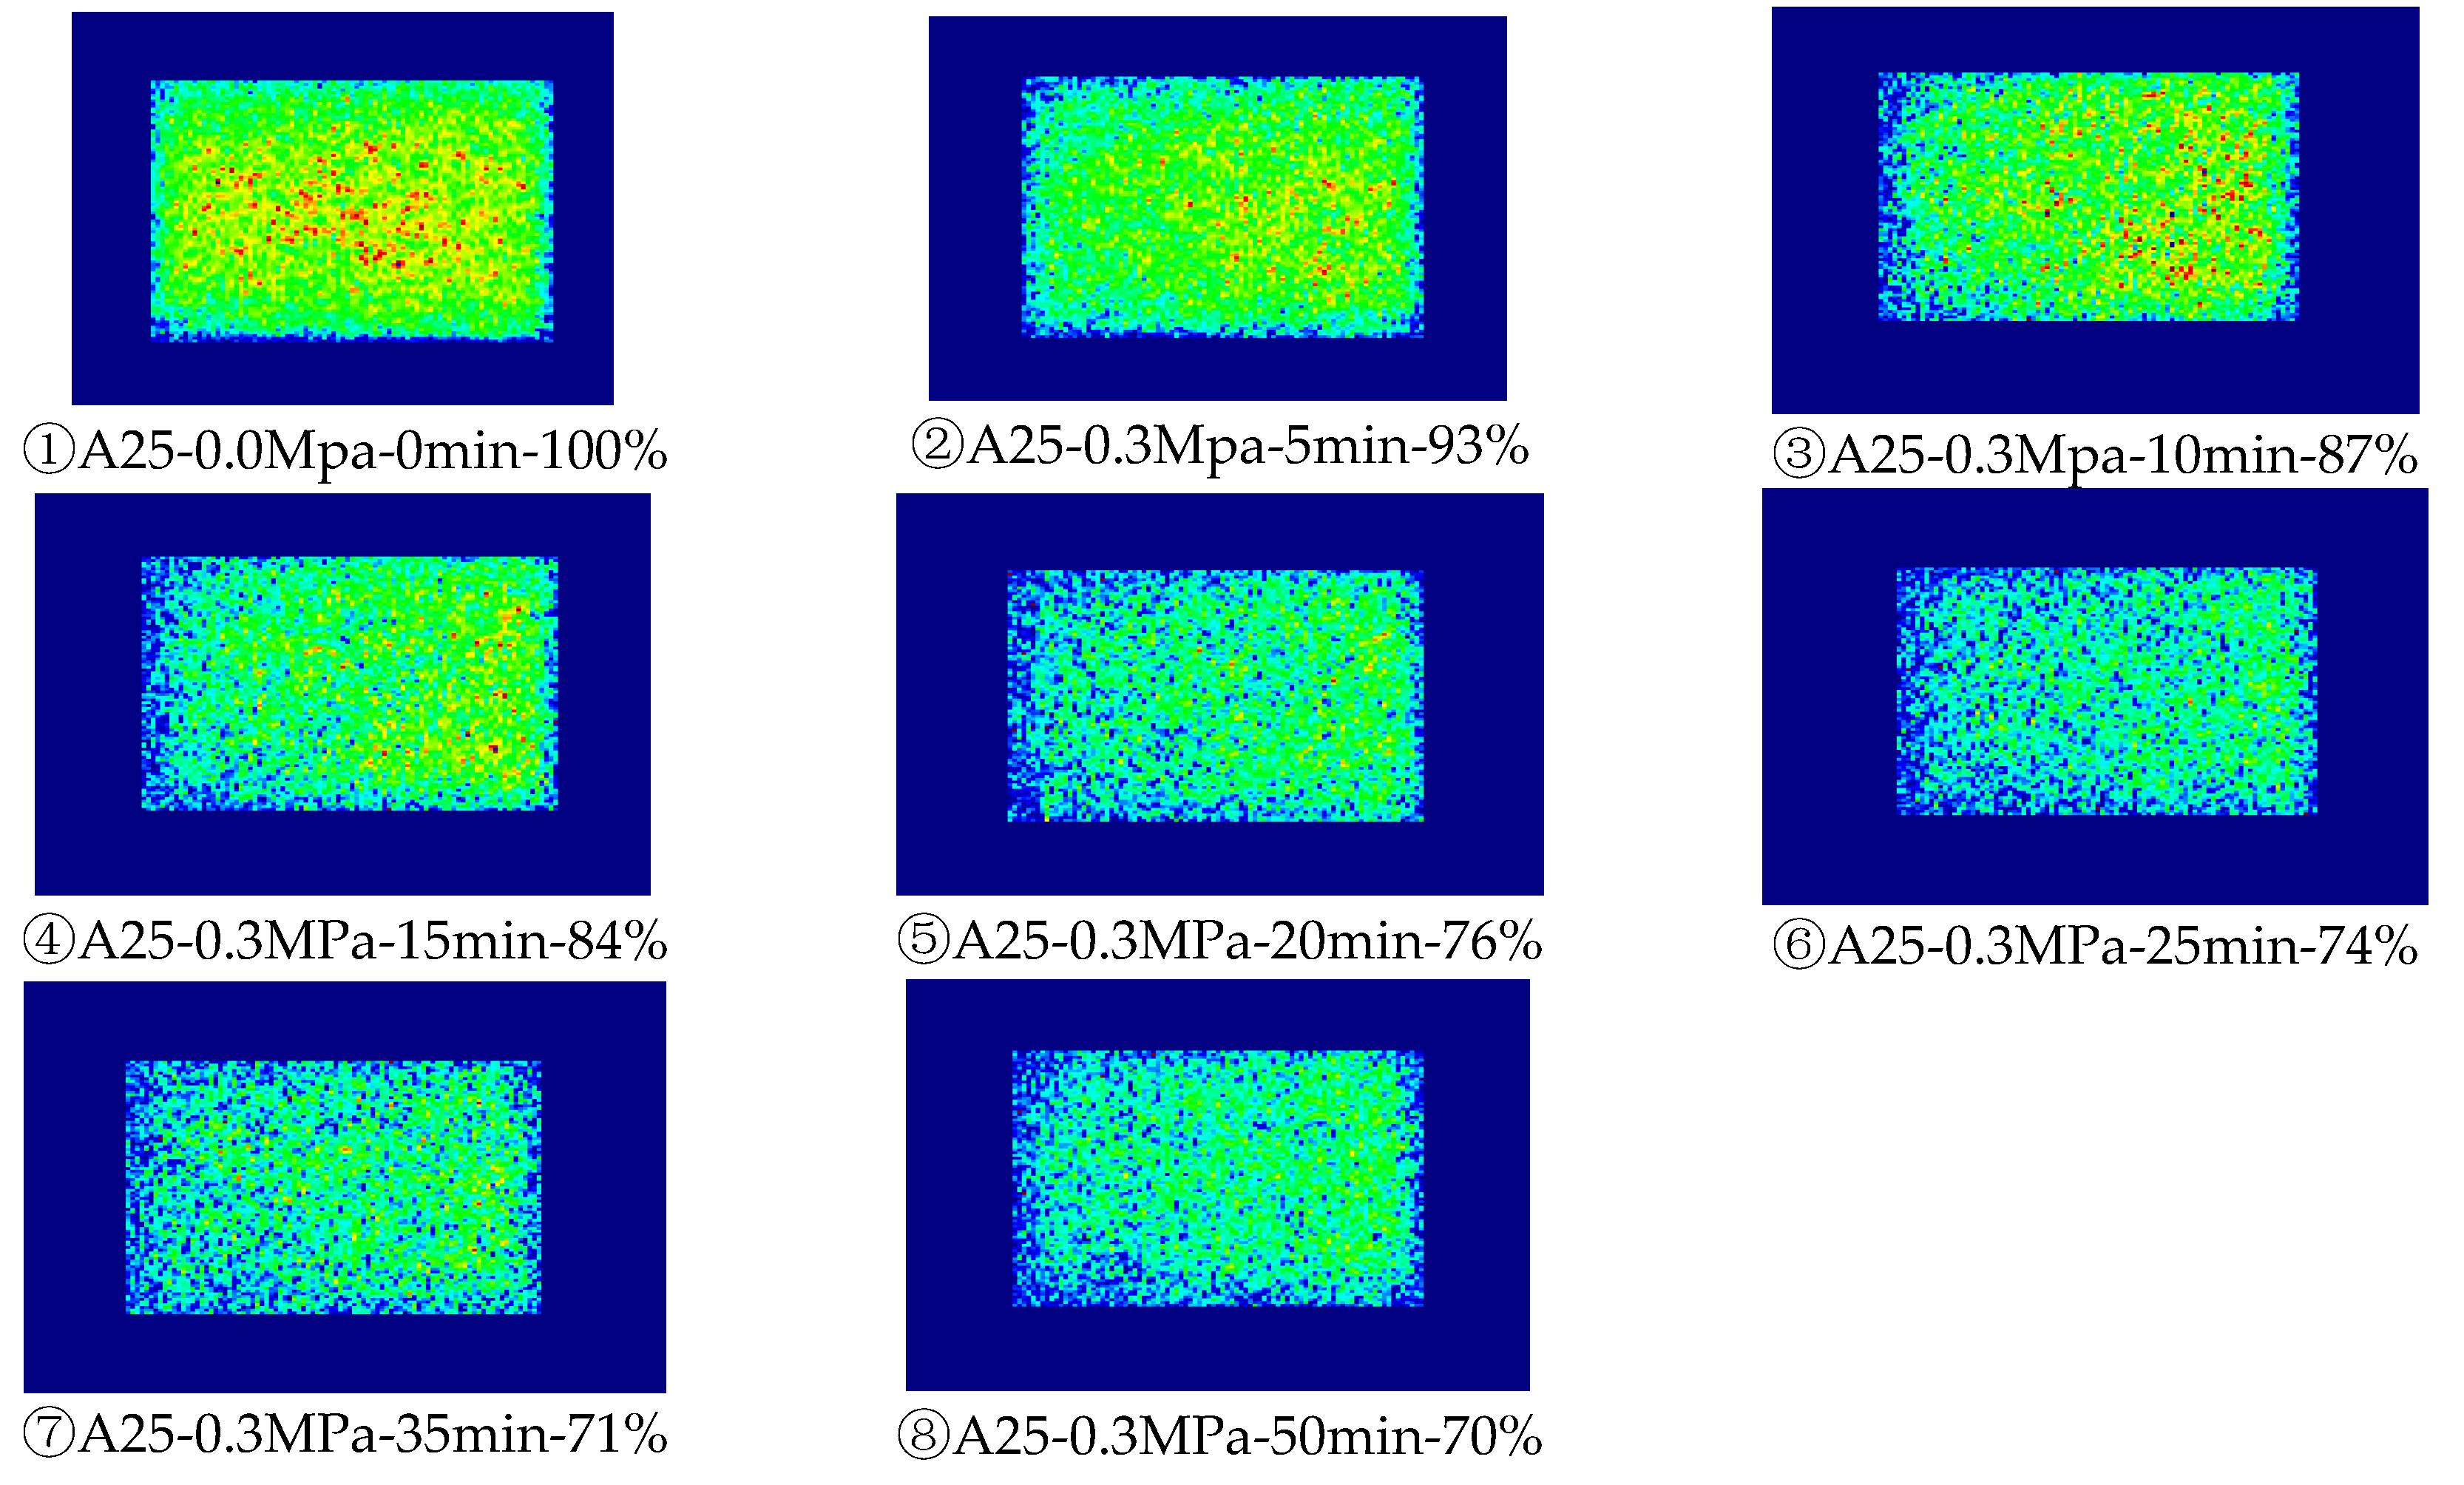
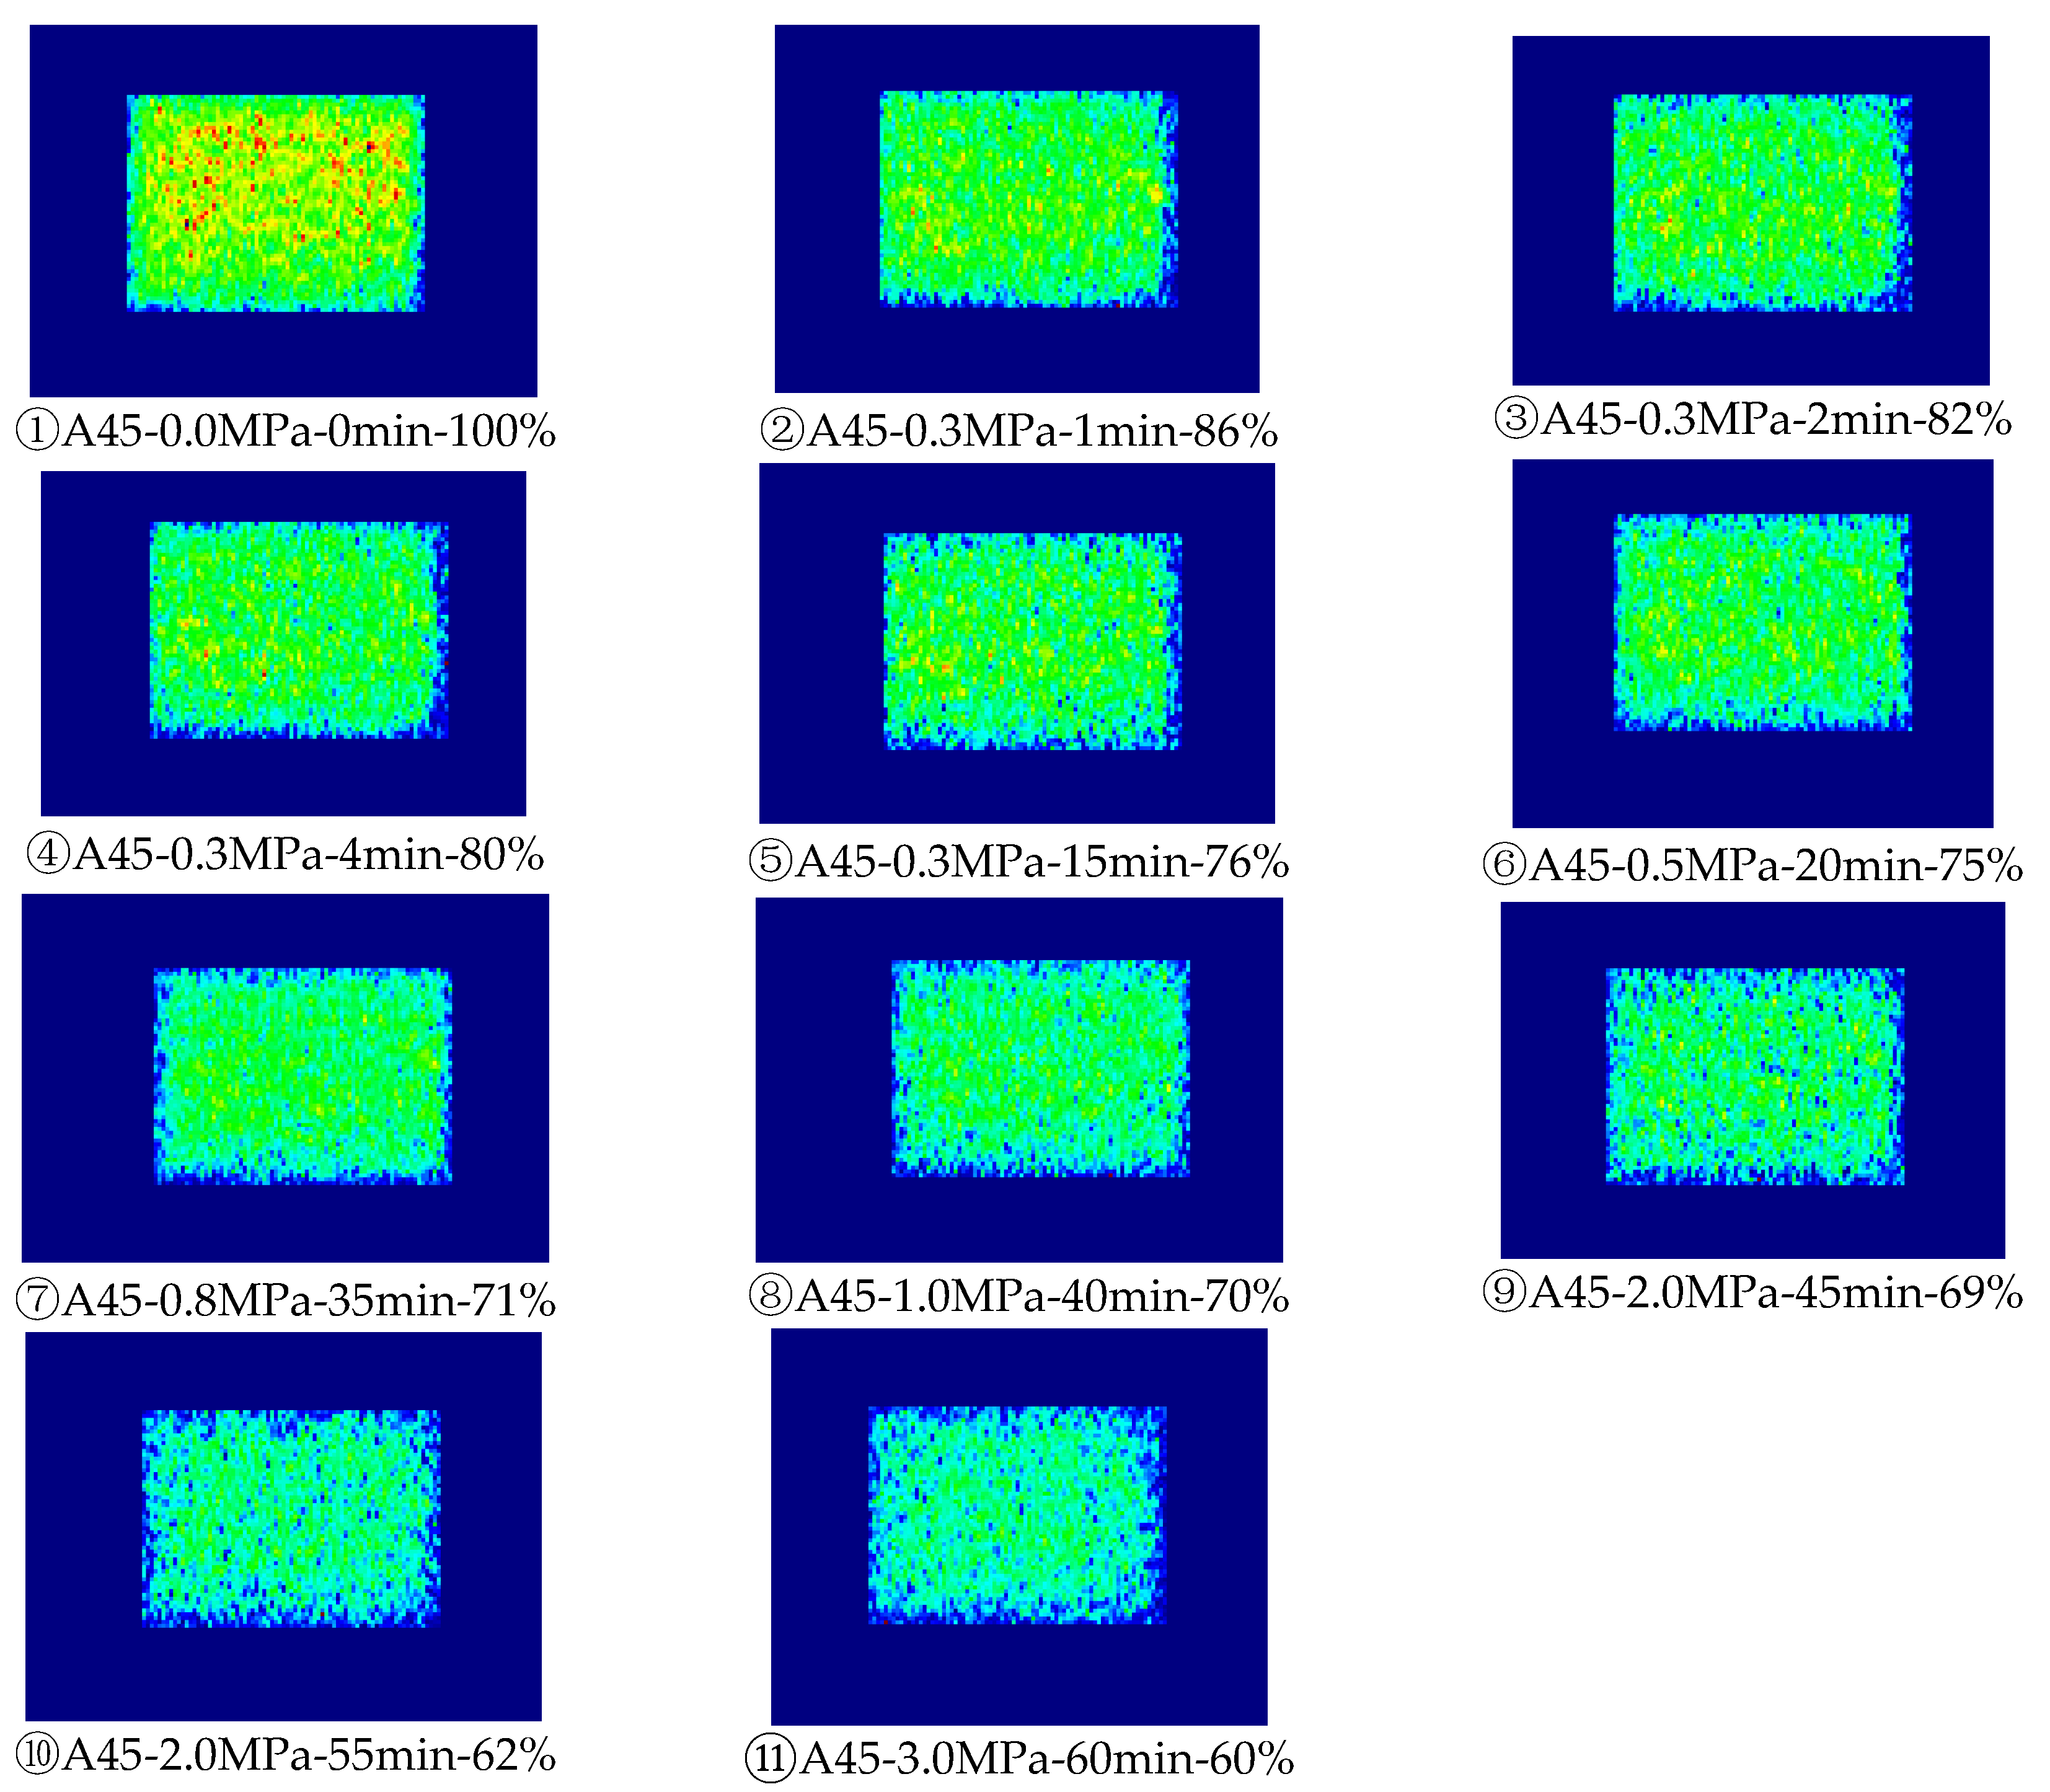
3.2. Trap slowly charge result
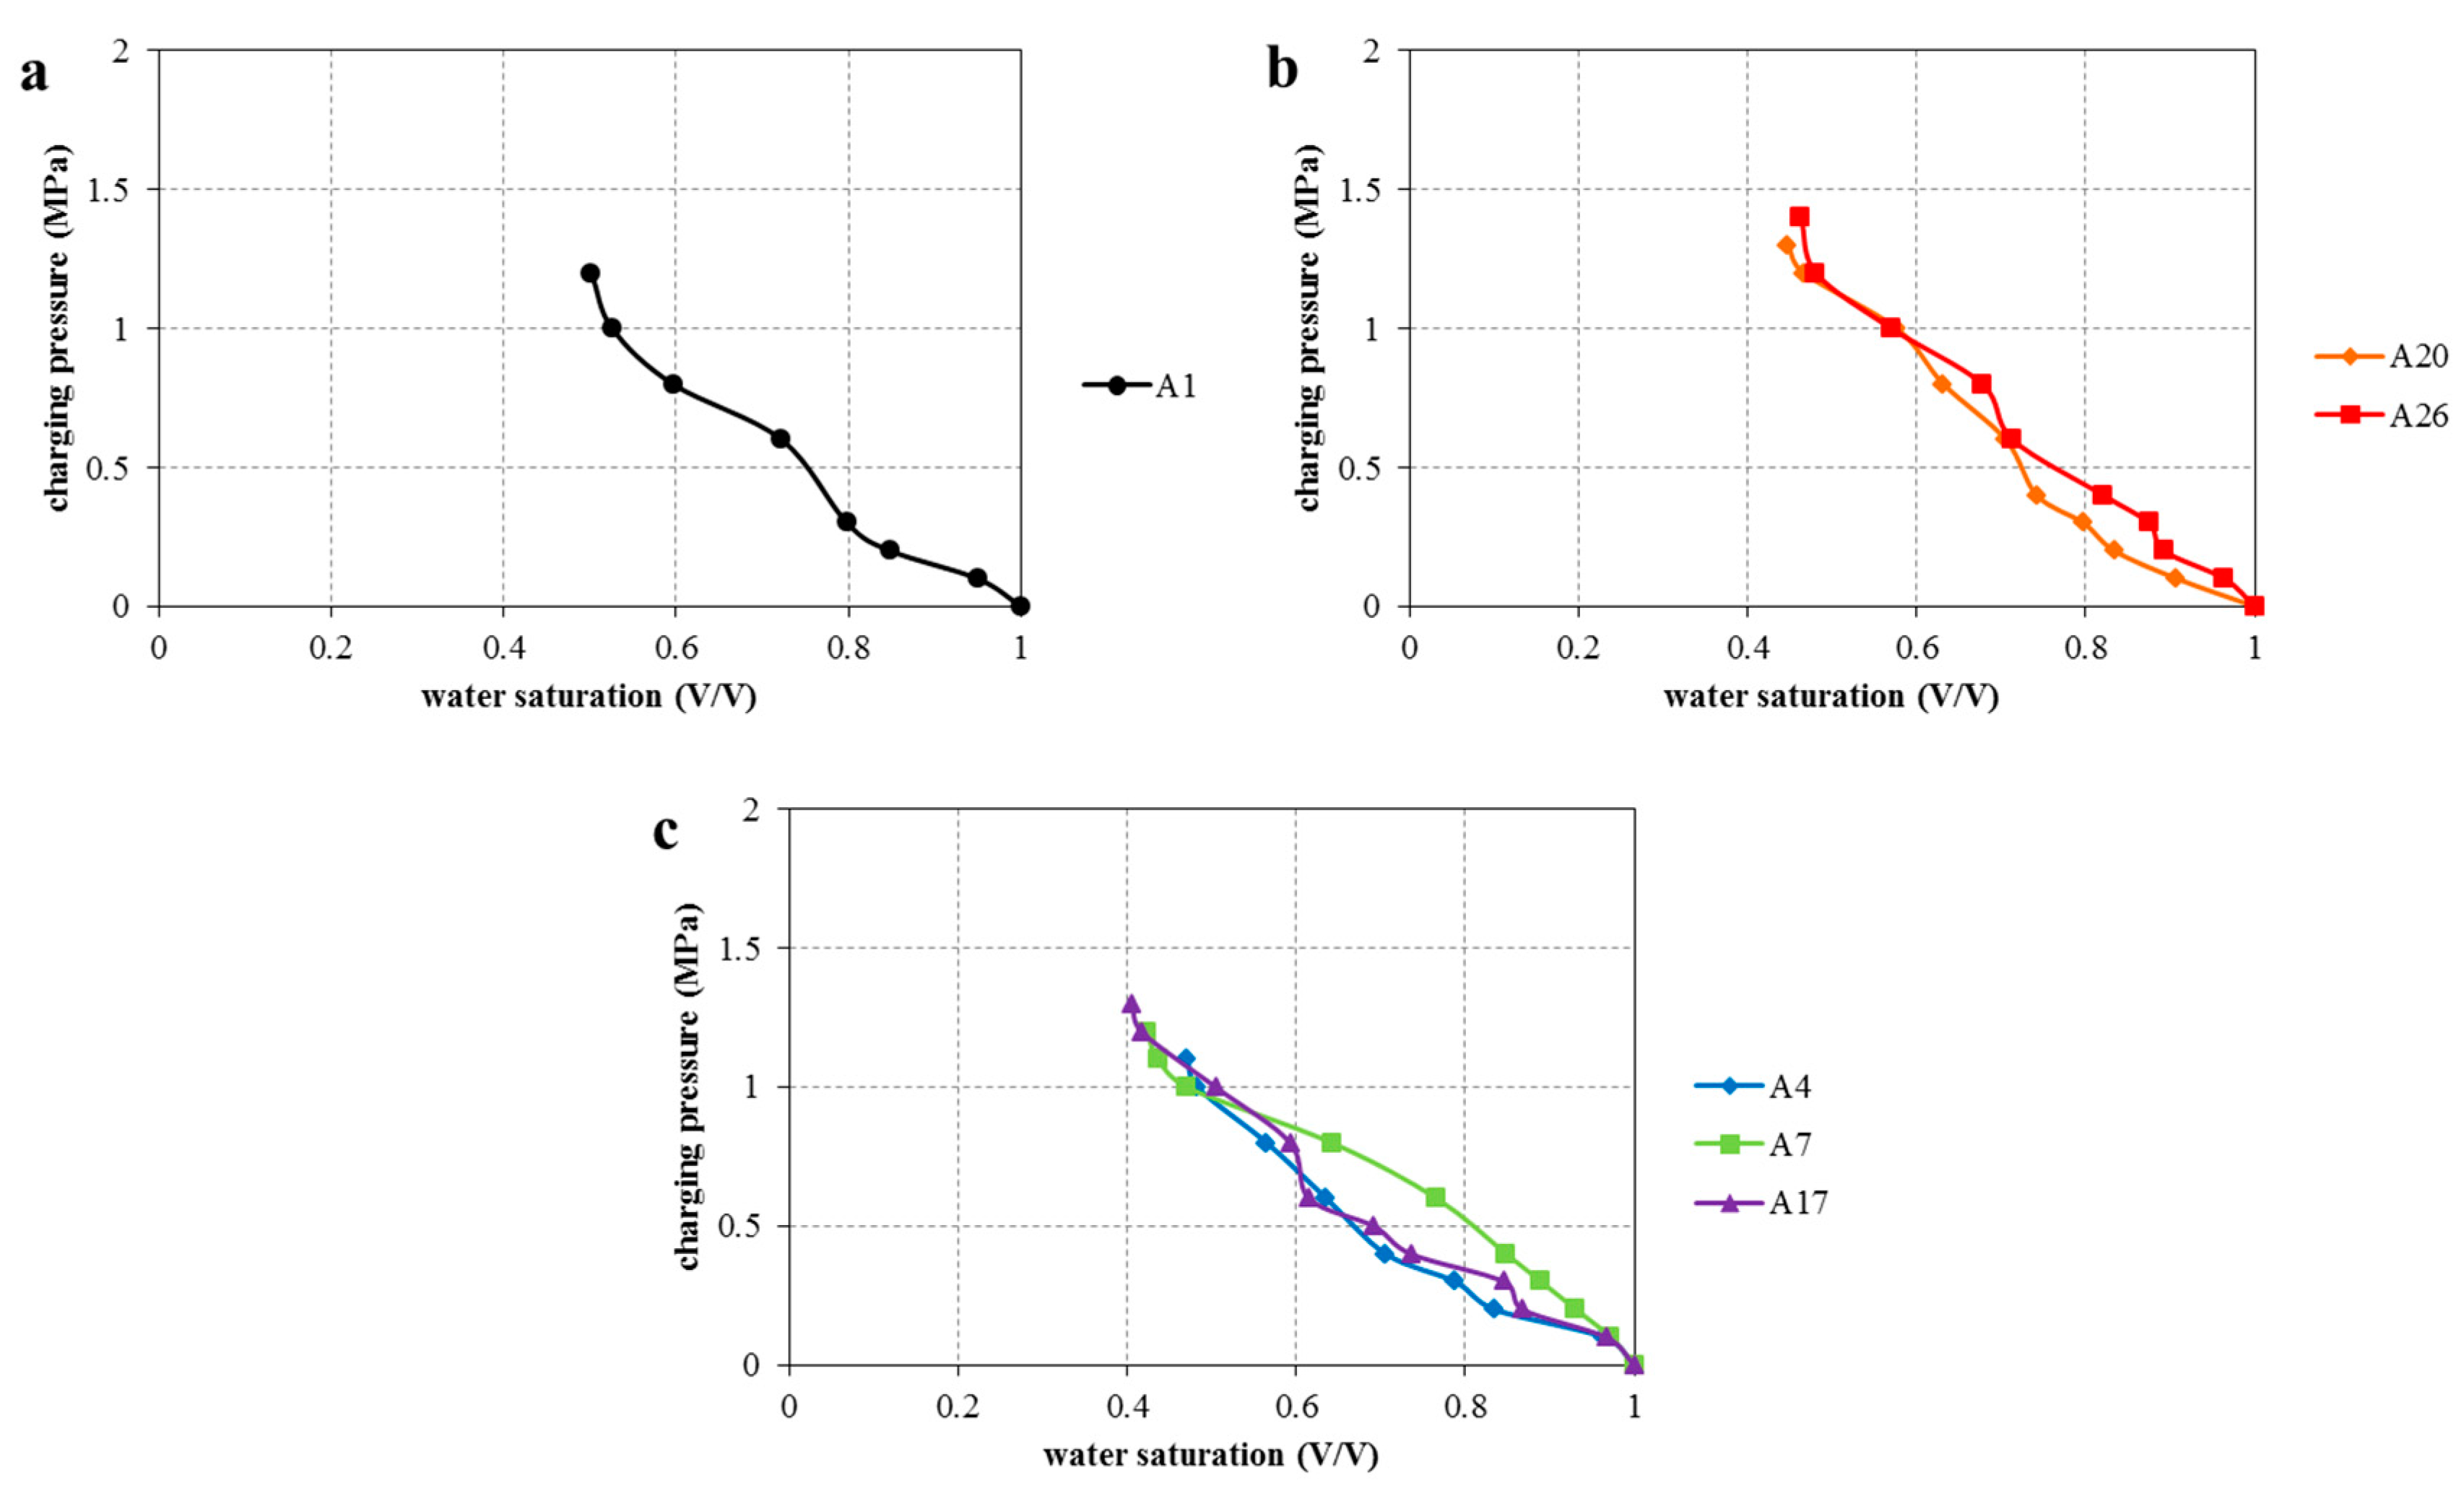
3.3. Trap rapidly charge result
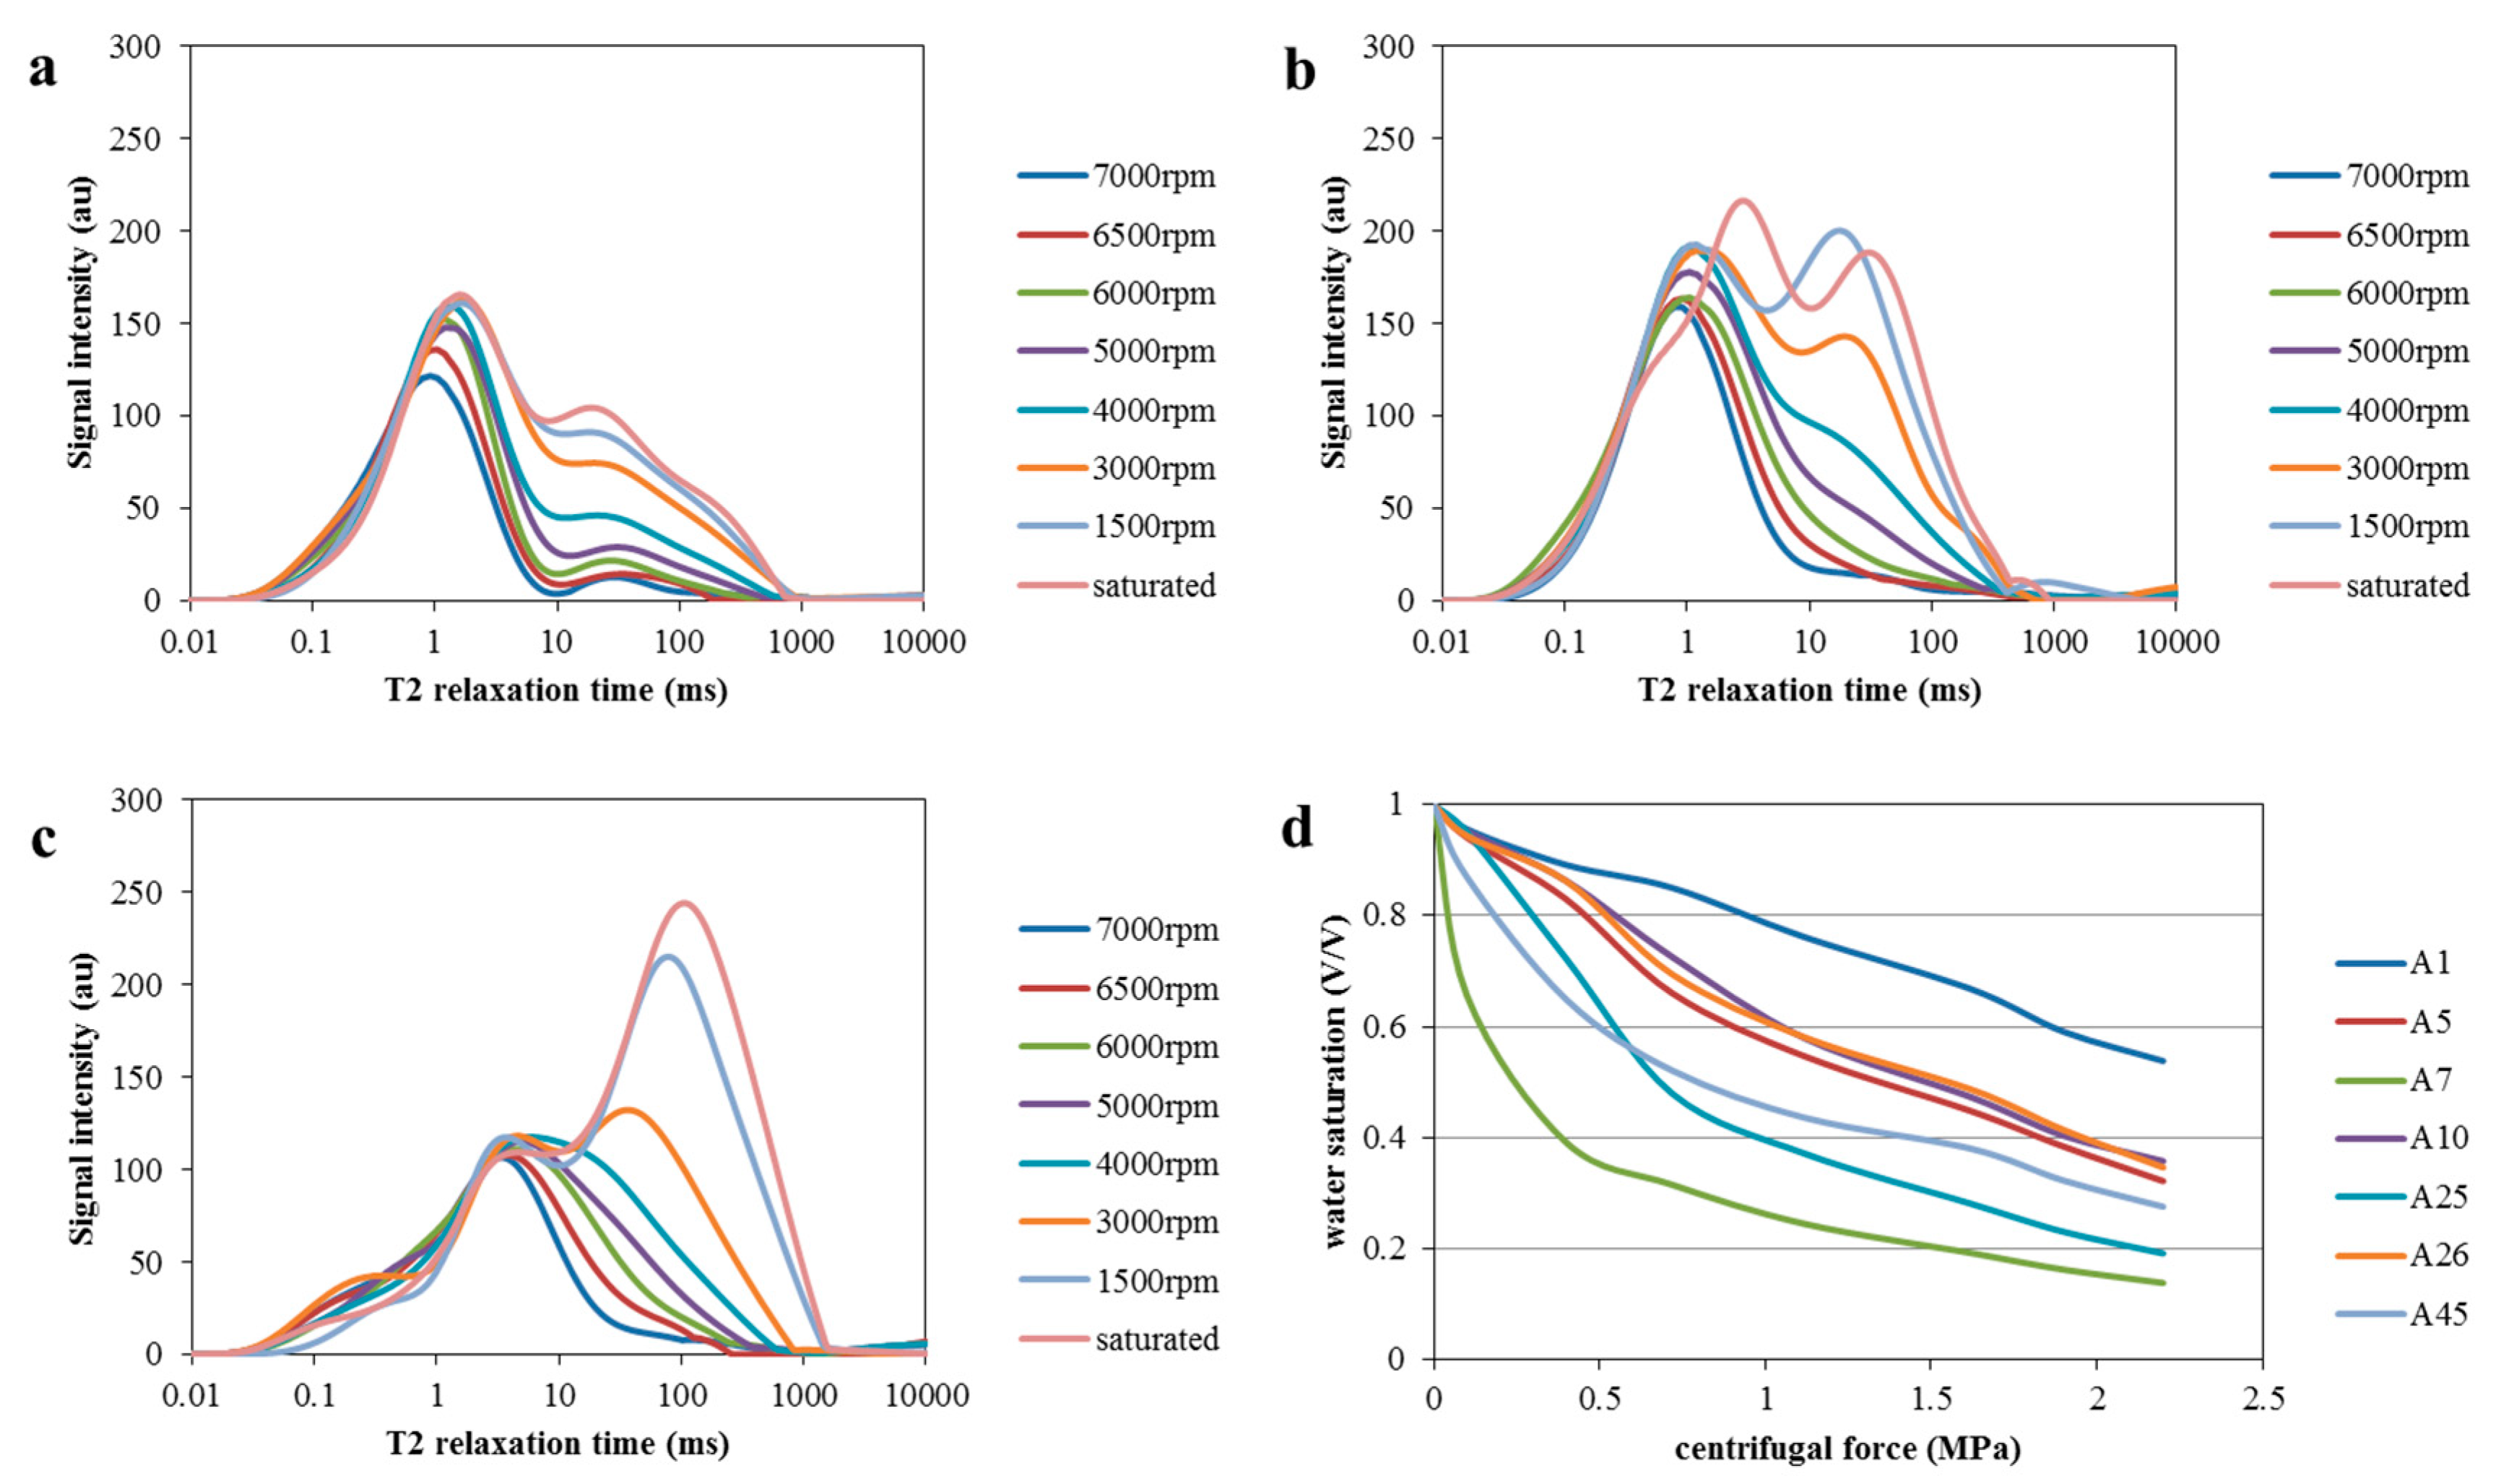
4. Discussion
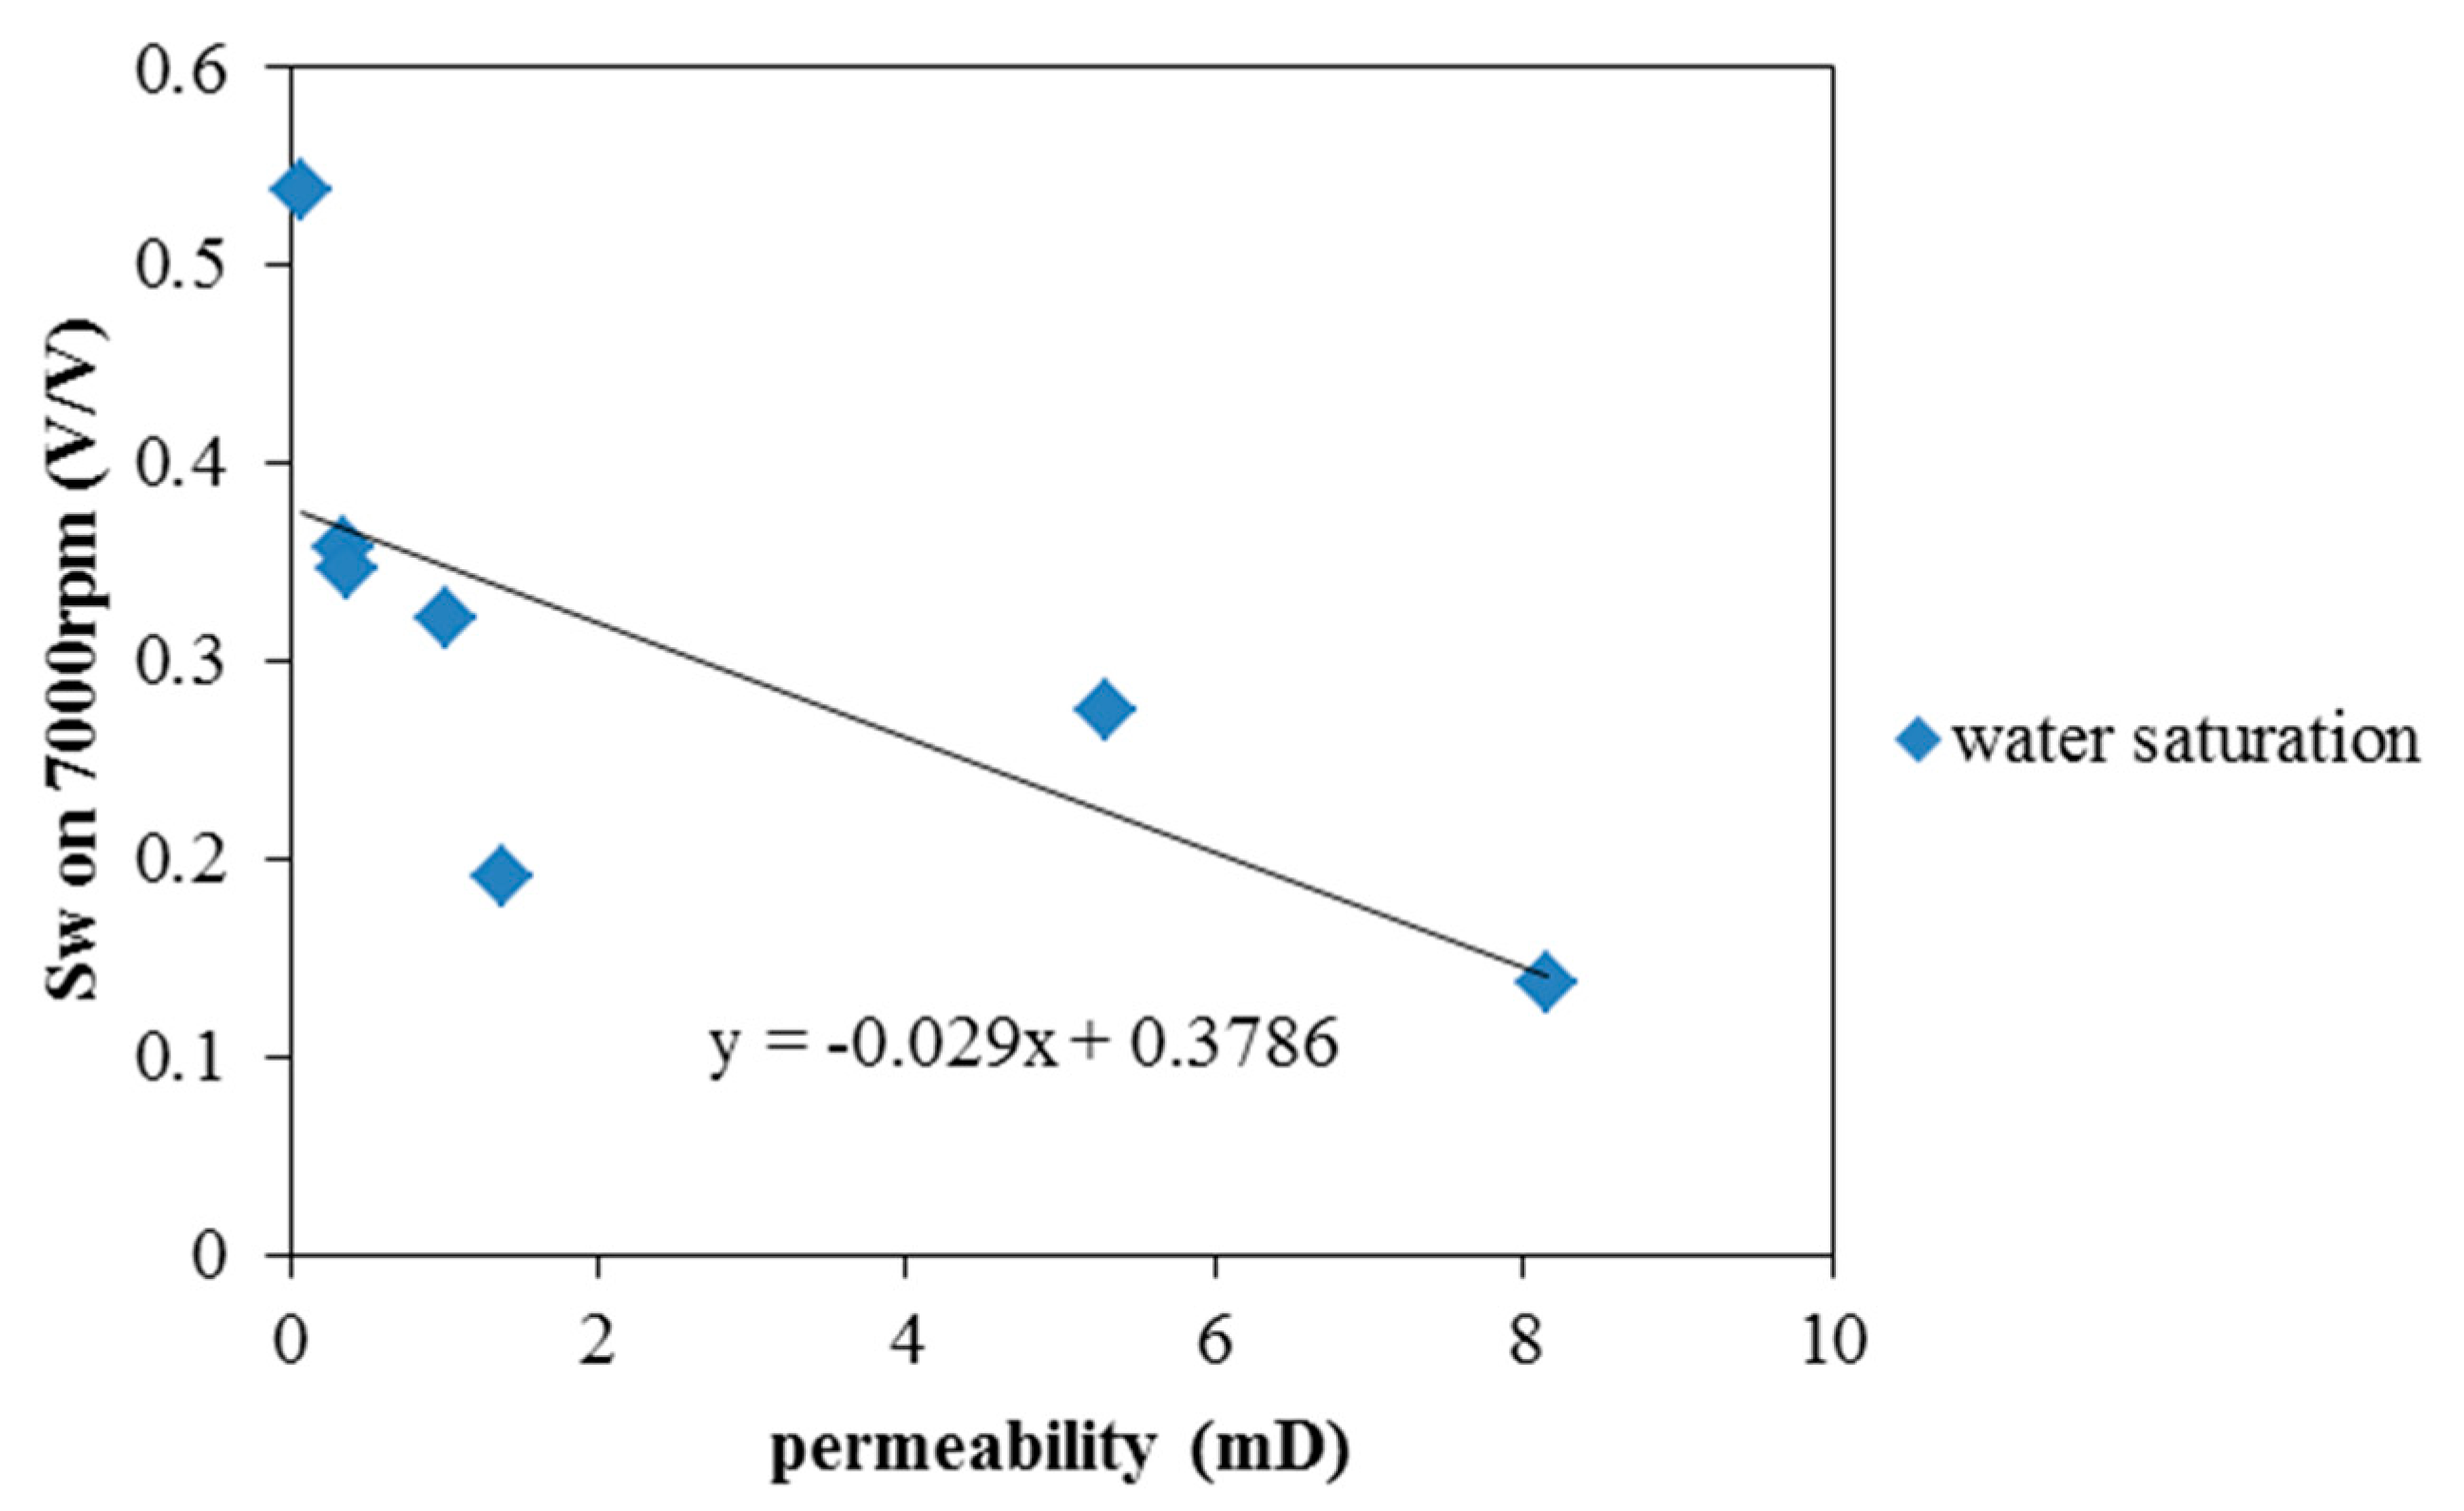
4.1. Final water saturation of different physical modeling
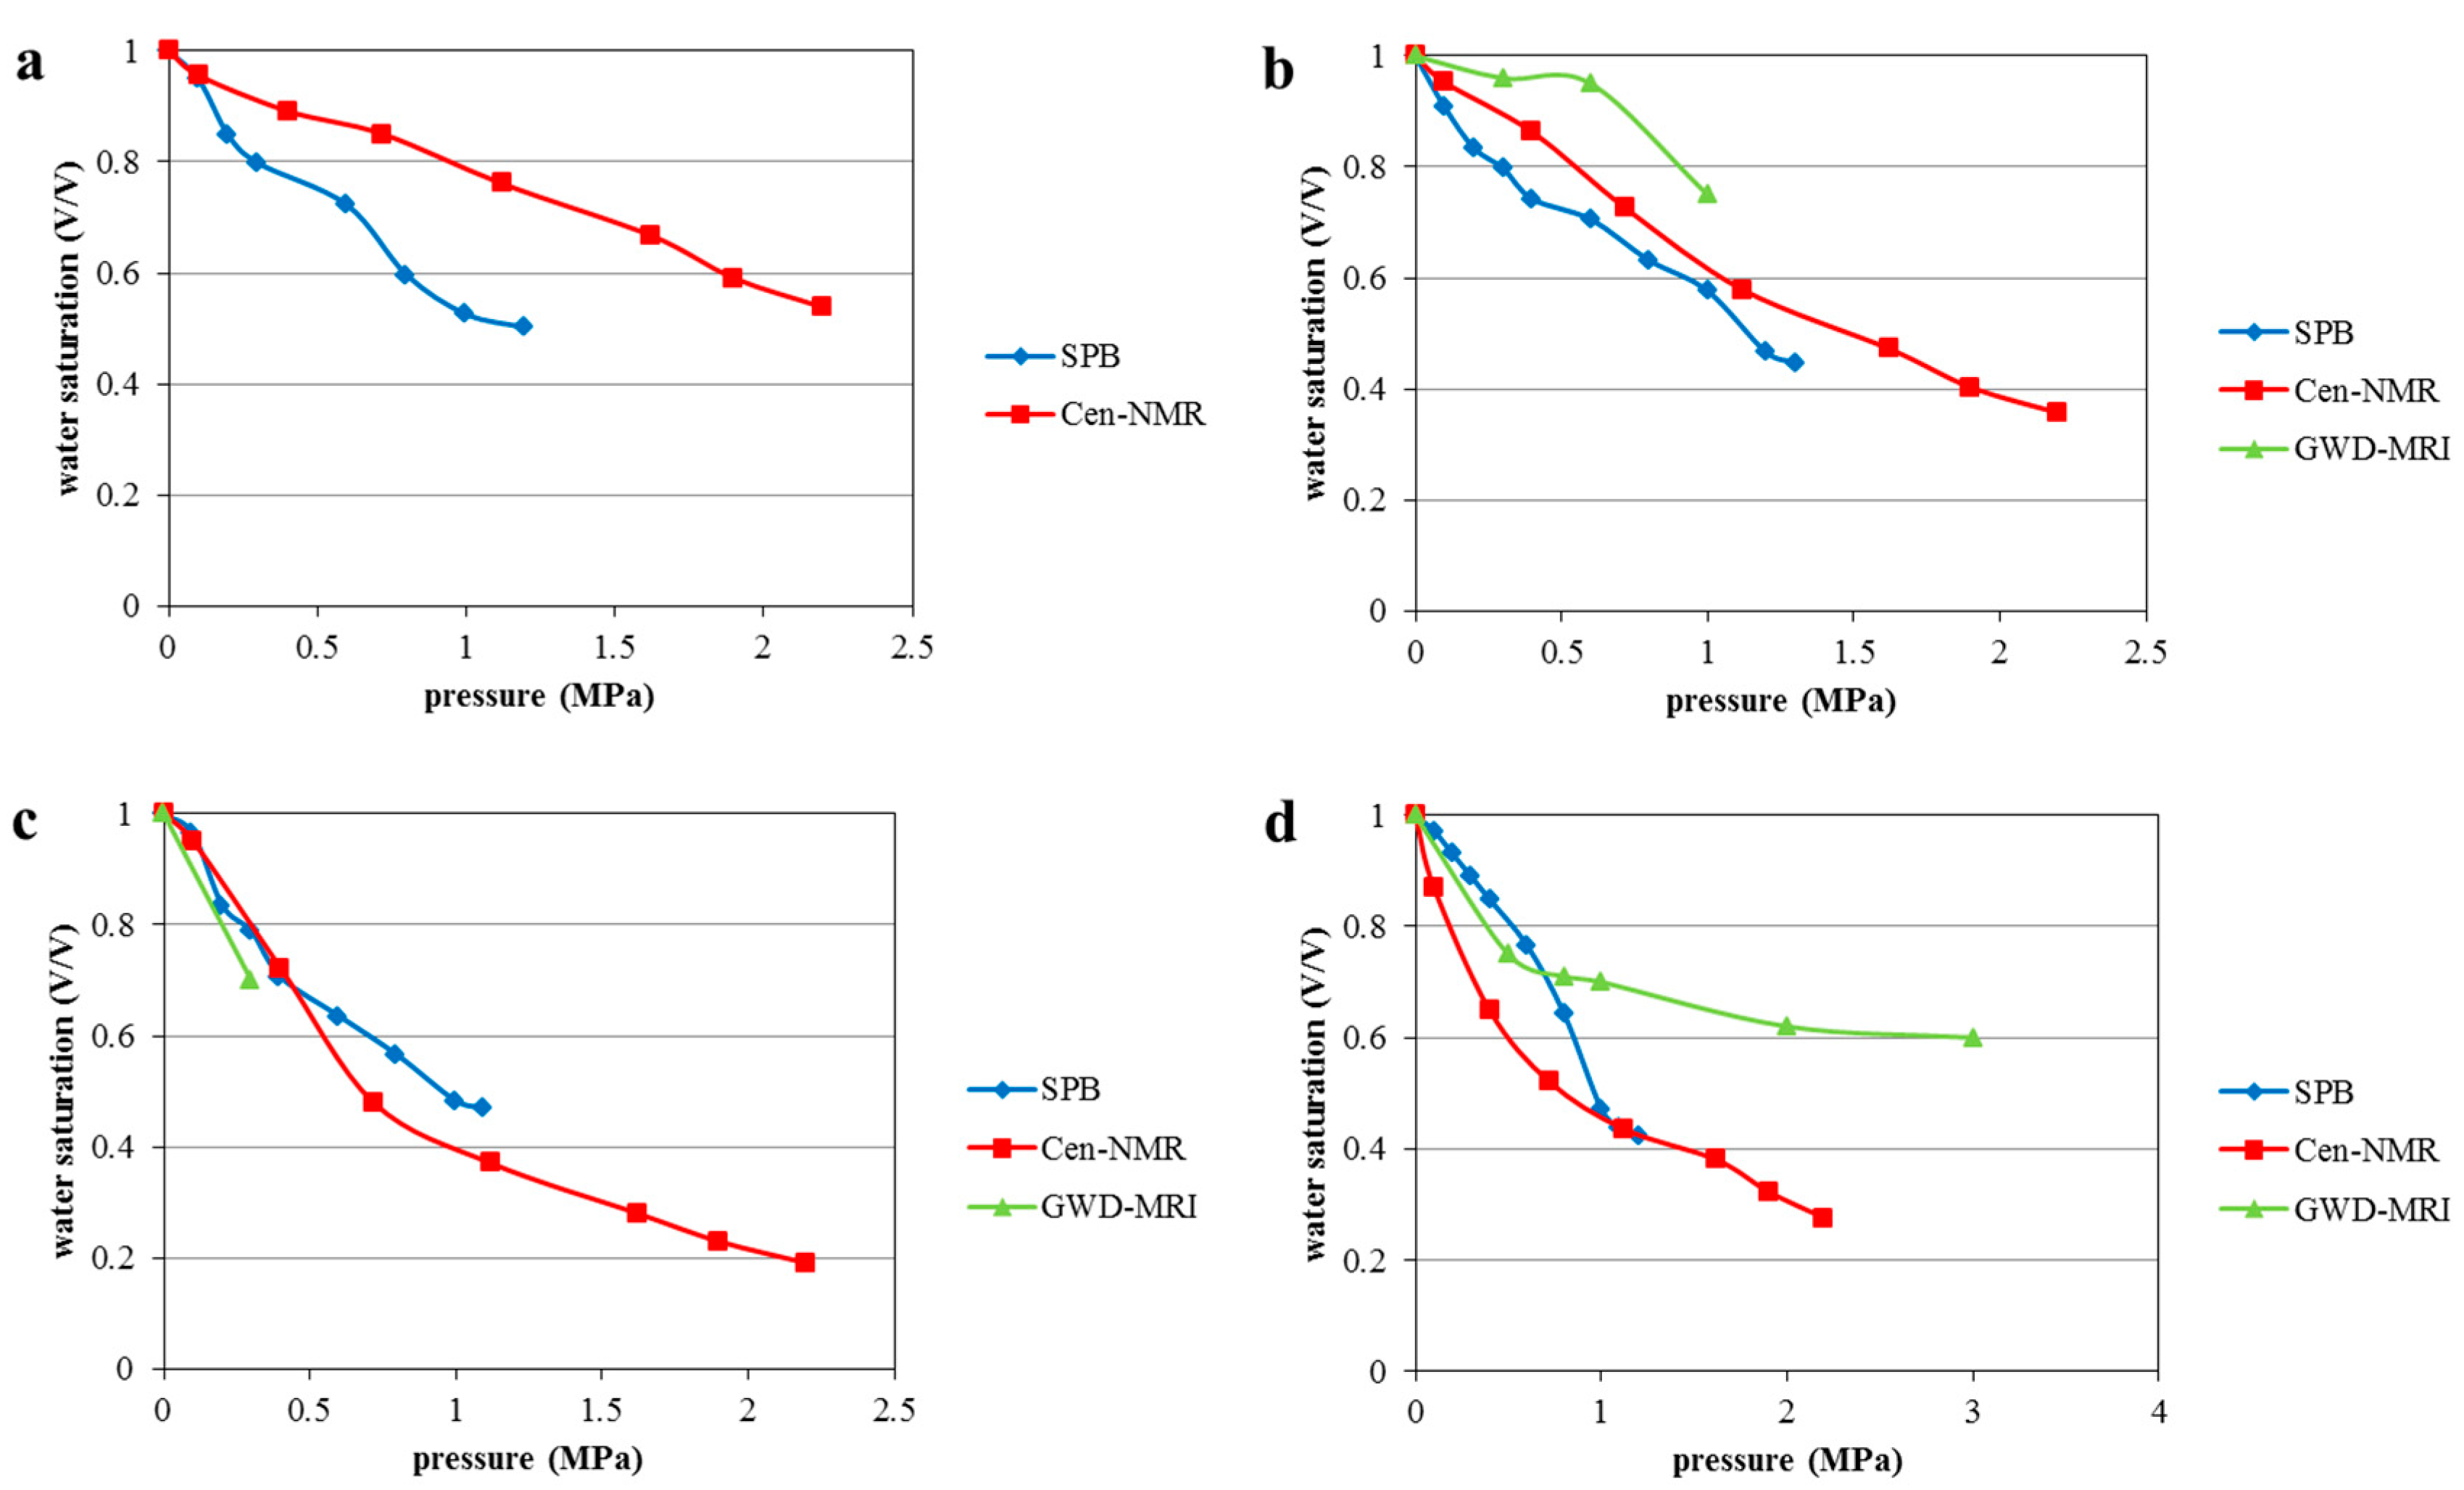
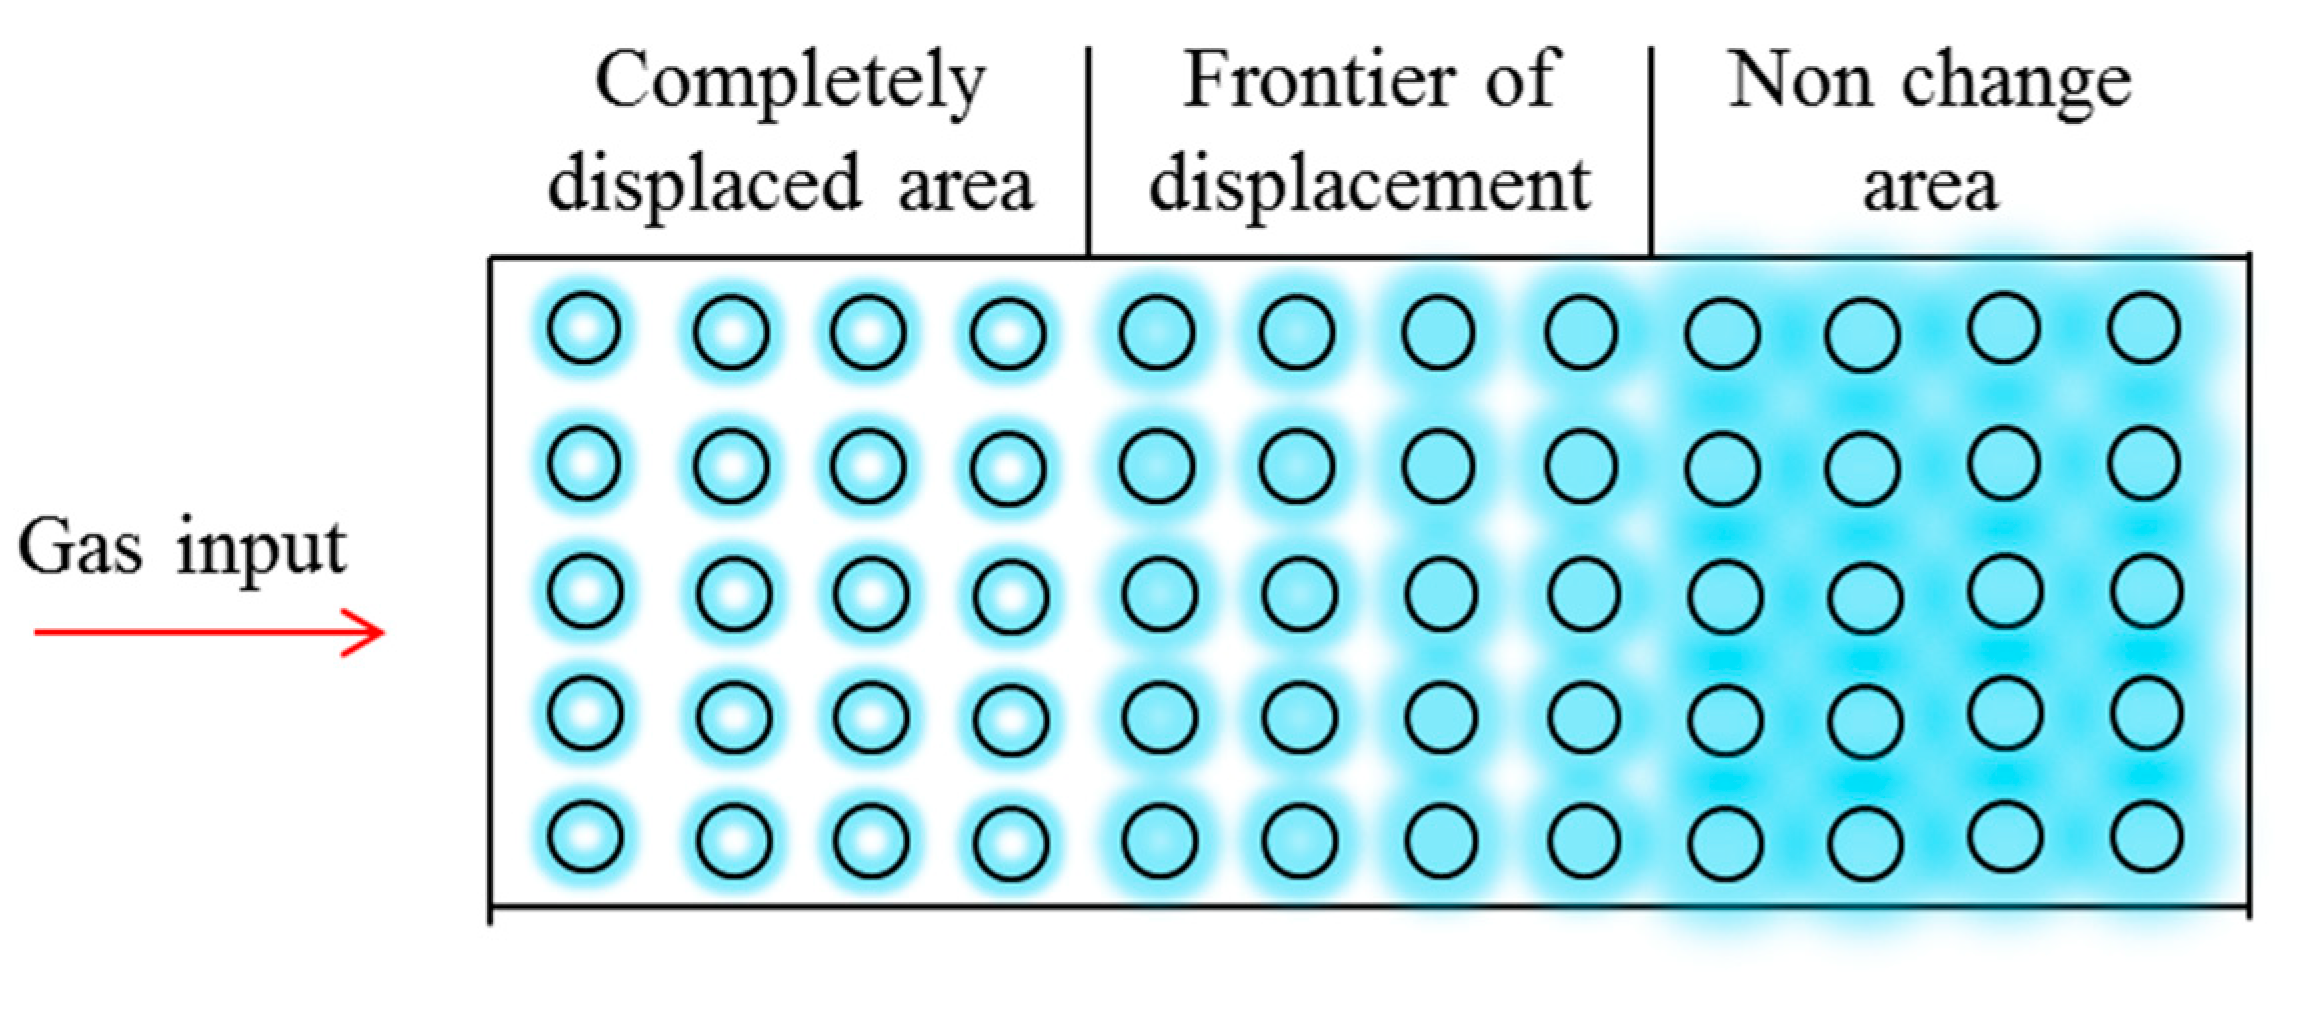
4.2. Characters of charging pass in migration layer
4.3. Characters of trap charging
- Time factor
- 2.
- Final water saturation

5. Conclusion
Acknowledgements
References
- Arogun, O., Nwosu, C., 2011. Capillary pressure curves from nuclear magnetic resonance log data in a deepwater turbidite nigeria field — a comparison to saturation models from scal drainage capillary pressure curves. Society of Petroleum Engineers. [CrossRef]
- Chen, S.D., Tang, D.Z., Tao, S., Ji, X.Y., Xu, H., 2019. Fractal analysis of the dynamic variation in pore-fracture systems under the action of stress using a low-field NMR relaxation method: an experimental study of coals from western guizhou in china. Journal of Petroleum ence and Engineering, 173, 617-629.
- Daigle, H., Johnson, A.. 2015. Combining mercury intrusion and nuclear magnetic resonance measurements using percolation theory. Transport in Porous Media, 111(3), 1-11.
- Duan, W., Luo, C., Lou, Z., Liu, J., Jin, A., Zhu, 2017. Diagenetic differences caused by the charging of natural gases with various compositions - a case study on the lower zhuhai formation clastic reservoirs in the wc-a sag, the pearl river mouth basin. Marine and Petroleum Geology. 81, 149-168.
- Eslami, M., Kadkhodaie-Ilkhchi, A., Sharghi, Y., & Golsanami, N. 2013. Construction of synthetic capillary pressure curves from the joint use of NMR log data and conventional well logs. Journal of Petroleumence & Engineering, 111, 50-58.
- Feng, C., Guimares, A.S., Ramos, N., Sun, L., Janssen, H., 2020. Hygric properties of porous building materials (vi): a round robin campaign. Building and Environment, 185, 107242.
- Glorioso, J.C., Aguirre, O., Piotti, G., Mengual, J.F., 2003. Deriving Capillary Pressure and Water Saturation from NMR Transversal Relaxation Times. Society of Petroleum Engineers. [CrossRef]
- Gu, J., Jeong, Y.J., Na, J.Y., Seon, J.K., Kang, K., 2020. Application of semi-permeable membrane for a scaffold in a nature-mimicking vascular system. Journal of Membrane Science, 611, 118384.
- Guo, X., Huang, Z., Zhao, L., Han, W., Ding, C., Sun, X., 2019. Pore structure and multi-fractal analysis of tight sandstone using MIP, NMR and NMRC methods: a case study from the kuqa depression, China. Journal of Petroleum Science & Engineering. 178, 544–558.
- Li, Y.B., Zhang, Y.Q., Luo, C., Gao, H., Li, K., Xiao, Z.R., et al. 2019. The experimental and numerical investigation of in situ re-energization mechanism of urea-assisted steam drive in superficial heavy oil reservoir. Fuel, 249(AUG.1), 188-197.
- Lu, T., Li, Z.M., Li, S.Y., Wang, P., Wang, Z.Z., Liu, S.Q., 2016. Enhanced heavy oil recovery after solution gas drive by water flooding. Journal ofPetroleumScienceandEngineering, 137, 113-124.
- Lysova, A.A., Garnier, A.V., Hardy, E.H., Reimert, R., Koptyug, I.V., 2011. The influence of an exothermic reaction on the spatial distribution of the liquid phase in a trickle bed reactor: direct evidence provided by nmr imaging. Chemical Engineering Journal. 173, 552-563.
- Masri, W., Shapiro, A.. 2021. Experimental determination of relative permeabilities and critical gas saturations under solution-gas drive. Journal of Petroleum Science and Engineering, 202, 108509.
- Niroomand, S., Fauchoux, M.T., Simonson, C.J., 2019. Evaluation of the frost properties on a semipermeable membrane. International Journal of Heat and Mass Transfer, 133(APR.), 435-444.
- Shao, X., Pang, X., Jiang, F., Li, L., Huyan, Y., D Zheng., 2017. Reservoir characterization of tight sandstones using nuclear magnetic resonance and incremental pressure mercury injection experiments: implication for tight sand gas reservoir quality. Energy & Fuels, acs.energyfuels.7b01184.
- Wang, X.Q., Sun, L., Zhu, R.K., et al. 2015. Application of charging effects in evaluating storage space of tight reservoirs: A case study from Permian Lucaogou Formation in Jimusar sag, Junggar Basin, NW China[J]. Shiyou Kantan Yu Kaifa/Petroleum Exploration and Development, 42(4):516-524.
- Wang, Y., Hou, J.R., Tang, Y., Song, Z.J., 2019. Effect of vug filling on oil-displacement efficiency in carbonate fractured-vuggy reservoir by natural bottom-water drive: a conceptual model experiment. Journal of Petroleum Science and Engineering, 174, 1113-1126.
- Wang, J., Fu, J., Xie, J., Wang, J.. 2020. Quantitative characterisation of gas loss and numerical simulations of underground gas storage based on gas displacement experiments performed with systems of small-core devices connected in series. Journal of Natural Gas Science and Engineering. 81, 103495.
- Wang, M., Yang, Y., Miao, G., Zhou, X.. 2021. An experimental study on coal damage caused by two-phase displacement of co2- alkaline solution. Journal of Natural Gas Science and Engineering, 93(2), 104034.
- Wen, Y., Qu, M., Hou, J., Liang, T., Yuan, N.. 2019. Experimental study on nitrogen drive and foam assisted nitrogen drive in varying-aperture fractures of carbonate reservoir. Journal of Petroleum Science and Engineering, 180.
- Xu, Z.J., Liu, L.F., Wang, T.G., Wu, K.J., Gao, X.Y., et al. 2017. Application of fluid inclusions to the charging process of the lacustrine tight oil reservoir in the triassic yanchang formation in the ordos basin, china. Journal of Petroleum Science & Engineering, 149, 40-55.
- Xue, D. J., Liu, Y.T., Zhou, J., Sun, X.T., 2019. Visualization of helium-water flow in tight coal by the low-field nmr imaging: an experimental observation. Journal of Petroleum Science and Engineering, 188, 106862.
- Zheng, M., Li, J., Wu, X., Li, P., Wang, W., Wang, S., et al. 2016. Physical modeling of oil charging in tight reservoirs: a case study of permian lucaogou formation in jimsar sag, junggar basin, nw china. Petroleum Exploration and Development, 43(2), 241-250.
- Zuo, J. Y., Mullins, O. C., Achourov, V., Pfeiffer, T., Pan, S., & Wang, K., et al. 2017. Fluid distributions during light hydrocarbon charges into oil reservoirs using multicomponent maxwell-stefan diffusivity in gravitational field. Fuel, 209, 211-223.
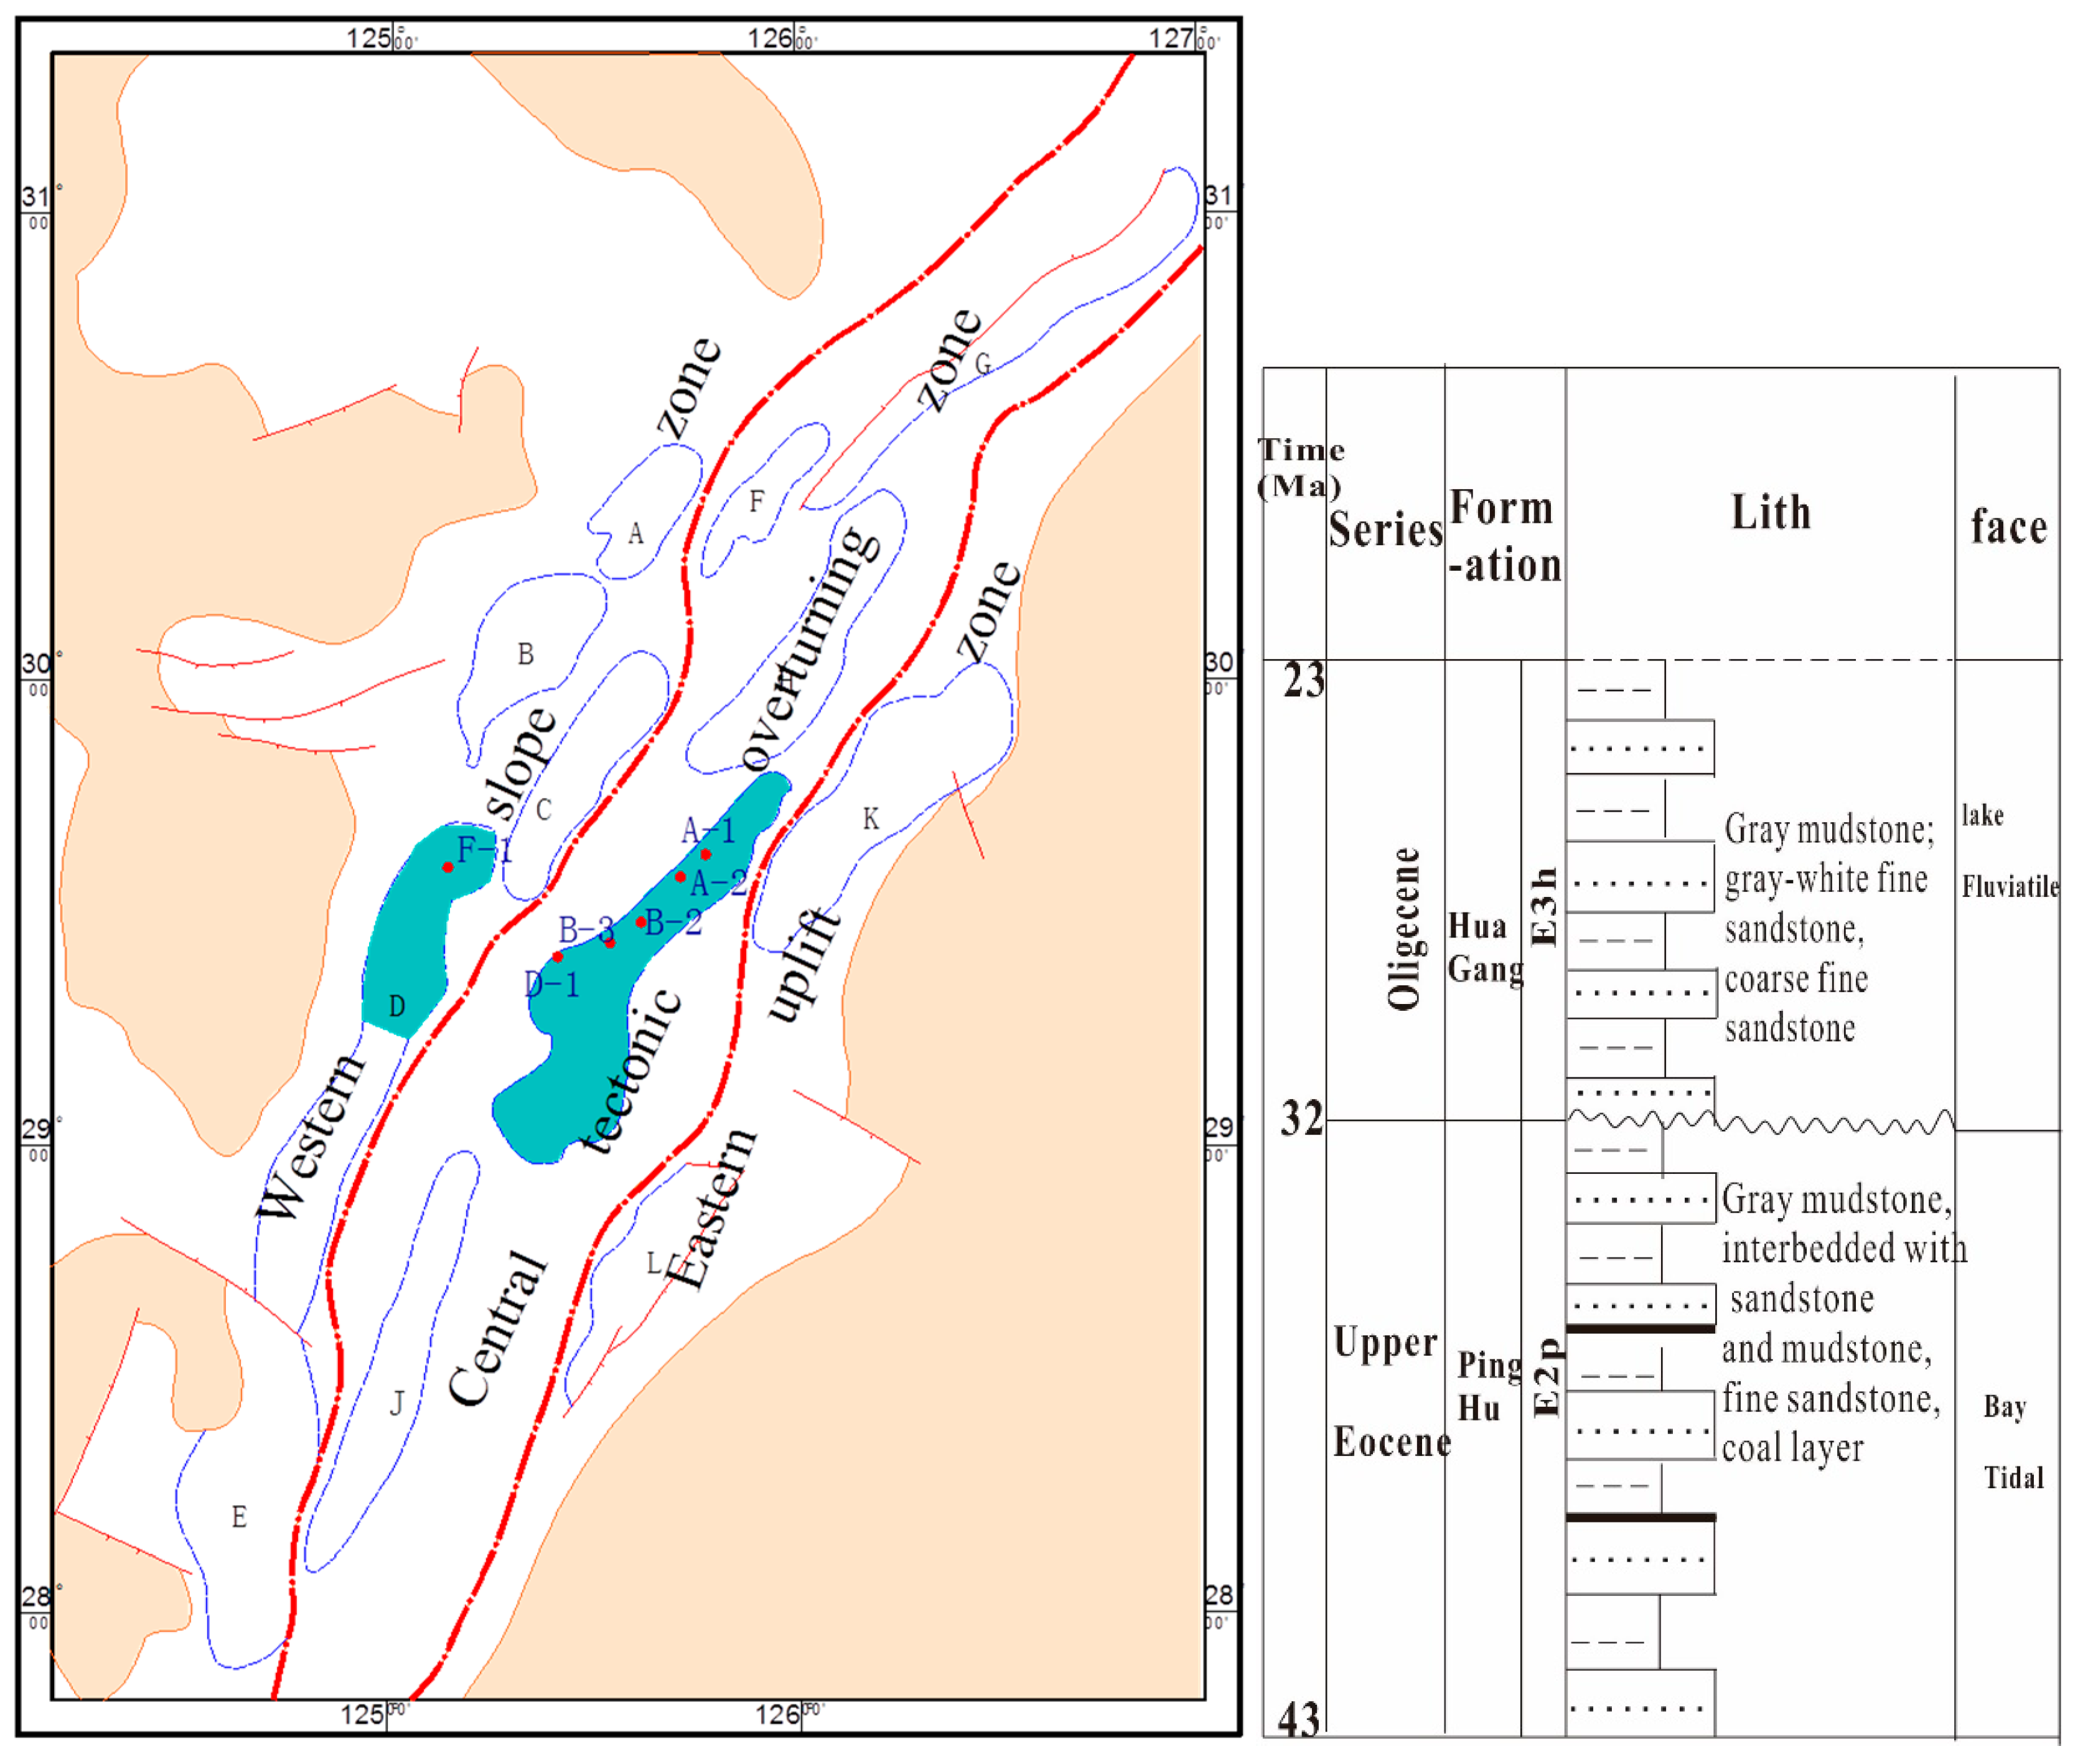
| NO. | Well | Formation | Depth | Lithology | Length | Diameter | Pore% | PermeabiltymD | SPB | GWD-MRI | Cen-NMR |
|---|---|---|---|---|---|---|---|---|---|---|---|
| A1 | A-1 | H3 | 3449 | Fine sandstone | 3.71 | 2.47 | 7.6 | 0.091 | √ | √ | |
| A4 | A-1 | H4 | 3823.1 | Fine sandstone | 4.07 | 2.47 | 11.2 | 1.946 | √ | ||
| A5 | A-1 | H4 | 3831.6 | Fine sandstone | 3.64 | 2.47 | 10.6 | 1.018 | √ | ||
| A7 | A-2 | H3 | 3614.9 | Fine sandstone | 3.53 | 2.47 | 10 | 8.152 | √ | √ | |
| A10 | A-2 | H6 | 4320.9 | Fine sandstone | 3.36 | 2.48 | 8 | 0.344 | √ | √ | |
| A17 | B-2 | H3b | 3752.7 | Fine sandstone | 4.03 | 2.51 | 10.7 | 2.623 | √ | ||
| A20 | B-2 | H4b | 4008 | Fine sandstone | 4.07 | 2.47 | 7.5 | 0.291 | √ | ||
| A25 | D-1 | H3 | 4324.9 | Fine sandstone | 3.47 | 2.49 | 8.2 | 1.394 | √ | √ | |
| A26 | D-1 | H8 | 5106.9 | Fine sandstone | 3.39 | 2.47 | 8.5 | 0.369 | √ | √ | |
| A45 | F-1 | P10 | 4106.86 | sandstone | 3.05 | 2.49 | 12.5 | 5.292 | √ | √ |
| Well | Depth m | Rock Density g/cm3 |
Porosity % |
Permeability mD |
Sw of Sealed Cores % |
|---|---|---|---|---|---|
| A-4 | 3507.1 | 2.38 | 10.3 | 4.6 | 52.3 |
| A-4 | 3507.4 | 2.35 | 11.2 | 6.5 | 50.8 |
| A-4 | 3507.66 | 2.34 | 11.7 | 12.2 | 47.6 |
| A-4 | 3509.53 | 2.44 | 7.8 | 0.28 | 61.3 |
| A-4 | 3510.01 | 2.36 | 10.6 | 1.5 | 42.8 |
| A-4 | 3510.41 | 2.38 | 9.9 | 1.2 | 47.6 |
| A-4 | 3510.76 | 2.39 | 9.6 | 0.95 | 52.3 |
| A-4 | 3511.13 | 2.40 | 9.2 | 0.92 | 56.4 |
| A-4 | 3511.39 | 2.37 | 10.3 | 0.63 | 43.5 |
| A-4 | 3511.71 | 2.42 | 8.4 | 0.65 | 55.0 |
| A-4 | 3512.11 | 2.39 | 9.5 | 1.0 | 49.9 |
| A-4 | 3512.38 | 2.55 | 4.2 | 0.06 | 37.1 |
| A-4 | 3512.78 | 2.34 | 11.4 | 2.5 | 40.1 |
| A-4 | 3513.1 | 2.39 | 9.5 | 1.7 | 49.7 |
| A-4 | 3513.43 | 2.36 | 10.5 | 2.4 | 48.5 |
| A-4 | 3514.03 | 2.36 | 10.6 | 2.7 | 49.3 |
| A-4 | 3514.45 | 2.37 | 10.6 | 1.1 | 48.6 |
| A-4 | 3514.61 | 2.38 | 10.8 | 1.7 | 51.9 |
Disclaimer/Publisher’s Note: The statements, opinions and data contained in all publications are solely those of the individual author(s) and contributor(s) and not of MDPI and/or the editor(s). MDPI and/or the editor(s) disclaim responsibility for any injury to people or property resulting from any ideas, methods, instructions or products referred to in the content. |
© 2023 by the authors. Licensee MDPI, Basel, Switzerland. This article is an open access article distributed under the terms and conditions of the Creative Commons Attribution (CC BY) license (http://creativecommons.org/licenses/by/4.0/).


