Submitted:
16 March 2023
Posted:
21 March 2023
You are already at the latest version
Abstract
Keywords:
1. Introduction
2. Method
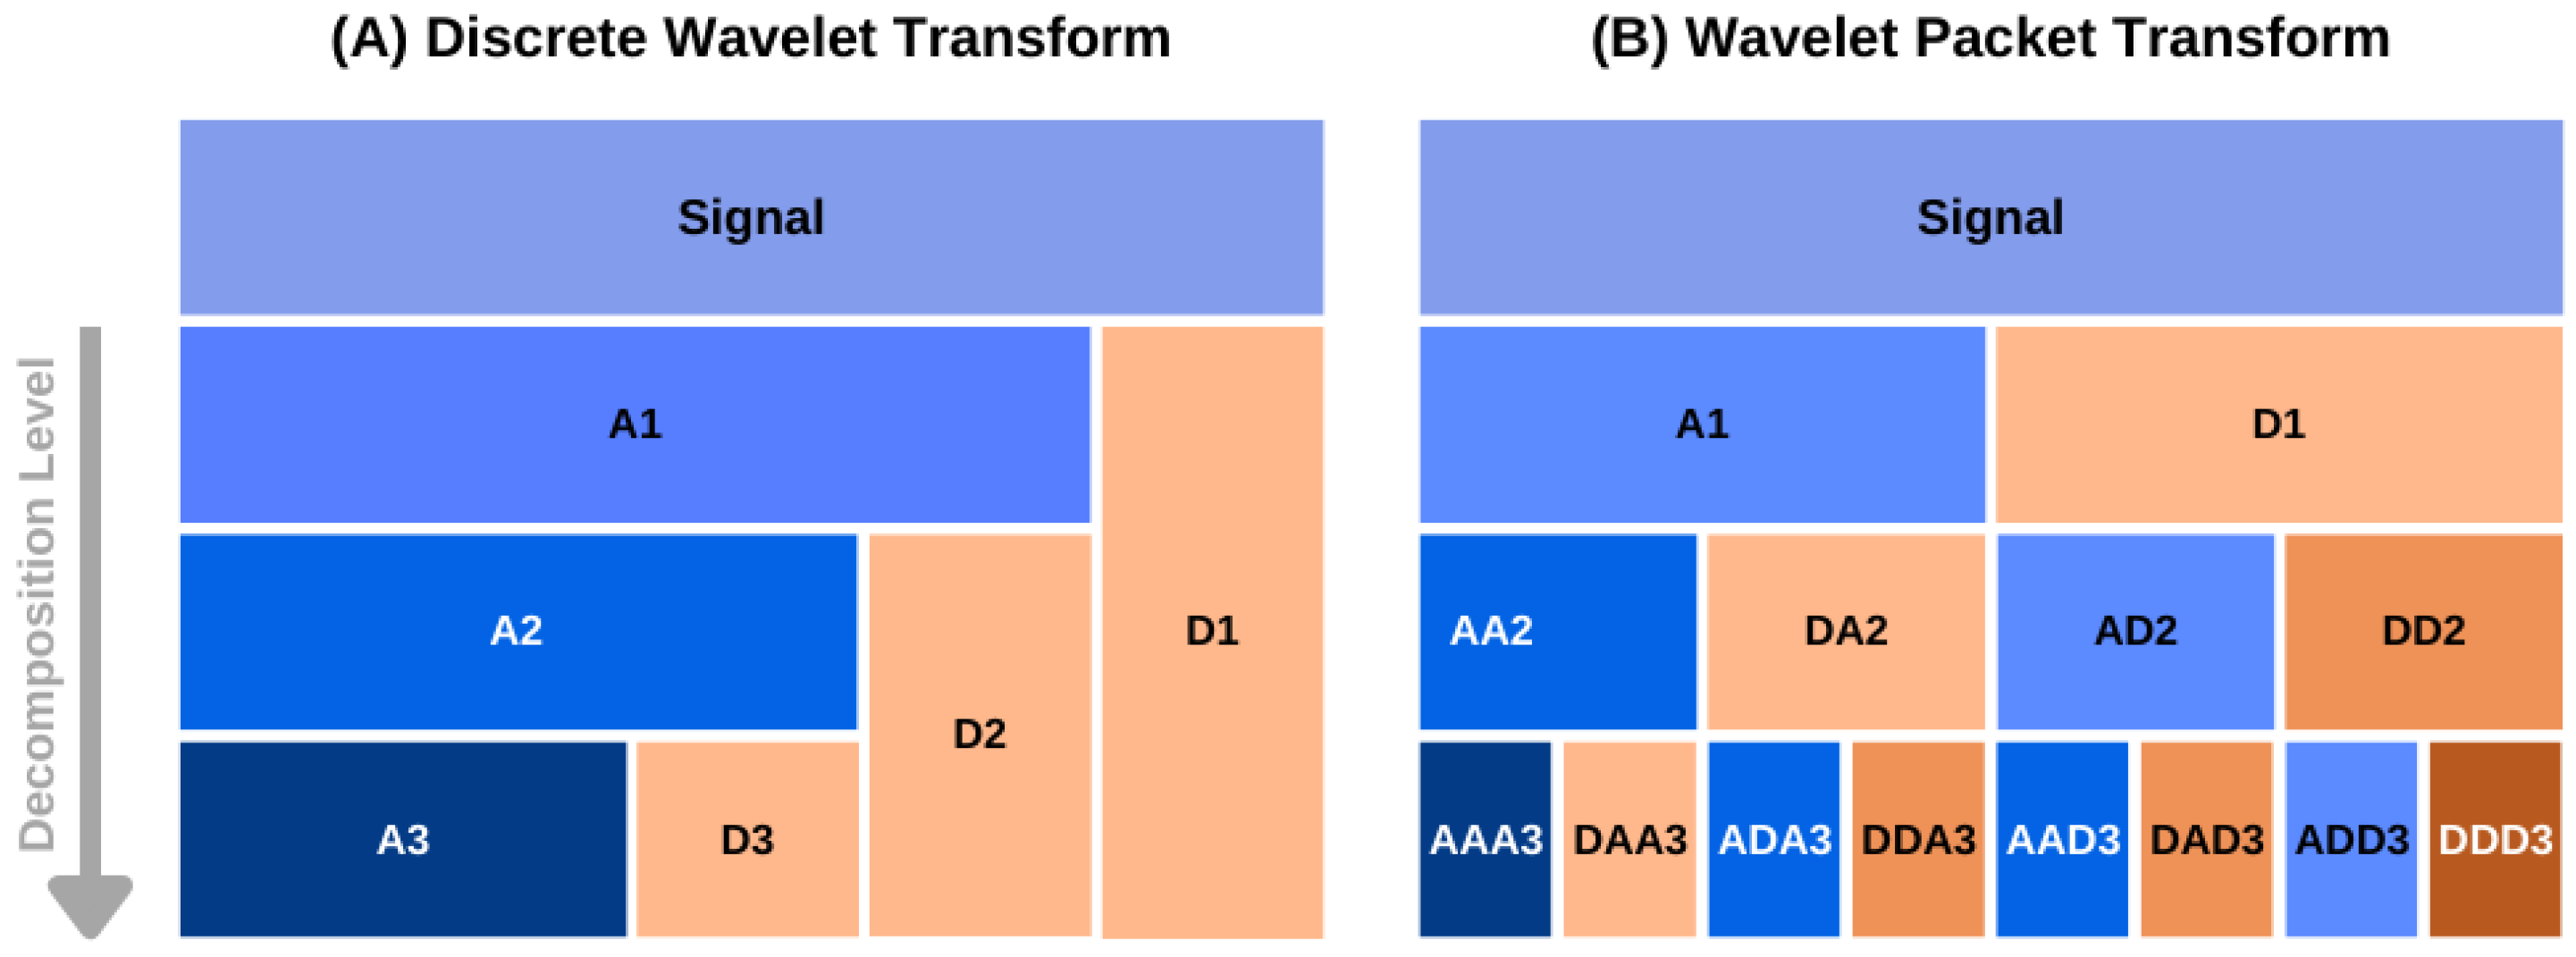
2.1. Overview of the Wavelet Packet Transform Theory
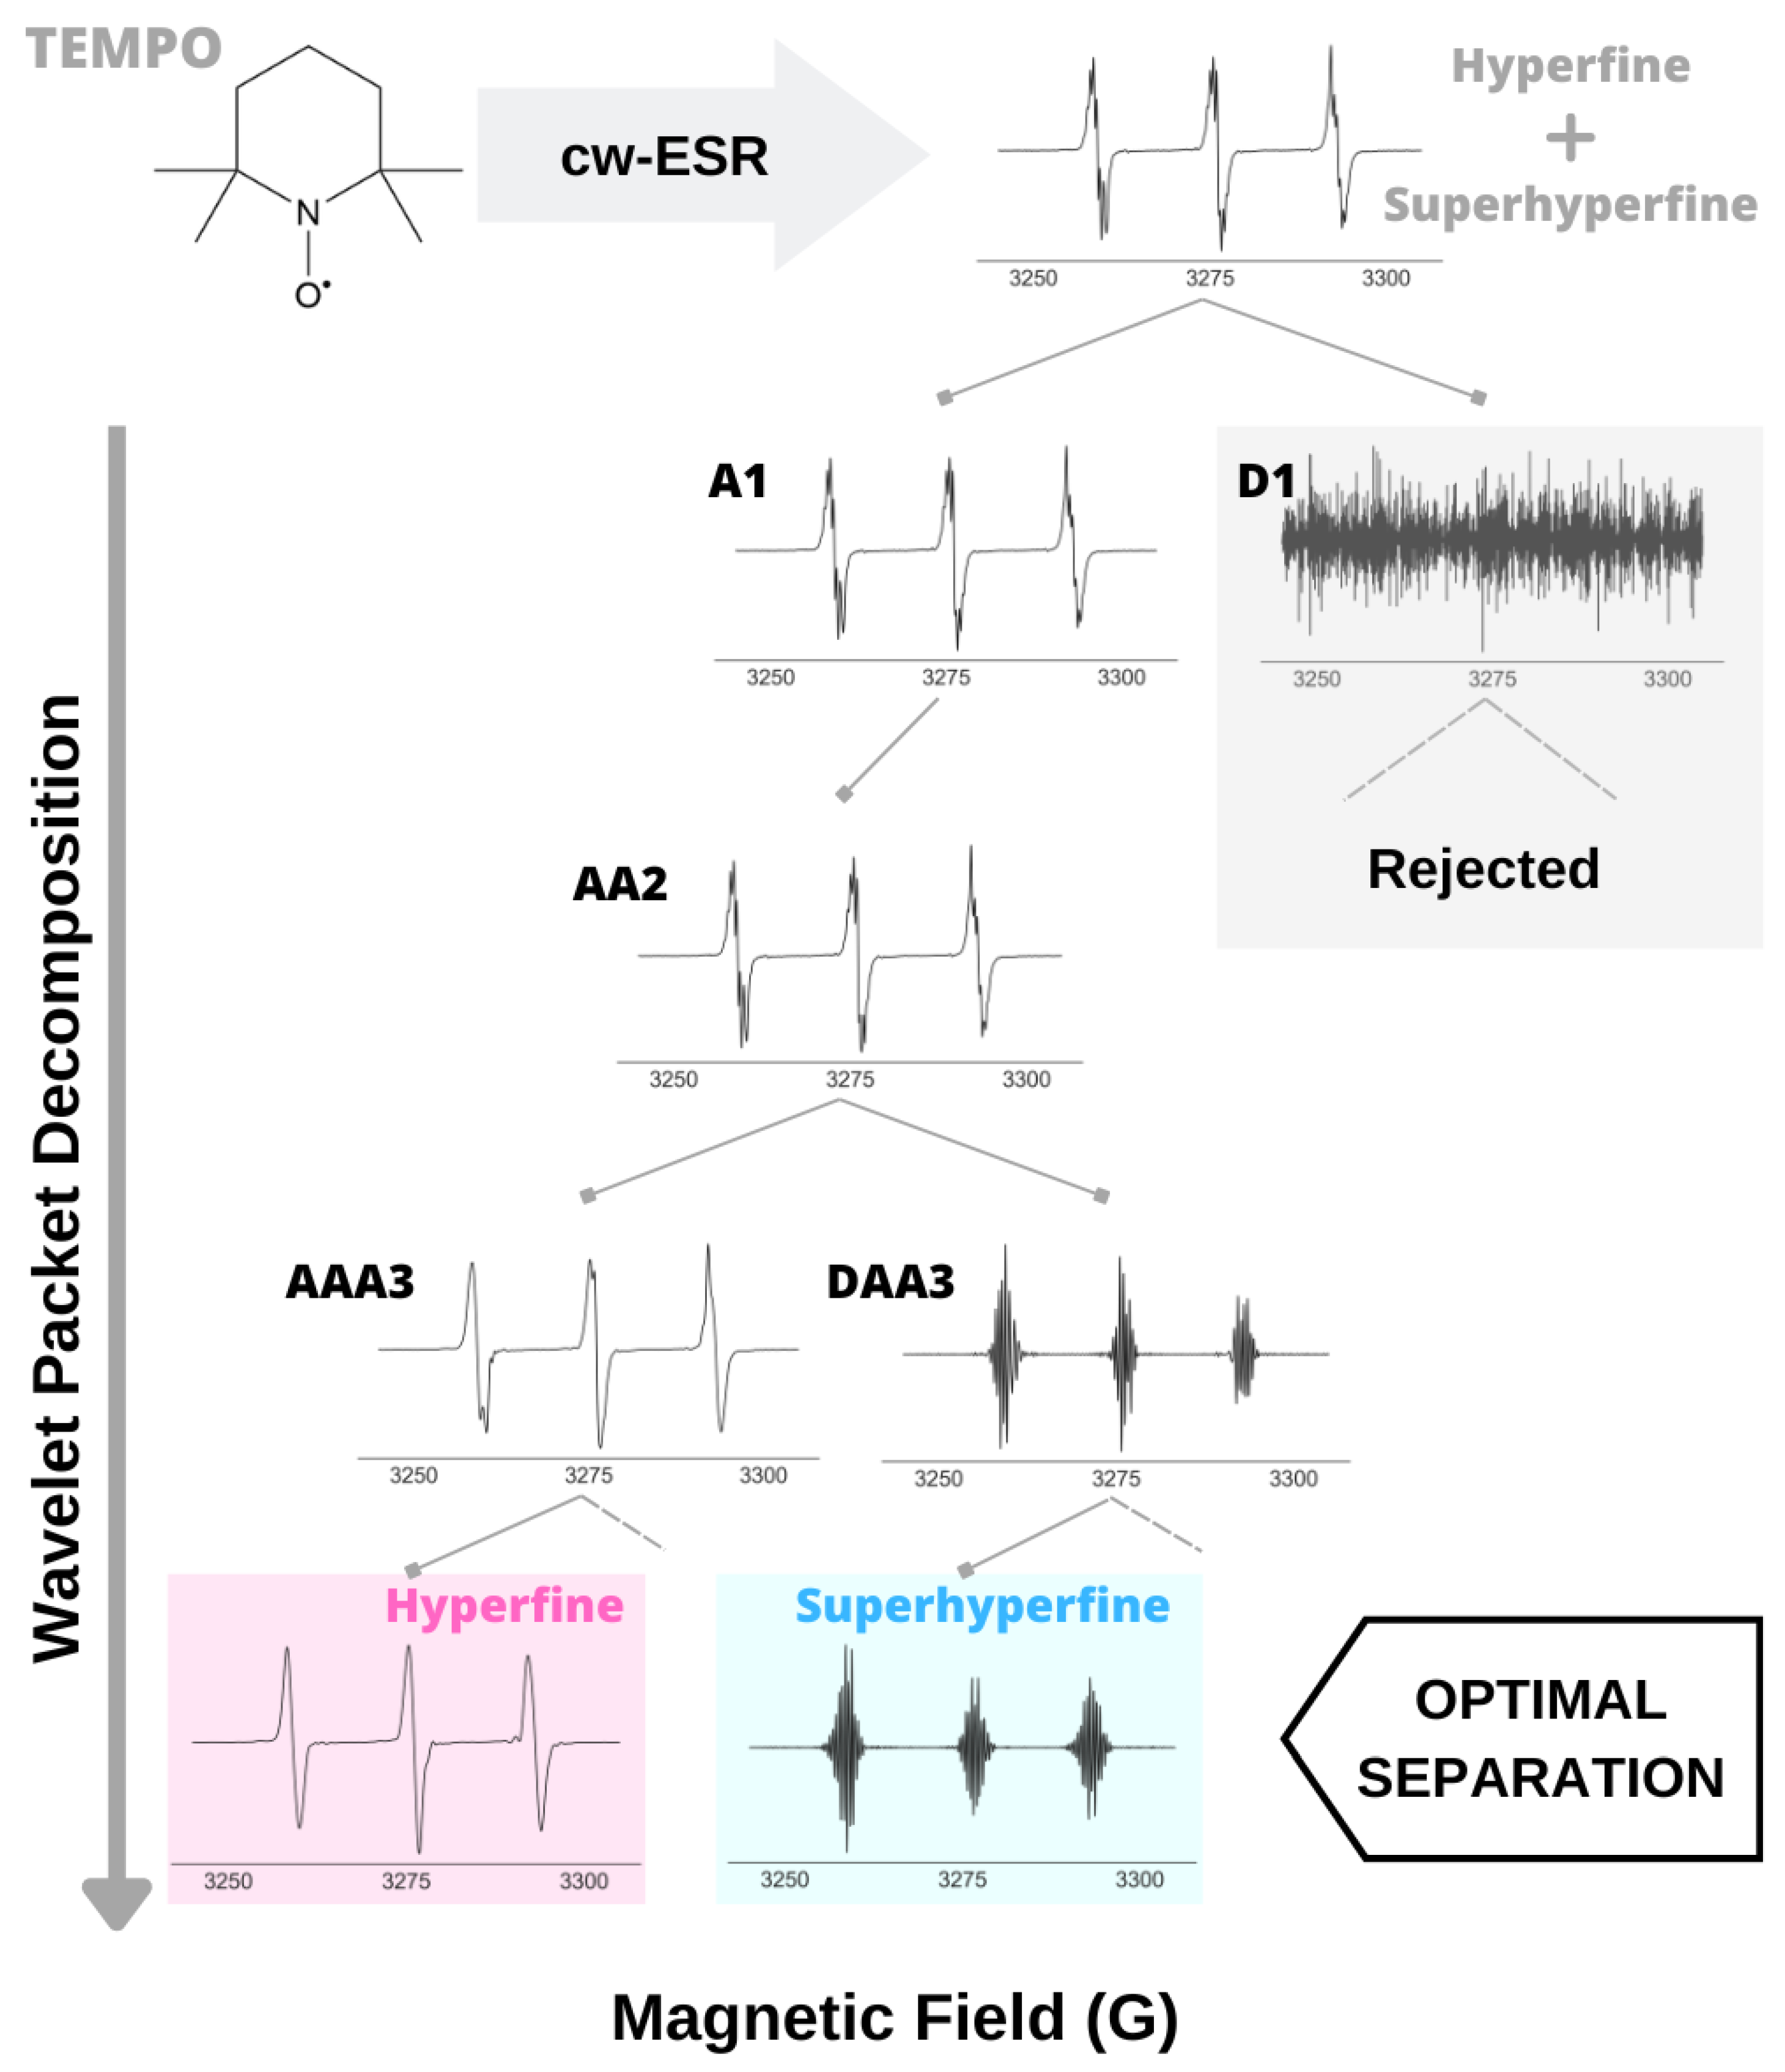
2.2. A Case Study: WPT Analysis of cw ESR Spectrum of Tempo
3. Materials
3.1. Experimental Section
3.1.1. Synthesis
- Copper quinoline (CuQuA): 160.0 mg (1.0 mM) 2-amino-8-quinolinol was taken in an 80.0 mL Schlenk flask with a magnetic stirrer bar and 15.0 mL methanol was added to make it a homogeneous yellow colour solution. 85.0 mg (0.49 mM) was taken separately with 10 mL MeOH in another Schlenk flask under the steam of . Then, the two methanolic solutions were charged under nitrogen flow. An immediate dark brown solution appeared after adding the metal salt to the ligand. Reducing the solvent with continuous /Ar flashing whitish deep brownish precipitate was observed. The reaction mixture was further stirred for two hours for completion with purging. Then the precipitate was collected, washed with hexane and diethyl ether and dried under a high vacuum (yield= 137.0 mg, 76% w.r.t. 2-amino-8-quinolinol). XRD-suitable crystals (CCDC 2127156) were grown from slow diffusion from methanol/diethyl ether solution.
- Copper quinone (CuQu): Synthesized as reported above, where 8-hydroxyquinoline was utilized as the precursor ligand (yield= 120.0 mg).
- Copper AHAHARA: The AHAHARA peptide was synthesized by manual Fmoc solid-phase synthesis at elevated temperature using Amide Rink resin, Fmoc-protected amino acids and previously reported protocols [33].
- SOD1:H48Q: The recombinant SOD1:H48Q protein, replacing a histidine with glutamine, was expressed and purified as described in a previous work [34].
3.2. ESR Experiments
3.3. ESR Spectral Mix
4. Results and Discussion
4.1. Validation of the Analysis
4.2. Robustness Against Wavelet Selection
4.3. Spectral Analysis of Partially Resolved ESR Spectra
4.4. Analysis of Multi-Component ESR Spectra
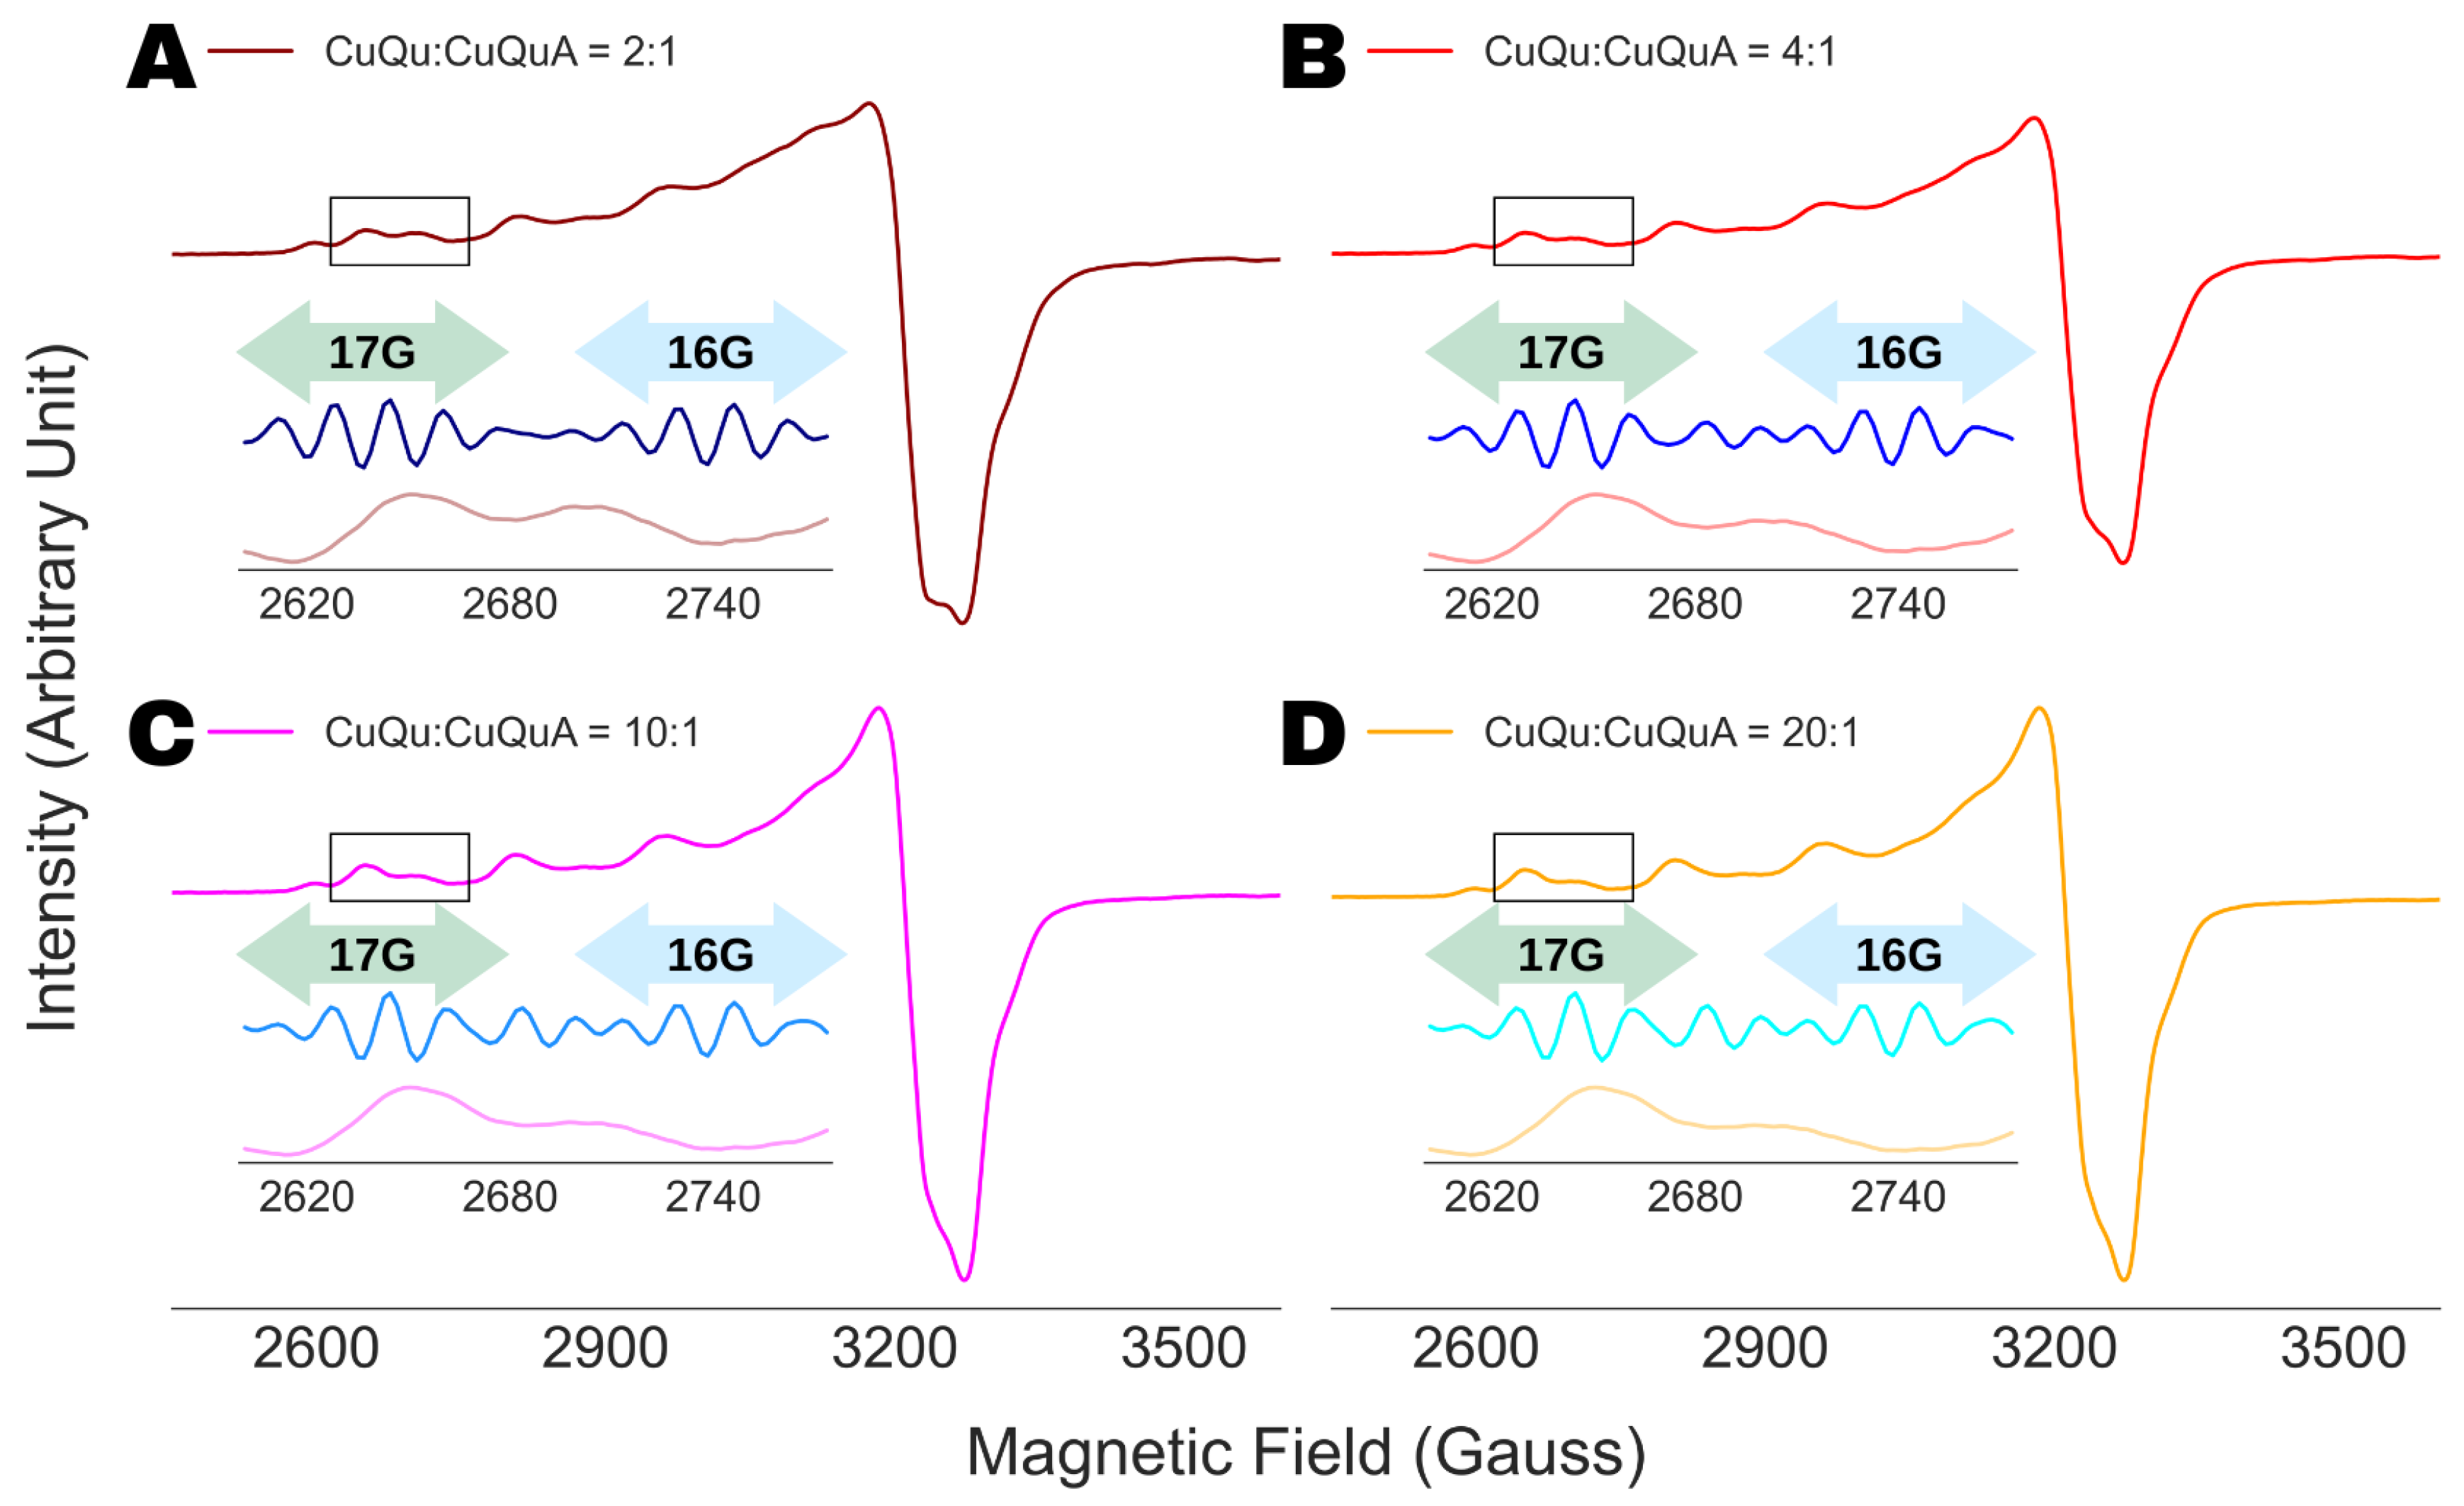
5. Conclusions
Author Contributions
Funding
Data Availability Statement
Conflicts of Interest
Abbreviations
| ESR | Electron spin resonance |
| WPT | Wavelet packet transform |
| NERD | Noise Elimination and Reduction via Denoising |
| SOD1 | Superoxide dismutase-1 |
References
- Mabbs, F.E.; Collison, D. Electron paramagnetic resonance of d transition metal compounds. Elsevier, 2013. [Google Scholar]
- Fukuzumi, S.; Ohkubo, K. Quantitative evaluation of Lewis acidity of metal ions derived from the g values of ESR spectra of superoxide: Metal ion complexes in relation to the promoting effects in electron transfer reactions. Chemistry–A European Journal 2000, 6, 4532–4535. [Google Scholar] [CrossRef]
- Matsuda, K.; Takayama, K.; Irie, M. Photochromism of metal complexes composed of diarylethene ligands and Zn (II), Mn (II), and Cu (II) hexafluoroacetylacetonates. Inorganic Chemistry 2004, 43, 482–489. [Google Scholar] [CrossRef] [PubMed]
- Raman, N.; Dhaveethu Raja, J.; Sakthivel, A. Synthesis, spectral characterization of Schiff base transition metal complexes: DNA cleavage and antimicrobial activity studies. Journal of Chemical Sciences 2007, 119, 303–310. [Google Scholar] [CrossRef]
- Lund, A.; Shiotani, M.; Shimada, S. Principles and applications of ESR spectroscopy. Springer Science & Business Media, 2011. [Google Scholar]
- Kohno, M. Applications of electron spin resonance spectrometry for reactive oxygen species and reactive nitrogen species research. Journal of Clinical Biochemistry and Nutrition 2010, 1006170036. [Google Scholar] [CrossRef] [PubMed]
- Khramtsov, V.V.; Volodarsky, L.B. Use of imidazoline nitroxides in studies of chemical reactions ESR measurements of the concentration and reactivity of protons, thiols, and nitric oxide. In Biological Magnetic Resonance; Springer, 2002; pp. 109–180. [Google Scholar]
- Lazreg, F.; Nahra, F.; Cazin, C.S. Copper–NHC complexes in catalysis. Coordination Chemistry Reviews 2015, 293, 48–79. [Google Scholar] [CrossRef]
- Ali, A.; Prakash, D.; Majumder, P.; Ghosh, S.; Dutta, A. Flexible Ligand in a Molecular Cu Electrocatalyst Unfurls Bidirectional O2/H2O Conversion in Water. ACS Catalysis 2021, 11, 5934–5941. [Google Scholar] [CrossRef]
- Chen, Z.; Meyer, T.J. Copper (II) catalysis of water oxidation. Angewandte Chemie International Edition 2013, 52, 700–703. [Google Scholar] [CrossRef]
- Weng, Z.; Wu, Y.; Wang, M.; Jiang, J.; Yang, K.; Huo, S.; Wang, X.F.; Ma, Q.; Brudvig, G.W.; Batista, V.S.; et al. Active sites of copper-complex catalytic materials for electrochemical carbon dioxide reduction. Nature Communications 2018, 9, 1–9. [Google Scholar] [CrossRef]
- Bolm, C.; Martin, M.; Gescheidt, G.; Palivan, C.; Neshchadin, D.; Bertagnolli, H.; Feth, M.; Schweiger, A.; Mitrikas, G.; Harmer, J. Spectroscopic investigations of bis (sulfoximine) copper (II) complexes and their relevance in asymmetric catalysis. Journal of the American Chemical Society 2003, 125, 6222–6227. [Google Scholar] [CrossRef]
- Bonke, S.A.; Risse, T.; Schnegg, A.; Brückner, A. In situ electron paramagnetic resonance spectroscopy for catalysis. Nature Reviews Methods Primers 2021, 1, 33. [Google Scholar] [CrossRef]
- Sánchez-Moreno, C. Methods used to evaluate the free radical scavenging activity in foods and biological systems. Food Science and Technology International 2002, 8, 121–137. [Google Scholar] [CrossRef]
- Okano, H. Effects of static magnetic fields in biology: Role of free radicals. Frontiers in Bioscience-Landmark 2008, 13, 6106–6125. [Google Scholar] [CrossRef]
- Yin, H.; Xu, L.; Porter, N.A. Free radical lipid peroxidation: Mechanisms and analysis. Chemical Reviews 2011, 111, 5944–5972. [Google Scholar] [CrossRef]
- Eaton, G.R.; Eaton, S.S.; Barr, D.P.; Weber, R.T. Quantitative EPR. Springer Science & Business Media, 2010. [Google Scholar]
- Murphy, D.M.; Farley, R.D. Principles and applications of ENDOR spectroscopy for structure determination in solution and disordered matrices. Chemical Society Reviews 2006, 35, 249–268. [Google Scholar] [CrossRef] [PubMed]
- Golombek, A.P.; Hendrich, M.P. Quantitative analysis of dinuclear manganese (II) EPR spectra. Journal of Magnetic Resonance 2003, 165, 33–48. [Google Scholar] [CrossRef]
- Drew, S.C.; Young, C.G.; Hanson, G.R. A density functional study of the electronic structure and spin hamiltonian parameters of mononuclear thiomolybdenyl complexes. Inorganic Chemistry 2007, 46, 2388–2397. [Google Scholar] [CrossRef] [PubMed]
- Cox, N.; Jin, L.; Jaszewski, A.; Smith, P.J.; Krausz, E.; Rutherford, A.W.; Pace, R. The semiquinone-iron complex of photosystem II: Structural insights from ESR and theoretical simulation; evidence that the native ligand to the non-heme iron is carbonate. Biophysical Journal 2009, 97, 2024–2033. [Google Scholar] [CrossRef]
- Trukhan, S.N.; Yakushkin, S.S.; Martyanov, O.N. Fine-tuning simulation of the ESR spectrum– Sensitive tool to identify the local environment of asphaltenes in situ. The Journal of Physical Chemistry C 2022. [Google Scholar] [CrossRef]
- Stoll, S.; Schweiger, A. EasySpin, a comprehensive software package for spectral simulation and analysis in EPR. Journal of Magnetic Resonance 2006, 178, 42–55. [Google Scholar] [CrossRef]
- Khairy, K.; Budil, D.; Fajer, P. Nonlinear-least-squares analysis of slow motional regime EPR spectra. Journal of Magnetic Resonance 2006, 183, 152–159. [Google Scholar] [CrossRef]
- Srivastava, M.; Dzikovski, B.; Freed, J.H. Extraction of Weak Spectroscopic Signals with High Fidelity: Examples from ESR. The Journal of Physical Chemistry A 2021, 125, 4480–4487. [Google Scholar] [CrossRef] [PubMed]
- Roy, A.S.; Srivastava, M. Hyperfine Decoupling of ESR Spectra Using Wavelet Transform. Magnetochemistry 2022, 8, 32. [Google Scholar] [CrossRef] [PubMed]
- Sinha Roy, A.; Srivastava, M. Analysis of Small-Molecule Mixtures by Super-Resolved 1H NMR Spectroscopy. The Journal of Physical Chemistry A 2022, 126, 9108–9113. [Google Scholar] [CrossRef]
- Sinha Roy, A.; Srivastava, M. Unsupervised Analysis of Small Molecule Mixtures by Wavelet-Based Super-Resolved NMR. Molecules 2023, 28, 792. [Google Scholar] [CrossRef]
- Srivastava, M.; Anderson, C.L.; Freed, J.H. A New Wavelet Denoising Method for Selecting Decomposition Levels and Noise Thresholds. IEEE Access 2016, 4, 3862–3877. [Google Scholar] [CrossRef]
- Addison, P. The Illustrated Wavelet Transform Handbook: Introductory Theory and Applications in Science, Engineering, Medicine and Finance, 2 ed; CRC Press: London, UK, 2016. [Google Scholar]
- Wang, Q.; Johnson, J.L.; Agar, N.Y.; Agar, J.N. Protein aggregation and protein instability govern familial amyotrophic lateral sclerosis patient survival. PLoS Biology 2008, 6, e170. [Google Scholar] [CrossRef]
- Pratt, A.J.; Shin, D.S.; Merz, G.E.; Rambo, R.P.; Lancaster, W.A.; Dyer, K.N.; Borbat, P.P.; Poole, F.L.; Adams, M.W.; Freed, J.H.; others. Aggregation propensities of superoxide dismutase G93 hotspot mutants mirror ALS clinical phenotypes. Proceedings of the National Academy of Sciences 2014, 111, E4568–E4576. [Google Scholar] [CrossRef] [PubMed]
- Makhlynets, O.V.; Gosavi, P.M.; Korendovych, I.V. Short Self-Assembling Peptides Are Able to Bind to Copper and Activate Oxygen. Angewandte Chemie International Edition 2016, 55, 9017–9020. [Google Scholar] [CrossRef]
- Merz, G.E.; Borbat, P.P.; Pratt, A.J.; Getzoff, E.D.; Freed, J.H.; Crane, B.R. Copper-based pulsed dipolar ESR spectroscopy as a probe of protein conformation linked to disease states. Biophysical Journal 2014, 107, 1669–1674. [Google Scholar] [CrossRef]
- Ernst, R.; Anderson, W. Sensitivity enhancement in magnetic resonance. II. Investigation of intermediate passage conditions. Review of Scientific Instruments 1965, 36, 1696–1706. [Google Scholar] [CrossRef]
- Portis, A. Rapid passage effects in electron spin resonance. Physical Review 1955, 100, 1219. [Google Scholar] [CrossRef]
- Noël, S.; Perez, F.; Pedersen, J.T.; Alies, B.; Ladeira, S.; Sayen, S.; Guillon, E.; Gras, E.; Hureau, C. A new water-soluble Cu (II) chelator that retrieves Cu from Cu (amyloid-β) species, stops associated ROS production and prevents Cu (II)-induced Aβ aggregation. Journal of Inorganic Biochemistry 2012, 117, 322–325. [Google Scholar] [CrossRef] [PubMed]
- Bunda, S.; May, N.V.; Bonczidai-Kelemen, D.; Udvardy, A.; Ching, H.V.; Nys, K.; Samanipour, M.; Van Doorslaer, S.; Joo, F.; Lihi, N. Copper (II) complexes of sulfonated salan ligands: Thermodynamic and spectroscopic features and applications for catalysis of the Henry reaction. Inorganic Chemistry 2021, 60, 11259–11272. [Google Scholar] [CrossRef] [PubMed]

| Molecule | Structure | ESR Frequency (GHz) |
|---|---|---|
| Tempo |  |
9.33 |
| Tempol |  |
9.33 |
| SOD1:H48Q | SOD1 mutant, histidine (48) replaced with glutamine | 9.26 |
| Cu-AHAHARA | A complex of Cu (II) and AHAHARA peptide: C-terminus as amide and N-terminus as acetyl group | 9.39 |
| CuQu |  |
9.316 |
| CuQuA |  |
9.316 |
Disclaimer/Publisher’s Note: The statements, opinions and data contained in all publications are solely those of the individual author(s) and contributor(s) and not of MDPI and/or the editor(s). MDPI and/or the editor(s) disclaim responsibility for any injury to people or property resulting from any ideas, methods, instructions or products referred to in the content. |
© 2023 by the authors. Licensee MDPI, Basel, Switzerland. This article is an open access article distributed under the terms and conditions of the Creative Commons Attribution (CC BY) license (http://creativecommons.org/licenses/by/4.0/).


