1. Introduction
The so-called interlaminar astrocytes of the mammalian isocortex were first described well over one hundred years ago [
1] and further characterized in recent years [
2], [
3], [
4], [
5]. These astrocytes display marked differences from the better-known, bushy, proto- plasmic astrocytes of the cortex. They project long, unbranched cell processes, usually oriented orthogonally to the pial surface, through several cortical layers, forming cascades of parallel processes. A subset of astrocytes in the deep cortical layers near the subcortical white matter also project similar, radially-oriented processes into the lower cortical layers. Immunocytochemical studies reveal that these long-process astrocytes contain CD44 [
6] [
4], a cell surface receptor for extracellular matrix molecules, including osteopontin, hya- luronan, laminin, and integrins [
7]. They are different from the protoplasmic astro- cytes, which do not contain detectable levels of CD44 [
4,
8], not only in morphology, but are also low in glutamine synthetase (GS) and the two glutamate transporters, EAAT1 and EAAT2 [
4]. However, CD44 can be increased in astrocytes in response to pathological conditions [
4,
8]. The astrocytes in white matter are also CD44+ [
4,
8,
9].
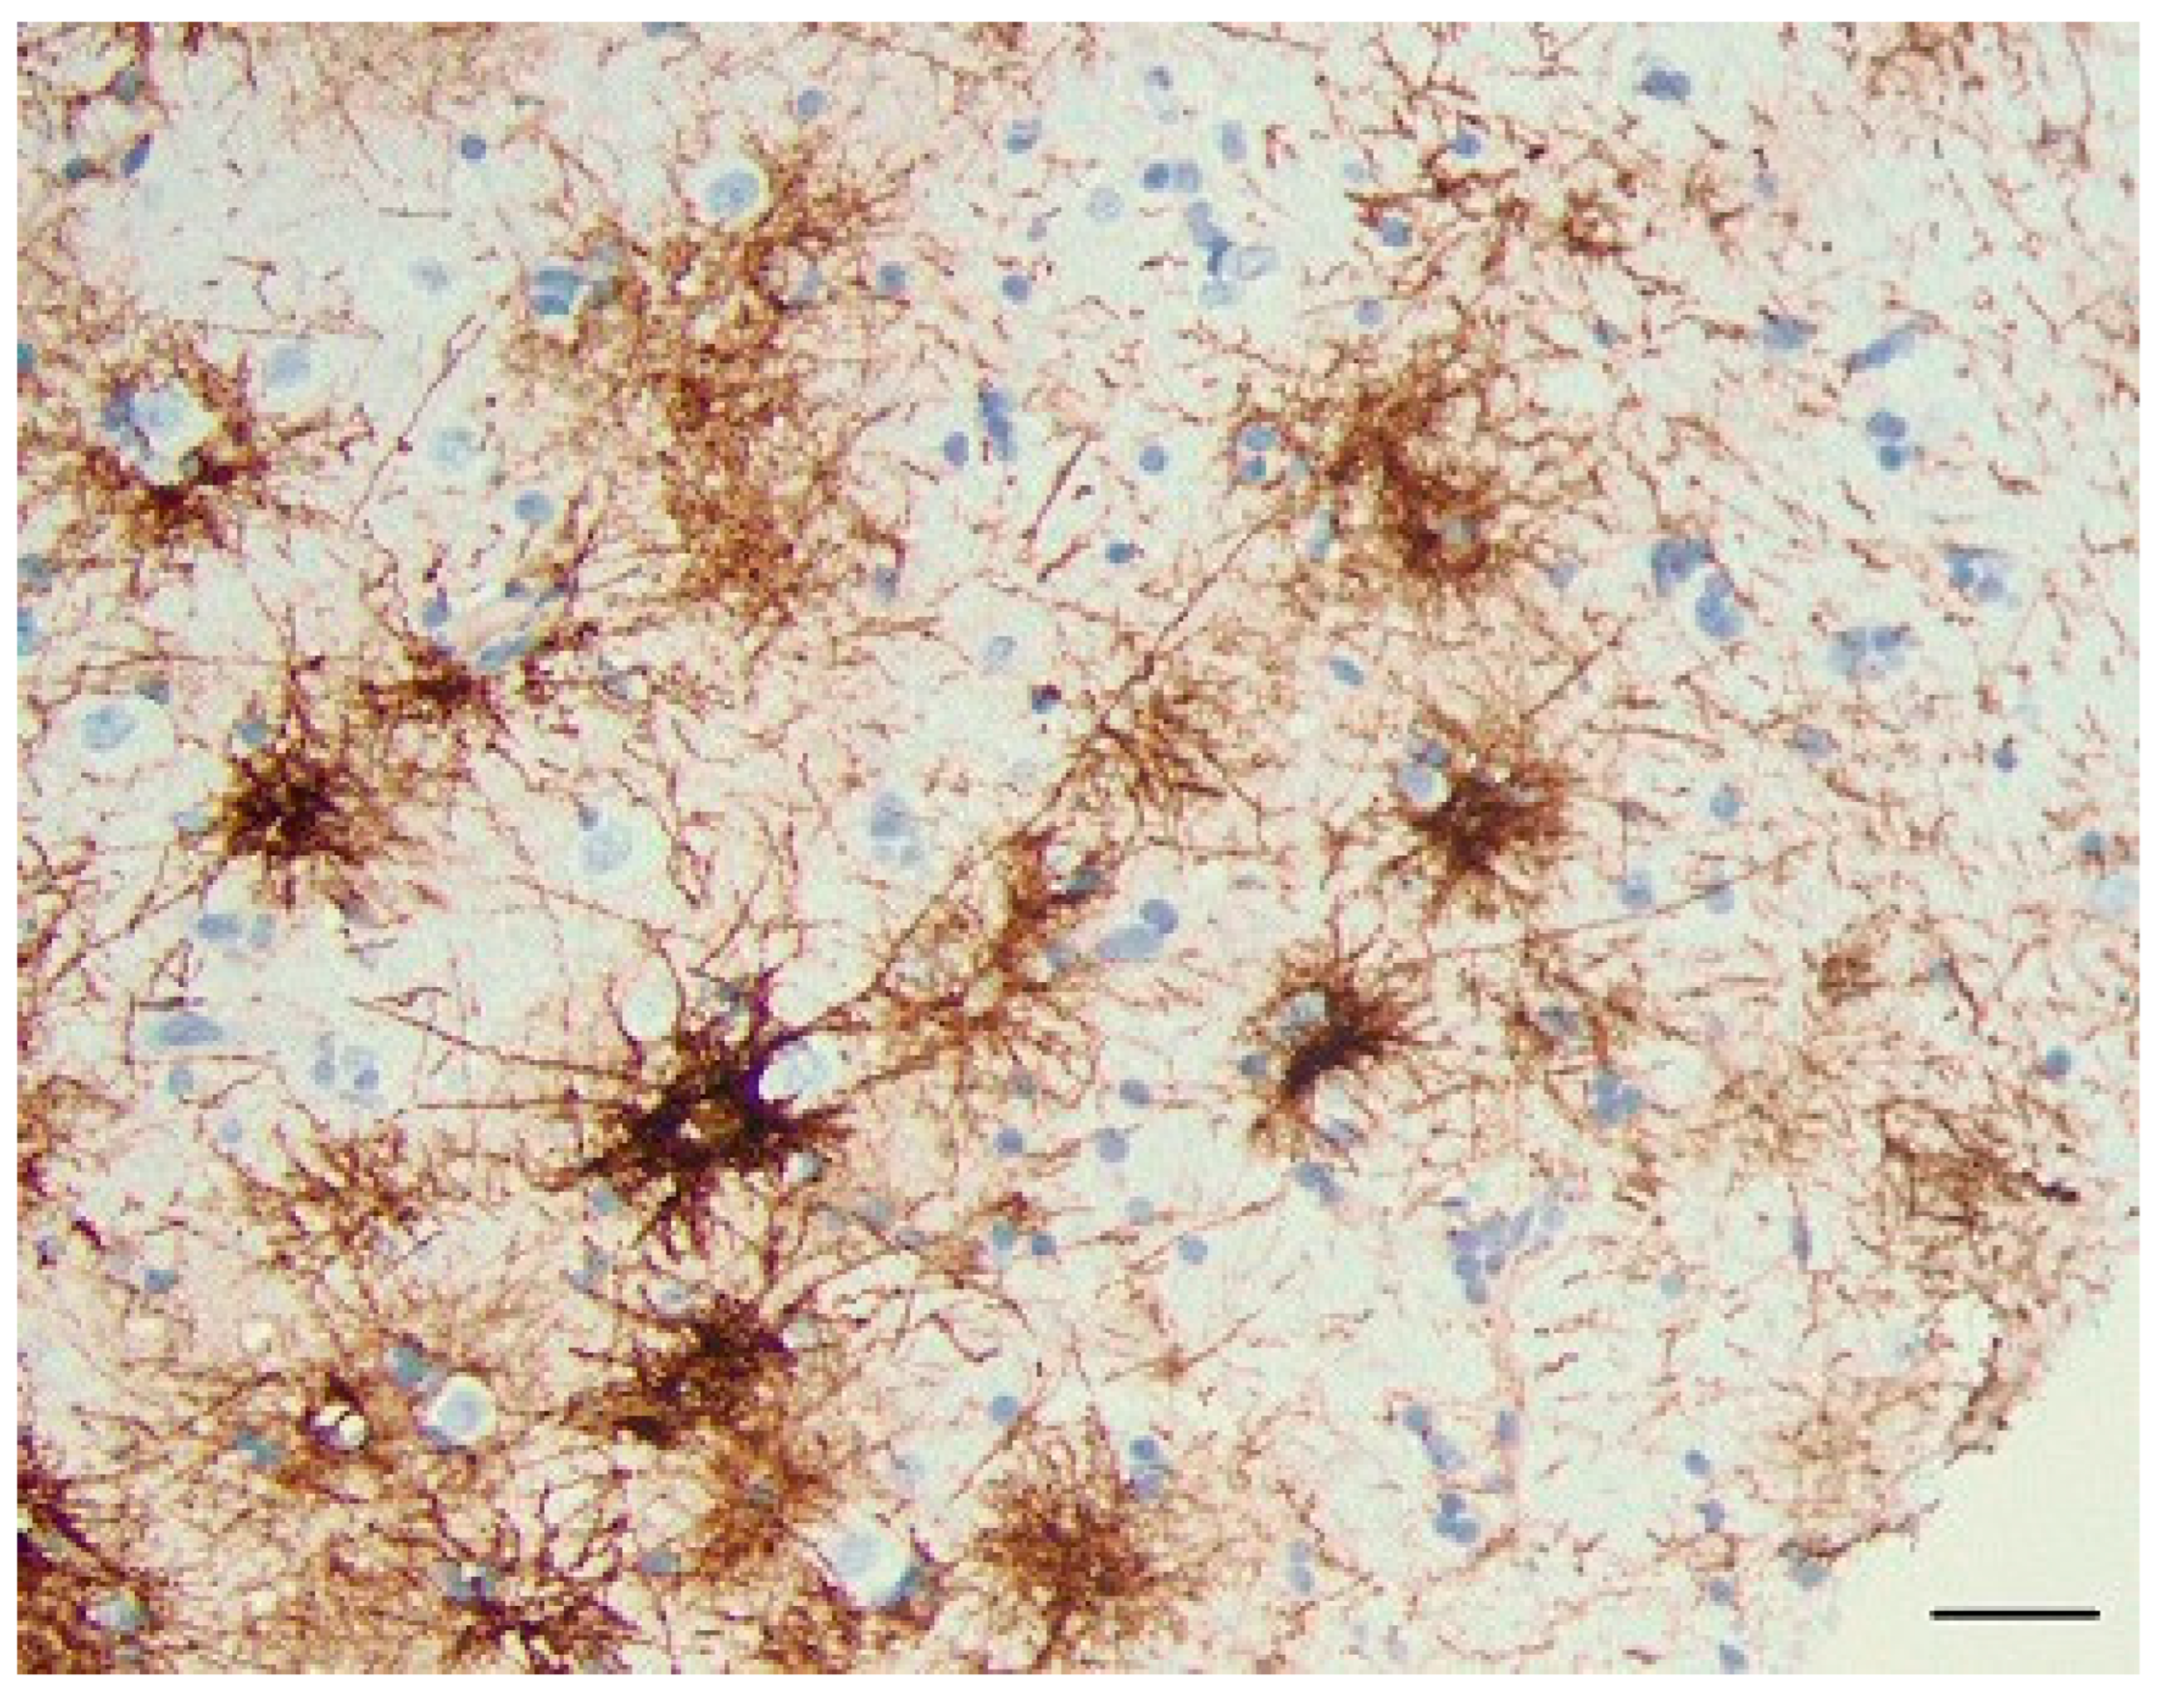
We have now examined other parts of the human CNS and found that CD44+ astro- cytes are common in every part of the CNS, including cortex, striatum, thalamus, brain- stem, cerebellum, and spinal cord. In all areas we found CD44 associated with long-process astrocytes. CD44+ astrocytes populate white matter, subependymal zones, as well as subpial areas. We found that the proximity of CD44+ processes to neuronal cell bodies varies considerably. In particular, unlike neurons in the isocortex and dienceph- alon, the motor neurons of the brainstem and spinal cord show a close apposition of CD44+ processes, and even were encircled by these processes. We raise the issue of whether this apposition may suggest a novel, intimate relationship between neurons and CD44+ astrocytes for specific neuronal classes.
In this study we have also examined biopsy and autopsy material from individuals who had experienced hypoxic events and seizures and found that protoplasmic astrocytes accumulate CD44 in these pathological conditions,
2. Materials and Methods
Human Autopsy and Biopsy Material
Eight autopsy brains, fixed in 10% formalin for 10 days after removal, were sectioned coronally and samples from all areas of the CNS, including superior frontal, cingulate, and striate cortices with subcortical white matter, hippocampus with temporal isocor- tex, basal ganglia, thalamus, midbrain, pons, medulla, cerebellum with cortex and dentate nucleus, and spinal cord were removed and embedded in paraffin blocks, cut at 7mm thickness, and mounted on glass slides. Patients’ ages ranged from 27 to 74, 6 were fe- male, 2 were male. None of these brains showed evidence of neuropathology except for mild atherosclerosis and arteriolosclerosis and acute but mild hypoxic/ischemic changes. In addition, we sampled sections of anterior striatum from 3 more autopsies (ages in years and sex 1M, 76F, 94F), sections of hippocampus from 8 more autopsies (ages in years and sex 1M, 2M, 5M, 7M, 73M, 71M, 76M, 66M), and sections of spinal cord from 4 more au- topsies (ages in years and sex 27F, 66M, 80M, 80M). We also sampled sets of sections of cerebral hemispheres containing the subependymal zone at the lateral ventricle, from 8 fetal and neonatal brains, ranging in age from 19 to 40 weeks of gestation and 1 day to 7 weeks of postnatal life. All autopsies were performed with the consent of the next of kin, and all protocols were approved by the Institutional Review Board of Columbia Univer- sity Medical Center.
Epilepsy Surgical Specimens
We examined 9 samples of temporal isocortex of patients with mesial temporal scle- rosis (ages ranged from 12 – 55; 6M, 3F). We also examined 5 samples of hippocampi from patients with mesial temporal sclerosis (ages ranged from 9 – 66; 3M, 2F) obtained from surgical resections from patients with medically intractable epilepsy. We did not include specimens from seizure patients with brain tumors, vascular malformations, cor- tical dysplasias, and inflammatory and infectious disorders, although we found that many of them also show CD44+ astrocytes.
Hypoxia Specimens
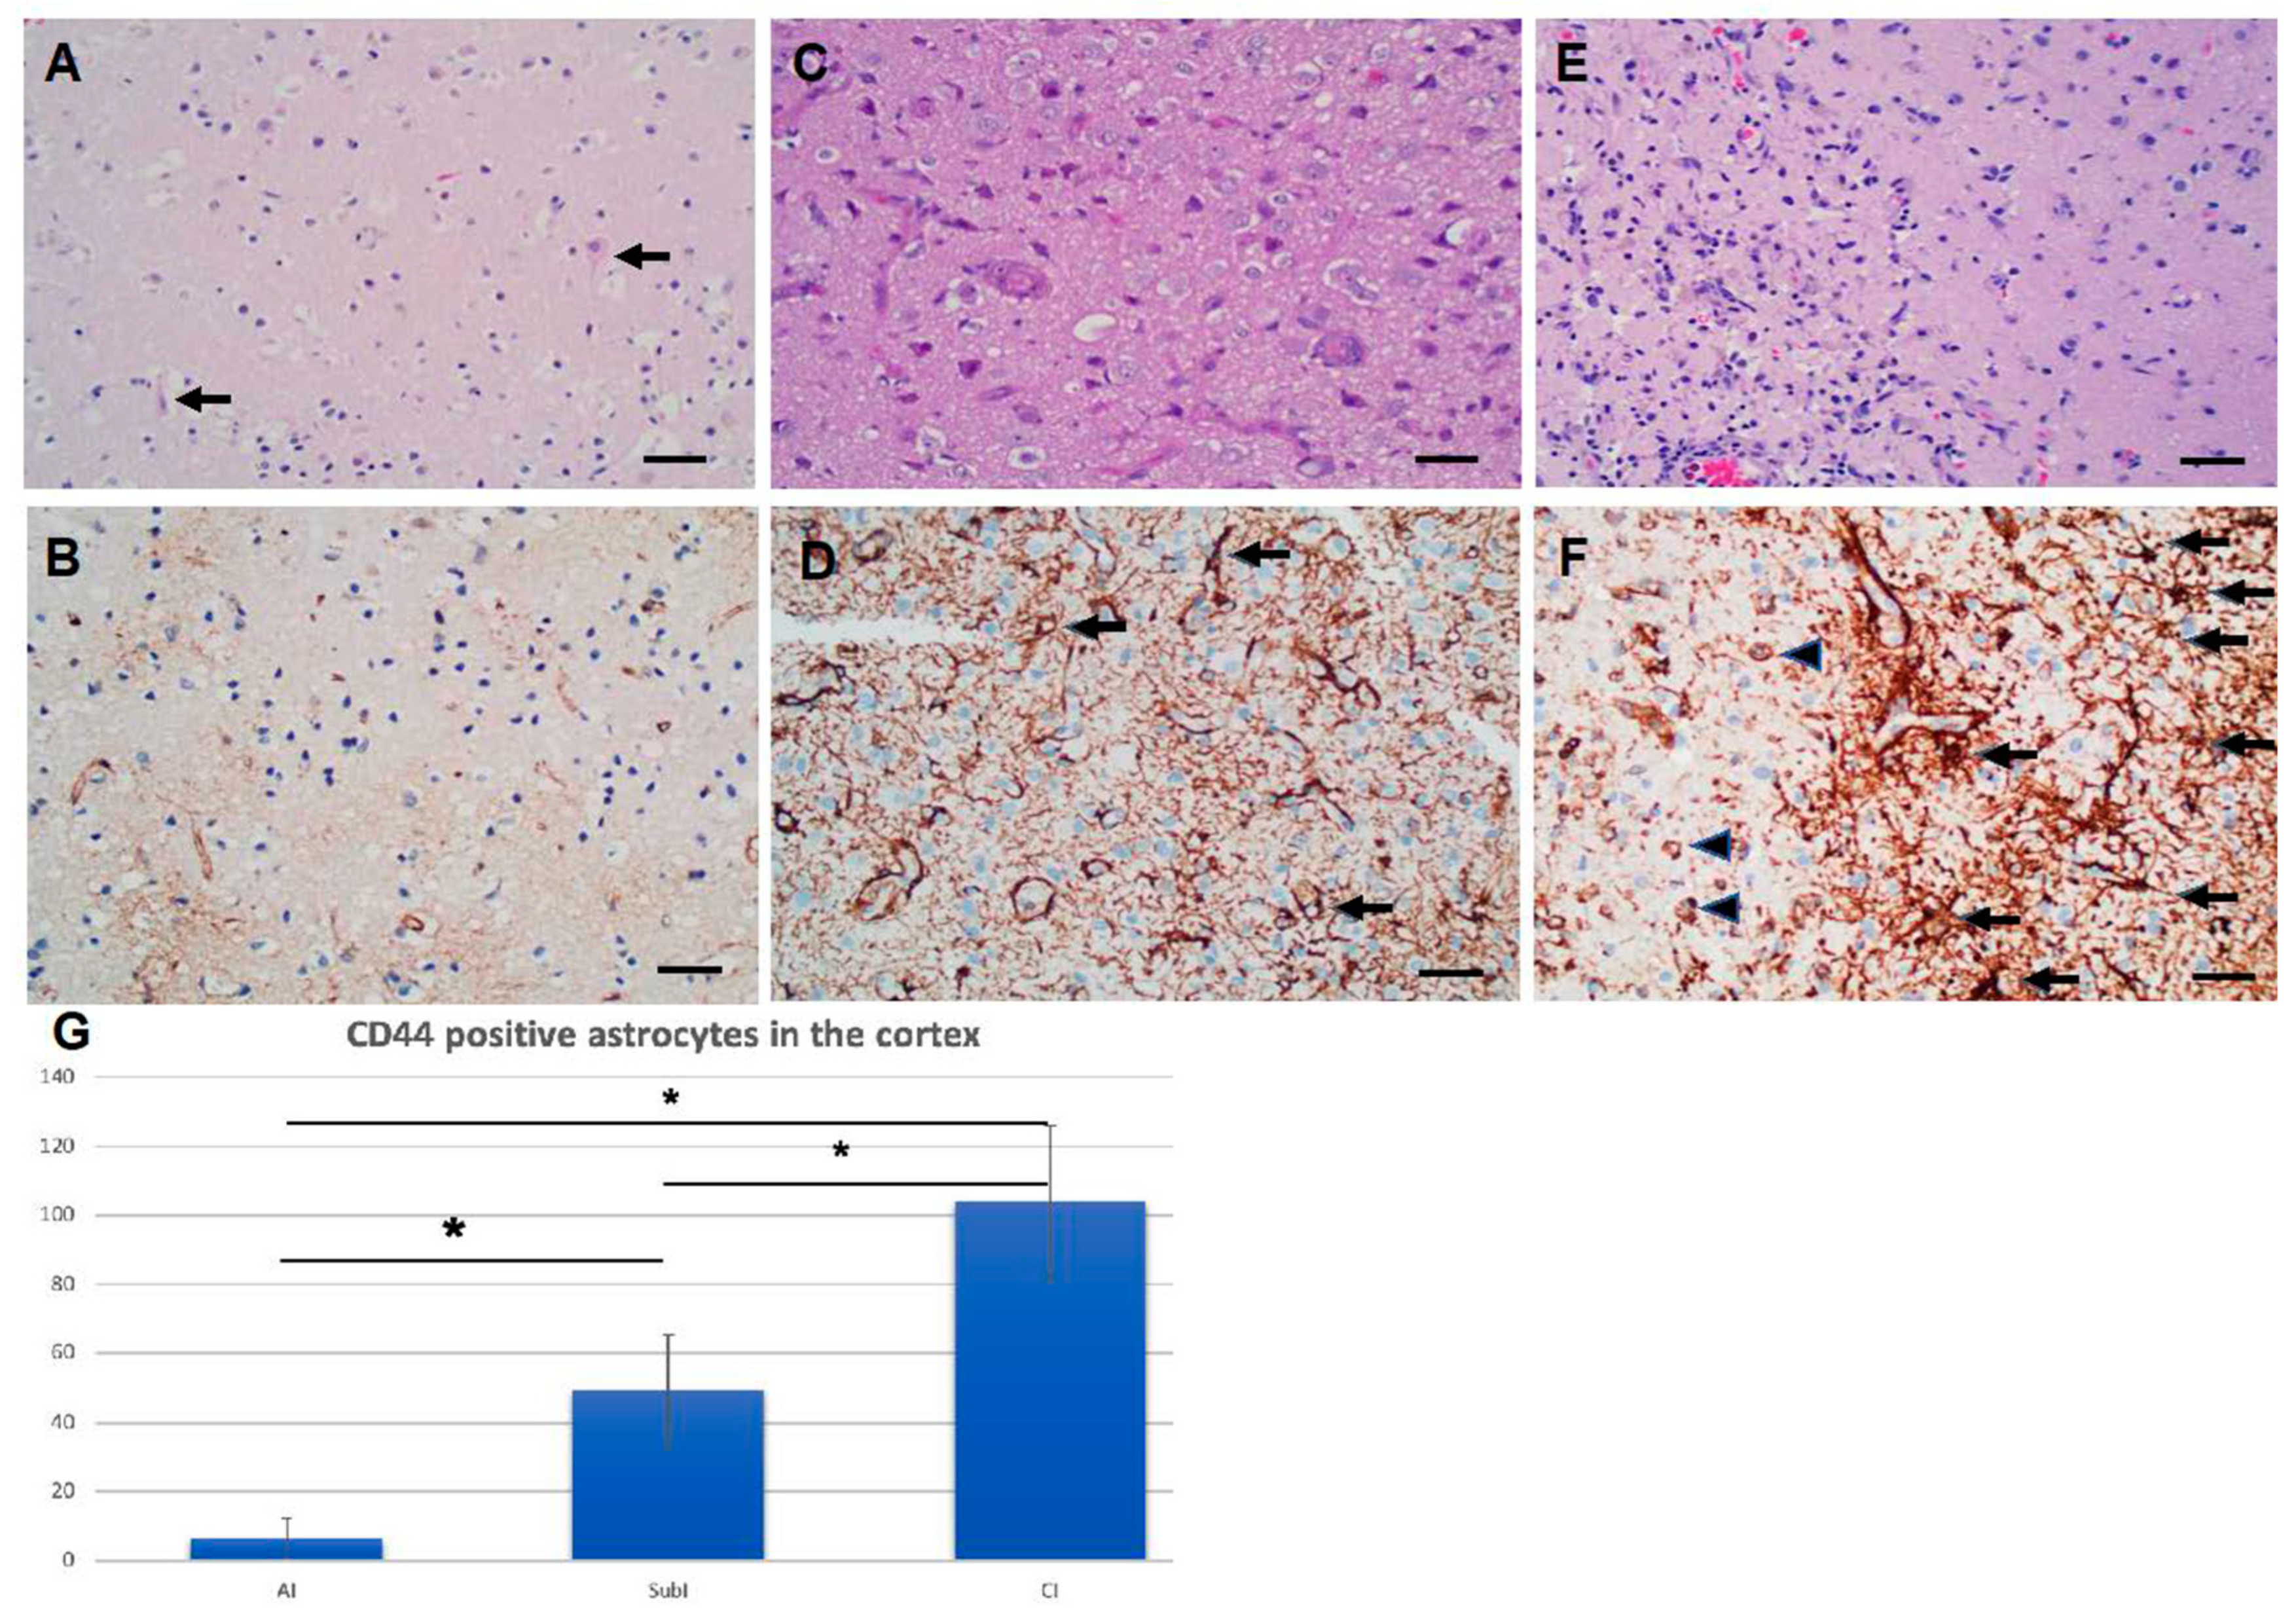
Eight neurosurgical specimens that represented hypoxic/ischemic insults were se- lected. We used both the time between the initial clinical presentation and the biopsy and the neuropathology to classify these as acute, subacute, or chronic hypoxic/ischemic changes, acute within a few days and showing eosinophilic neuronal change but no reac- tivities of blood vessels, astrocytes or microglia, subacute between 10 and 14 days and showing proliferative vasculature and reactive astrocytes and microglia with macro- phages, and chronic more than 14 days and showing tissue necrosis with foamy macro- phages. Some of the biopsies showed acute and subacute or subacute and chronic changes, indicating progressive changes in the evolution of the lesions. The age range was 19 – 82, 3M, 5F. CD44 positive astrocytes were counted in three 20x power fields from each case. Sample T- tests were performed between pairs of the three groups.
Rodent Hypoxia/Ischemia and Seizure Models
Adult male rats were housed in standard cages with free access to food and water on a 12-h light/dark cycle. All procedures performed on animals were approved by Columbia University’s Institutional Animal Care and Use Committee and conducted according to Institutional and Federal guidelines.
Stroke/Transient Middle Cerebral Artery Occlusion (tMCAO)
Rats were subjected to unilateral tMCAO [
10]. Wistar rats (275–300 g) were sub- jected to transient middle cerebral artery occlusion using intraluminal vascular occlusion. Animals were anesthetized with halothane in a mix of 70% nitrous oxide/30% oxygen, core temperatures were maintained at 37 °C throughout the entire procedure and for 60 min after reperfusion. The right common carotid artery, the right external carotid ar- tery, and the right internal carotid artery were exposed and isolated. MCAO was accom- plished by advancing a 25 mm 4–0 nylon suture with a blunted silicone tip (outer diame- ter, 0.38 mm) through an incision in the external carotid artery until the suture was 18 mm past the carotid bifurcation. MCAO was confirmed by transcranial measurements of cer- ebral blood flow via laser Doppler flowmetry (Periflux System 5000; Perimed, Inc., Järfälla, Sweden). After 120 min, the suture was removed, and reperfusion was confirmed by laser Doppler flowmetry. After 96 h, animals were deeply anesthetized with an overdose of ket- amine/xylazine, and perfused with 4% PFA. After perfusion brains were removed and additionally fixed in 4% PFA in PBS for 14–18 h (40 C). 40 µm sections were prepared with a vibratome (Leica VT1000S) and stored in cryoprotectant solution at − 200 C. After per- fusion brains were dissected and incubated at 4°C with 4% PFA (24 hr), 1x PBS (24 hr), and 30% sucrose in 1xPBS., then embedded in O.C.T. and 20µm cryosections were pre- pared.
Pilocarpine Induced Status Epilepticus
Seizures were produced in rats with pilocarpine, as described elsewhere [
11]. After premedication with scopolamine (5 mg/kg, i.p.) to prevent the effects of peripheral cho- linergic stimulation, pilocarpine (330 mg/kg, i.p.) was administered to Sprague-Dawley rats (100–150 g) to induce seizures. Seizures were graded on the modified Racine scale [
12] and only animals with grade 4–5 seizures for 2 h were used in experiments. After 2 h of continuous seizures, ketamine (80 mg/kg, i.p.) was administered to stop seizures, and a second dose (40 mg/kg, i.p.) was administered if seizures did not stop in 10 min after the first. After perfusion brains were removed and processed as above.
Immunostaining and Antibodies
Formalin-fixed paraffin-embedded sections were stained using hematoxylin and eo- sin (H&E). Immunohistochemistry with positive and negative controls was performed us- ing an antibody to CD44 (Roche, mouse monoclonal antibody pre-diluted at 1:100 and run on the Ventana platform using the Ultraview DAB kit). For immunofluorescence stain- ing of the rat MCAO occlusions and pilocarpine-induced seizures , we used a CD44 mouse monoclonal (1:80; clone F10-44-2, Dako) and a glial fibrillary acidic protein (GFAP) rabbit polyclonal (1:1000, Z 0334, Dako, Carpinteria, CA). Secondary antibodies conjugated to fluorophores: anti-mouse Alexa Fluor 488, 594, and 633, anti-rabbit Alexa Fluor 488, 594, and anti-goat Alexa Fluor 488, 594, 633; all from goat or donkey (1:300, ThermoFisher Sci- entific, Eugene, OR). After blocking with 10% normal goat (or donkey) serum (30 min, RT), free-floating sections were incubated in a mixture of primary antibodies overnight (40 C). Alexa Fluor-conjugated secondary antibodies were used for 1h at RT. For visualization of nuclei DAPI (5 µg /ml; D9542, Sigma-Aldrich) was applied with secondary antibodies. Blocking serum, primary, and secondary antibodies were applied in 0.2% Triton X-100 in PBS. Sections for fluorescence microscopy were mounted on slides in Vectashield (Vector Laboratories, Burlingame, CA). To control for the specificity of immunostaining, primaryantibodies were omitted and substituted with appropriate normal serum. Slides were viewed using a confocal microscope (Nikon Ti Eclipse). For immunofluorescence stain- ing of cerebellar sections we used 5-7µm thick FFPE sections, which were immunostained on a Leica Bond RXm™ which the following modifications: ater blocking in 10% donkey serum, sections were incubated with rabbit anti CD44 monoclonal antibody (abcam cat#ab101531, 1:100) and chicken anti-GFAP (Abcam cat# ab4674, 1:1000) using antigen retrieval with Leica ER2 antigen retrieval buffer for 20 minutes. The secondary antibodies were 488 donkey anti chicken and 568 donkey anti rabbit (1:500). Images were acquired at 40X on a Leica DMi8 Thunder system.
Quantification of CD44 in Hypoxia Sections
All CD44+ astrocytes were counted in 20X objective fields on a Nikon BX43 micro- scope. Three fields were counted per slide. Statistical analysis was done using ANOVA. Data is shown as mean +/- SEM.
Figure 1.
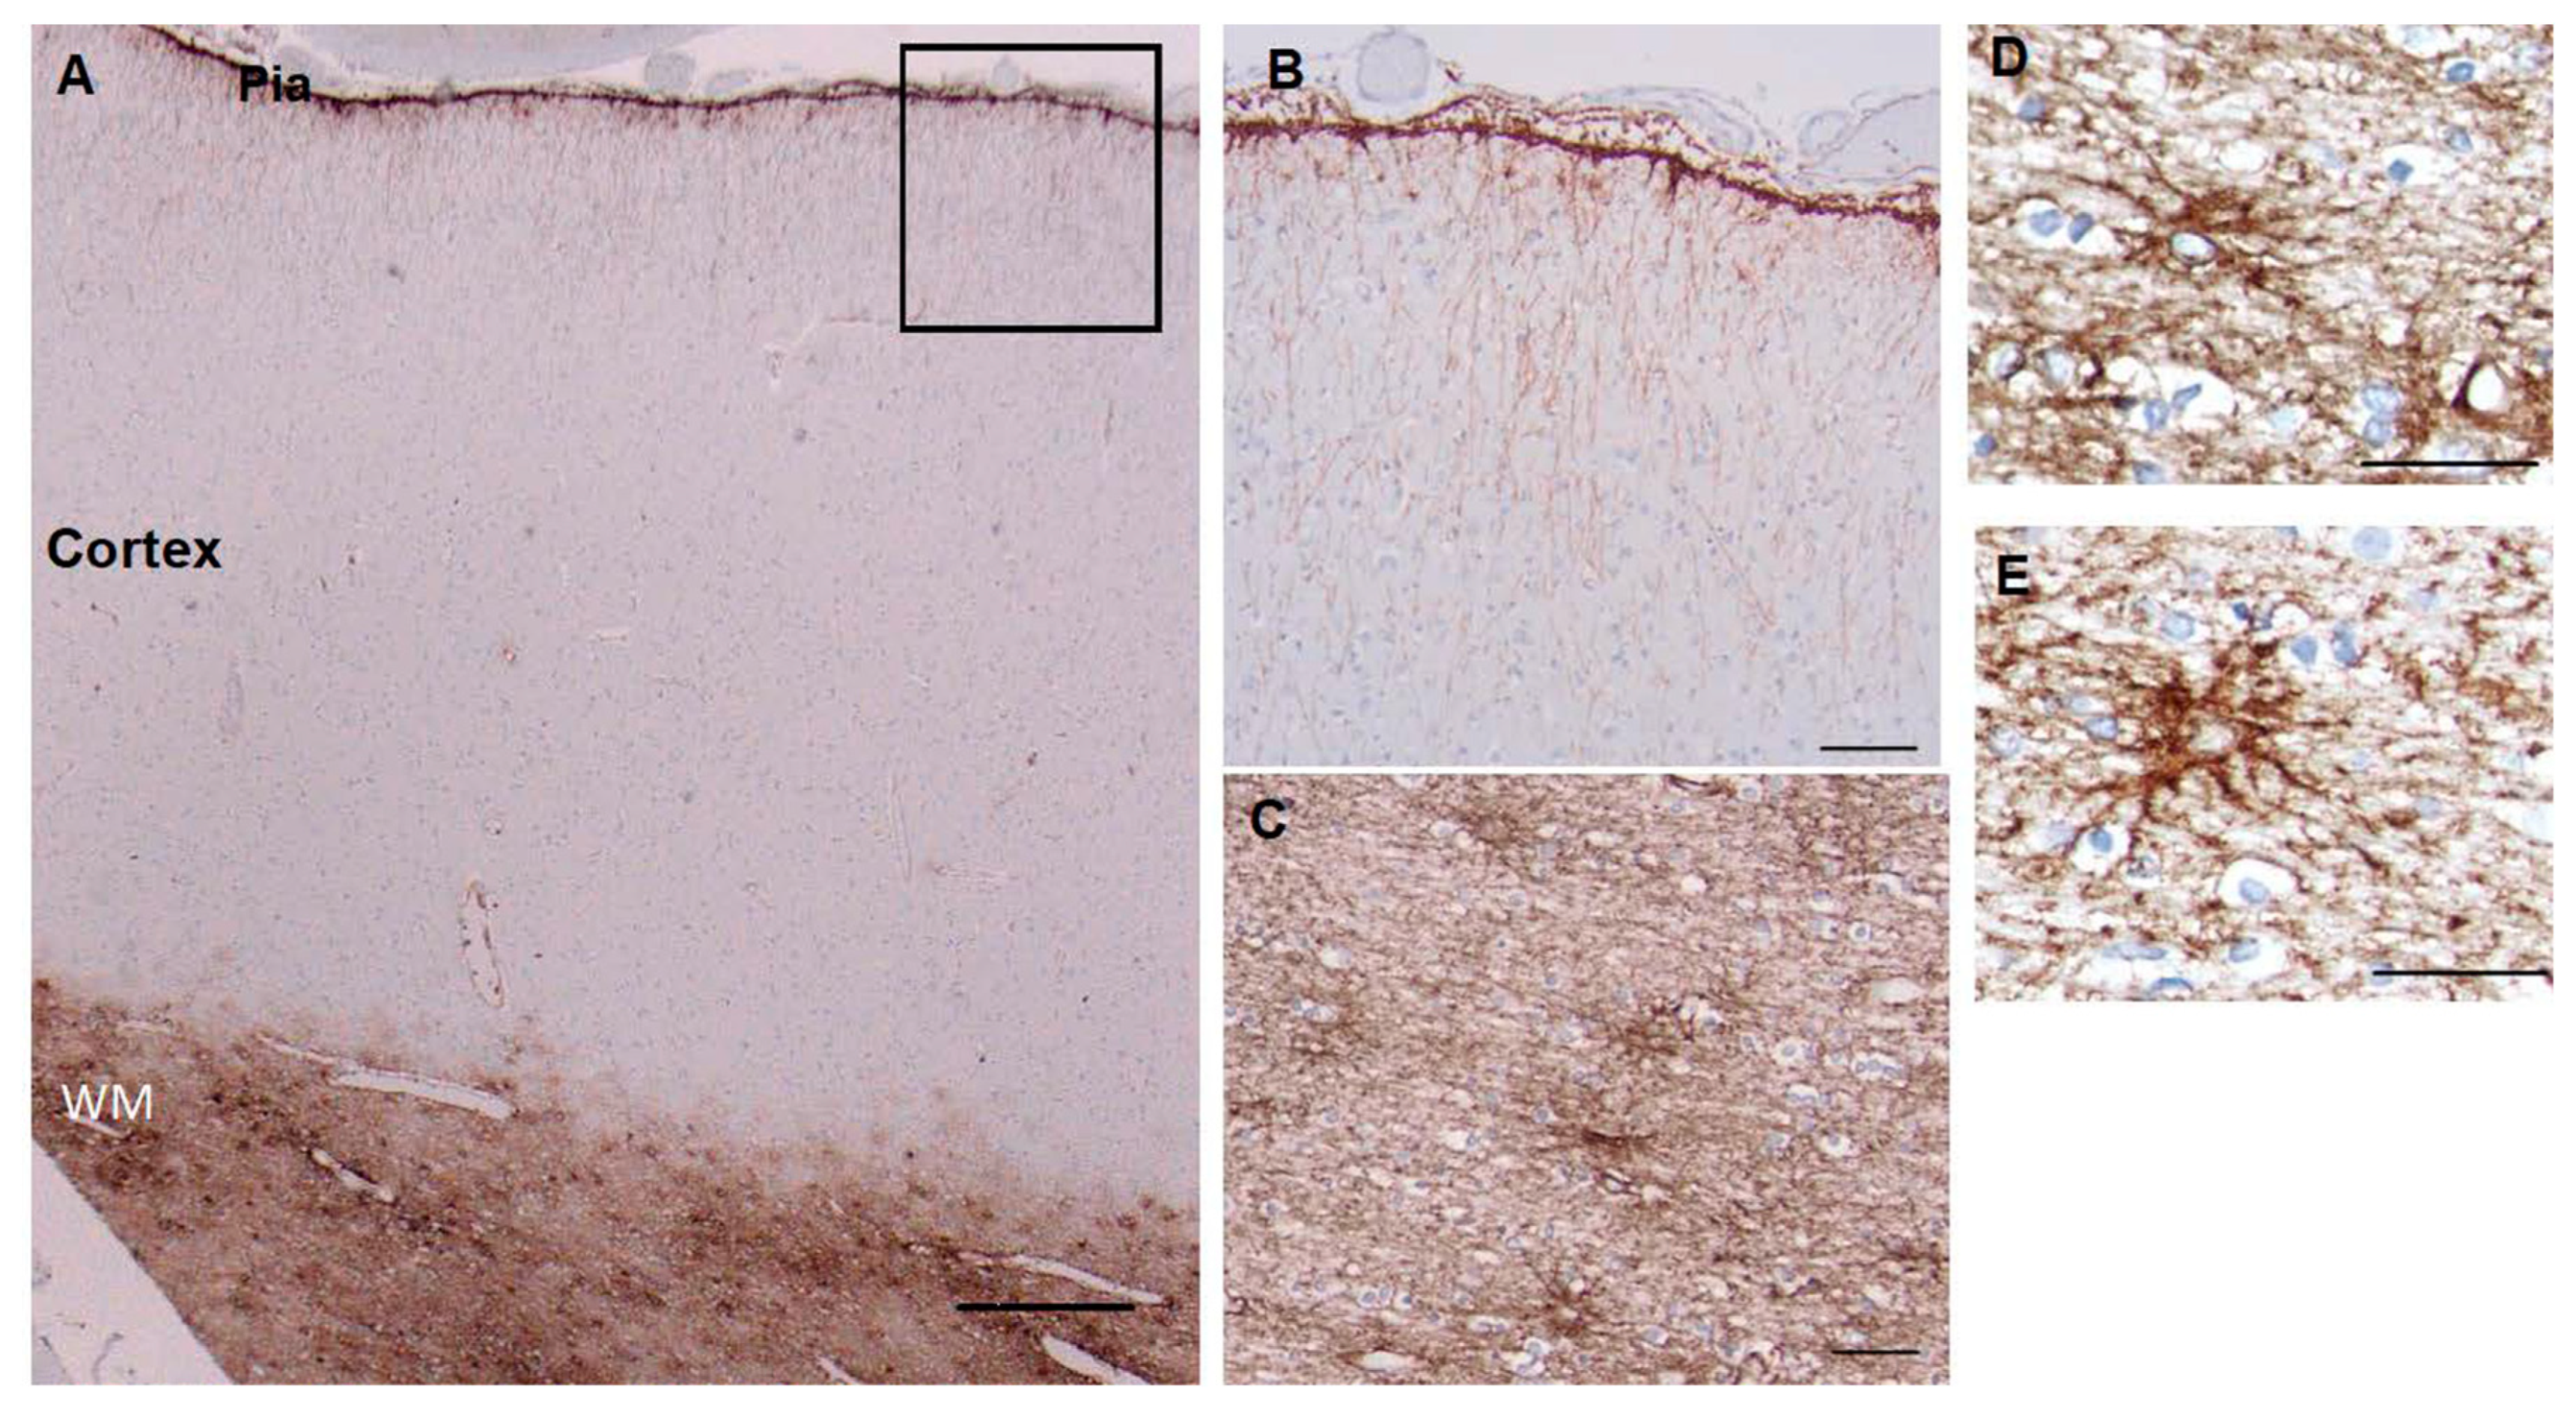
Superior frontal cortex shows CD44 positivity in subpial (Pia), interlaminar astrocytes and white matter astro- cytes (WM), but not in the protoplasmic astrocytes of the cortex (A). Higher magnification of boxed area in A to show the long interlaminar processes, radial to the pial surface (B). Subcortical white matter, showing dense astrocyte pro- cesses, many of which course along axonal tracts (C). Higher magnification of white matter astrocytes, which extend long processes in many directions, although the longest processes are roughly parallel and in the direction of axonal tracts (D, E). Scale bars: A 250 mm, B 50 mm, C 25 mm, D, E 20 mm.
Figure 2.
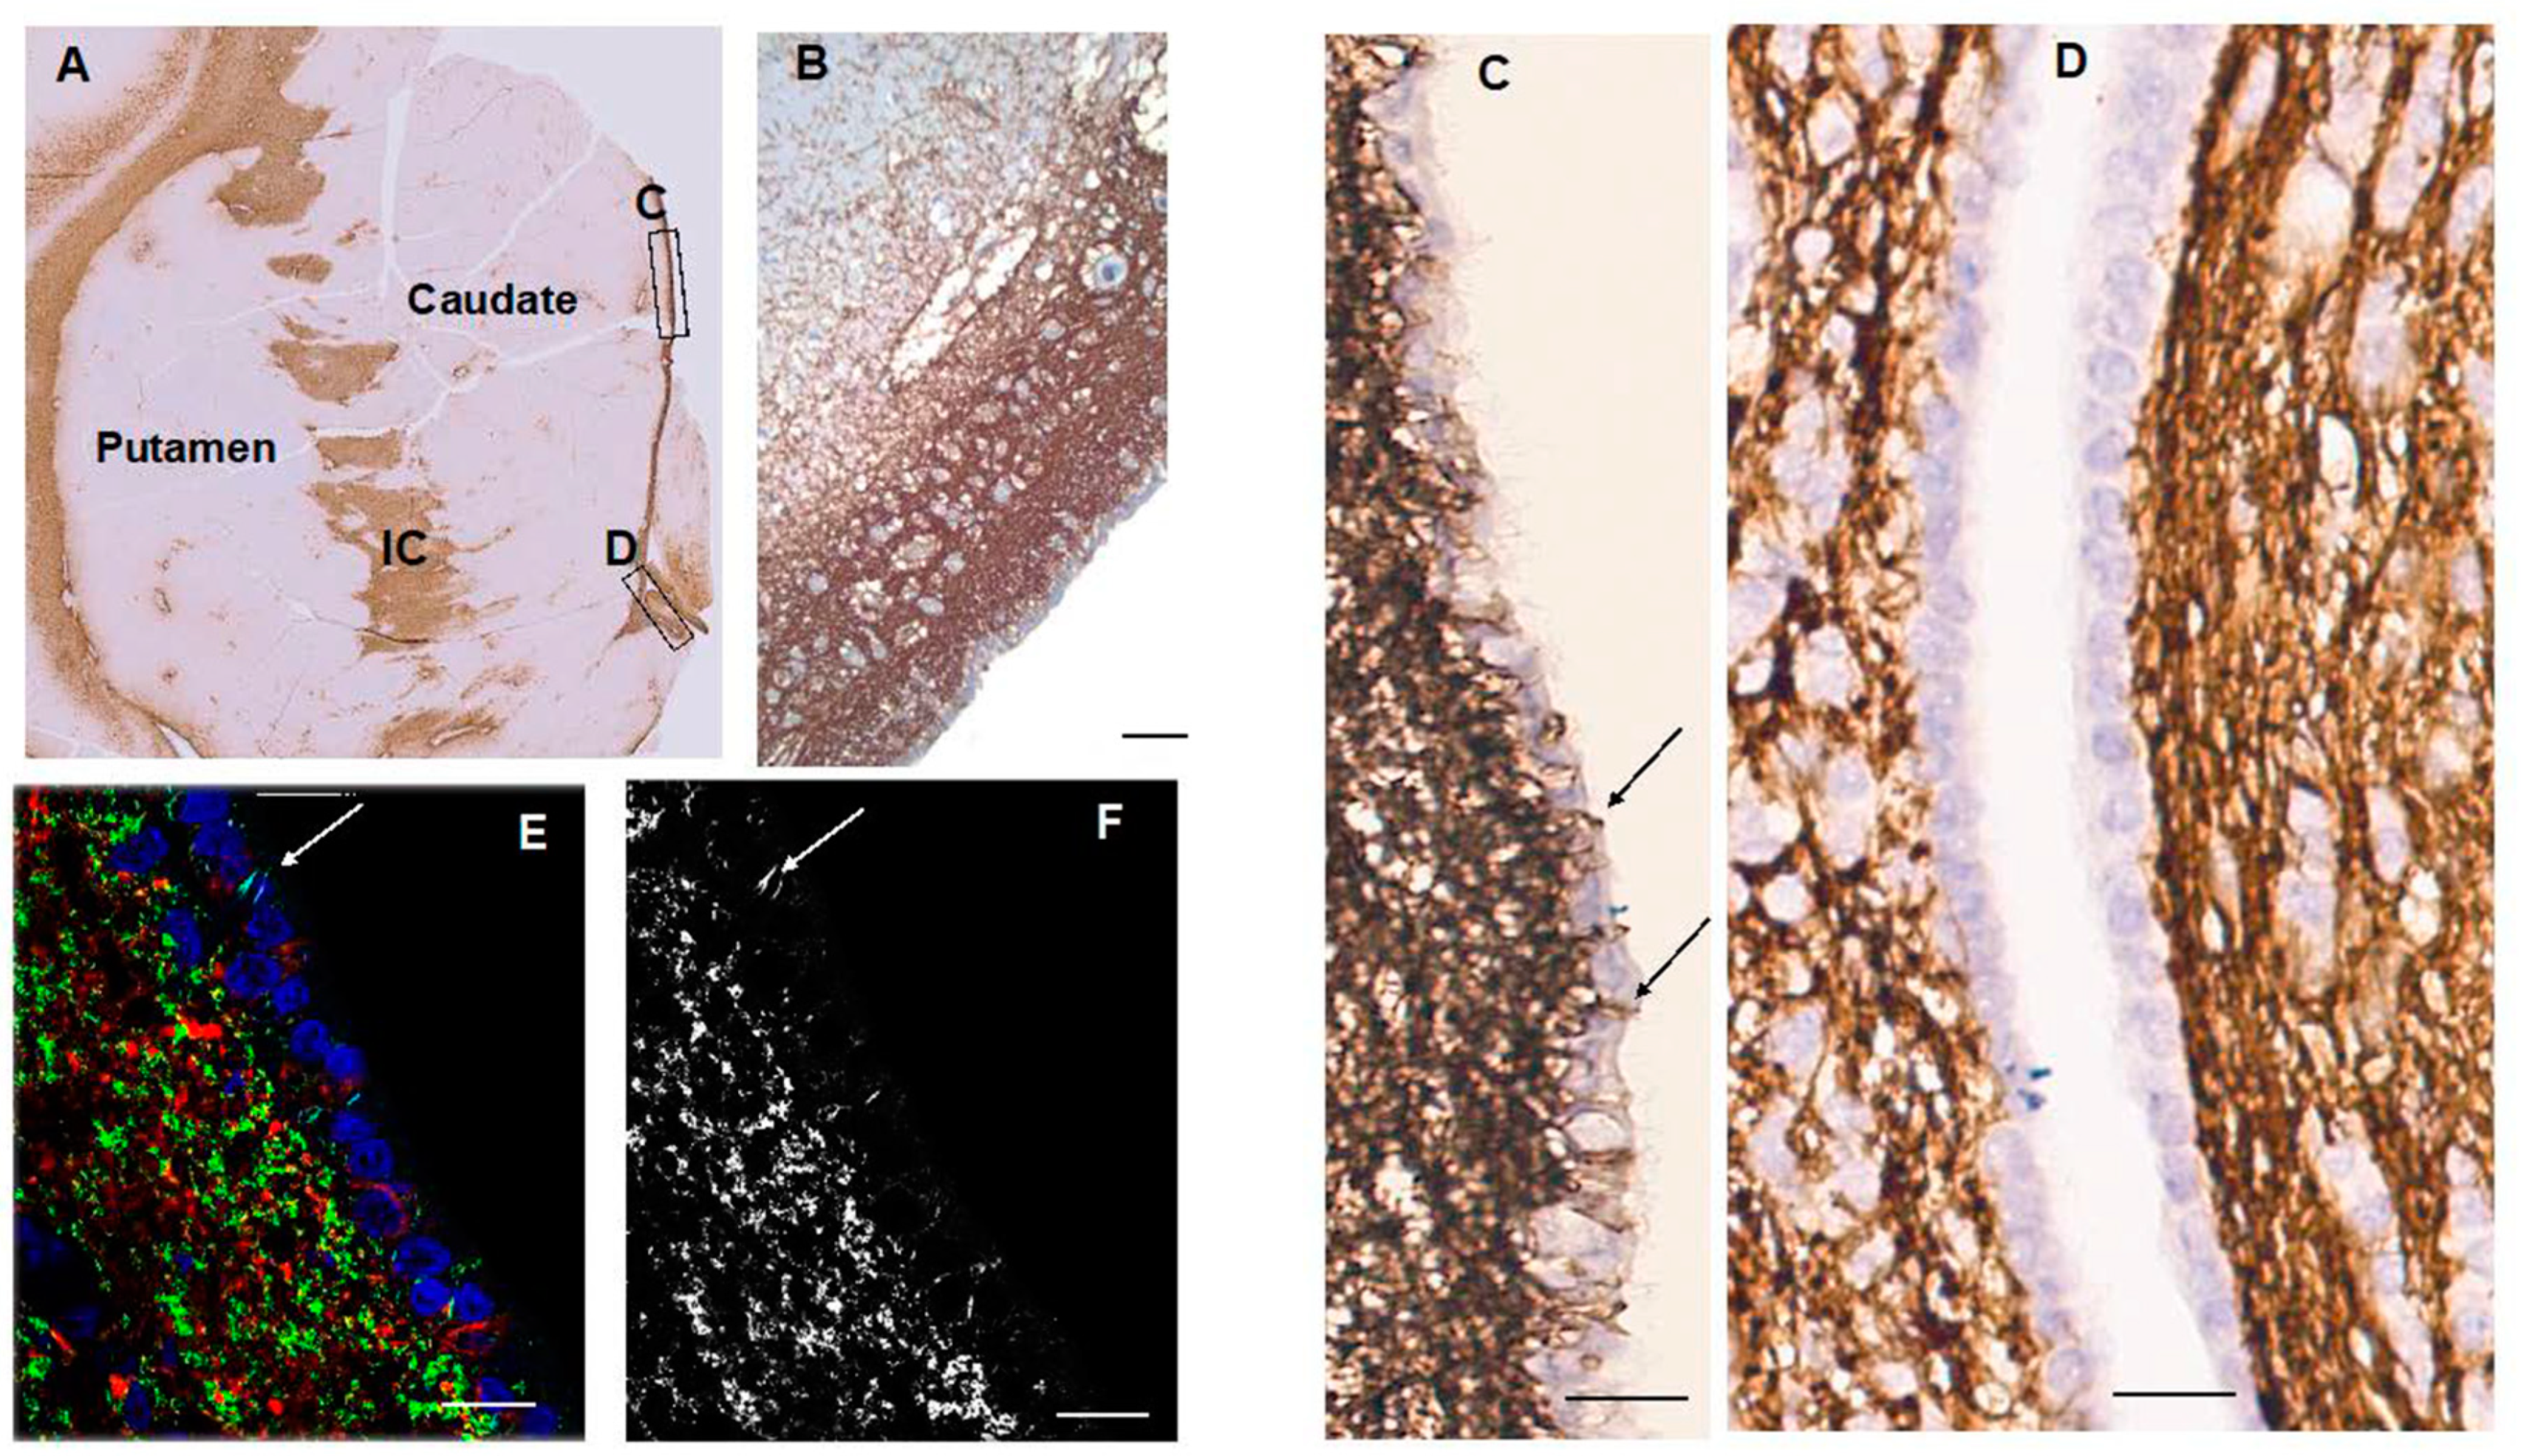
Caudate and putamen show CD44 positivity in the subependymal region, the internal capsule (IC) and the white matter fibers of the striatum (A). Higher magnification of the subependymal regions shows a dense network of CD44+ processes, some of which extend into the caudate (B). Higher magnification of the subependymal network (C, D). CD44+ processes extend between ependymal cells over the dorsal caudate to the ventricle in the dorsal (C), but far fewer of these are present in more caudal areas (D). Confocal imaging also reveals CD44+ processes in between ependymal cells (arrows) (E, CD44 (green), GFAP (red), DAPI (blue), (F, CD44+ only). Scale bars: A 250 mm, B 100 mm, C,D,E,F 20 mm.
Figure 3.
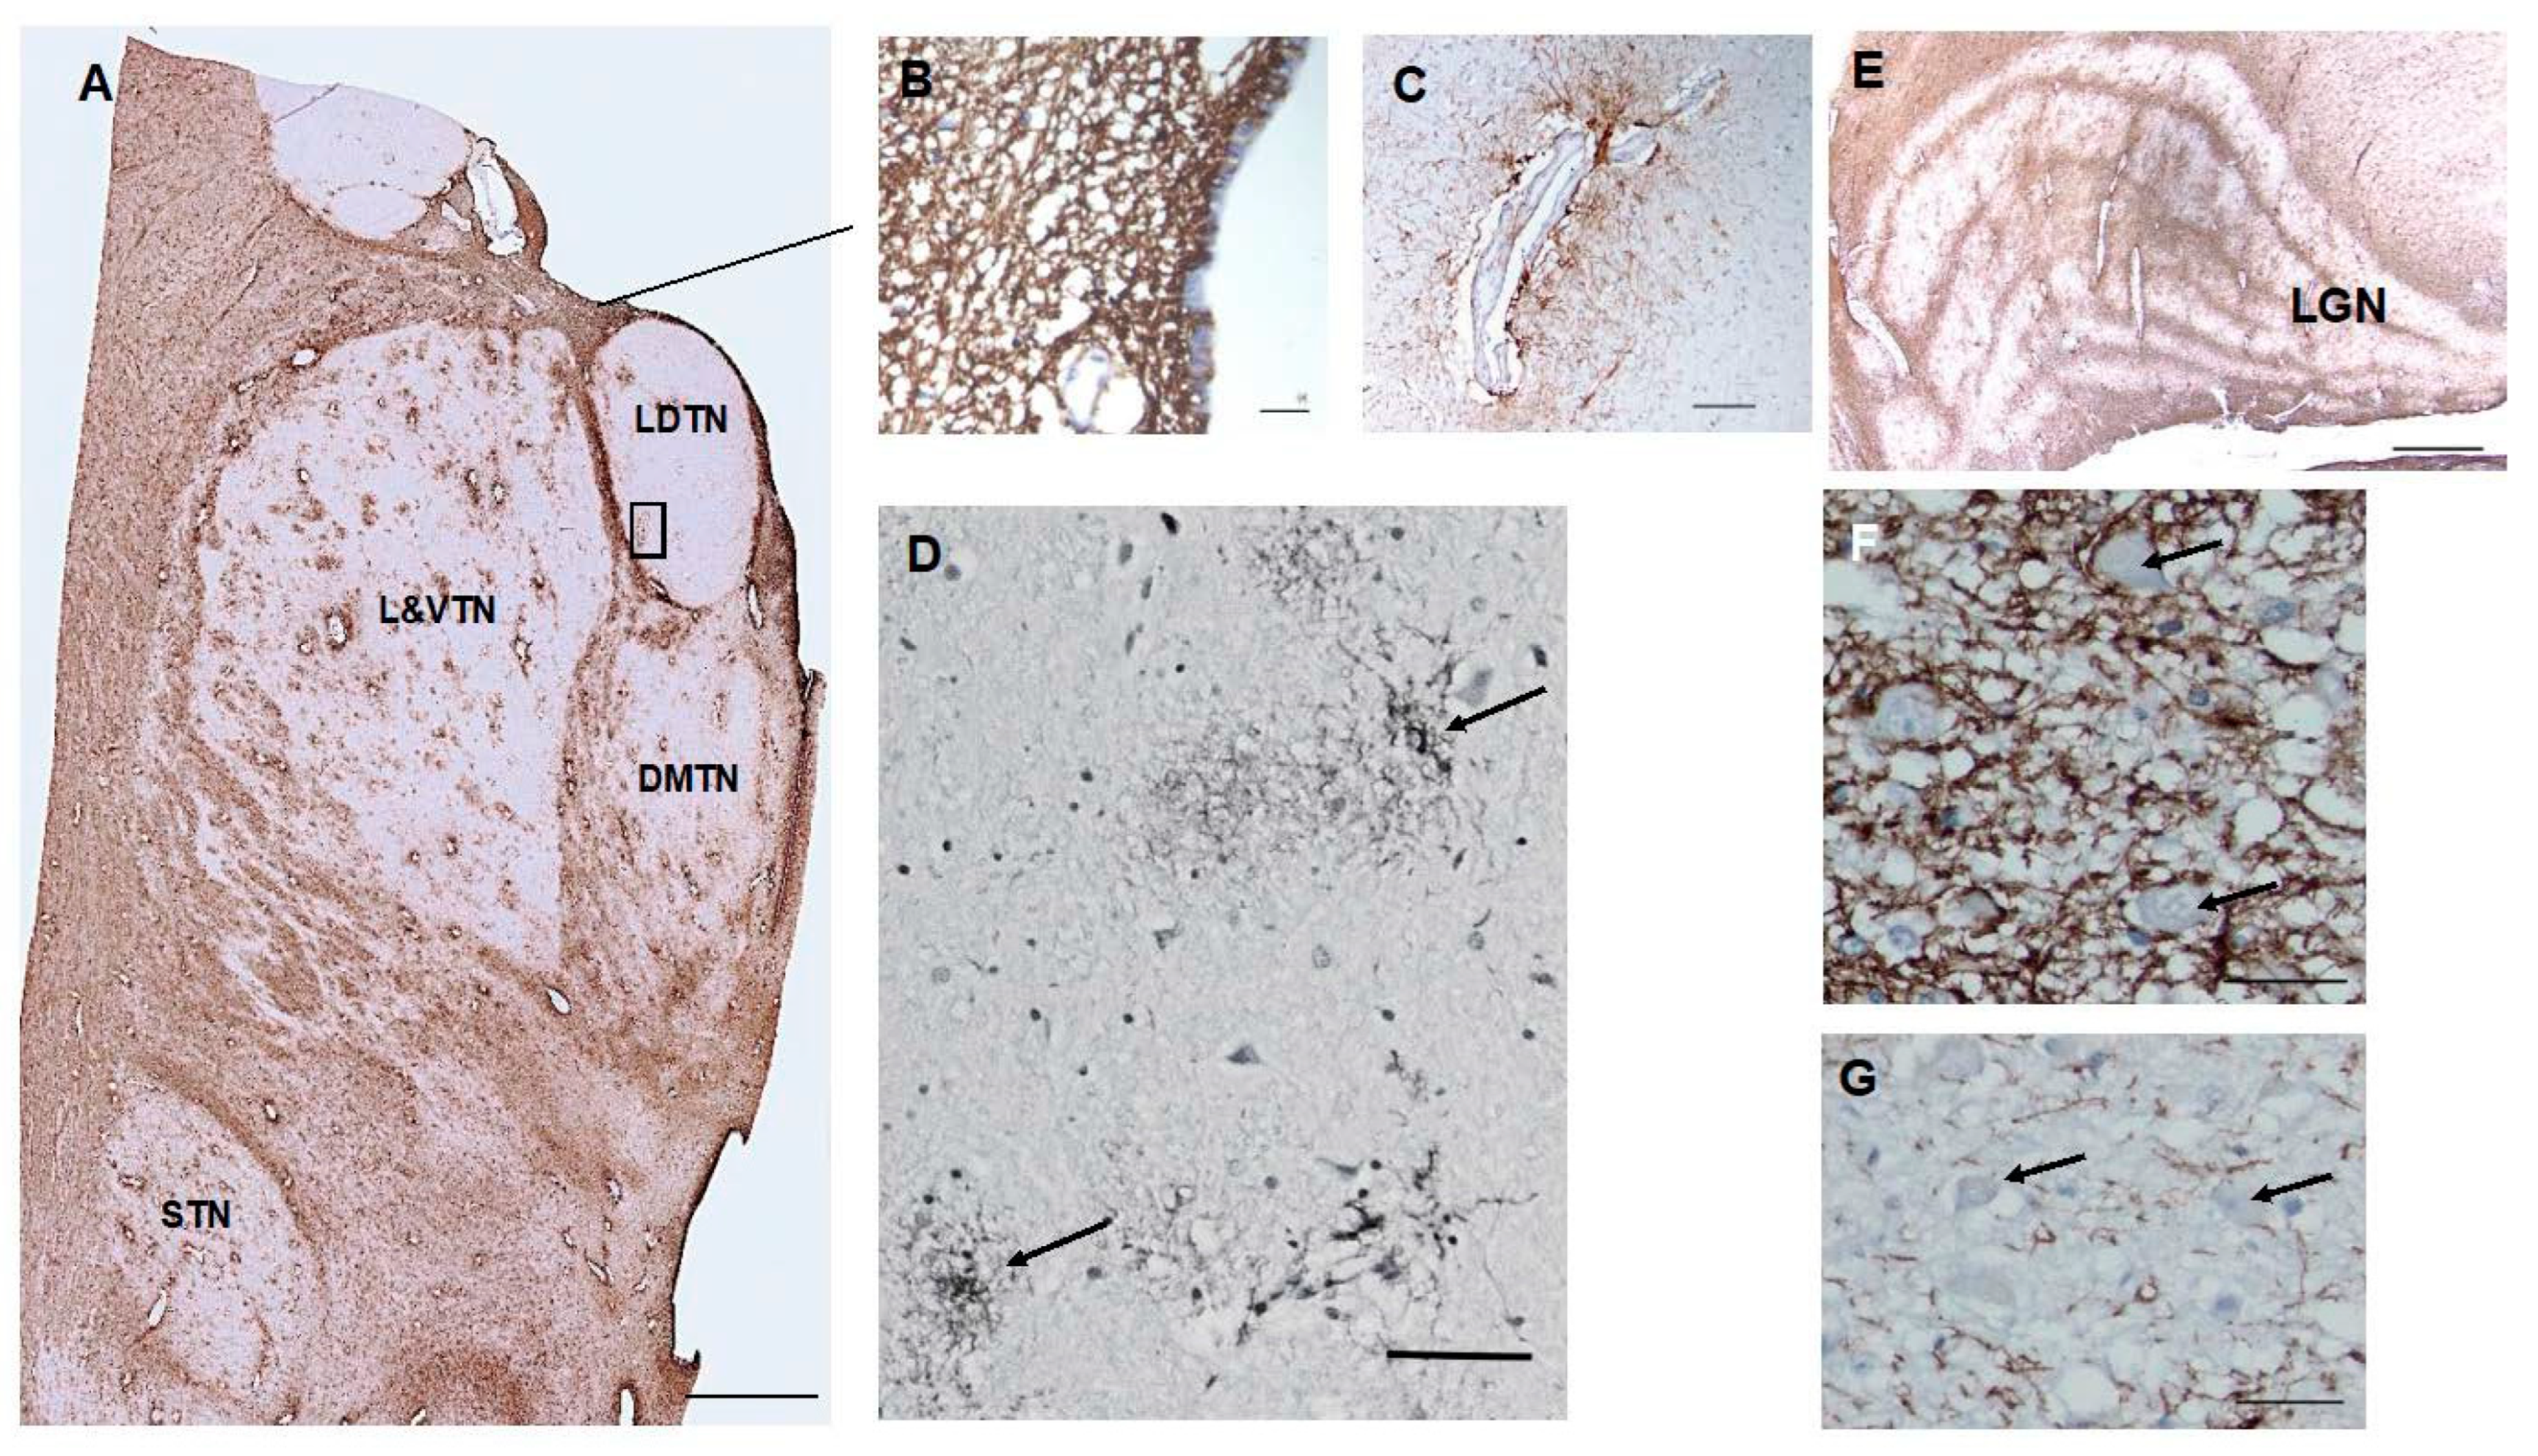
The anterior thalamus, including the latero-dorsal (LDTN), dorso-medial (DMTN), and latero-ventral (L&VTN) nuclei and the subthalamic nucleus (STN) show CD44 positivity around blood vessels and in white matter striae (A). CD44+ processes intercalate between ependymal cells, (B). Higher magnification of the boxed area in (A) to show a large vessel surrounded by CD44+ astrocytes, which send long unbranched processes into the parenchyma (C). Some of the CD44+ astrocytes in the L and VTN do not apparently contact blood vessels (D). Myelinated fiber bands of the LGN are CD44+ (E). CD44+ surrounds magnocellular neurons ((F), but not parvicellular neurons (G). Scale bars: A 5mm, B 10 mm, C, D 50 mm, F,G 20 mm.
Figure 4.
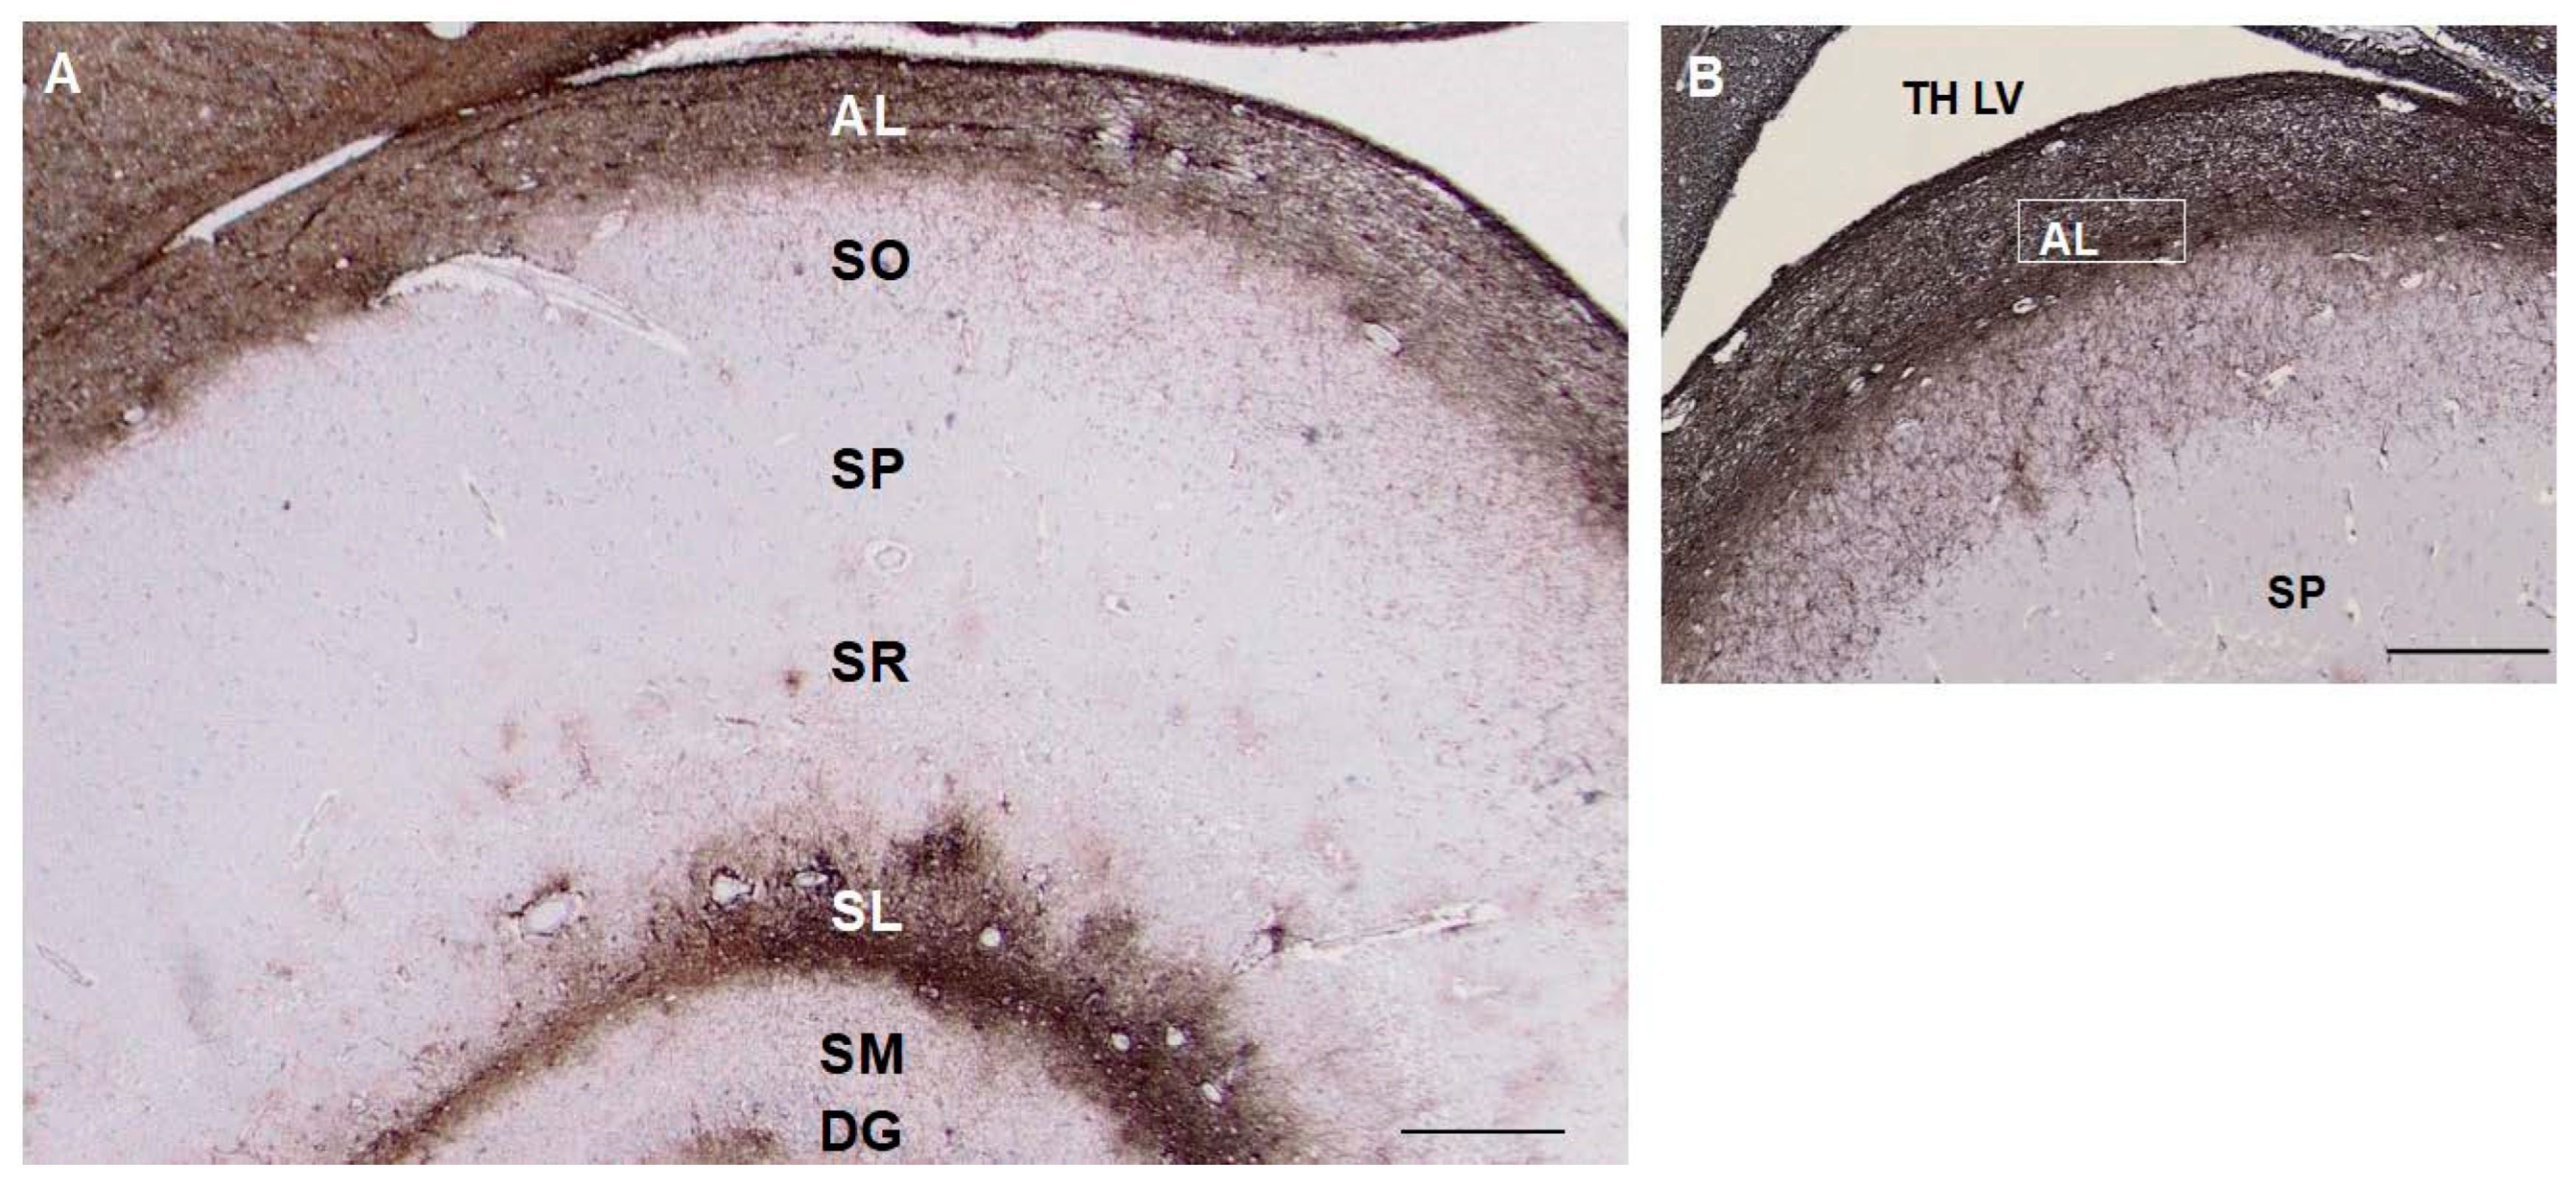
A section through the layers of the hippocampus show CD44 positivity in the alveus (AL) and stratum lacunosum (SL). Thin, unbranched CD44+ processes run through the stratum oriens (SO) toward the pyramidal layer. CD44+ pro- cesses do not surround pyramidal cells. Astrocytes in the stratum pyramidale, stratum radiatum (SR), and stratum molec- ulare (SM) show little CD44 reactivity. CD44+ astrocyte processes course through the dentate gyrus (DG) (A, B). Scale bars: A 250 mm, B 200 mm.
Figure 5.
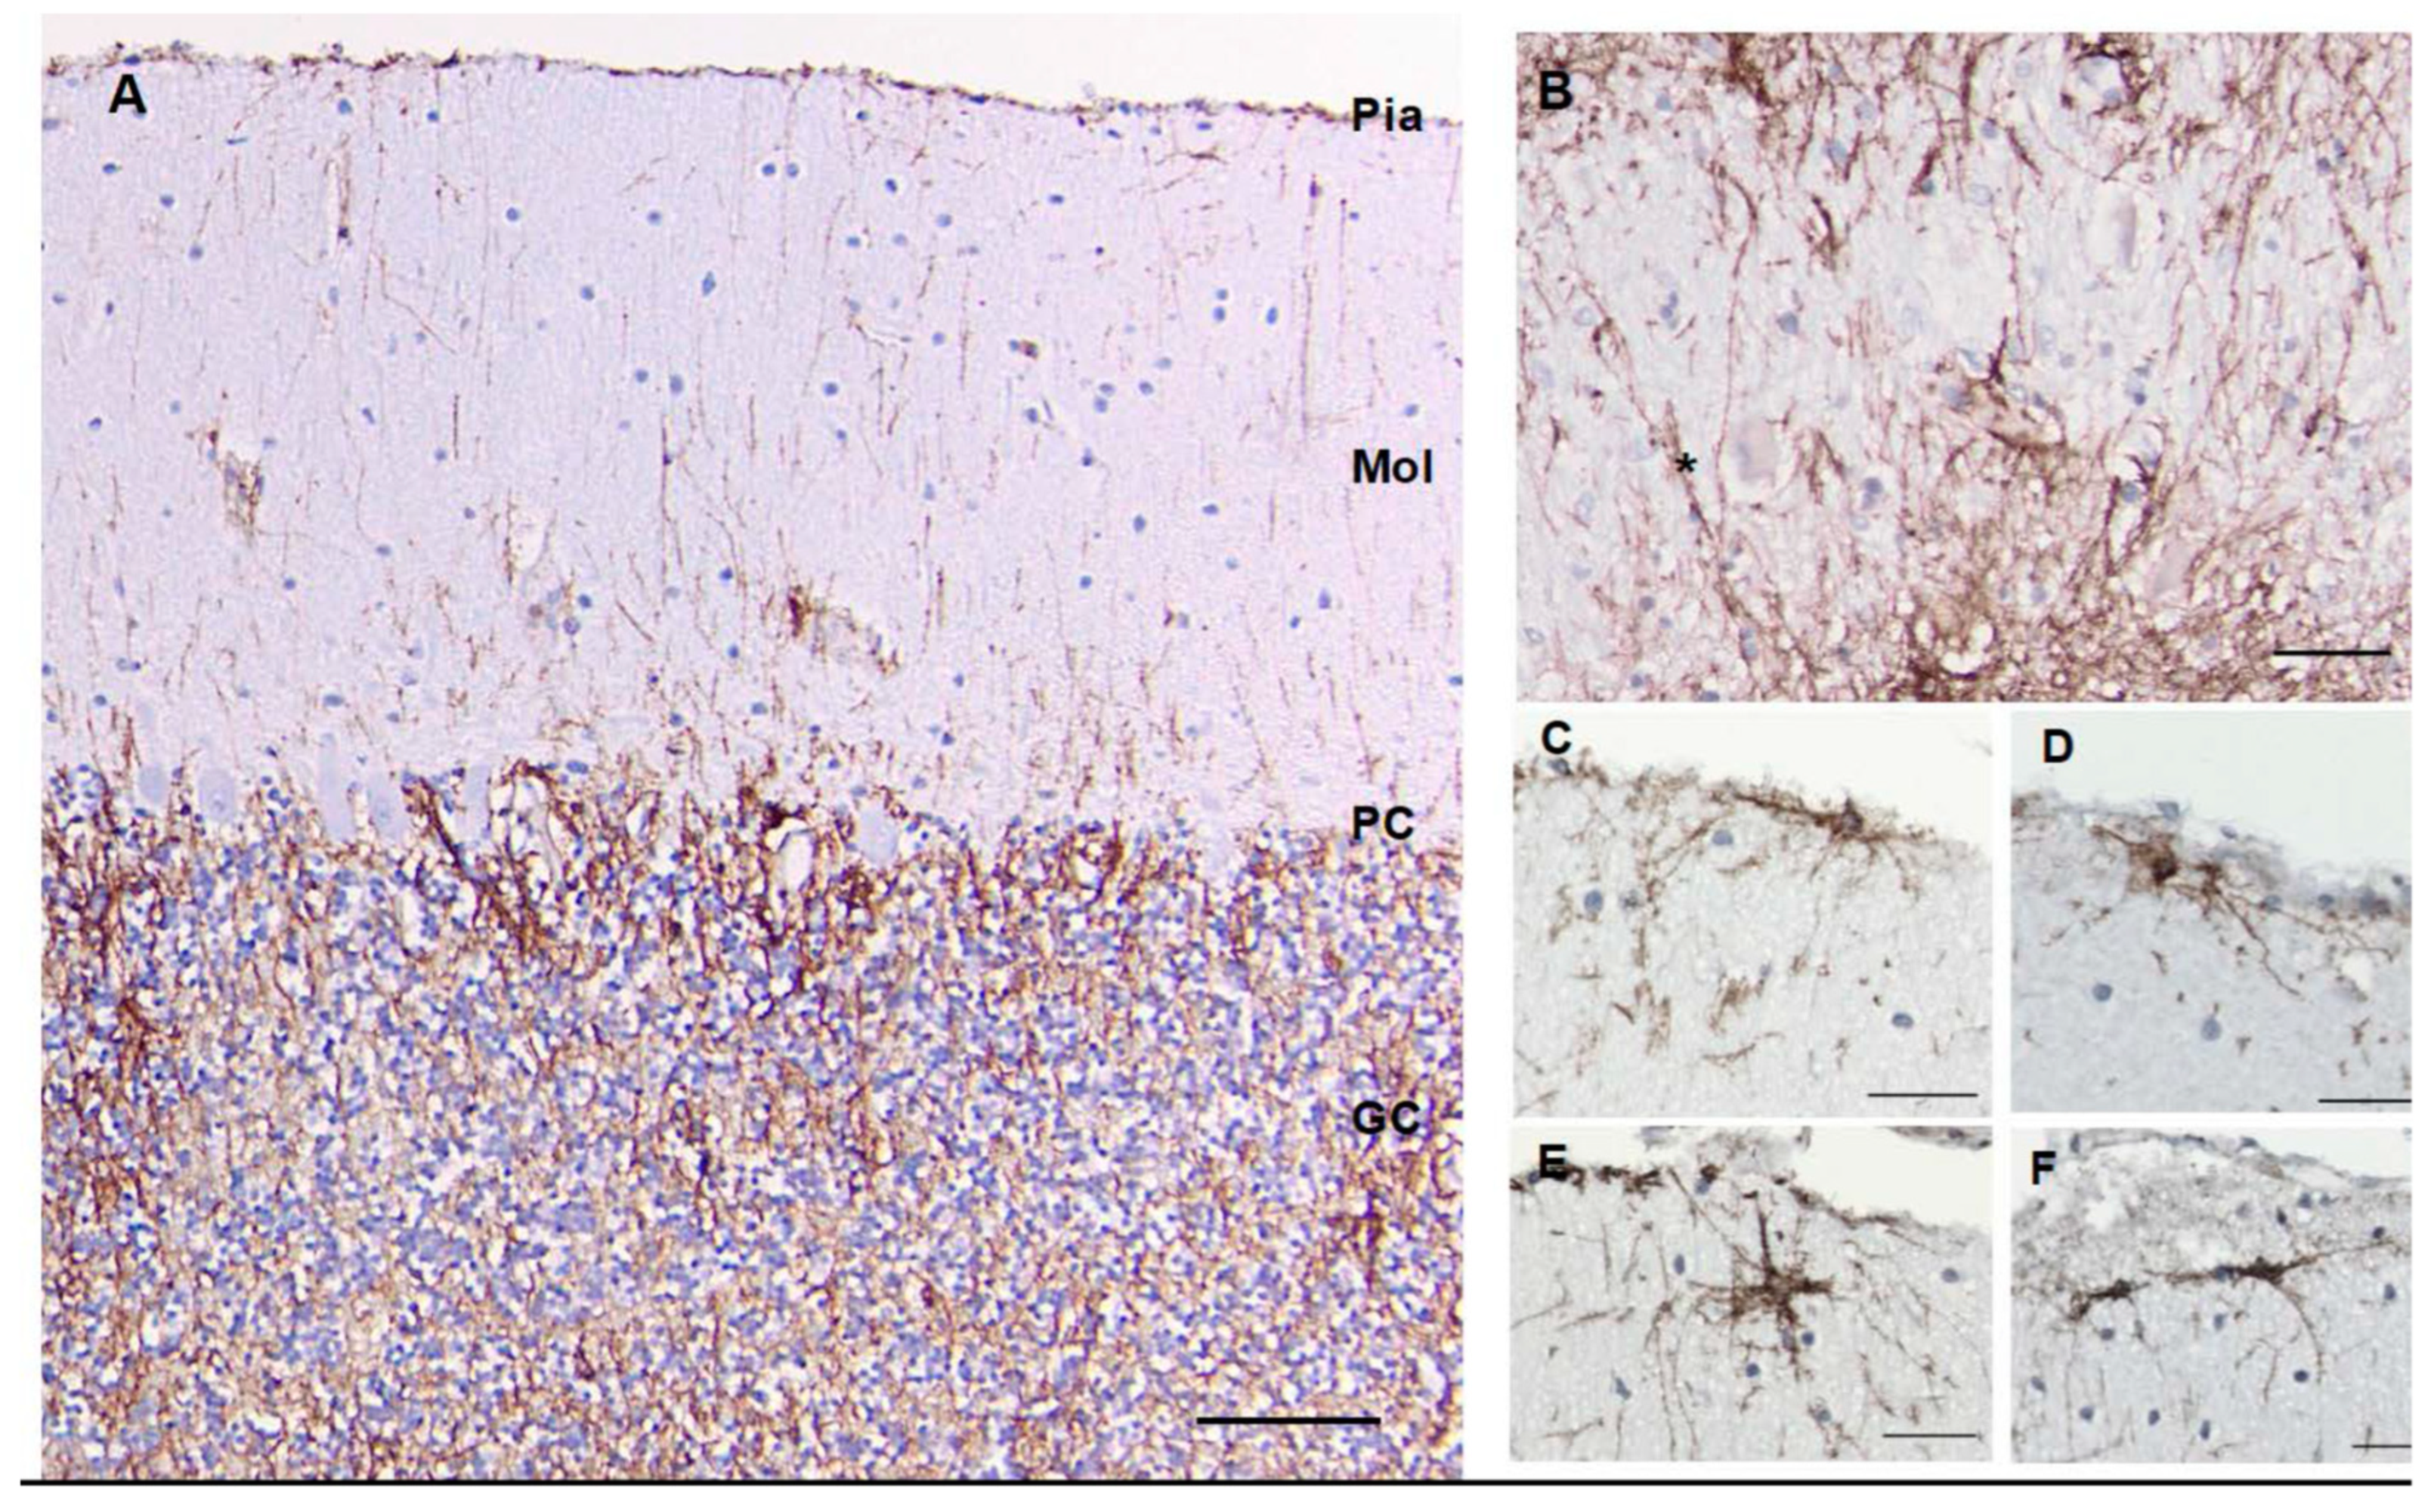
A section through the cerebellar cortex shows CD44+ long processes arising from the pial surface and entering the molecular layer (A). Some appear to begin in the granule cell layer and project into the molecular layer (see
Supplemental Figure 3E). Fine CD44+ processes course through the granule cell layer, surrounding groups of granule cells, but do not surround individual granule cells. CD44+ processes run through the dentate nucleus, but do not surround dentate neurons (*) (B). CD44+ astrocytes at or near the pial surface of the molecular layer extend processes parallel to the pia or into the molecular layer (C-F). Molecular layer (Mol), Purkinje cell layer (PC), granule cell layer (GC). Scale bars: A 100 mm, B, C-F 20 mm.
Figure 6.
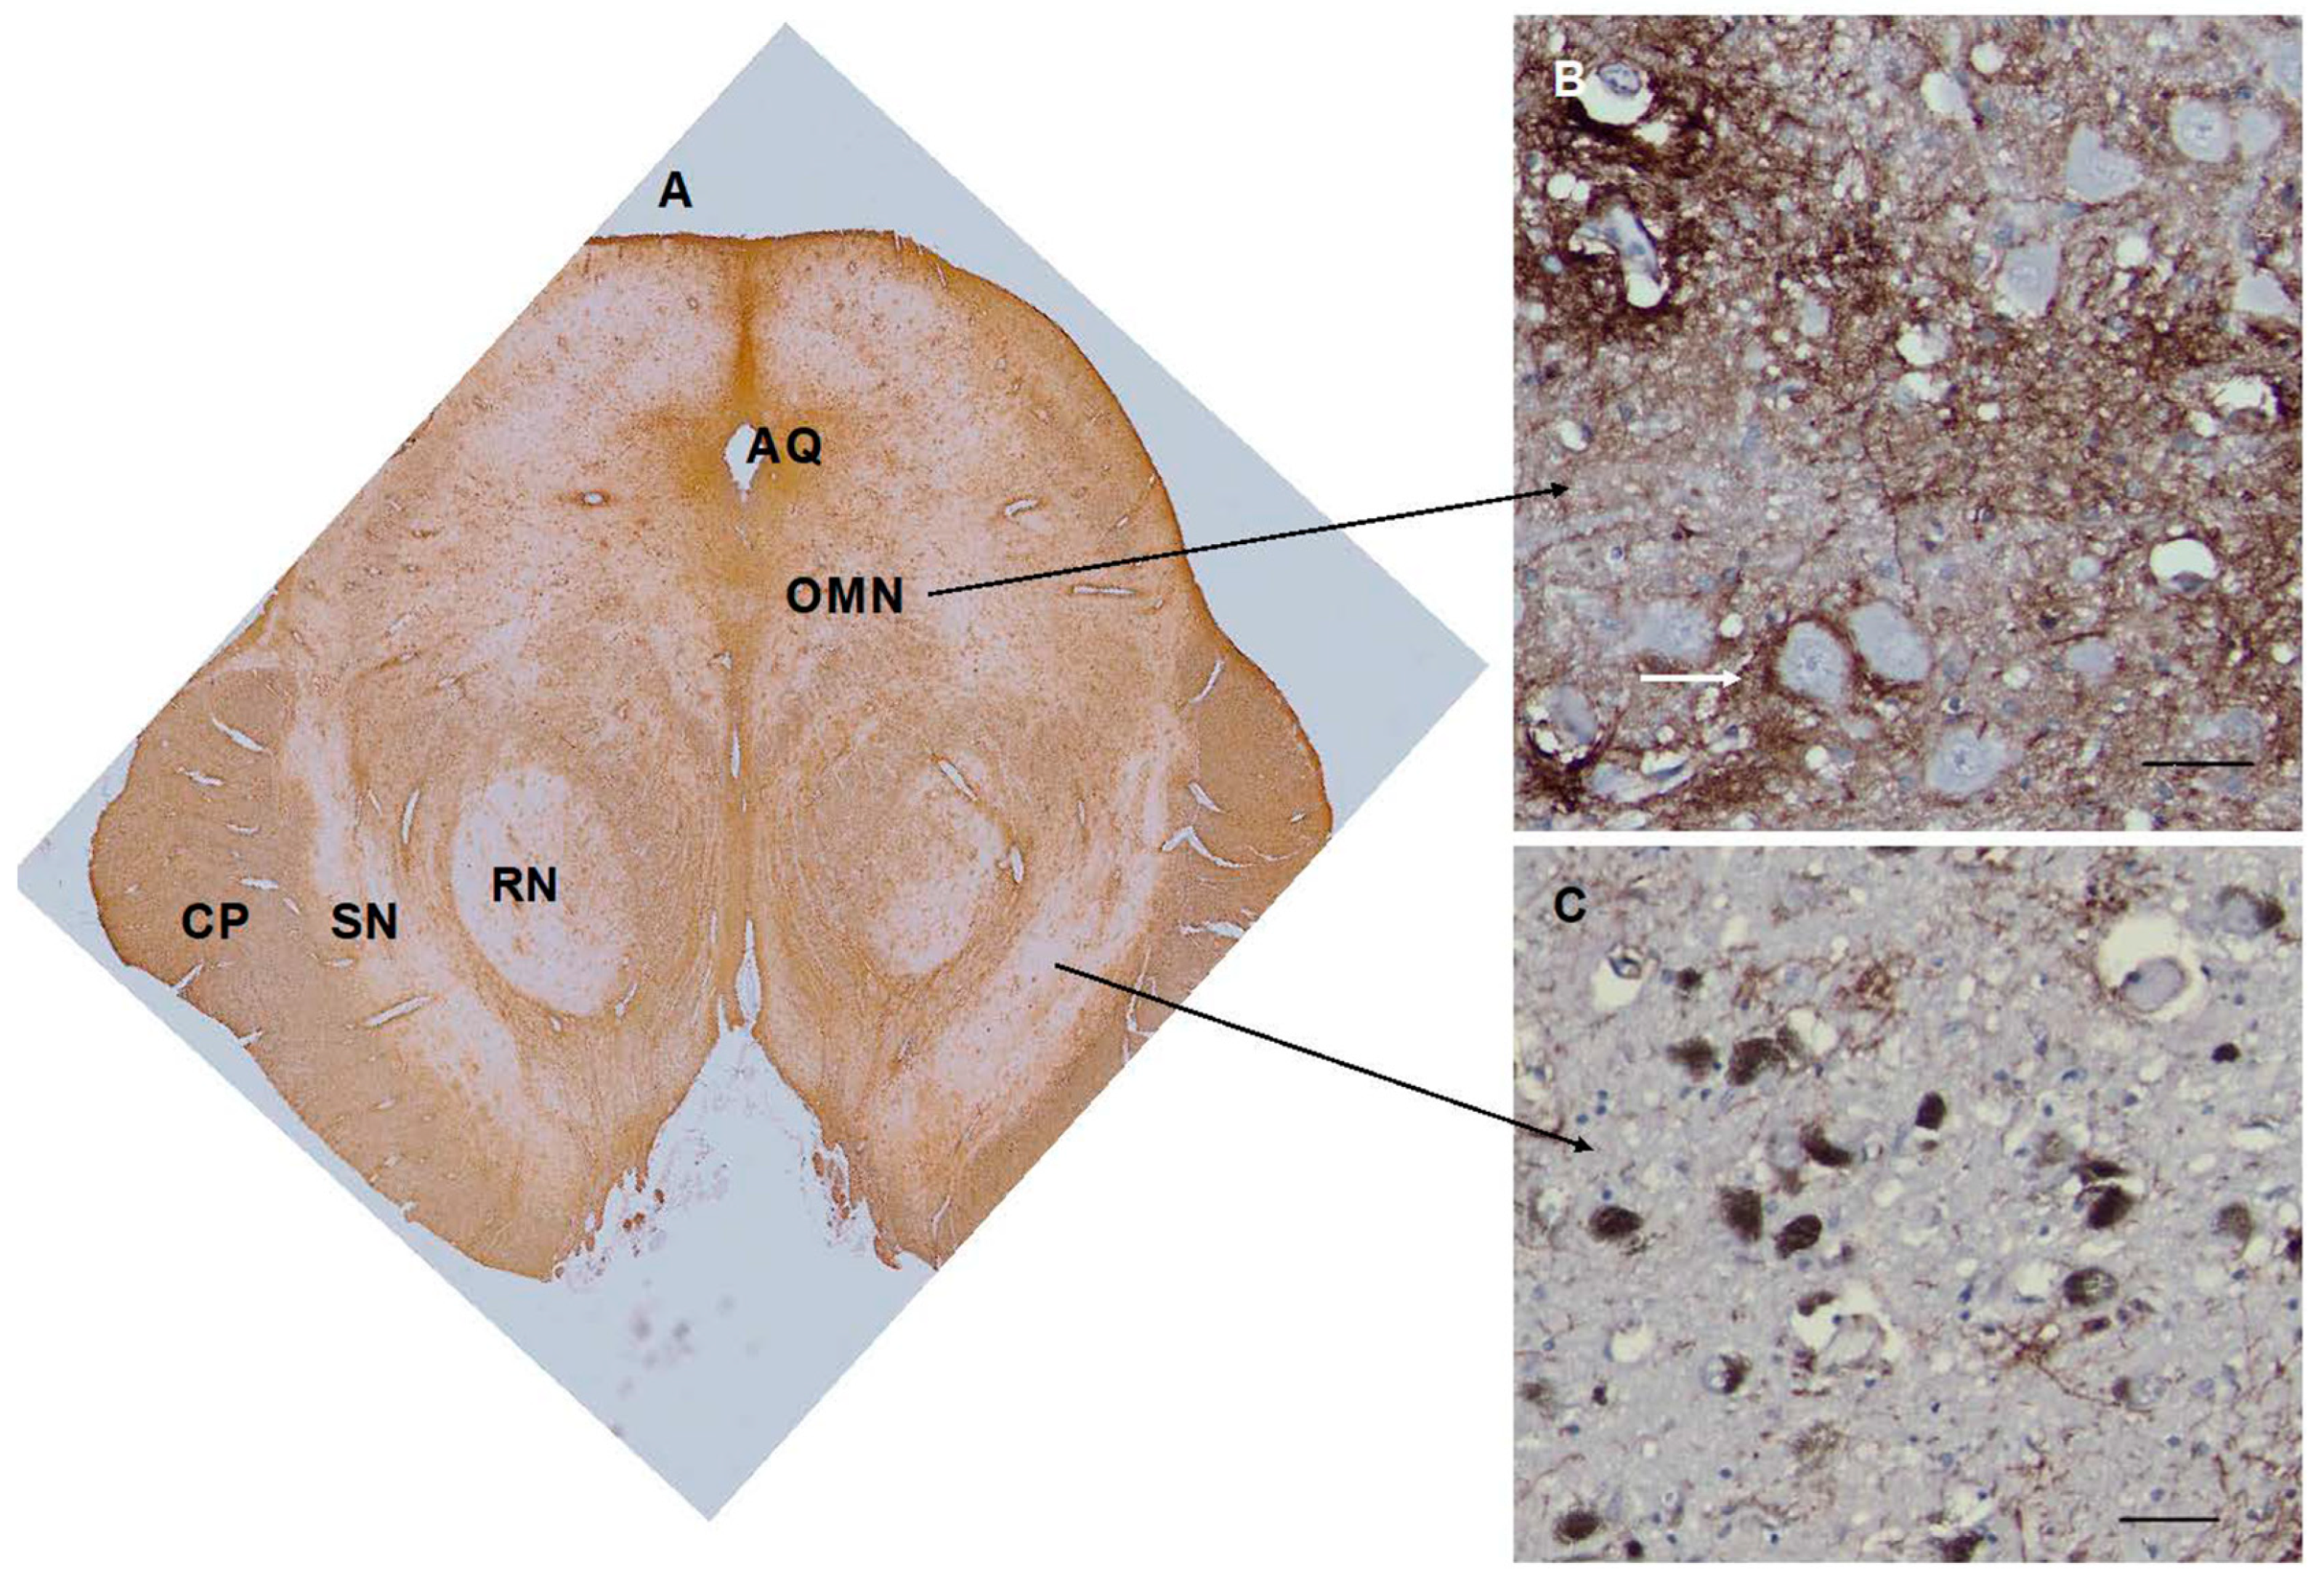
The midbrain appears complex, with CD44 staining of white matter tracts such as the cerebral peduncles (CP). The red nucleus (RN) contains CD44+ astrocytes. The substantia nigra appears relatively free of CD44+ staining (A). Neurons of the oculomotor nucleus (ON) are surrounded by CD44+ staining (B). Neurons of the substantia nigra are not (C). Scale bars: B,C 25 mm.
Figure 7.
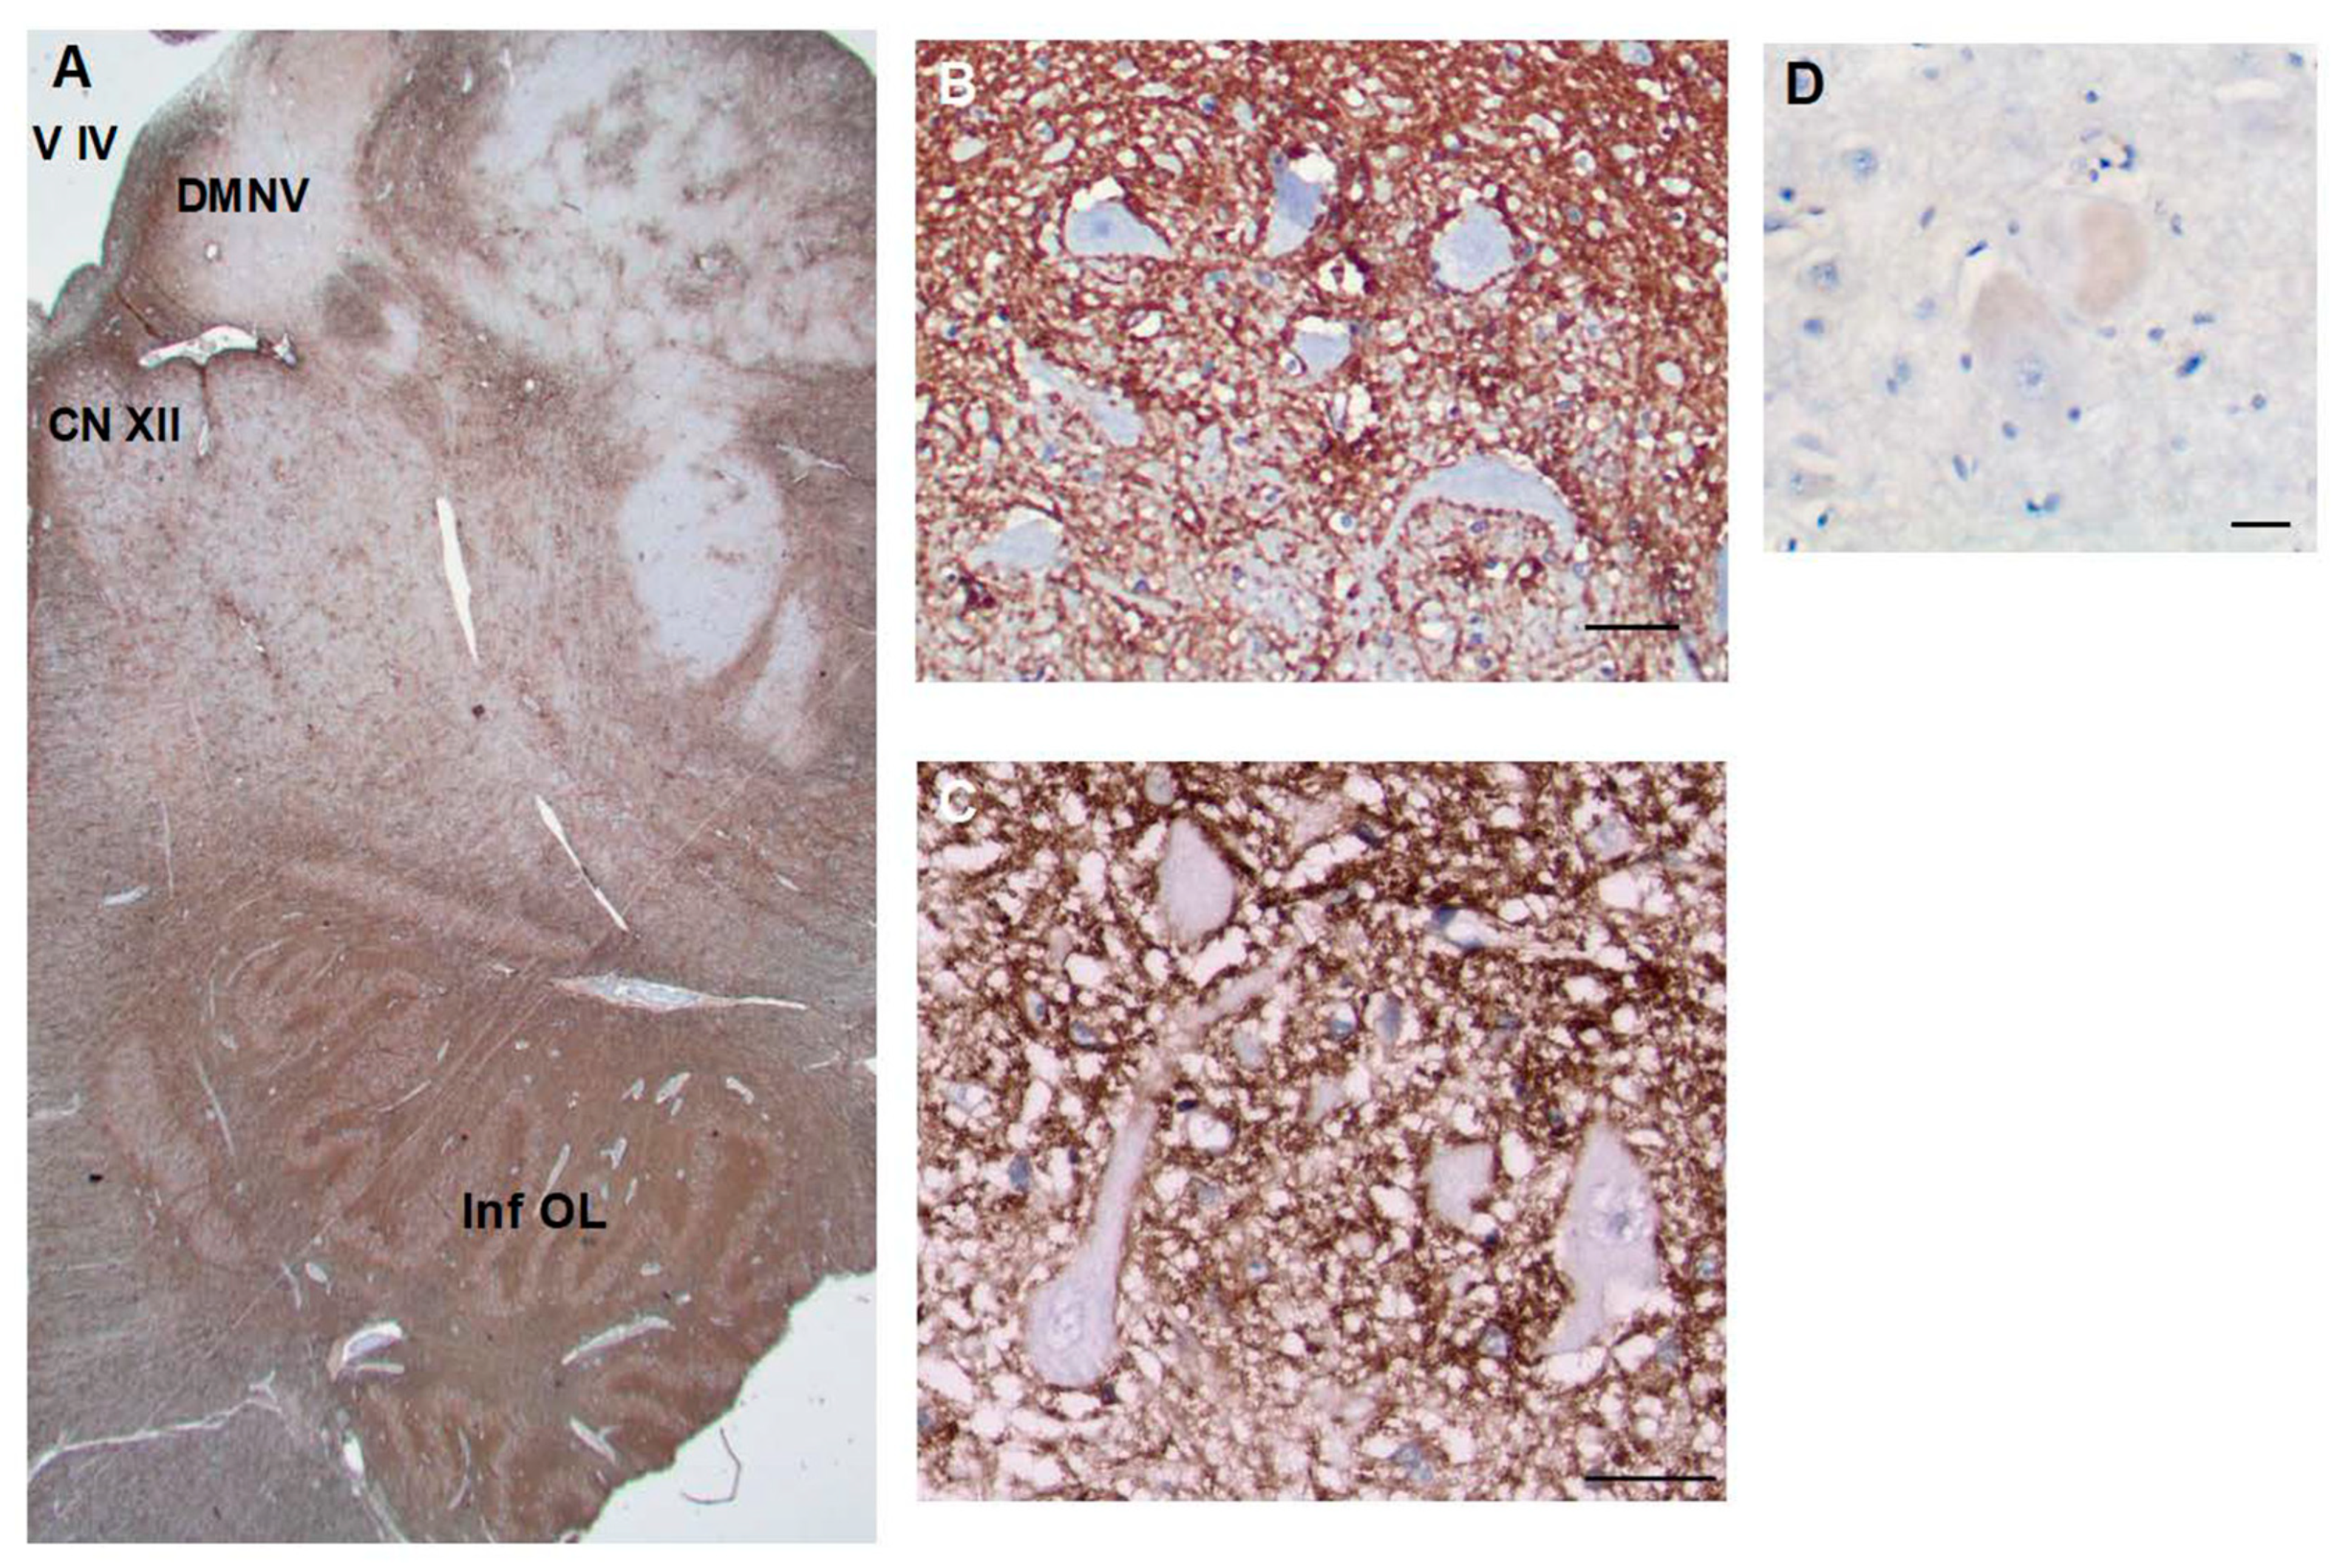
The medulla contains many CD44+ processes, including white matter tracts. Motor neurons of the hypoglossal nucleus (B) and dorsal motor nucleus of the vagus (C) are surrounded by CD44+ processes. In contrast, Betz cells of the motor cortex are not surrounded by C44+ processes (D). Fourth ventricle (V IV), Hypoglossal nucleus (CNXII), dorsal motor nucleus of the vagus (DMNV), inferior olivary nucleus (Inf OL). Scale bars: B, C 10 mm,.D 50 mm.
Figure 8.
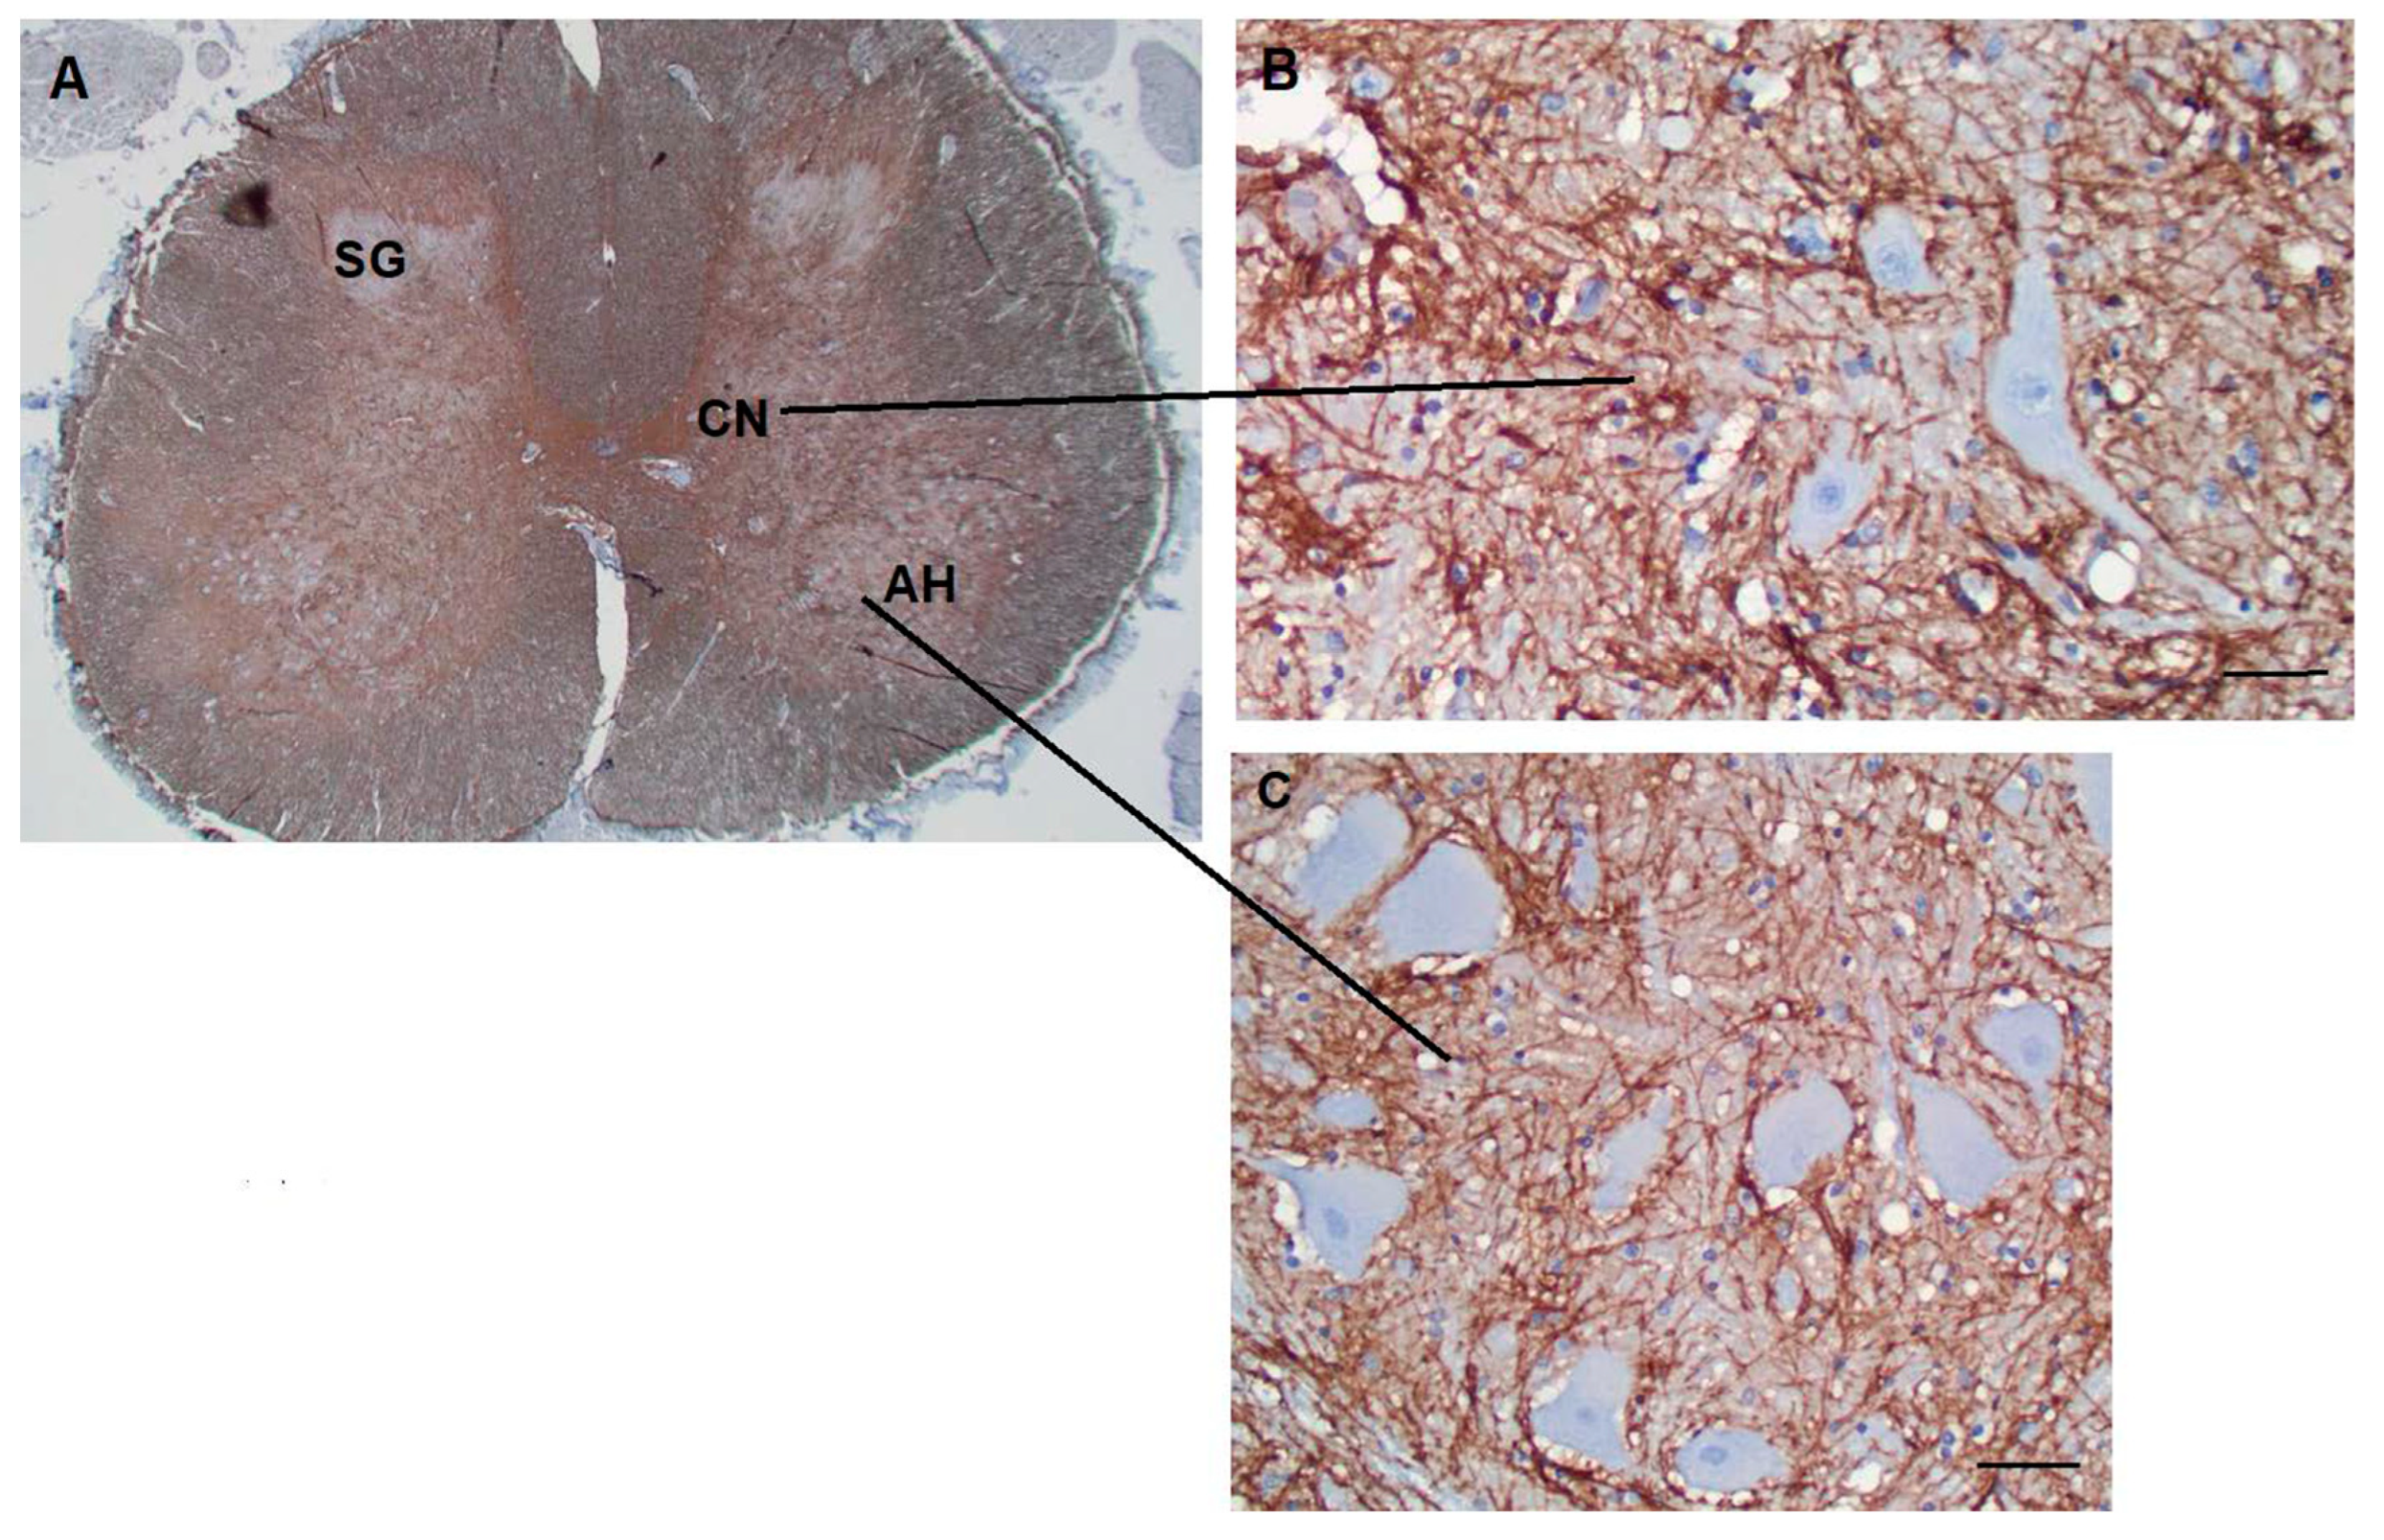
A section through the thoracic spinal cord shows many CD44+ processes, including white matter tracts (A). The substantia gelatinosa contains fewer CD44+ astrocytes. Motor neurons of the anterior horn (B) and neurons of Clarke’s nucleus (C) are surrounded by CD44+ processes. Substantia gelatinosa (SG), Clarke’s nucleus (CN), Anterior horn (AH). Scale bars: B,C 20 mm.
Figure 9.
Astrocytes increase CD44 levels in hypoxic ischemic conditions. A and B, C and D, E and F acute, subacute and chronic infarcts, respectively (H&E). Eosinophilic neurons (arrows) are seen in A. Proliferative vasculature is present in. Foamy macrophages are more pronounced in E in an area of necrosis (left side of the panel). B, D, and F are the corre- sponding immunohistochemical stains for CD44 of A, B and C, respectively. CD44-positive astrocytes are highlighted (black arrowheads). Macrophages (arrowheads) are also positive for CD44. The vessels are outlined by CD44 stain. Scale Bars: 20 mm. (G) The numbers of CD44-positive astrocytes increase as infarcts evolve (average numbers in three 20x fields/specimen). AI: acute infarct; SubI: subacute infarct; CI: chronic infarct. (*p<0.01, SubI vs. AI, *p<0.01, CI vs. AI; *p<0.01, CI vs. SubI). ANOVA , showing means + SEM.
Figure 10.
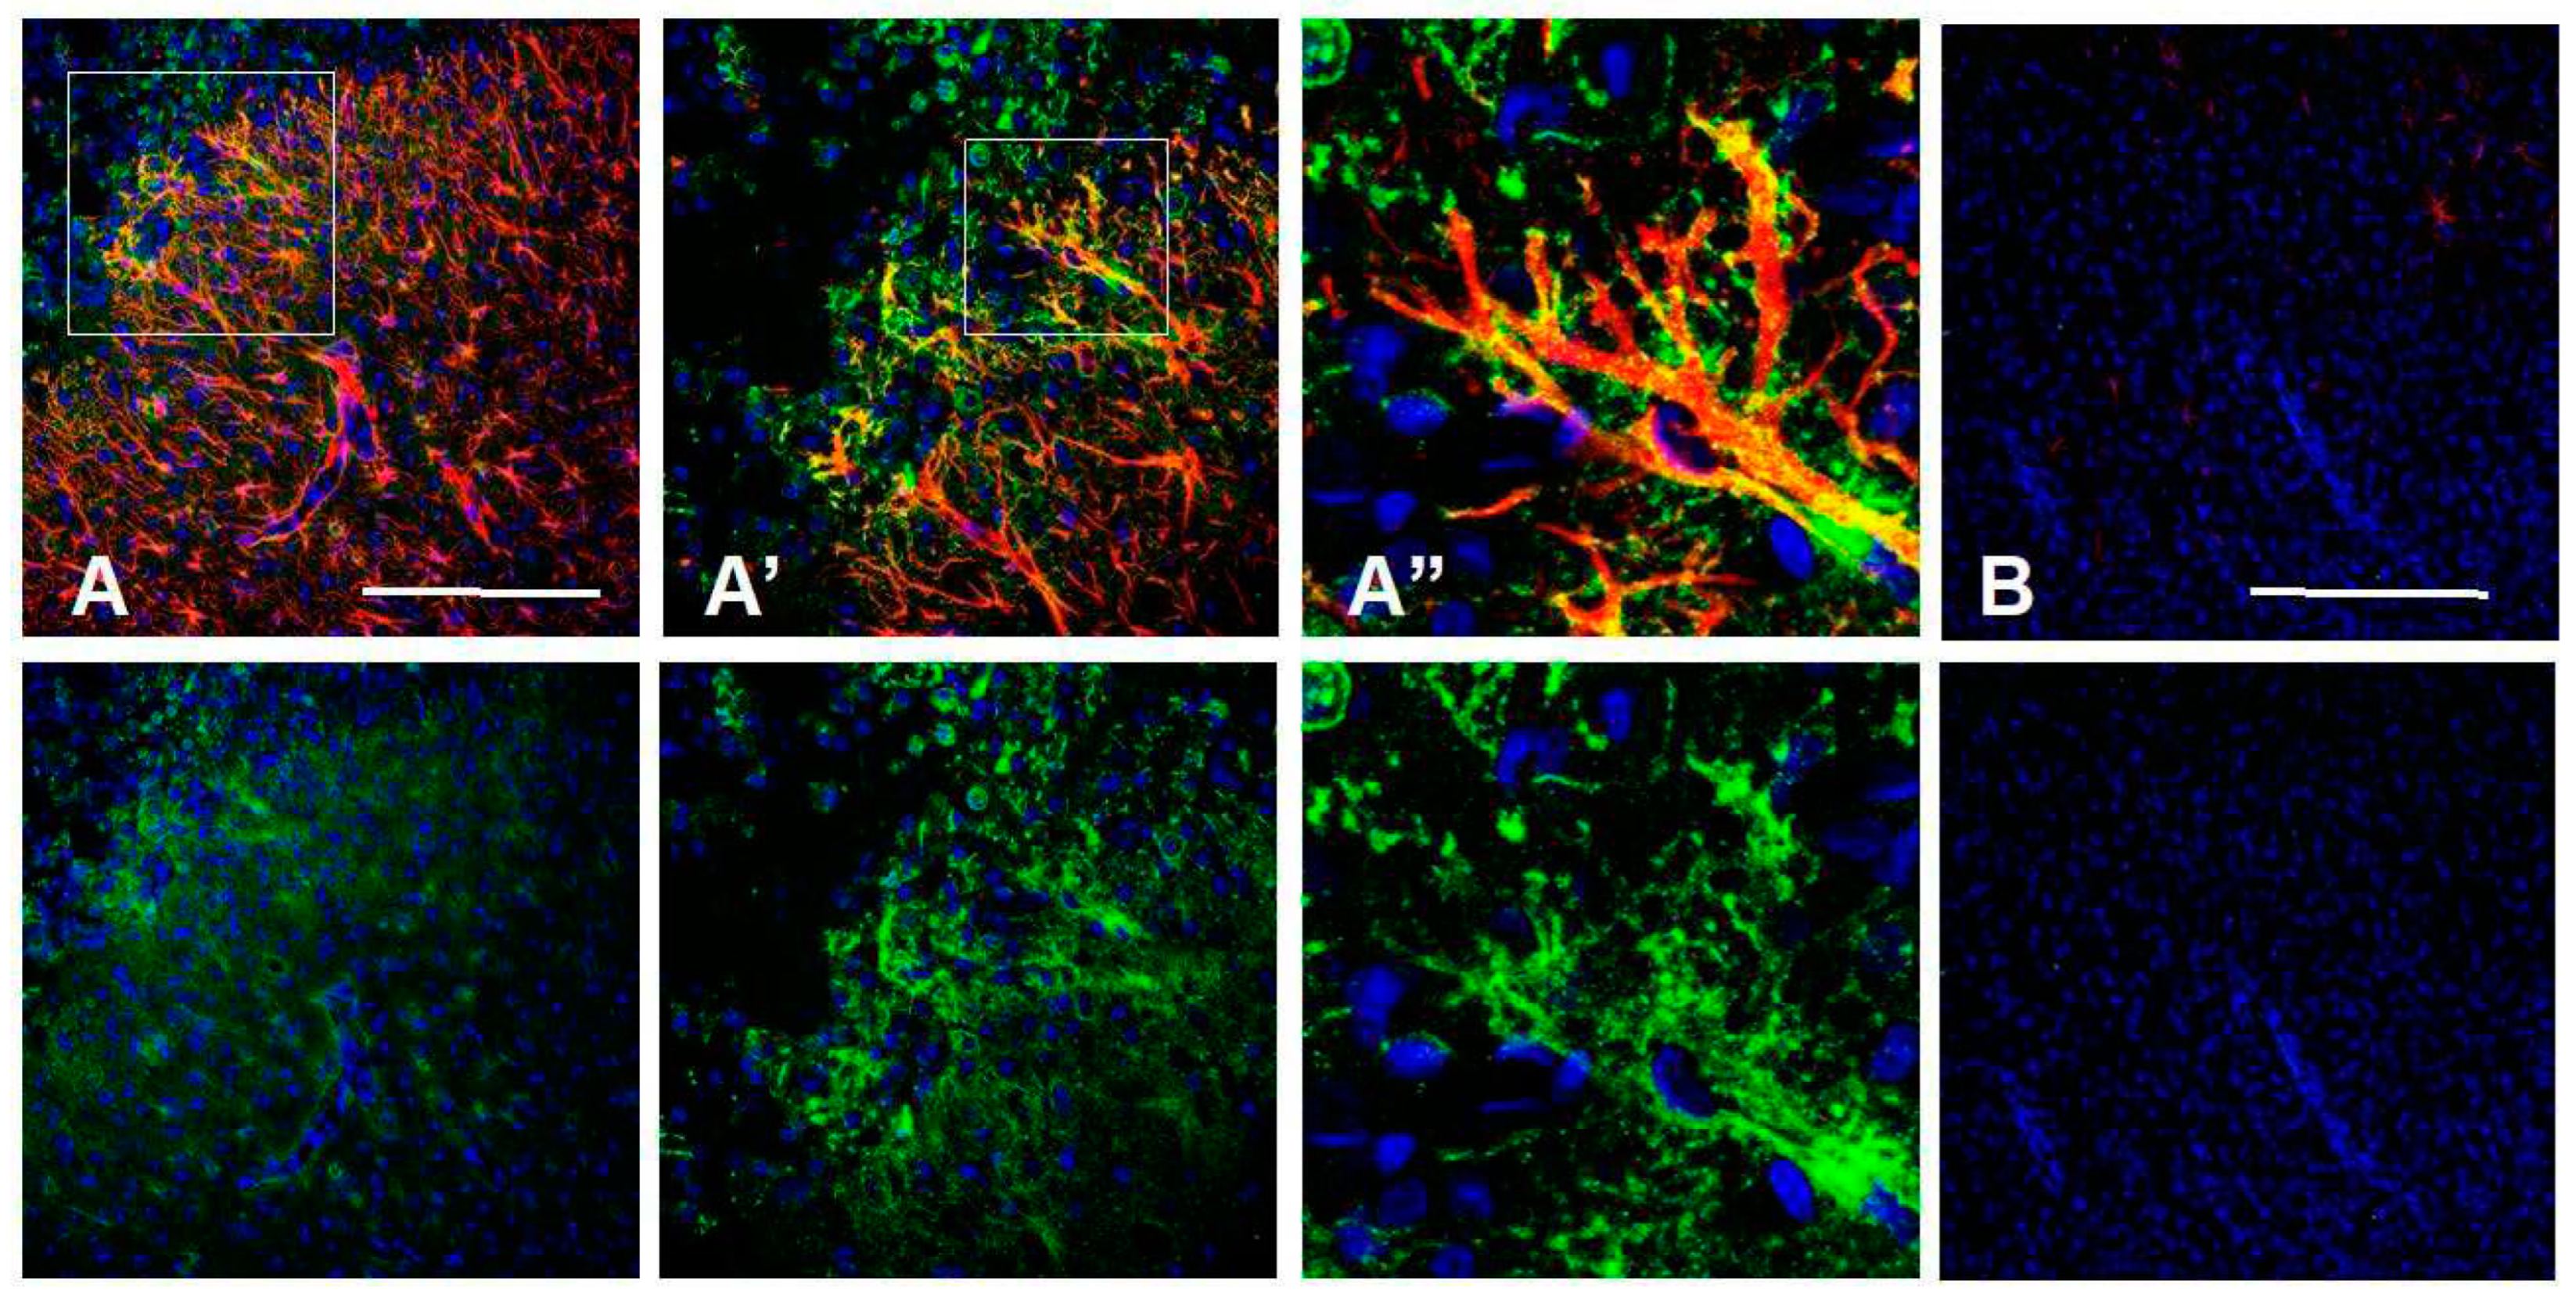
Isocortical astrocytes become CD44+ 7d after transient MCA occlusion. Lower magnification (A) and higher magnifications of boxed area (A’, A’’) show CD44+/GFAP+ astrocytes in the cortex. The contralateral cortex does not show CD44+ astrocytes (B). Top row shows CD44 (green), GFAP (red), DAPI (blue), bottom row shows only CD44 and DAPI of the same fields. Scale bars: 240 mm.
Figure 11.
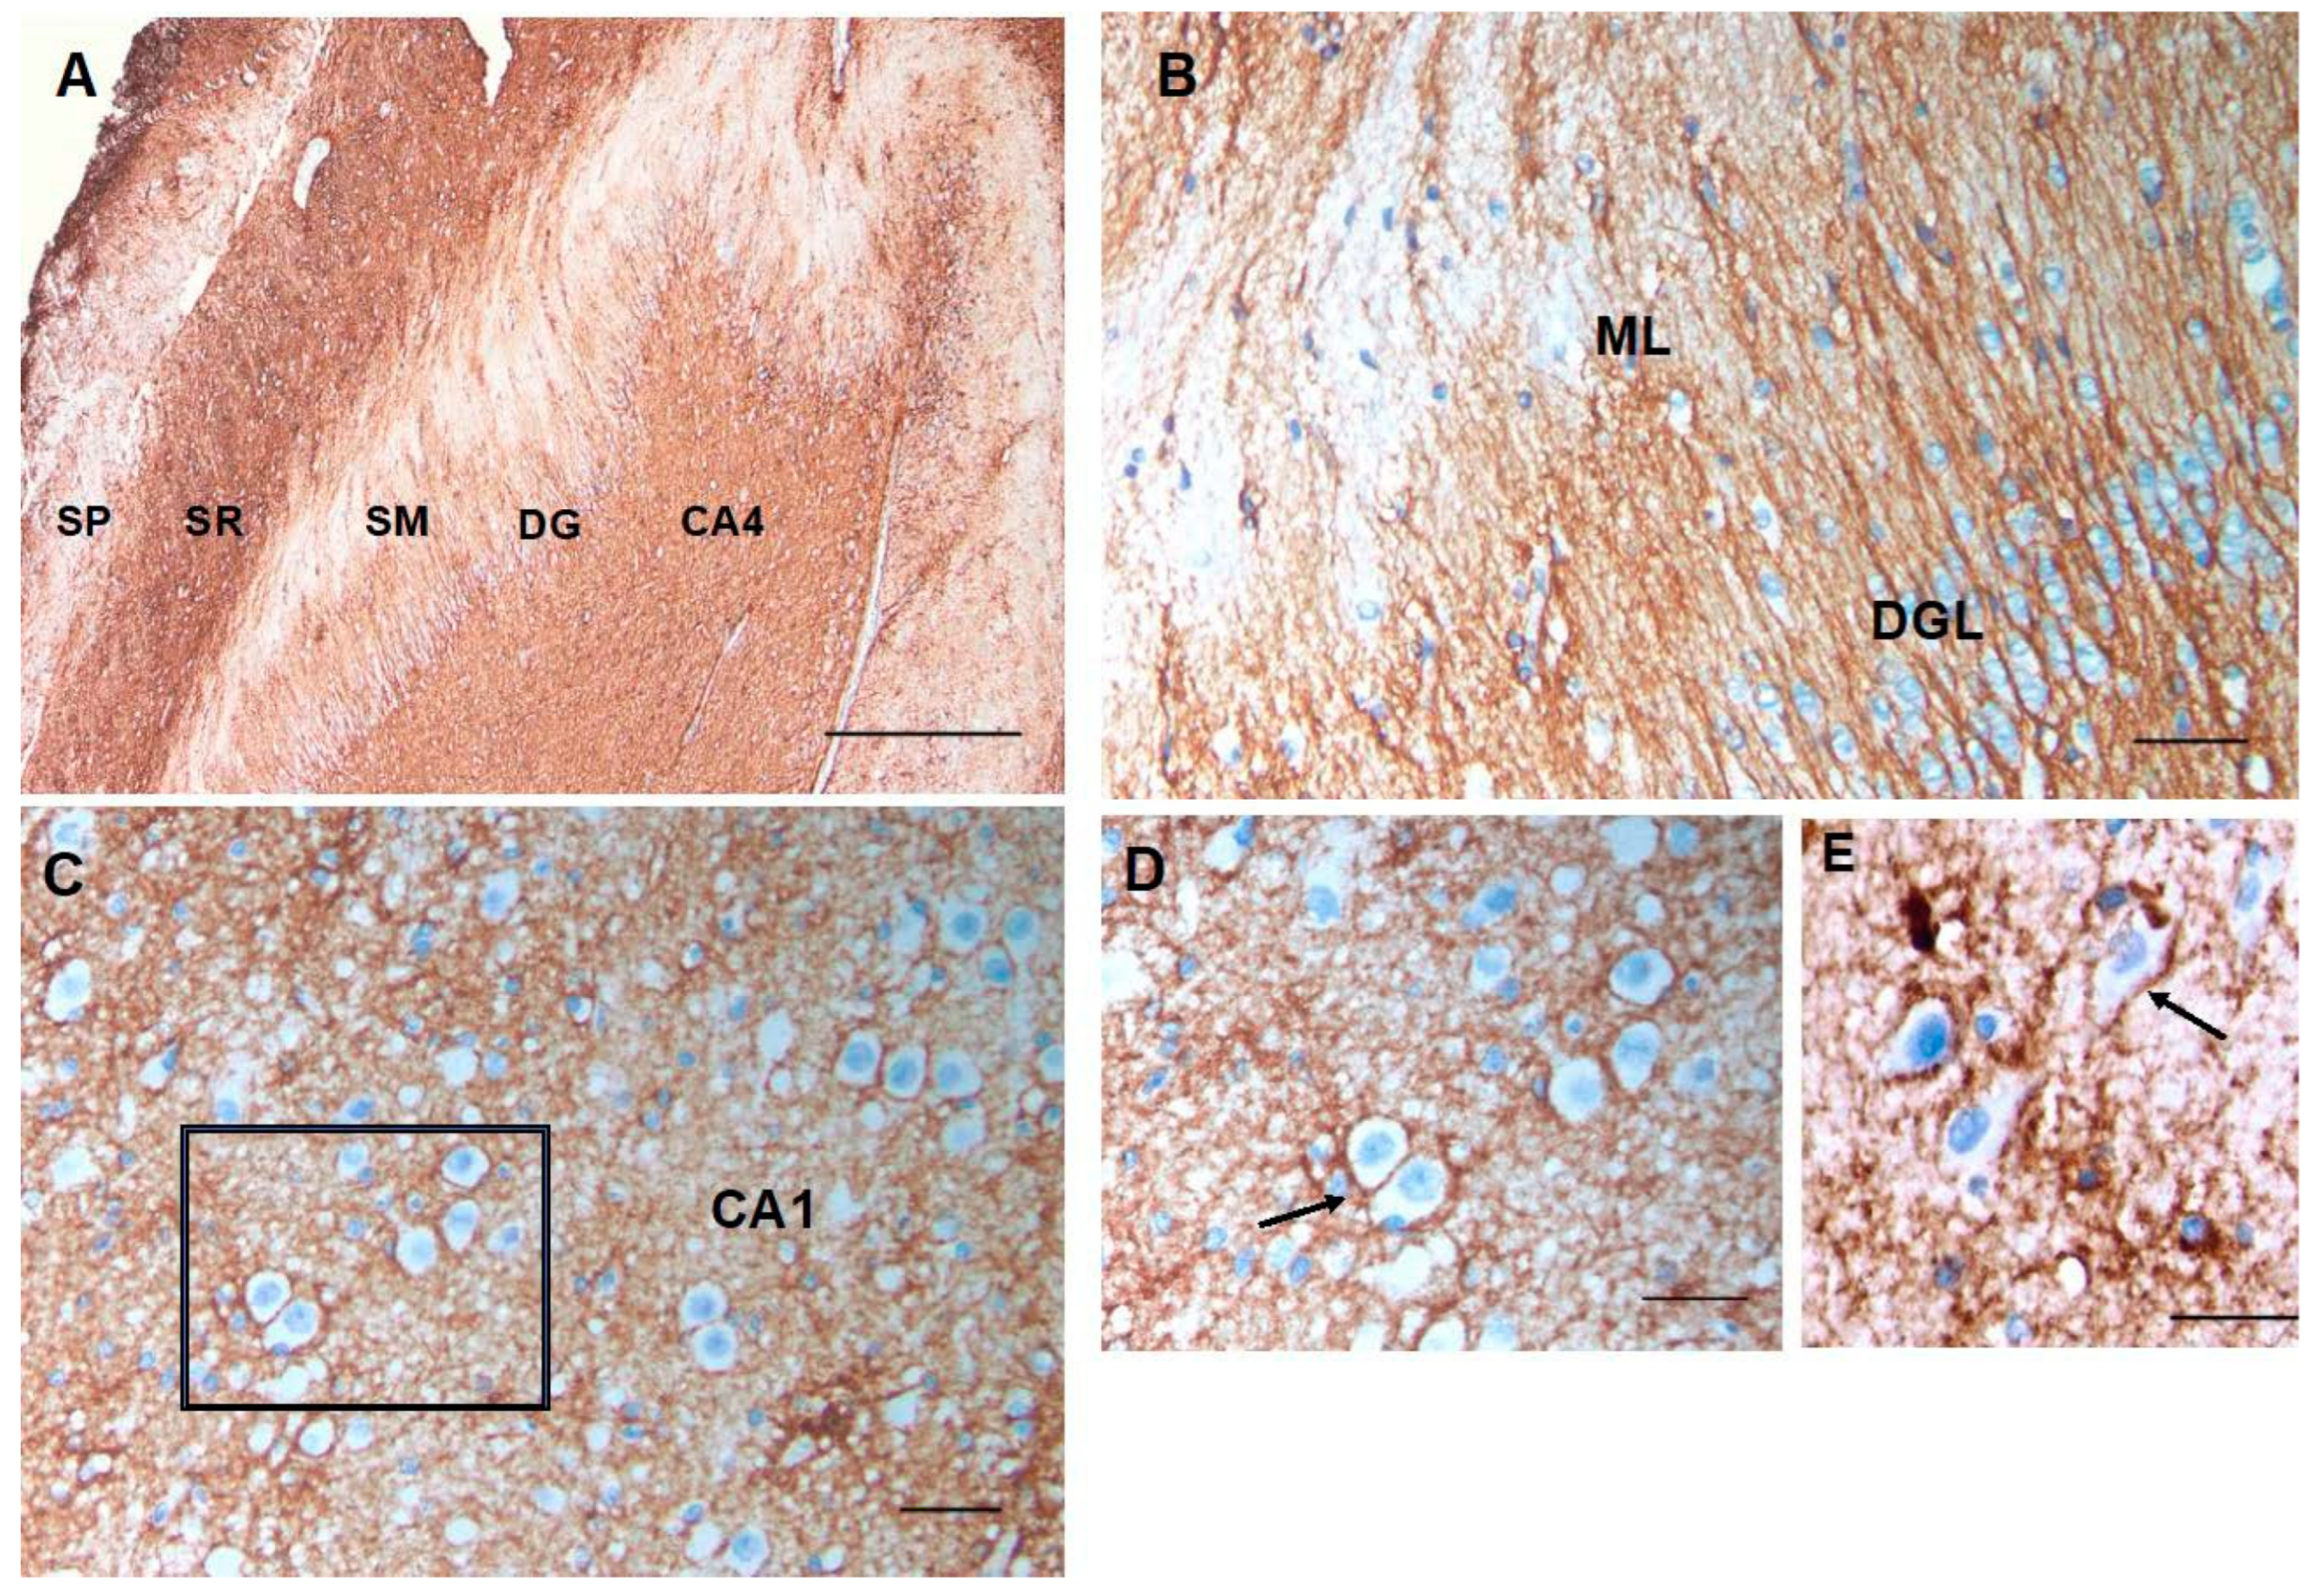
Changes in CD44 in the sclerotic hippocampus in mesial temporal lobe epilepsy. Compare with
Figure 4. There is an increase in CD44 in all layers (abbreviations as in
Figure 4) (A). The radially oriented astrocyte processes in the dentate granule layer (DGL), which extend into the molecular layer (ML) are CD44+ (B). Pyramidal neurons, which are normally not surrounded by CD44+ processes, have become so (C, D). (D) is the boxed area in (C). Pyramidal neu- rons are surrounded by CD44+ processes in another specimen (E). Scale bars: A 200 mm, B 25 mm, C 25 mm , D, E 20 mm.
Figure 12.
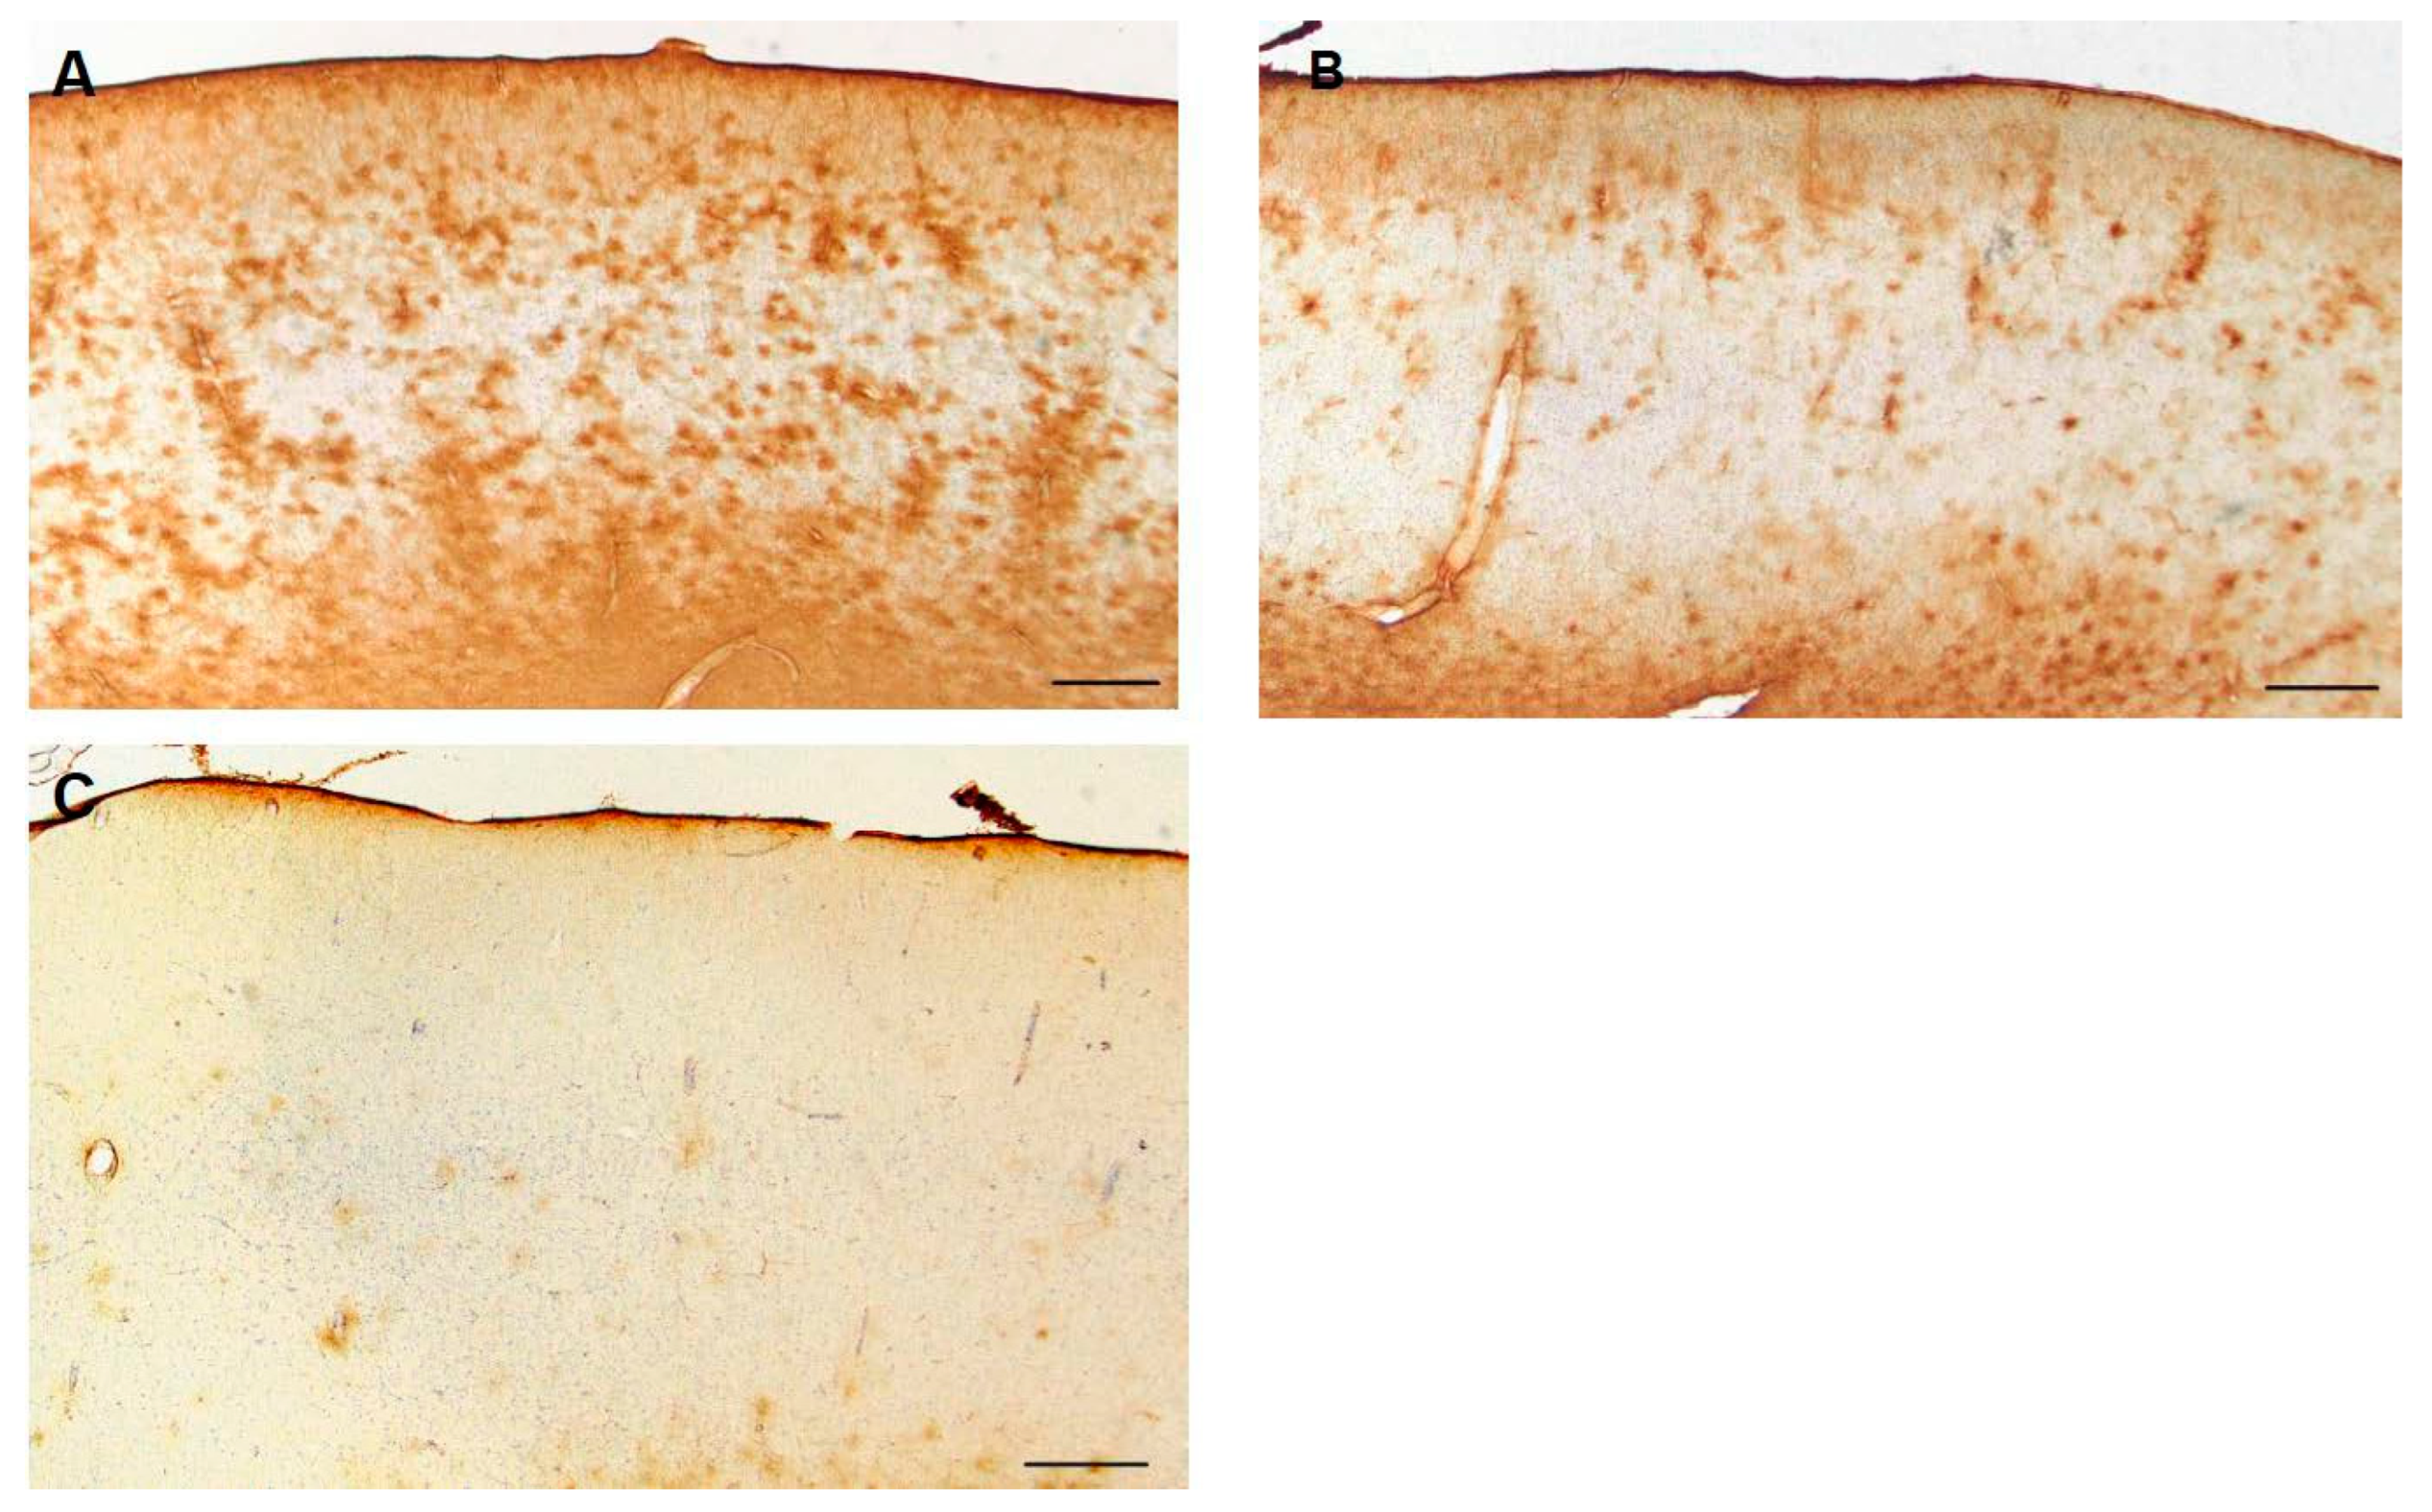
Temporal isocortex in individuals with temporal lobe epilepsy. In some resections, many astrocytes have be- come CD44+ (A). In others, fewer are CD44+ (B, C). The pial surface of the cortex is at the top. Scale bars: A, B, C 250 mm.
Figure 12.
Temporal isocortex in individuals with temporal lobe epilepsy. In some resections, many astrocytes have be- come CD44+ (A). In others, fewer are CD44+ (B, C). The pial surface of the cortex is at the top. Scale bars: A, B, C 250 mm.
Figure 13.
A higher magnification of CD44+ astrocytes in the temporal isocortex reveals that many of them have extended long processes, an abnormal morphology for protoplasmic astrocytes. Scale bar: A 20 mm.
Figure 13.
A higher magnification of CD44+ astrocytes in the temporal isocortex reveals that many of them have extended long processes, an abnormal morphology for protoplasmic astrocytes. Scale bar: A 20 mm.
Figure 14.
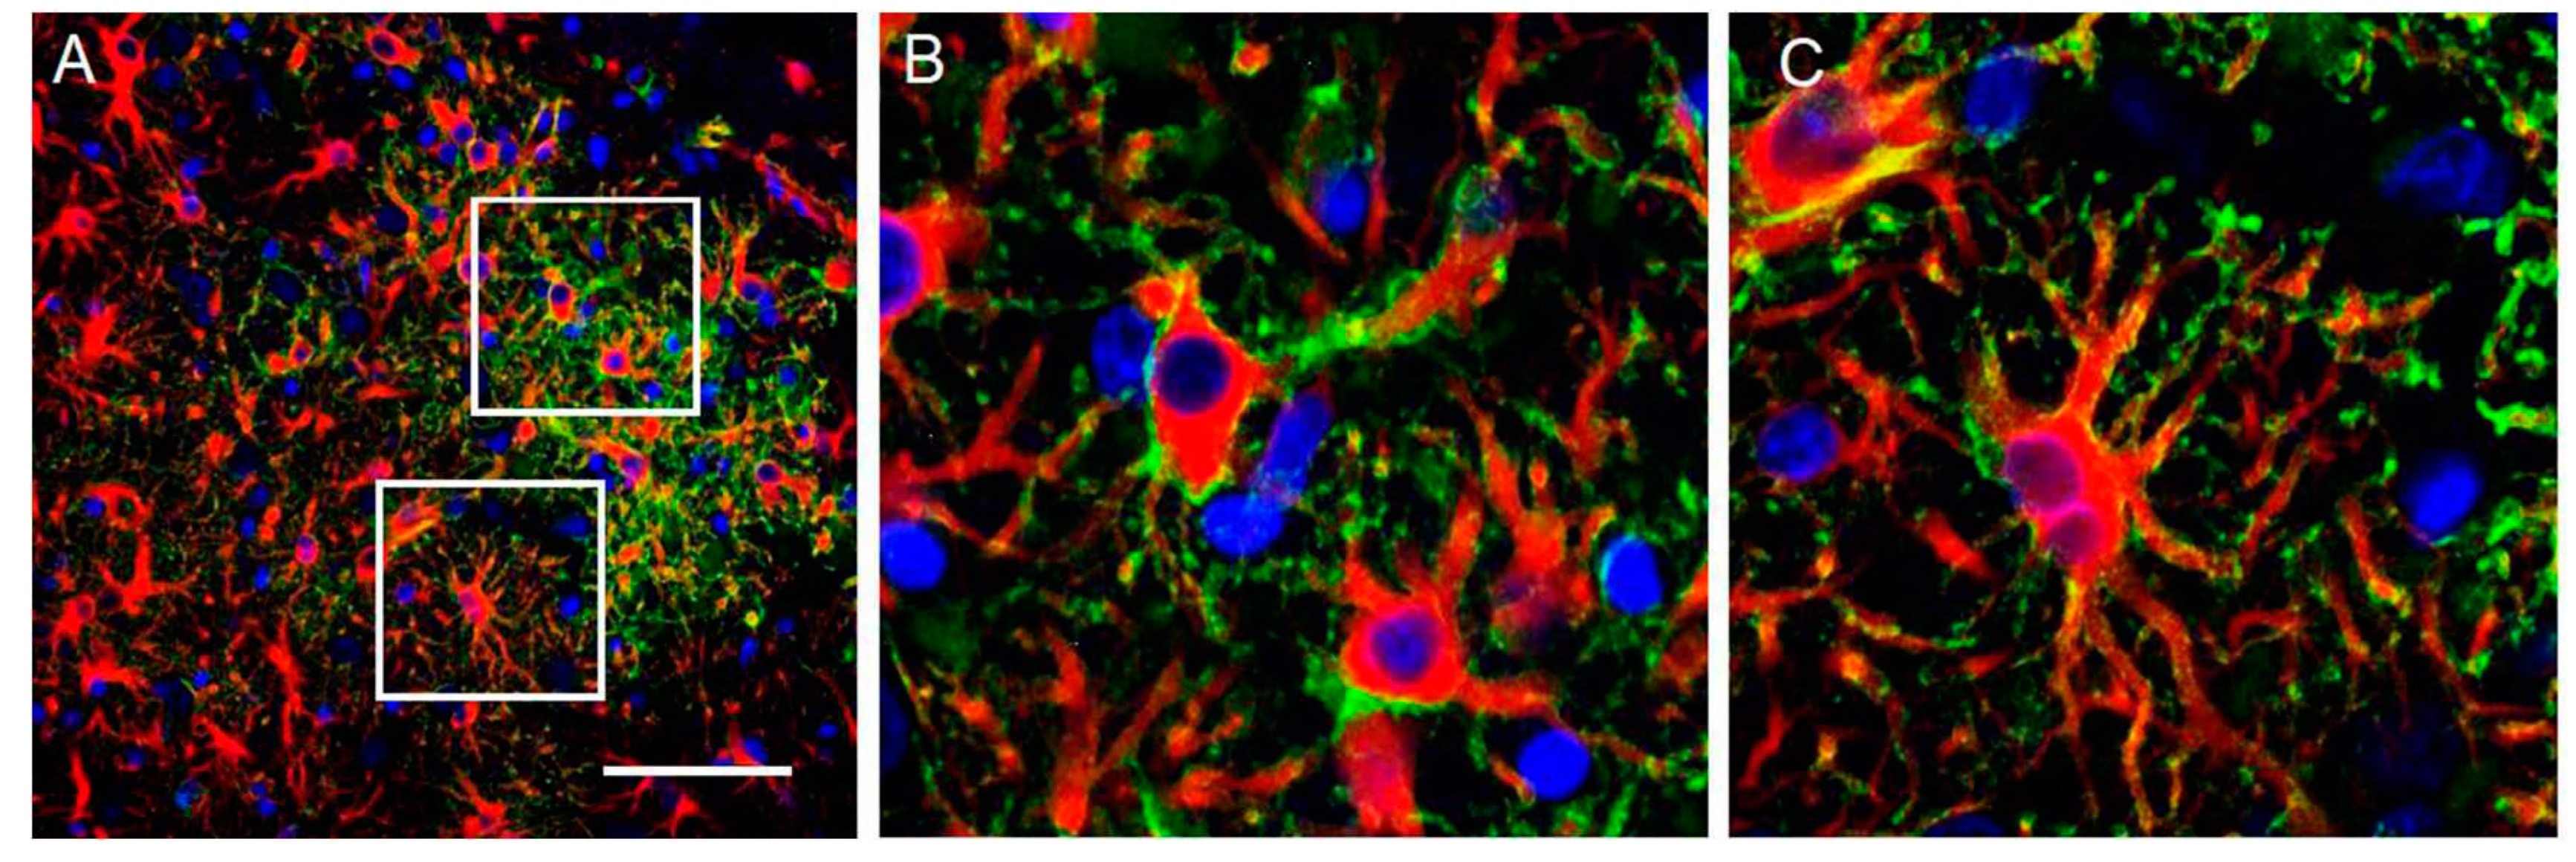
CD44+ astrocytes in the cortex of rats 7 days after pilocarpine-induced seizures. All CD44+ astrocytes are also GFAP+ (A, B, C). (B) and (C) represent boxed areas of (A). GFAP (red), CD44 (green), DAPI (blue). Scale bar: 70 mm.
Figure 14.
CD44+ astrocytes in the cortex of rats 7 days after pilocarpine-induced seizures. All CD44+ astrocytes are also GFAP+ (A, B, C). (B) and (C) represent boxed areas of (A). GFAP (red), CD44 (green), DAPI (blue). Scale bar: 70 mm.

