1. Introduction
In classical general relativity (GR), the final outcome of spherical symmetric collapse of a star ultimately gives us a black hole (BH) with a singularity at its center. It is considered that the space-time singularity is explained by quantum field theory (QFT), but we are not well aware of such a theory. One of the prominent problem of BH singularity is addressed by Einstein theory of gravity. In the past years, efforts have been made in order to find numerous regular BH solutions [
1,
2,
3]. The researchers have also investigated the observational facts of regular BH [
4,
5,
6].
Thermodynamic studies of BH have made significant advancements during the past few decades. The thermodynamic properties of BHs have been examined by theoretical physicists within the contexts of holography and geometry [
7,
8], thermal and non-thermal radiations [
9,
10], entropy [
11,
12] and thermodynamic phase transition [
13,
14,
15]. According to these findings, BH thermodynamics is a fascinating and crucial area of study in GR. It is also well known that BHs are thermodynamical systems with Hawking temperature. In BH thermodynamical systems, the event horizon contains an irreducible mass distribution analogous to thermodynamic entropy [
16,
17,
18].
The Bekenstein-Hawking entropy is named after the two scientists who first noticed similarities in their theories, and it is defined as being proportional to the size of the event horizon [
19]. Under such consideration, Bekenstein suggests the need for correction in the surface area due to the entropy relation, which expresses a new concept of thermal fluctuation as well as the holographic principle [
20]. The BH geometry recognize the ramifications and influence of thermal fluctuation onto the BH. Actually thermal fluctuation is the comprehensive phenomena due to the statistical perturbation and have a remarkable significance in the BH structure. Theoretically it is regarded that BH size reduces due to the Hawking radiations and hence, increasing its temperature.
In Ref. [
21] charged BHs with negative cosmological constant were studied by Faizal et al. They found the impact of logarithmic correction on entropy and thermodynamic quantities of such BHs. Pourhassan and Faizal [
22] worked on rotating AdS BH to analyze the impact of thermal fluctuations on thermodynamical potentials and observed that for small BHs logarithmic entropy correction have significant importance. The non-minimal regular BHs [
23] were also used to check the impact of thermal fluctuations by Jawad and Shahzad, they found stability both locally and globally with the increasing values of the cosmological constant. Zhang [
24] scrutinize the RN and Kerr-Newman-AdS BHs to see the effects of first-order entropy correction and conclude that the correction in entropy pretends the thermodynamical quantities of BHs with small radii.
Tharanath et al. [
26] contemplate the regular BHs in order to determine the thermodynamical aspects and phase space. Kubiznak and Mann [
27] illustrated the phase space of charged BH with both large and small radii, which is the resemblance with the phase space of liquid/gas fluids. For the Schwarzschild AdS BH Hawking and Page pay contribution in phase transitions. In Ref. [
28] Chakraborty et al. demonstrated the topological properties in the Horava Lifshitz gravity for the BH thermodynamics and conclude that with the large value of the horizon radius, phase transitions appear from a stable region to an unstable region in the Horava Lifshitz gravity. Wei et al. [
29] studied the five-dimensional charged BH and revealed the phase changes. In
theory of gravity associated with Yang-Mills filed along with pressure as a cosmological constant Ovgun [
30] examines the thermodynamics and checks the stability and phase space. They also, established a relation between null geodesics and phase change to show the detailed behavior of the system by considering the AdS charged BH. Saleh et al. [
31] probe the Bardeen BH-surrounded quintessence to examine the thermodynamical properties and phase transition. Kuang et al. [
32] contributed to the non-linear electromagnetic BH to evaluate thermal quantities. The evaluation of critical values with first and second phase transformations by an extremal limit of BHs without mentioning the specific type of BHs is evaluated by Bhatacharya et al. [
33]. Balart and Vagenas [
34] extract many regular BH solutions coupled with non-linear electrodynamics and state that some of them bear resemblance to RN-BH. The study of dilaton BH coupled with non-linear electrodynamics field disclose the thermal properties as well as zeroth order phase transitions is exhibited by Dayyani [
35]. Jawad et al. [
36] calculated the effect of a non-linear electrodynamic field on the angle of deflection of the weak field of RN-BH.
Quasi-normal modes (QNMs) characterize field perturbations and provide important information about the compact objects like BHs. Vishveshwara [
37] was the for the analytical QNM modeling with the wave functions for Schwarzschild BH. After studying the second-order phase transition QNMs of RN-BH, Jing et al. [
38] observed that the QN frequency oscillates with charge and has a spiral shape. He et al. [
39], Konoplya and Zhidenko [
40] observed that the perturbed equation and gravitational stability are incompatible. Quasi-normal modes wave-functions of static and moving BHs were illustrated by Leaver [
41]. Churilova [
42] corrected Einstein theory for discrepancies and established analytical QNMs of BHs in distinct theories. He found an empirical correlation for Schwarzschild geometry in eikonal QNM analysis. Sakalli et al. [
43] detected QNMs and the Klein-Gordon equation solution with cosmic string in Born-Infeld dilaton space-time. Wei and Liu [
44] find that QNMs for RN-BH in the eikonal limit by utilizing the angular velocity and Lyapunov exponent of the photon sphere.
There are many regular BH solutions, such as the regular Bardeen BH and charged BHs in the context
T-duality [
45,
46] and non-commutative geometry [
47].
T-duality is the major concept used to describe string theories in higher-dimensional space-time. In the literature, many BH solutions have been identified by their topological structural properties. Nevertheless, other BH solutions with different topological structural properties exist mathematically.
We focus our attention on a unique solution of BH that is non-rotating, electrically charged and whose topological structure is torus-like. The torus-like topology can be established by calculating the Einstein-Maxwell field equation with AdS space-time. In Ref. [
48] Huang and Liang are the pioneers of constructing the torus like the BH solution. The thermodynamical aspect of a torus like BH was evaluated in [
49,
50,
51]. Furthermore, Lemos and Zanchin [
52] found another solution of a torus-like BH by figuring out the Einstein-Maxwell field equation with AdS space-time, and such solution is said to be black string. Liang et al. [
53] investigate the Joule-Thomson expansion of a torus-like BH in an extended phase space. They have come to the conclusion that in contrast to spherical BHs, the torus-like one possesses a horizon that has a toroidal topology. Yin et al. [
54] have focused on how the chaos around a torus-shaped BH changes in two places: close to the BH horizon and at a certain distance from it. The particles angular momentum affects its effective potential and the extent of its chaotic behavior. From the spherically symmetric BH solution Jusufi [
55] proposed lately to a new family of BH solutions with topologies as diverse as a torus-like BH and a black string. The special charged BH obtained by the static, spherically symmetric solution of the Einstein-Maxwell equations with the negative cosmological constant is known as torus-like BH. A torus like BH exhibits topological structure in its space-like cross section of the horizon radius. According to the BH topology theorem, the horizon radius of the BH has the topological structure
The torus-like BH solution of Einstein Maxwell equations is given by the metric [
56,
57].
where
The above-mentioned equation contains mass
M, charge
Q and cosmological constant
. The nature BH is of Pertov type D as
, and dS/AdS depends on the sign of cosmological constant. A torus-like BH solution is obtained as
and
which reveal the same topology as torus-like. Normally, the topological structure of manifolds consists of
where
topology is some two-dimensional manifolds such as
Here, we study the thermodynamic characteristics with entropy correction terms through thermal fluctuation with simple logarithmic corrections for the torus-like BH. Furthermore, we examine the QNMs of torus-like BH. The paper is organised as follow: In the section I, we rewrite the solution of torus-like BH. In II, we represent the corrected quantities of thermodynamics by the thermal fluctuation. Also in the section III, we establish a relation between the null geodesics and QNMs. The section IV, summaries our findings.
2. Thermodynamical Potentials and related Thermal Fluctuation
In the framework of thermodynamics, we will investigate the mass, Hawking temperature, and heat capacity of the torus-like charge AdS BH. We subsequently concentrated on managing the corrected thermodynamic quantities using the entropy correction of the torus-like charge AdS BH. Entropy, pressure, Gibbs free energy, Helmholtz free energy, enthalpy, and specific heat are some of the characteristics that have been modified. The BH entropy is follow as
where
is the horizon radius of the BH.
Utilizing the partition function, we are able to derive the revised entropy expression [
58] as,
where
E and
denote the average energy and quantum density. Quantum density can be calculated by applying the inverse Laplace transformation to the partition function as given below
where
and
is the corrected entropy which dependent on Hawking temperature. By Taylor’s expansion, we get
Now putting the values of Equation (
6) in Equation (
5), gives us which equates to
So, after simplifying, we get
The corrected terms of the BH entropy are enhanced by substituting a most generic parameter, denoted
, for the factor
. The modified entropy can be expressed as [
59]
In this case,
is the correction parameter for the higher order correction. We have the following results for various values of
and
as given below
I- When , , it gives us the BH entropy, uncorrected.
II- For , , a higher-order set of remedial terms.
III- Here , , it allows for a second-order correction.
IV- As , typically, a simple logarithmic correction is obtained.
To calculate the thermodynamic properties throughout this study, we assume the situation of simple logarithmic corrections (
= 0 and
). Notably, the effect of leading-order corrections to the BH entropy by the logarithmic terms is negligible in Equation (
9).
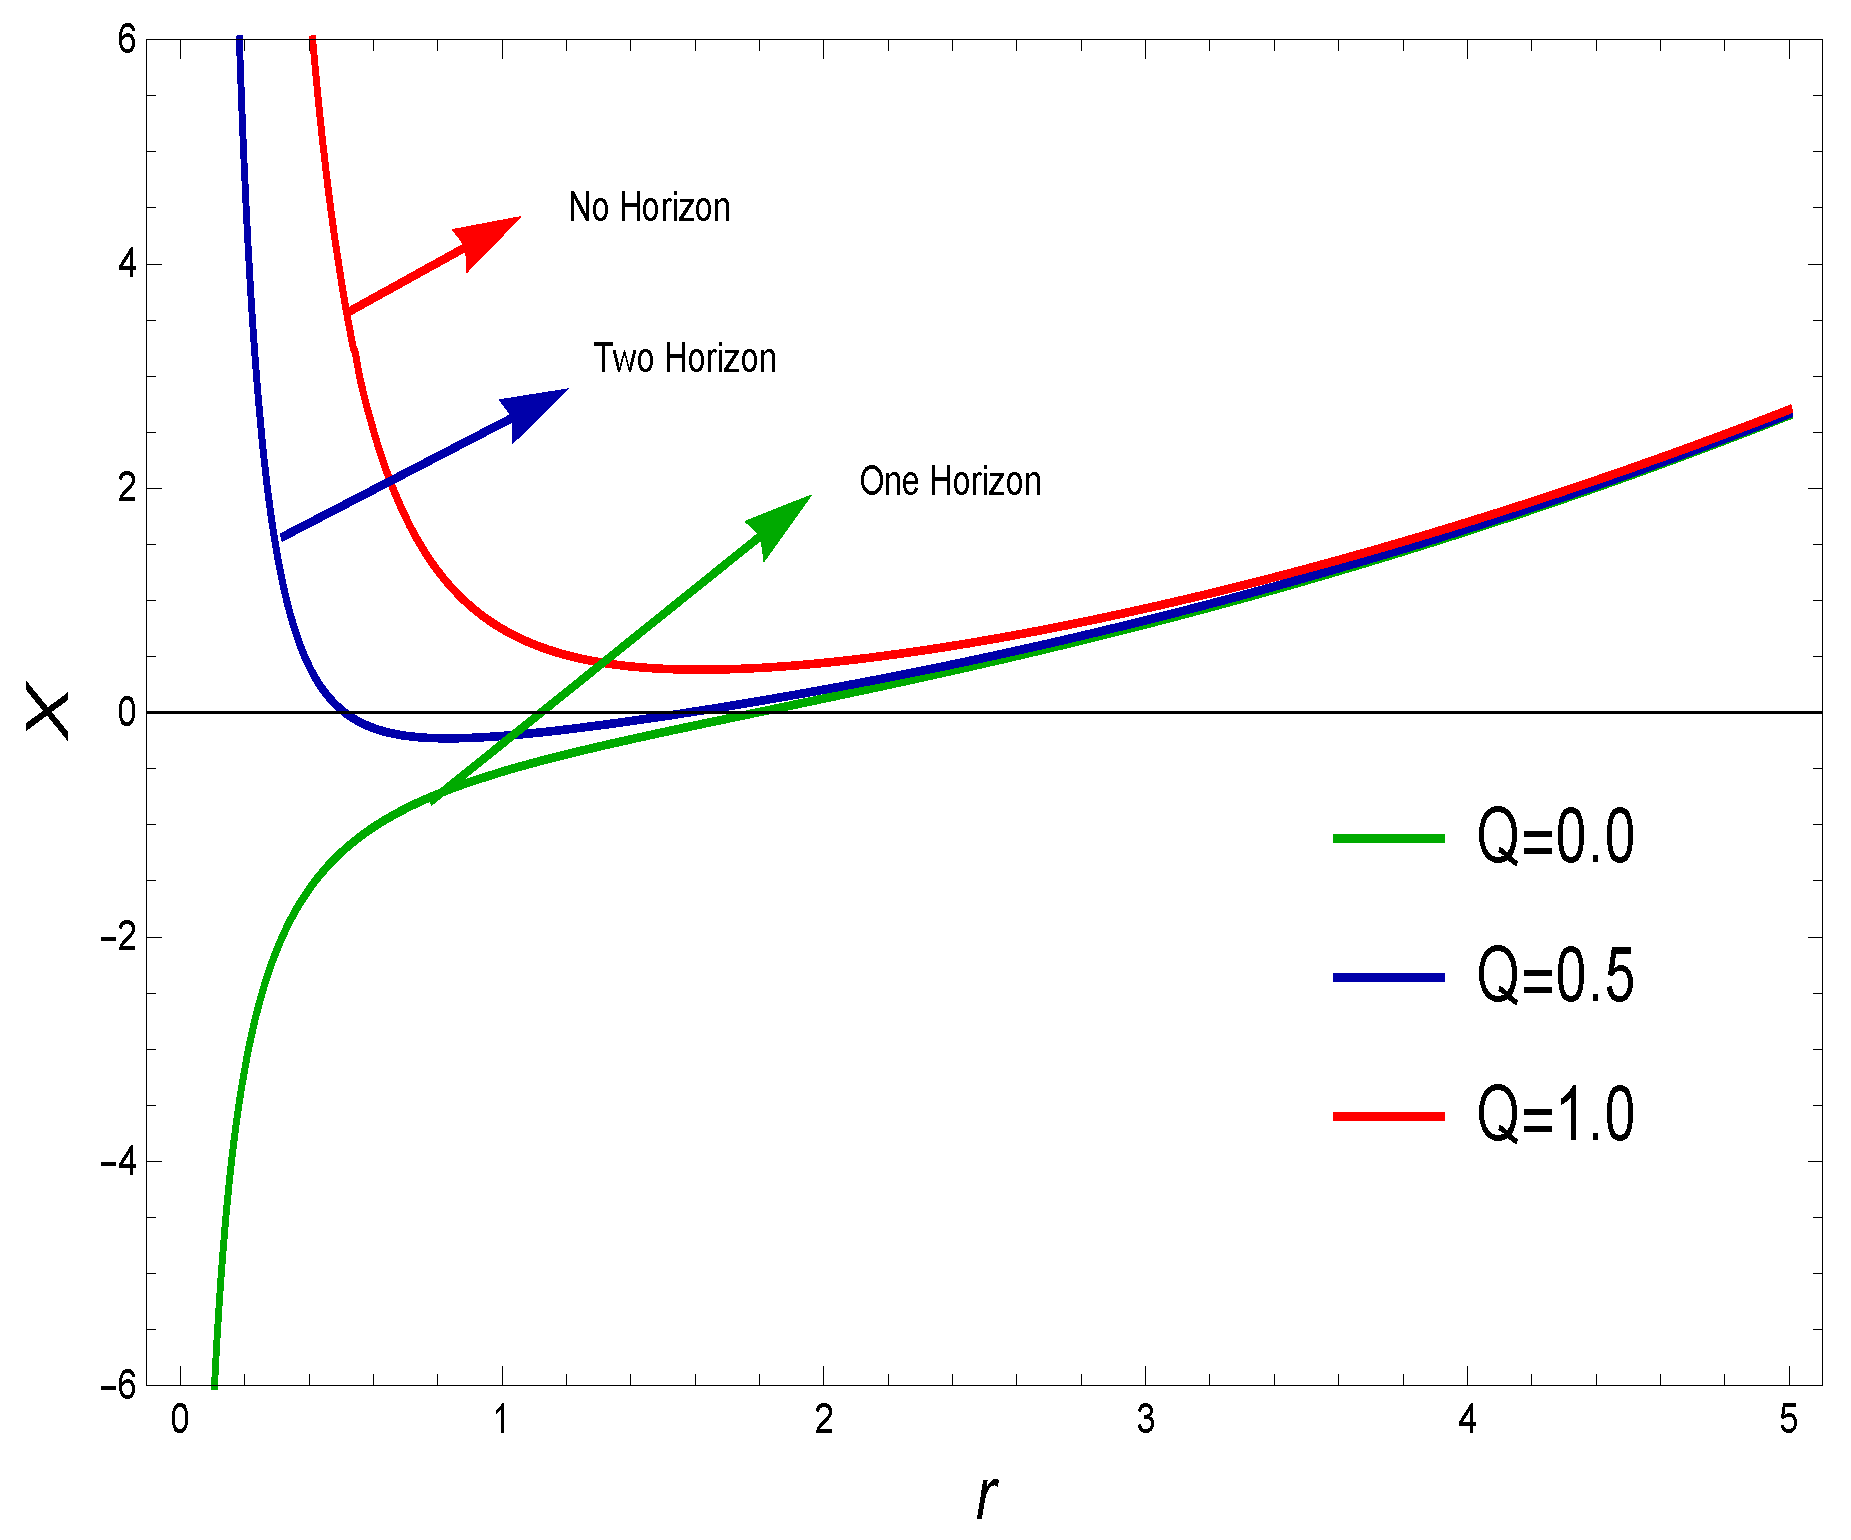
Figure 1.
The graph of N as a function of r with .
Figure 1.
The graph of N as a function of r with .
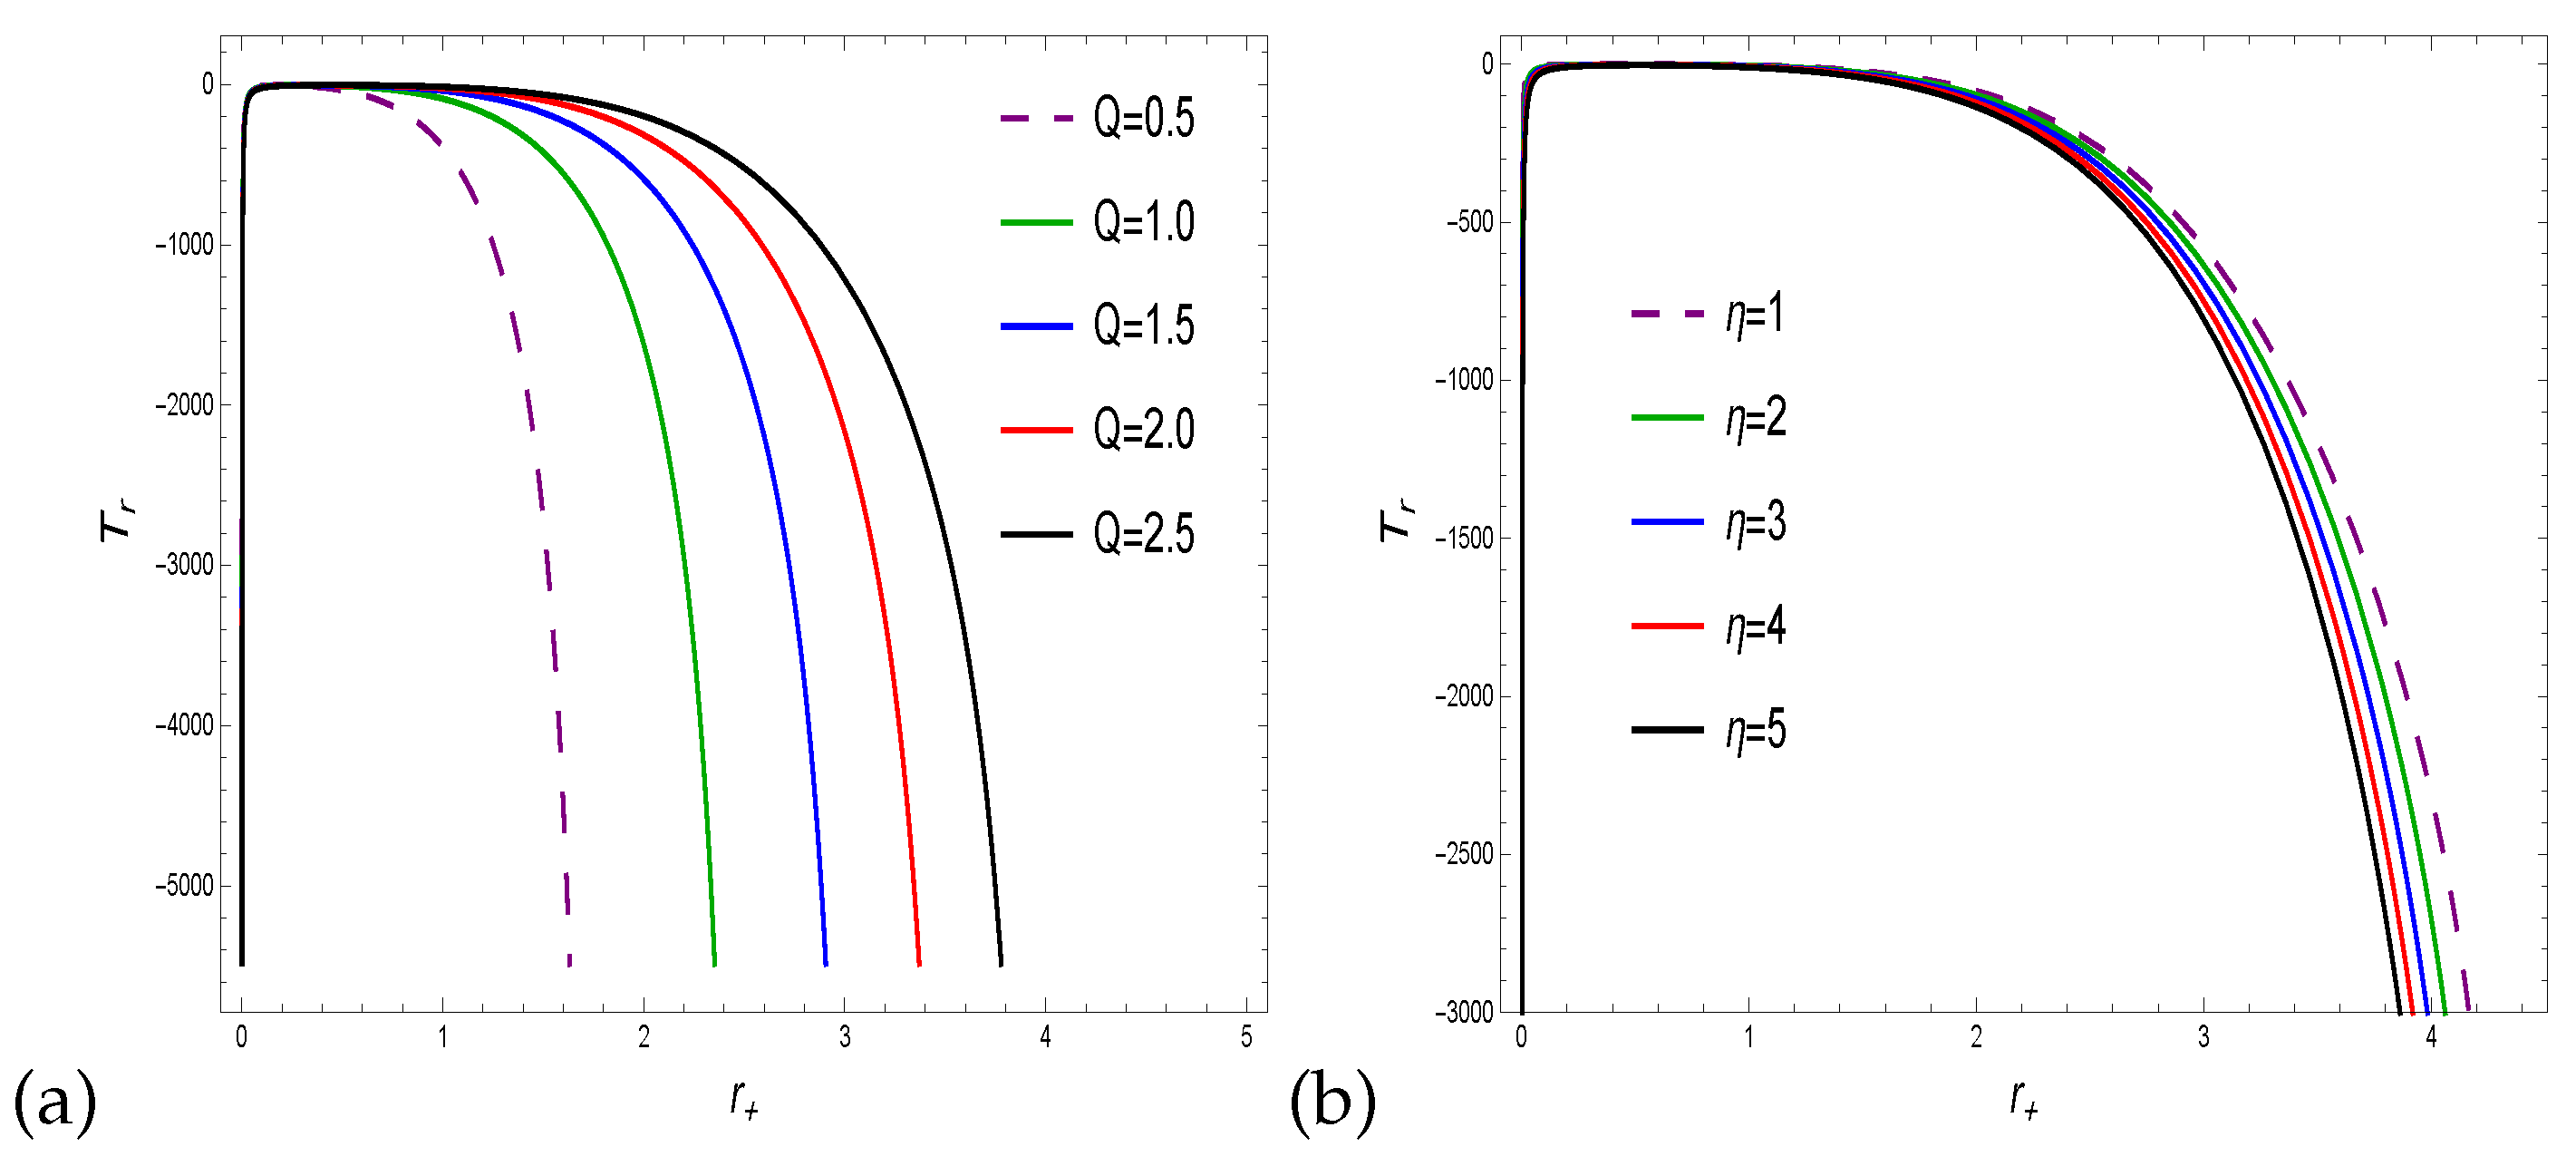
The BH Hawking temperature
, is given by
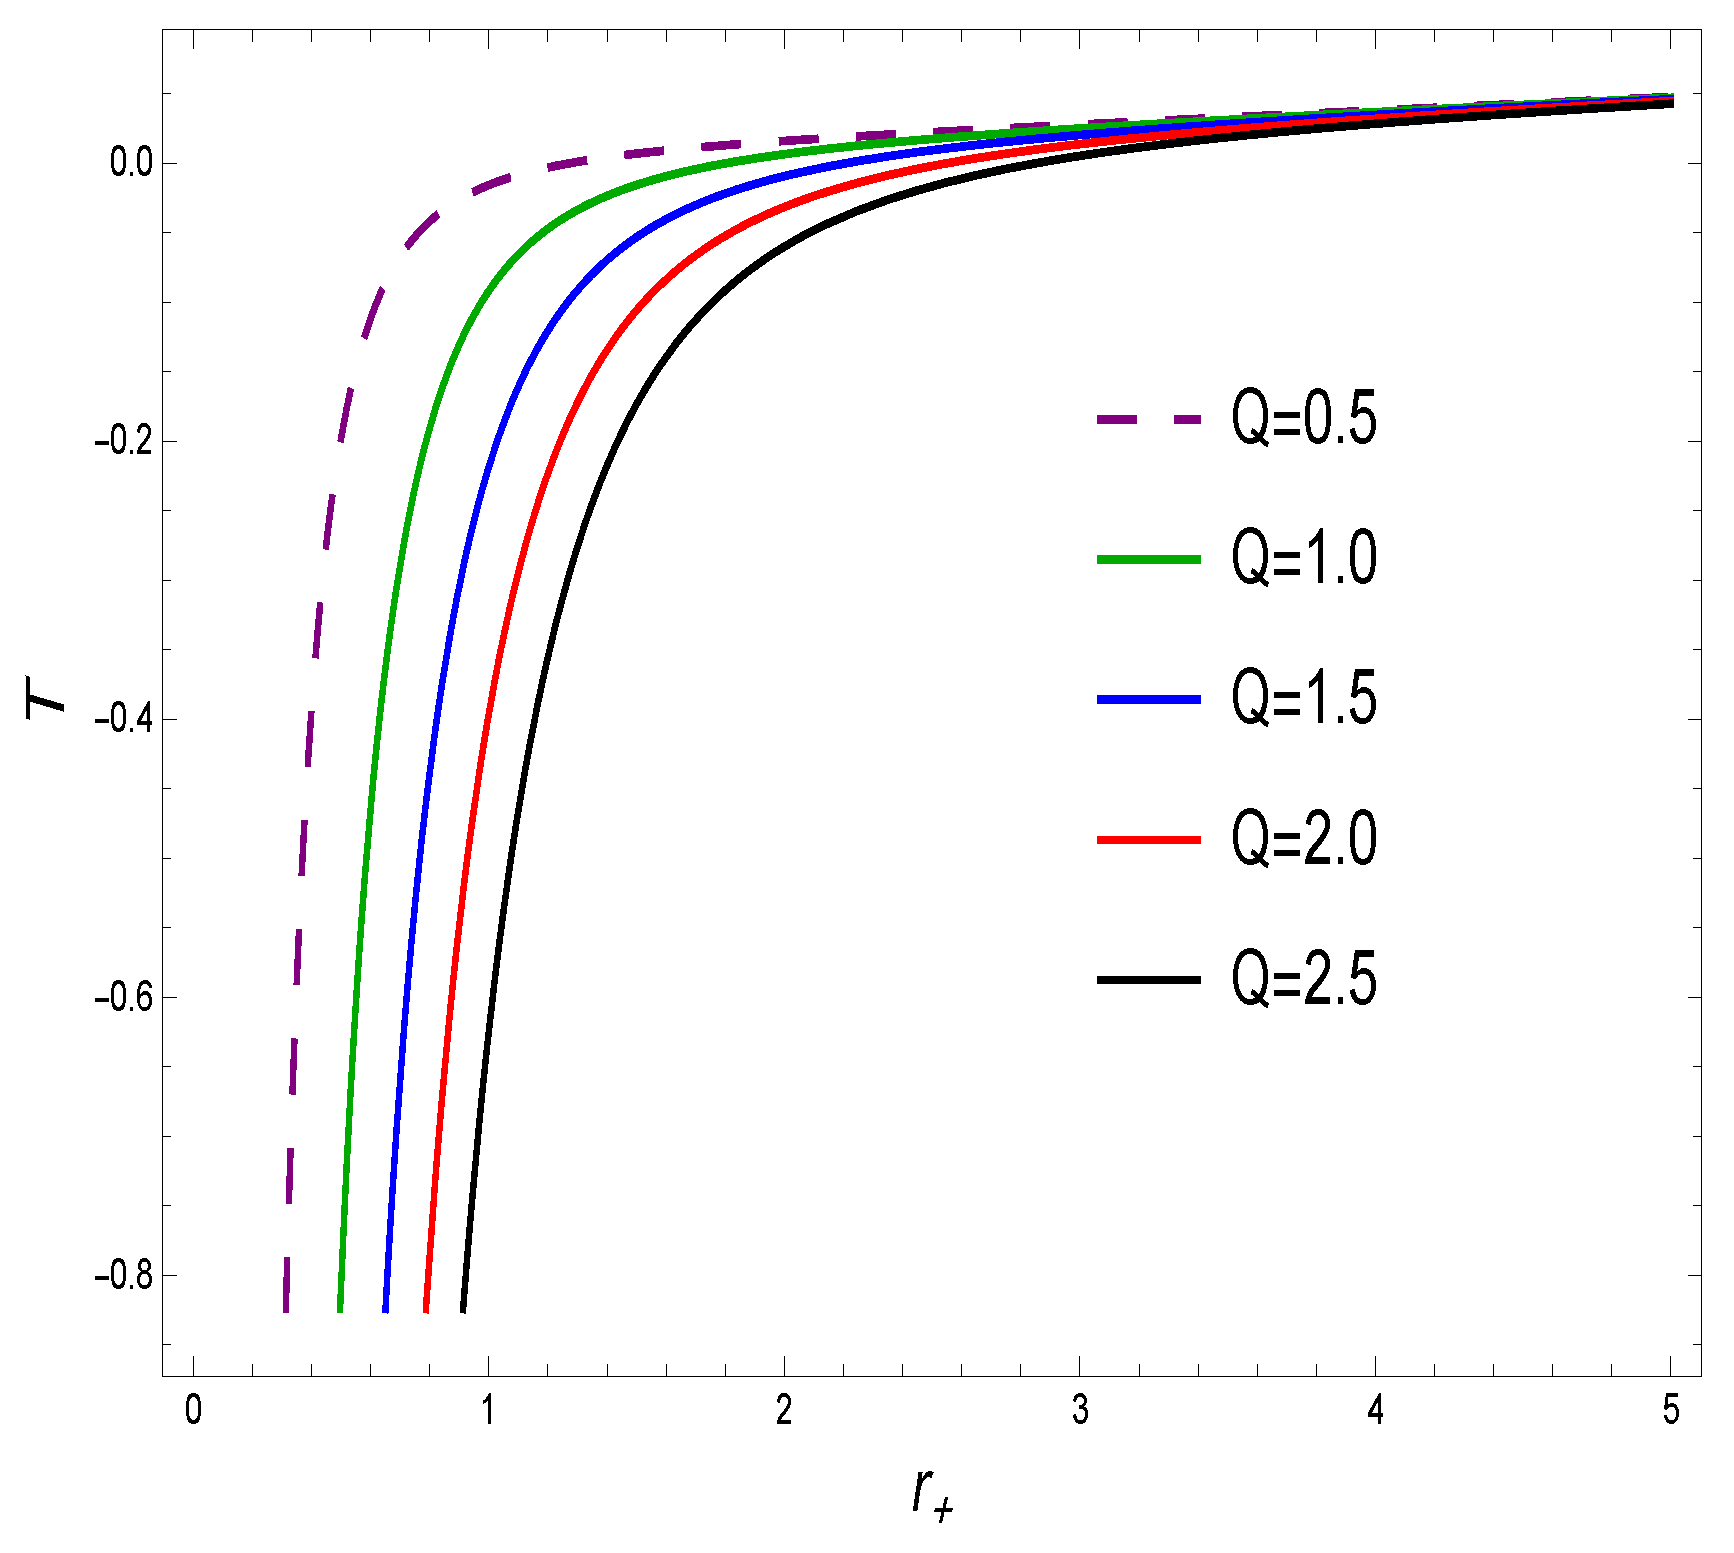
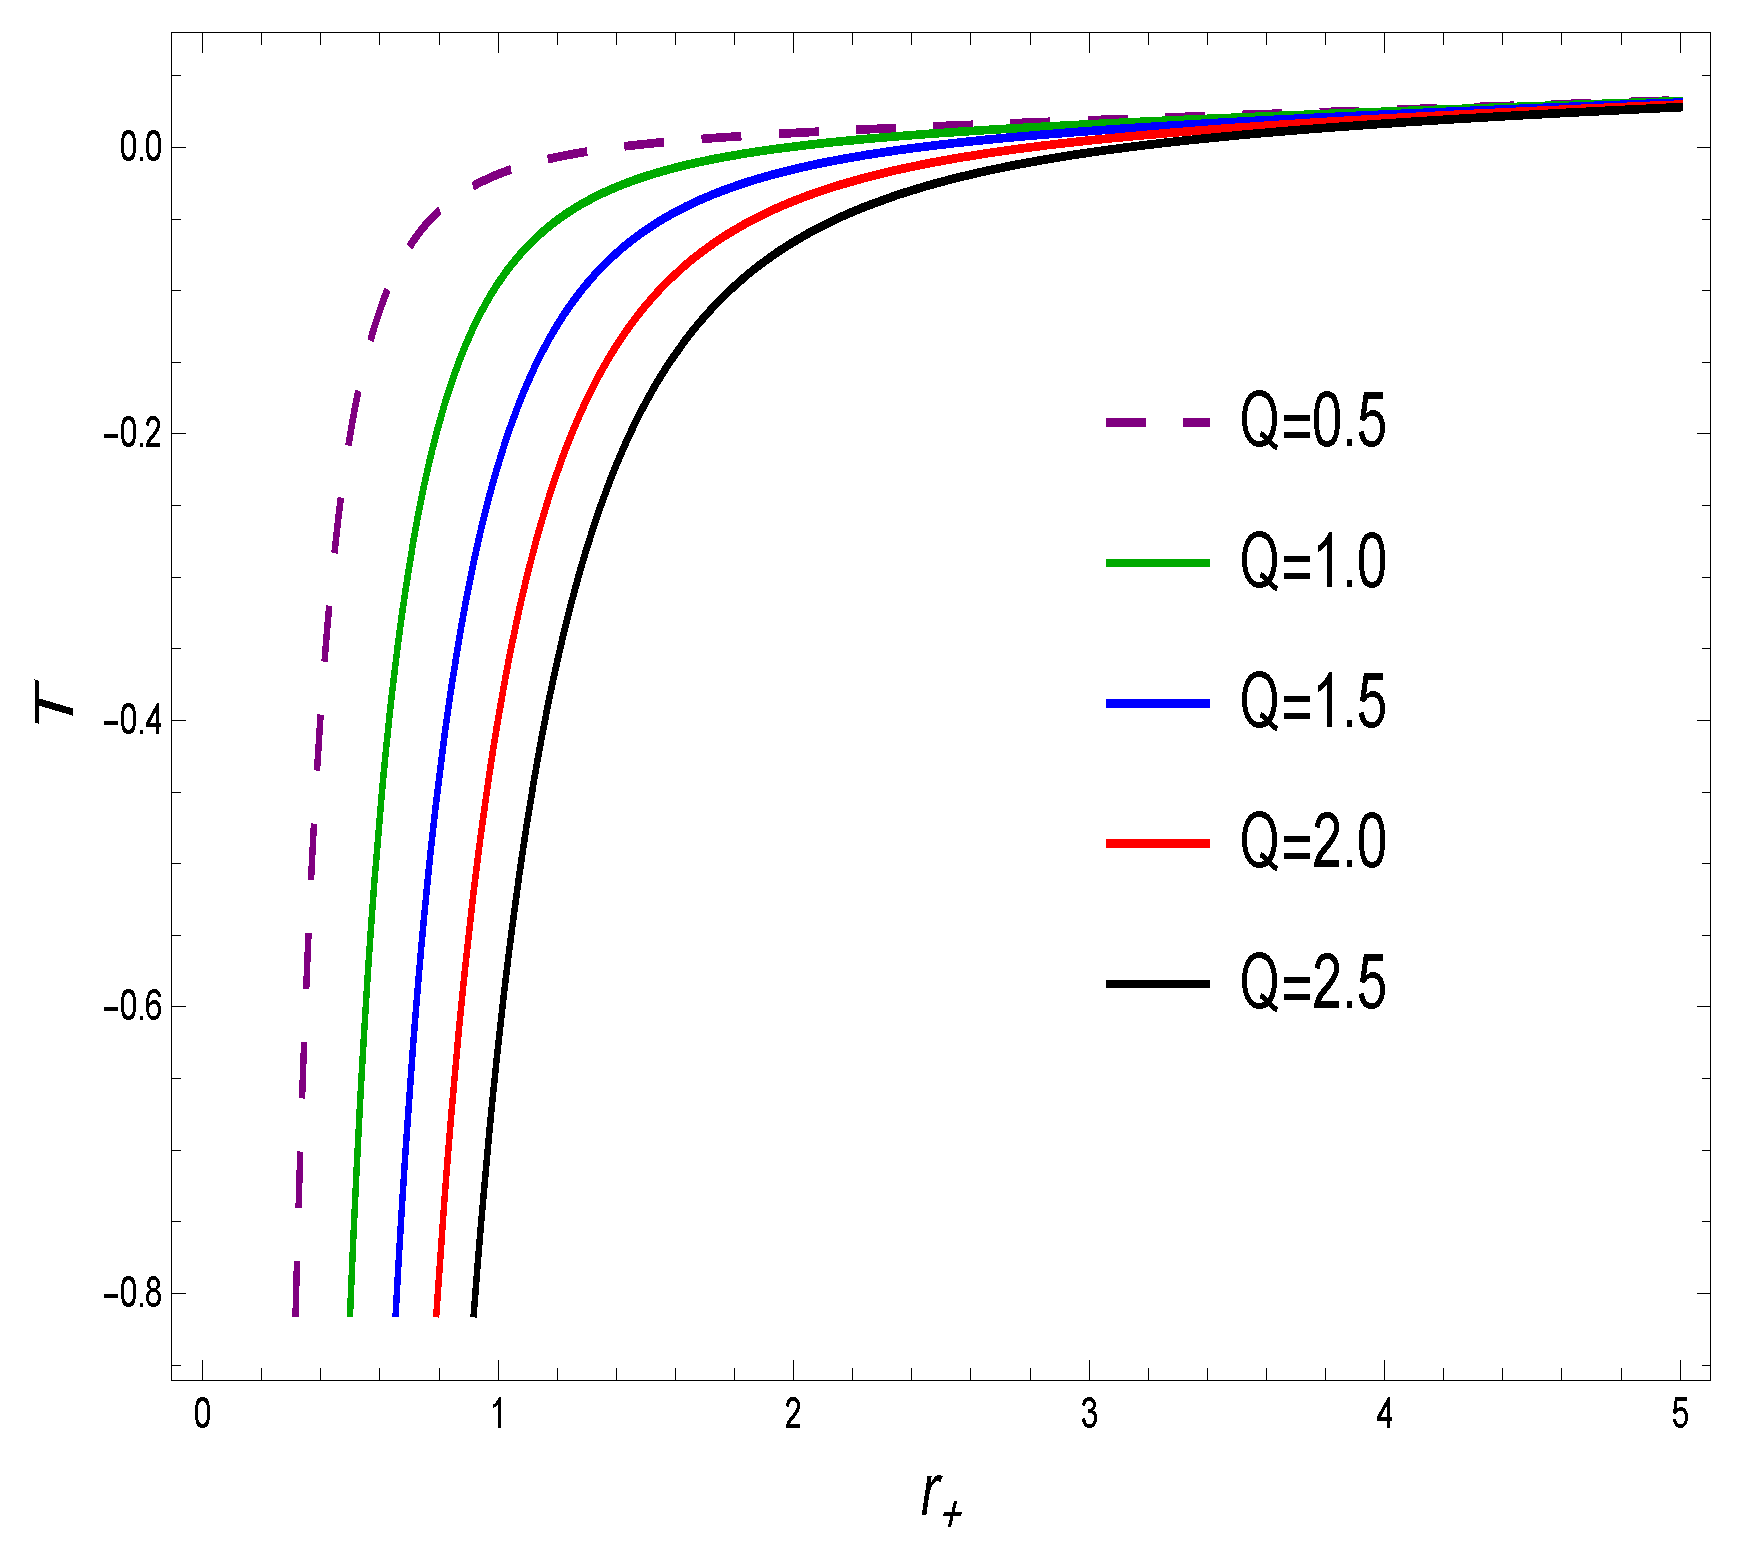
Figure 2 and
Figure 3 describe the Hawking temperature versus horizon radius with various values of electric charge along with fixed values of
l. The graphical representation of Hawking temperature exhibits stability for the given domain of the torus-like charge AdS BH. The associated BH volume is,
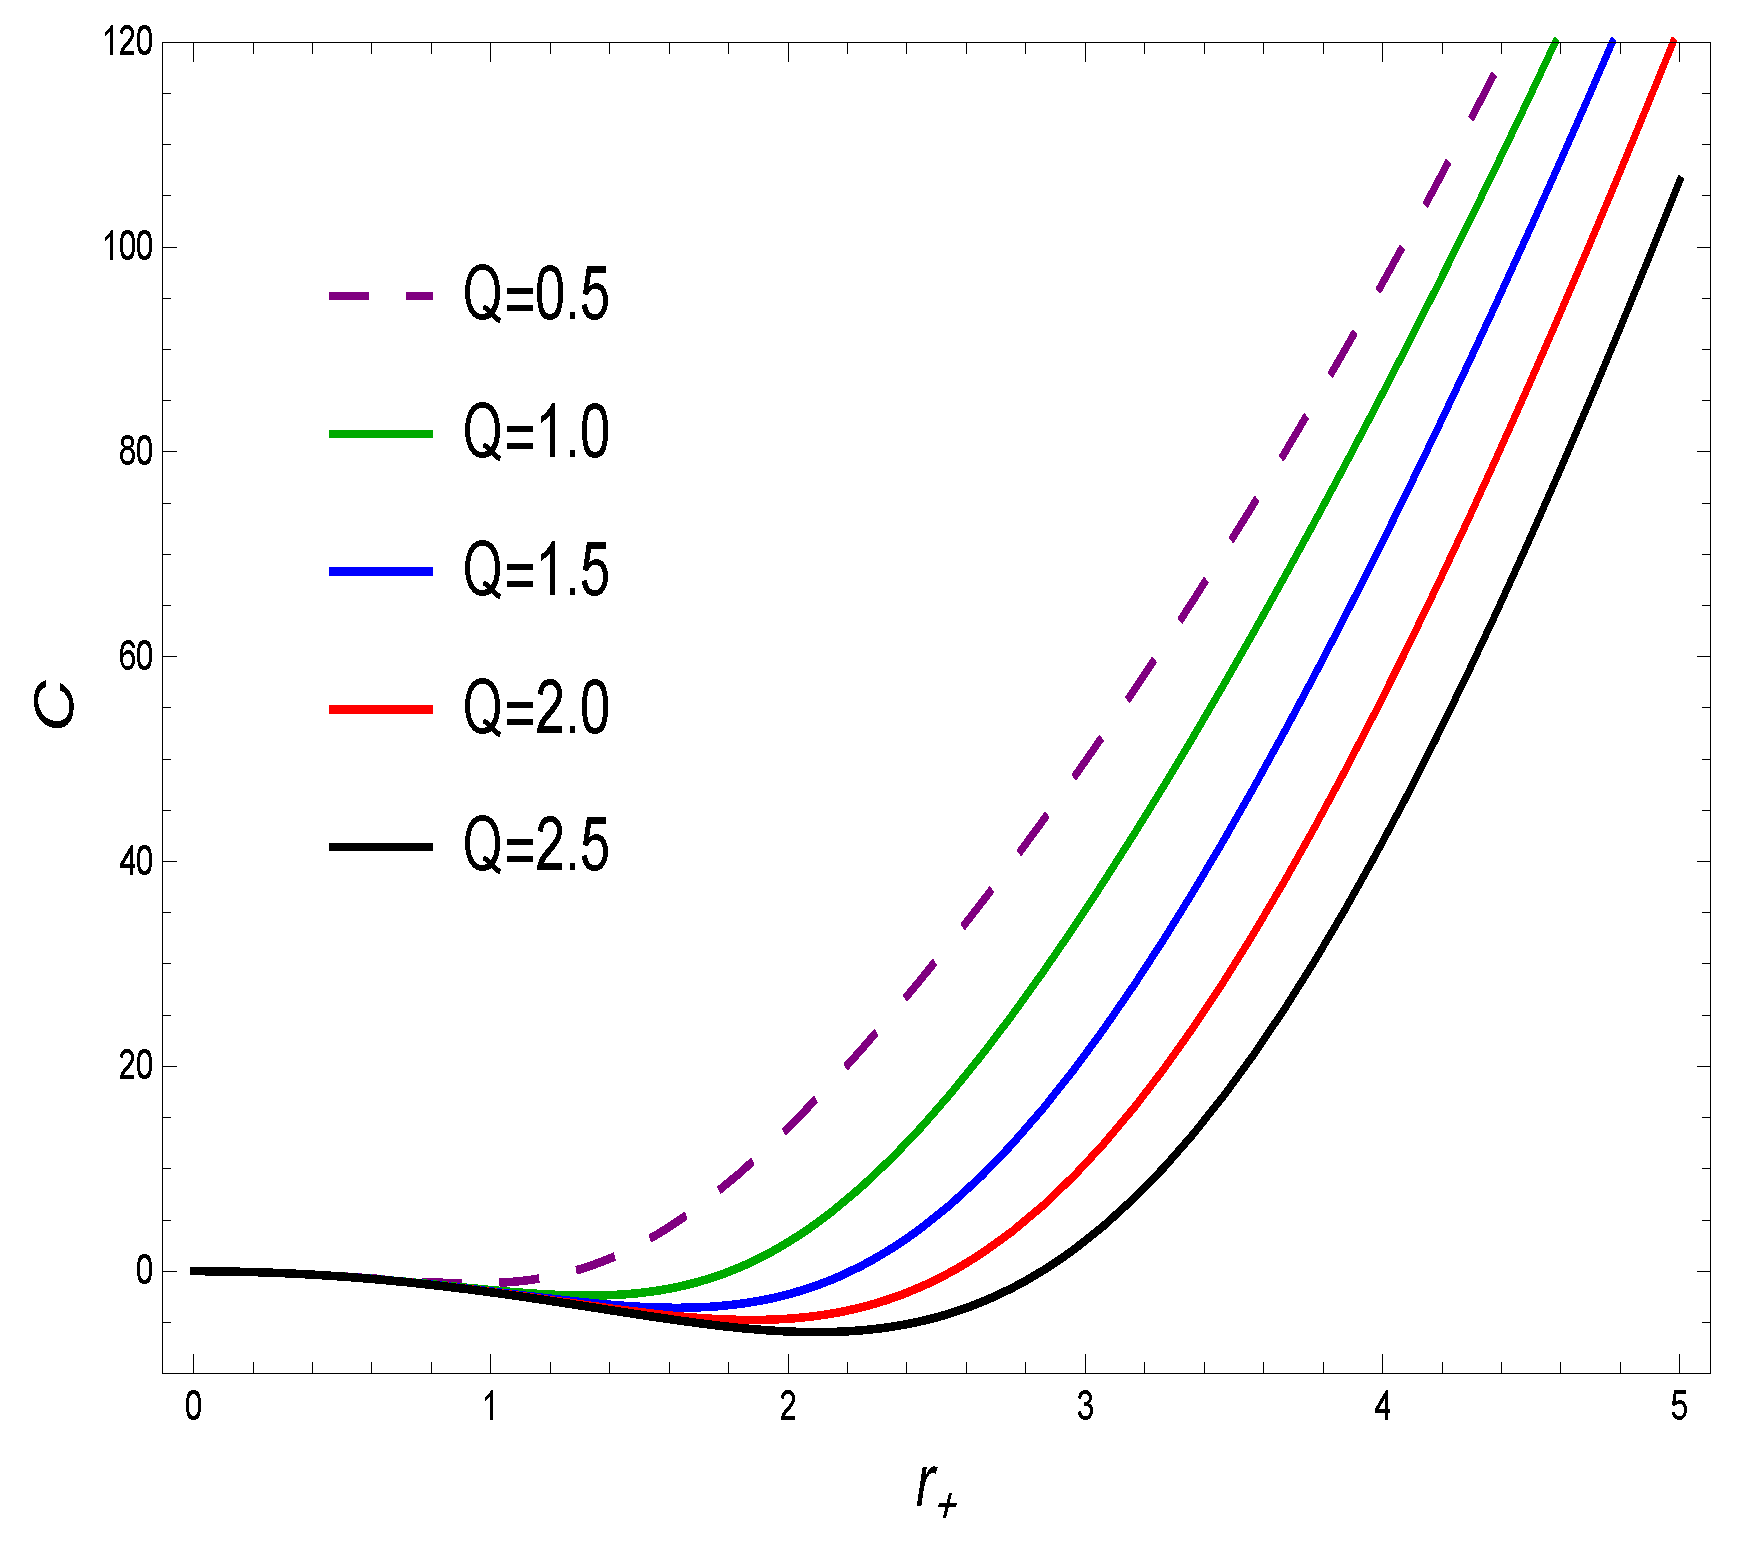
In order to find the thermal stability of the BH, a specific heat capacity (
) must be computed as follows:
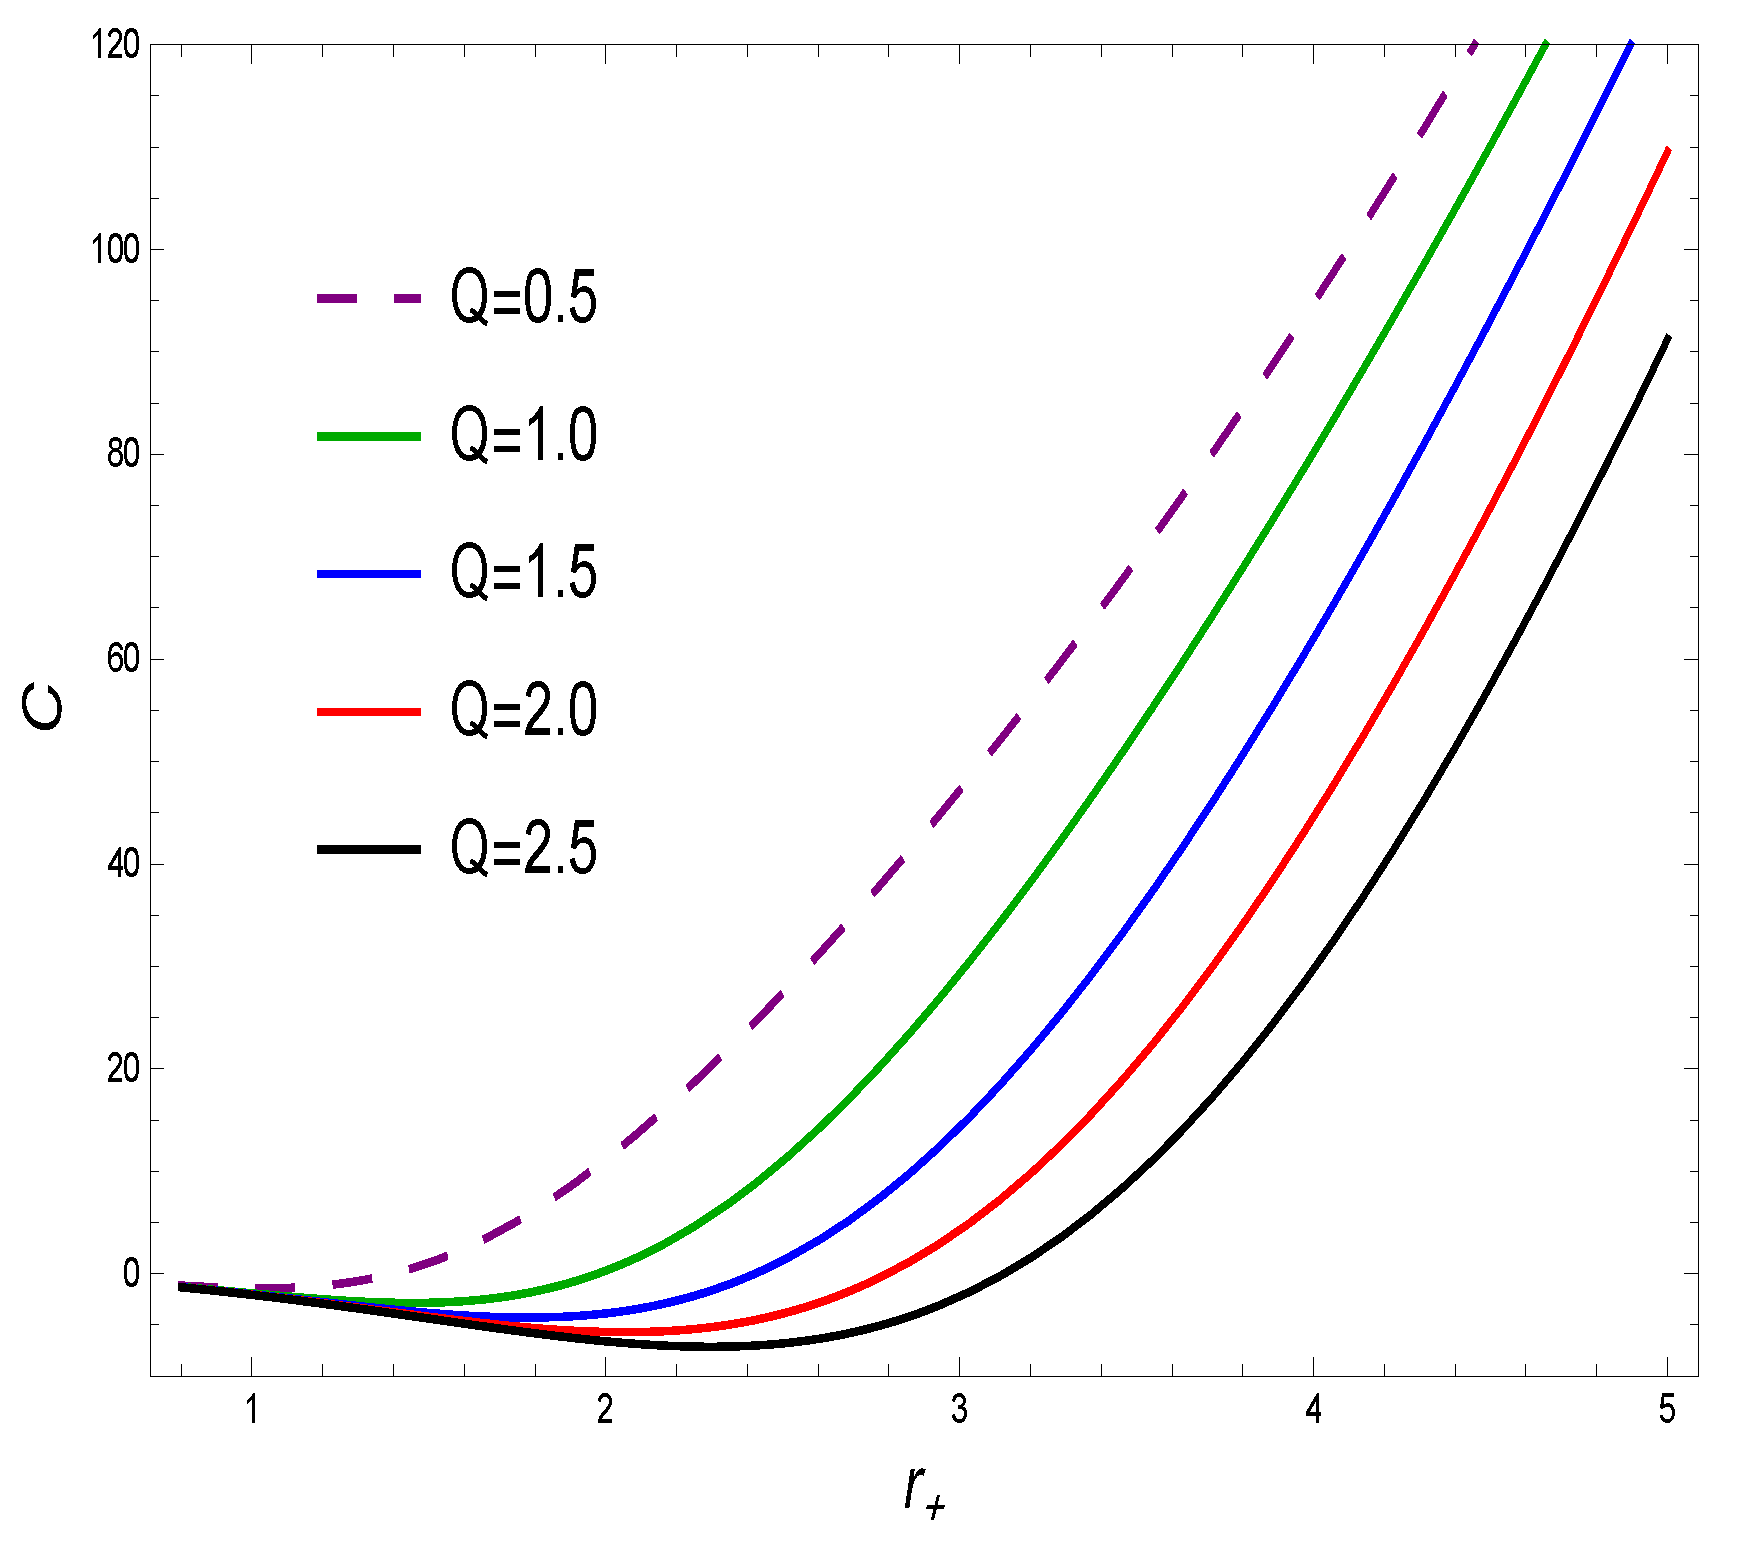
Figure 4 and
Figure 5 are the plots of heat capacity vs. horizon radius for altered values of electric charge, along with prescribed
l values. These figures depict the thermal stability throughout the system.
Using the Equatioons (
3) and (
10) in Equation (
9), the corrected entropy can be calculated as
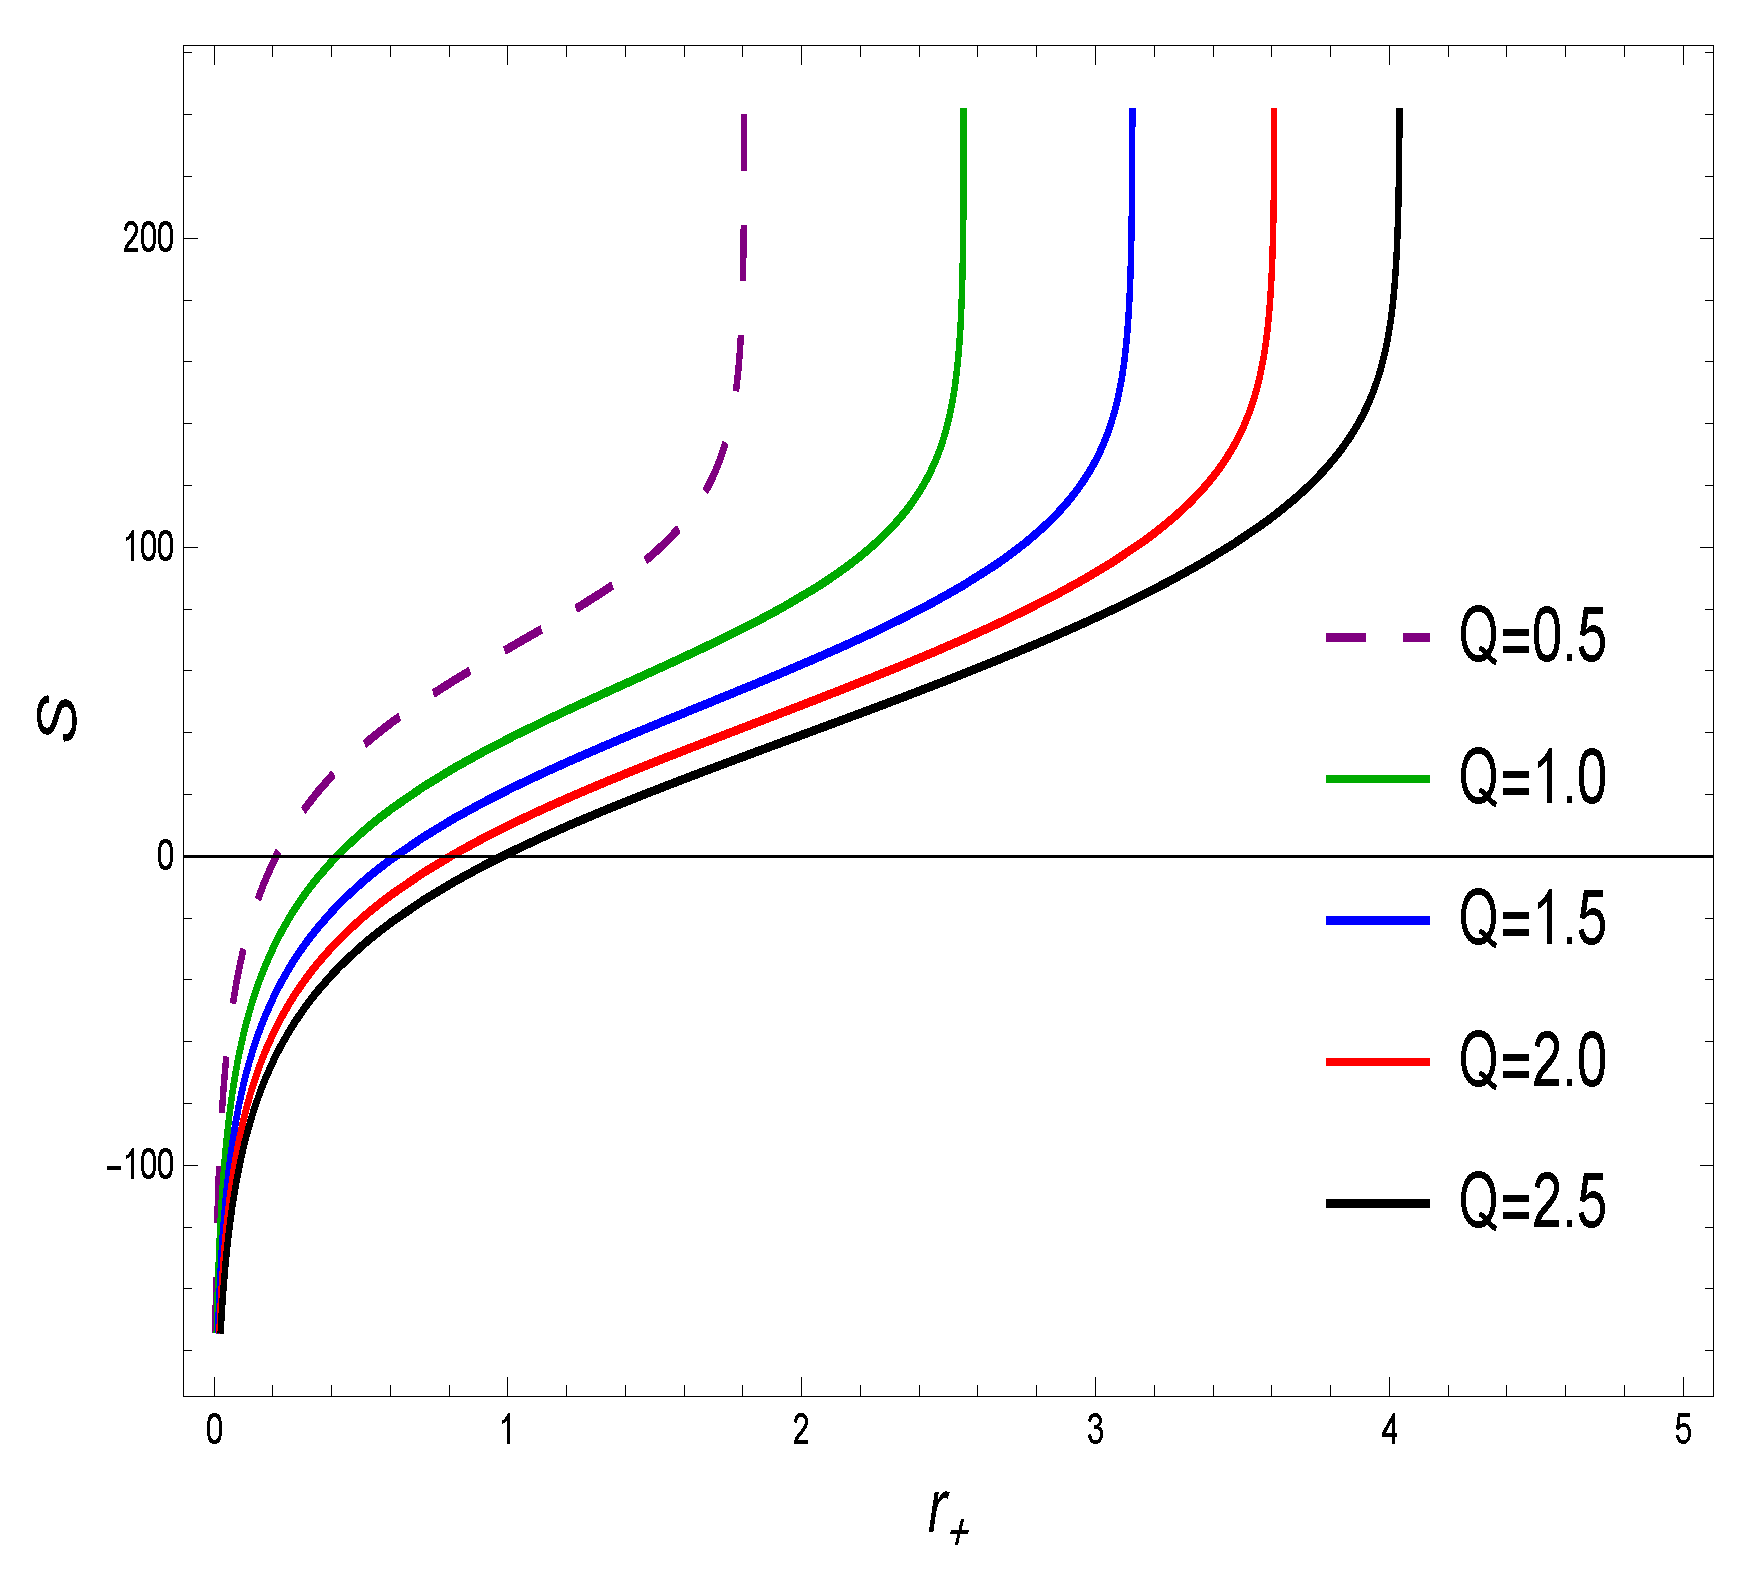
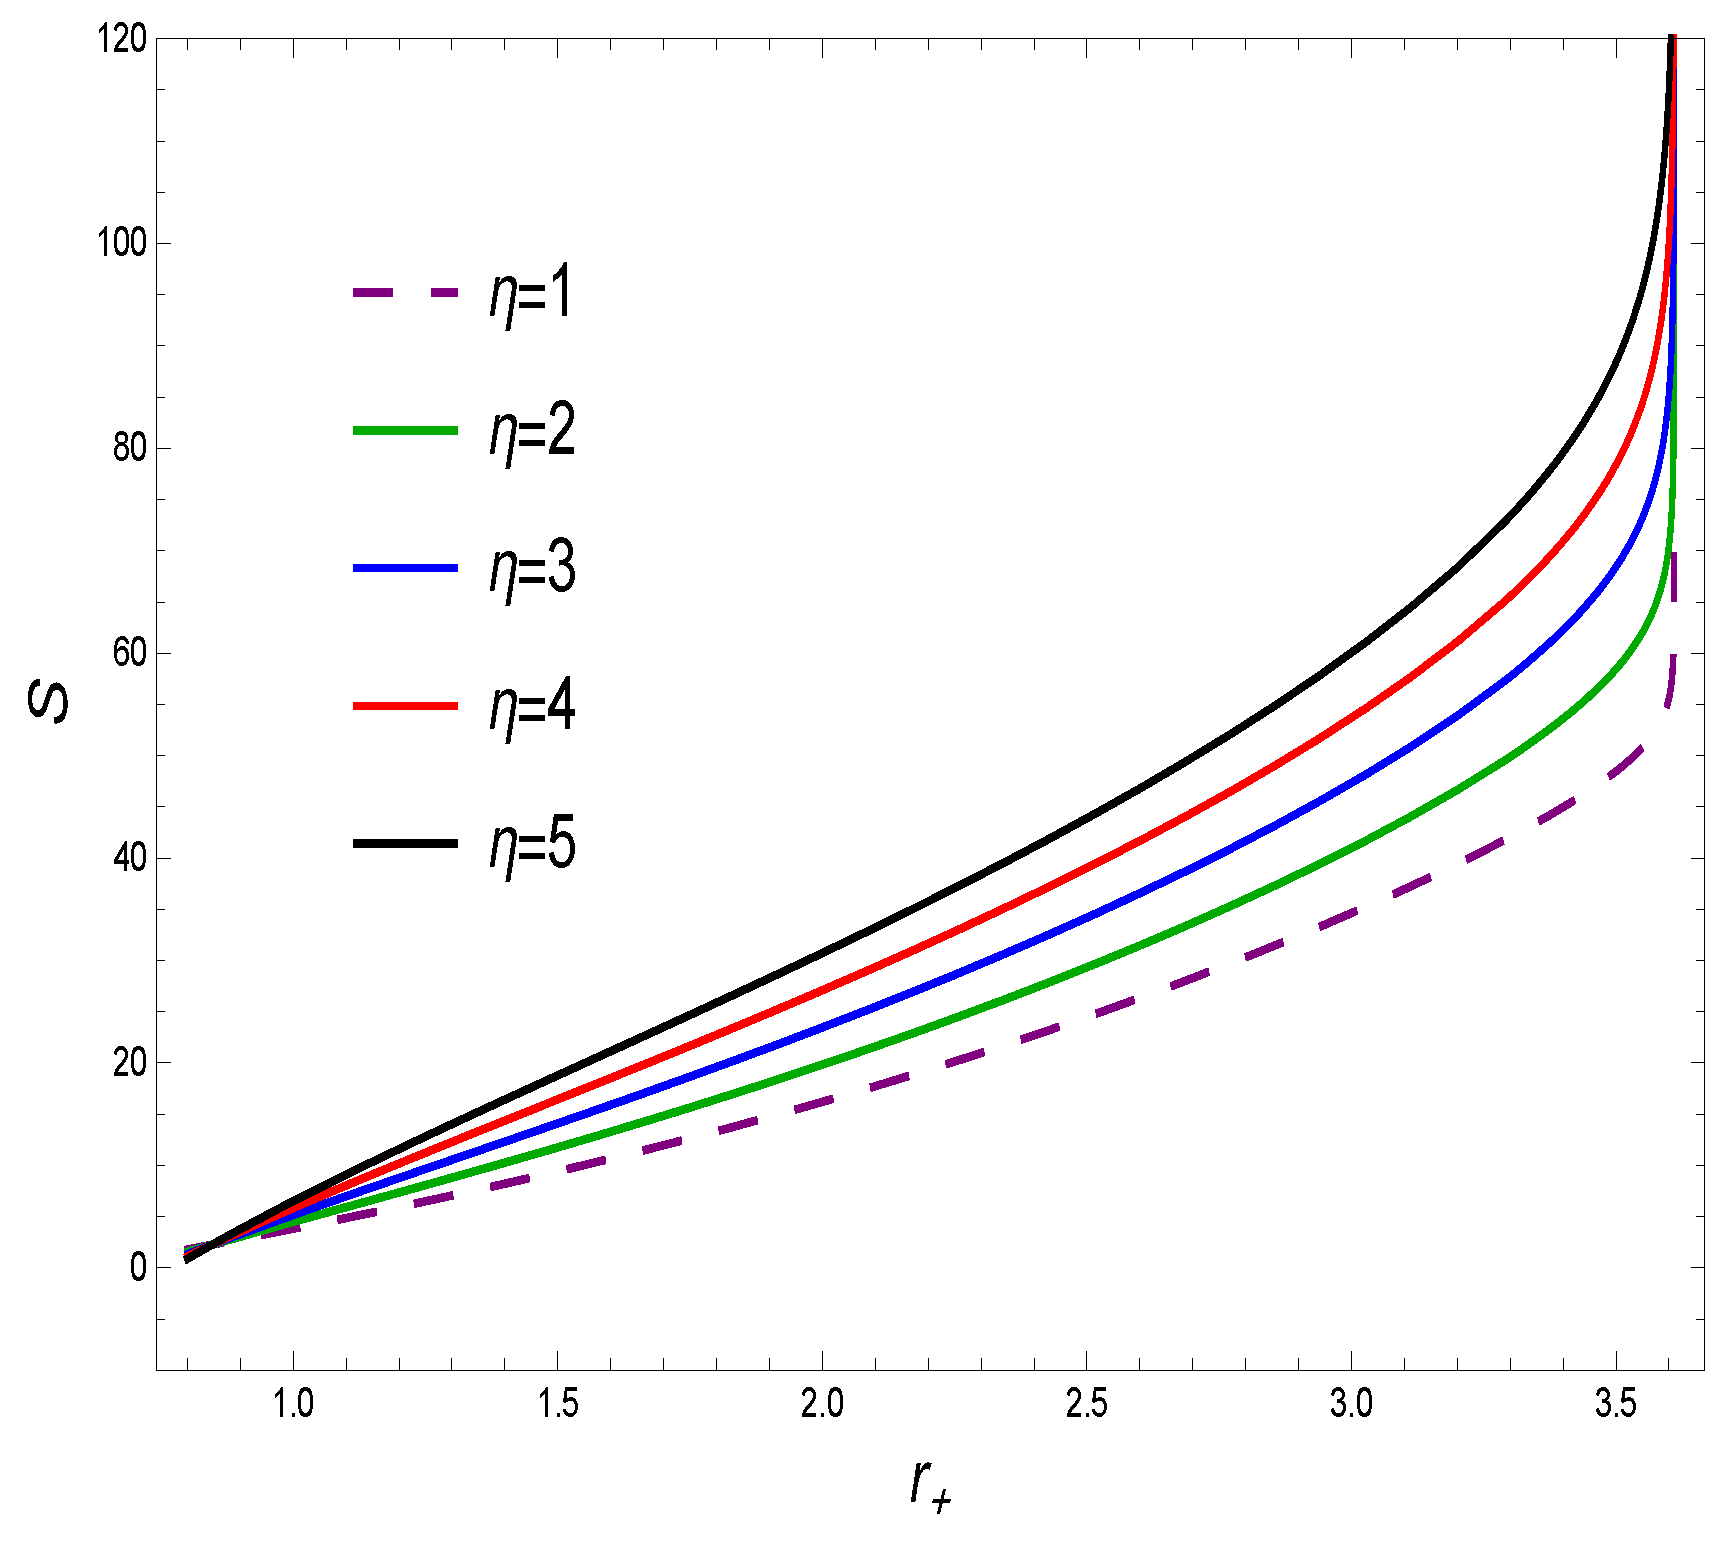
The graphical description of corrected entropy against horizon radius is proclaim in plots 6 and 7. From the
Figure 6, it can be seen that for the small radii, the system becomes stable from un-stable region with the presence of different electric charge values and fixed value of correction parameter and
Figure 7 show stability with fixed value of electric charge and varying the correction parameter for all considered domain. It is observed that corrected entropy rely on stability to maintain its increasing behavior for the large BHs and satisfies the second law of BH thermodynamics.
It is worthy to note that the total corrected mass [
60], can be calculated by the following thermodynamical quantities
It necessary to verify the modified first law of BH thermodynamics under thermal fluctuation, and this is expressed as,
where
represent the modified Hawking temperature,
stand for the electric potential and
V be the volume respectively. One possible way to calculate the revised Hawking temperature is as follows
which gives
It can be noted that the usual Hawking temperature and the modified temperature are identical. Also
It is possible to analyze Helmholtz free energy by
From the Equations (
10) and (
13) in Equation (
20), we get
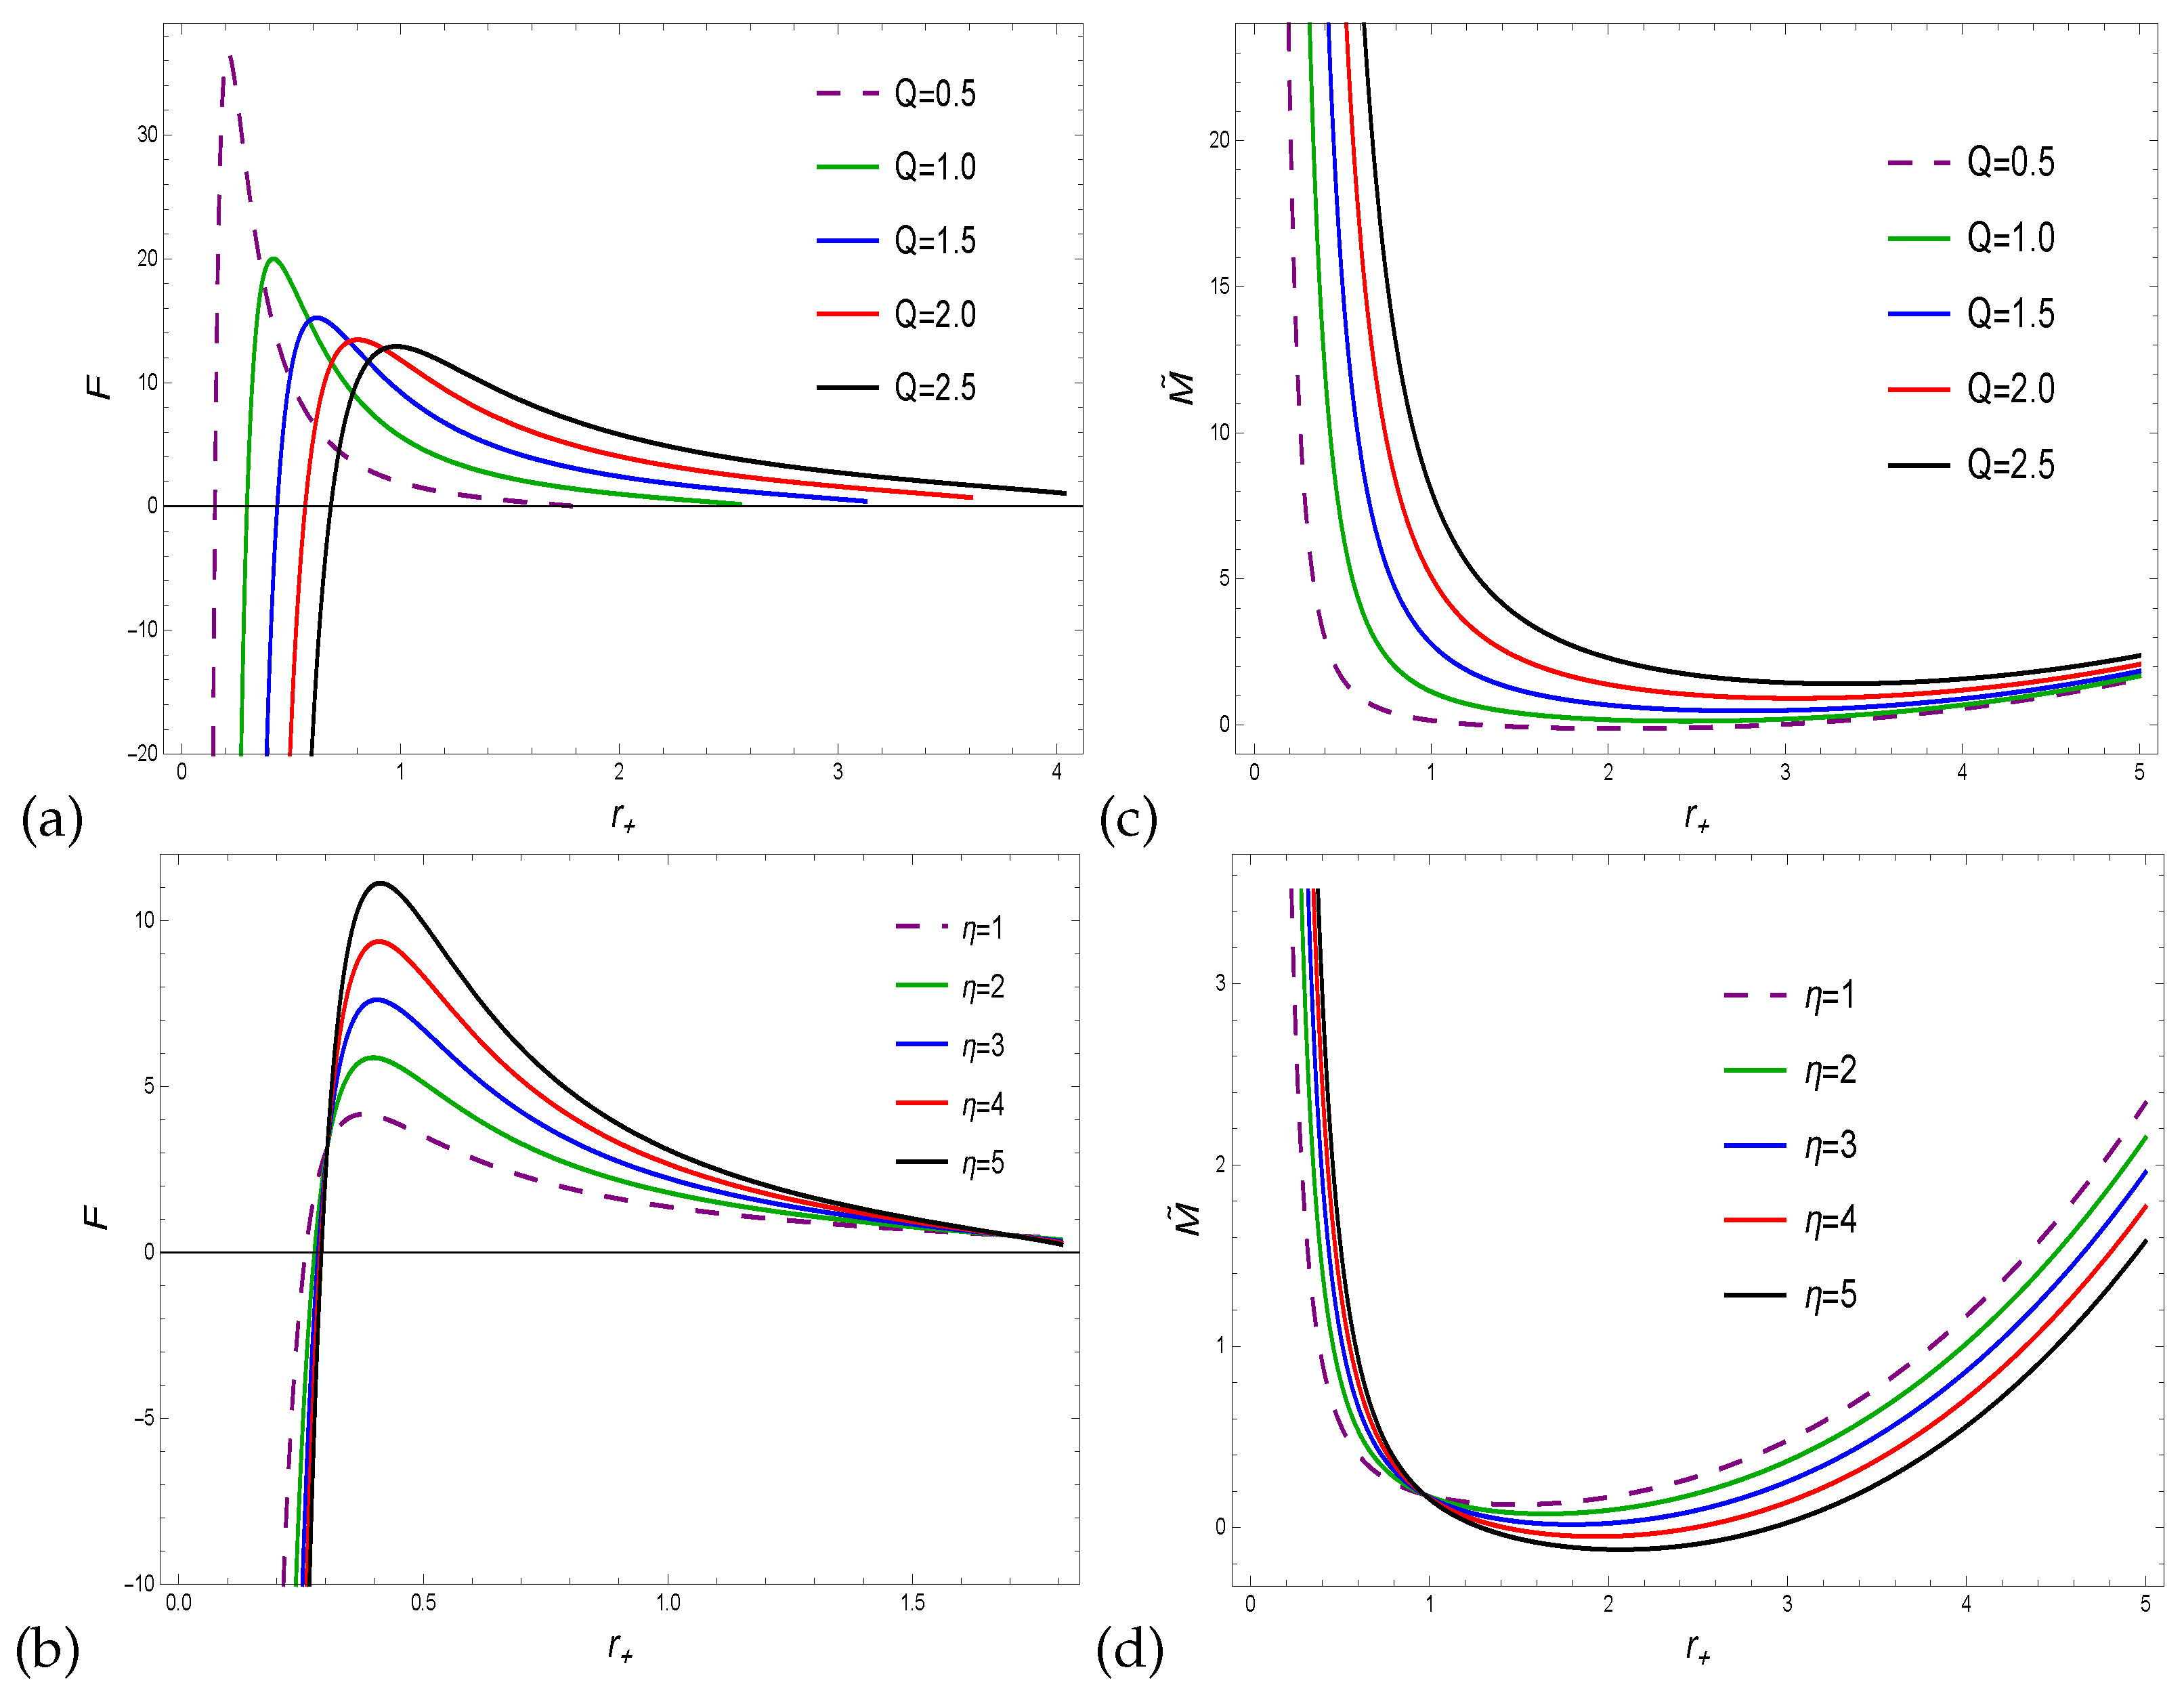
The left two plots in
Figure 8 identify the Helmholtz free energy in the presence of charge and corrected parameters and reveal about phase changes from unstable to stable and start decreasing to reach equilibrium state. The corrected thermodynamic quantity in the present case is more suitable for small radii. The Helmholtz free energy becomes maximum for small values of charge parameter
Q as can be observed in plot (a) and shows the opposite trend for correction parameter in plot (b). Similarly, the profile of the total corrected mass is depicted in
Figure 8 (right two plots). Initially, the total corrected mass starts to decrease for small radii and increase for large radii, showing consistent stability for both parameters
Q and
, respectively.
A BH with a charged toroidal shape exerts a relative pressure that is
which can be expressed as
From the Equations (
11), (
14) and (
23), we get
The graph of pressure associated with horizon radius
is depicted in
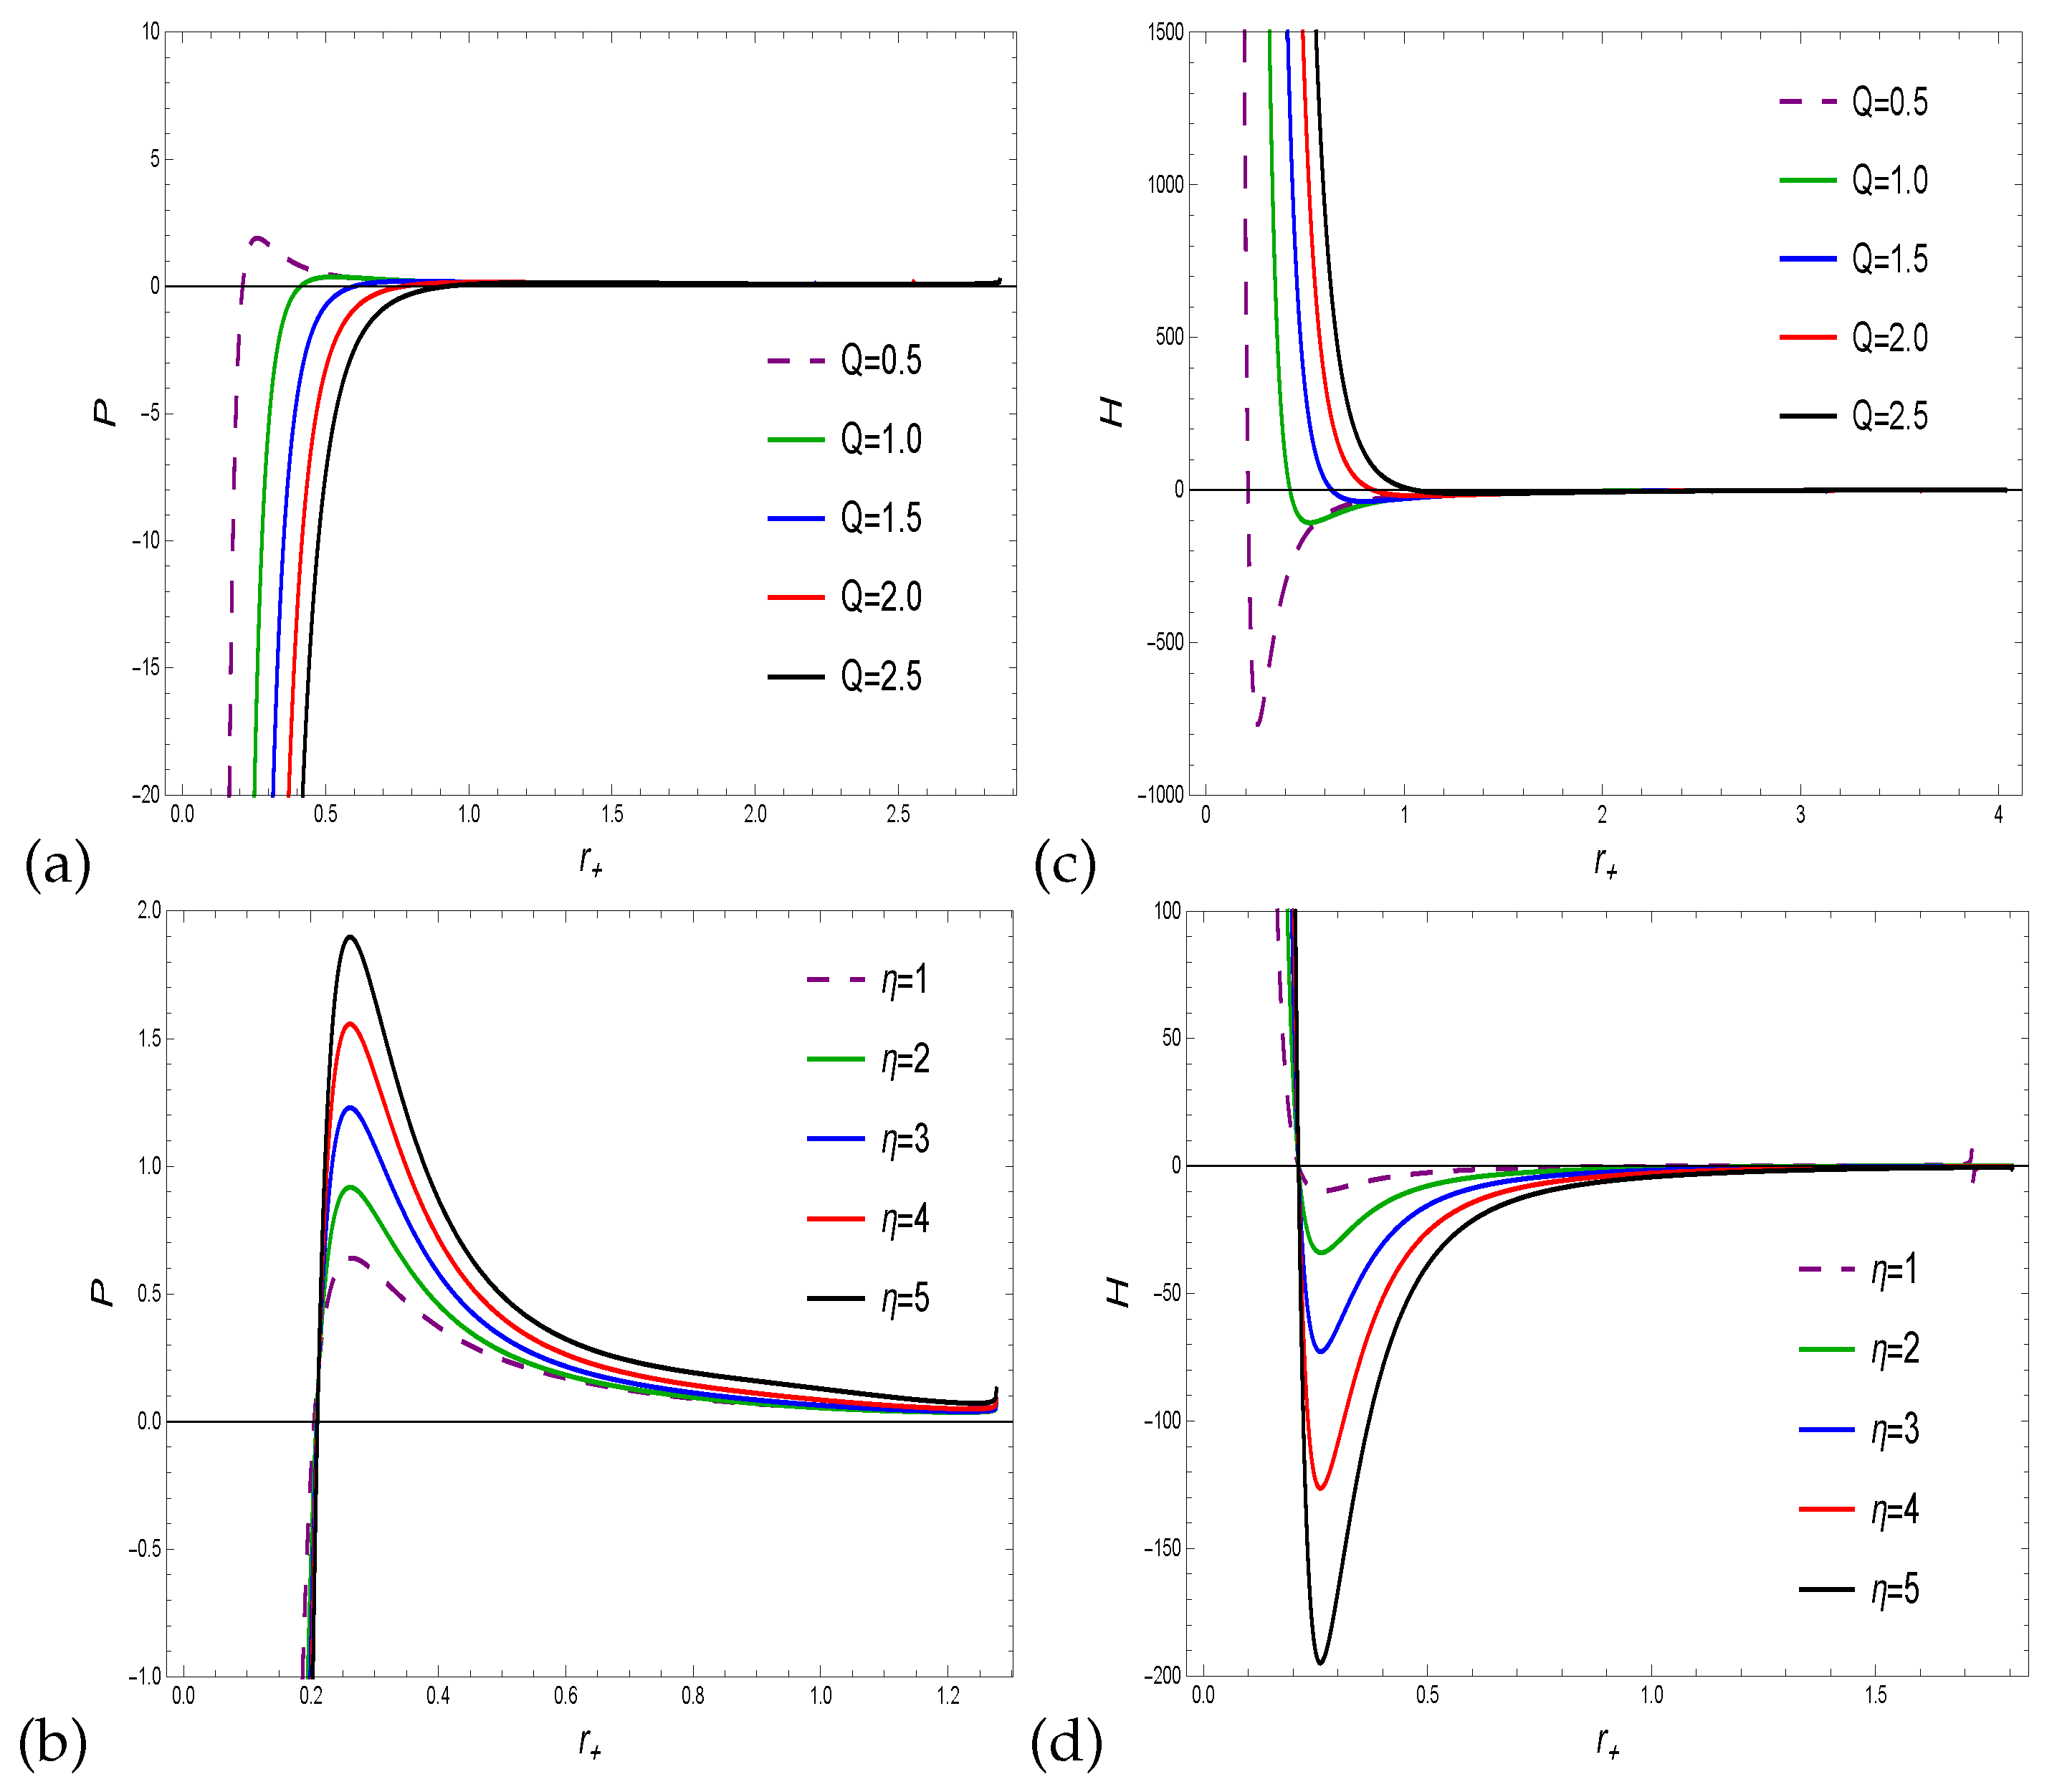
Figure 9 (left plots) and shows how the state changes from negative to equilibrium. For plot (a), the pressure turned from the negative region to the positive region at first only for small values of the charge parameter
, but it reached equilibrium with different values of charge and a fixed correction parameter. In the plot (b), the pressure stays the same for small radii. Then, as the correction parameters are changed, the pressure starts to go down until it reaches equilibrium. Enthalpy is graphically represented in
Figure 9 (right plots). The plots (c) and (d), exhibit the opposite behavior as seen in case of pressure.
Gibbs free energy
has form
Table 1.
Stability Range of Torus-like Charge AdS BH under Thermal Fluctuation.
Table 1.
Stability Range of Torus-like Charge AdS BH under Thermal Fluctuation.
| |
Q |
Range of stability |
Phase Transition |
| |
|
|
|
| |
|
|
|
|
F |
|
|
|
| |
|
|
|
| |
|
|
|
Table 2.
Stability Range of Torus-like Charge AdS BH under Thermal Fluctuation.
Table 2.
Stability Range of Torus-like Charge AdS BH under Thermal Fluctuation.
| |
|
Range of stability |
Phase Transition |
| |
|
|
|
| |
|
|
|
|
F |
|
|
|
| |
|
|
|
| |
|
|
|
Table 3.
Stability Range of Torus-like Charge AdS BH under Thermal Fluctuation.
Table 3.
Stability Range of Torus-like Charge AdS BH under Thermal Fluctuation.
| |
Q |
Range of stability |
Phase Transition |
| |
|
|
|
| |
|
|
|
|
|
|
|
|
| |
|
|
|
| |
|
|
|
Table 4.
Stability Range of Torus-like Charge AdS BH under Thermal Fluctuation.
Table 4.
Stability Range of Torus-like Charge AdS BH under Thermal Fluctuation.
| |
|
Range of stability |
Phase Transition |
| |
|
|
|
| |
|
|
|
|
|
|
|
|
| |
|
|
|
| |
|
|
|
Table 5.
Stability Range of Torus-like Charge AdS BH under Thermal Fluctuation.
Table 5.
Stability Range of Torus-like Charge AdS BH under Thermal Fluctuation.
| |
Q |
Range of stability |
Phase Transition |
| |
|
|
|
| |
|
|
|
|
|
|
|
|
| |
|
|
|
| |
|
|
|
Table 6.
Stability Range of Torus-like BH Under Thermal Fluctuation.
Table 6.
Stability Range of Torus-like BH Under Thermal Fluctuation.
| |
|
Range of stability |
Phase Transition |
| |
|
|
|
| |
|
|
|
|
|
|
|
|
| |
|
|
|
| |
|
|
|
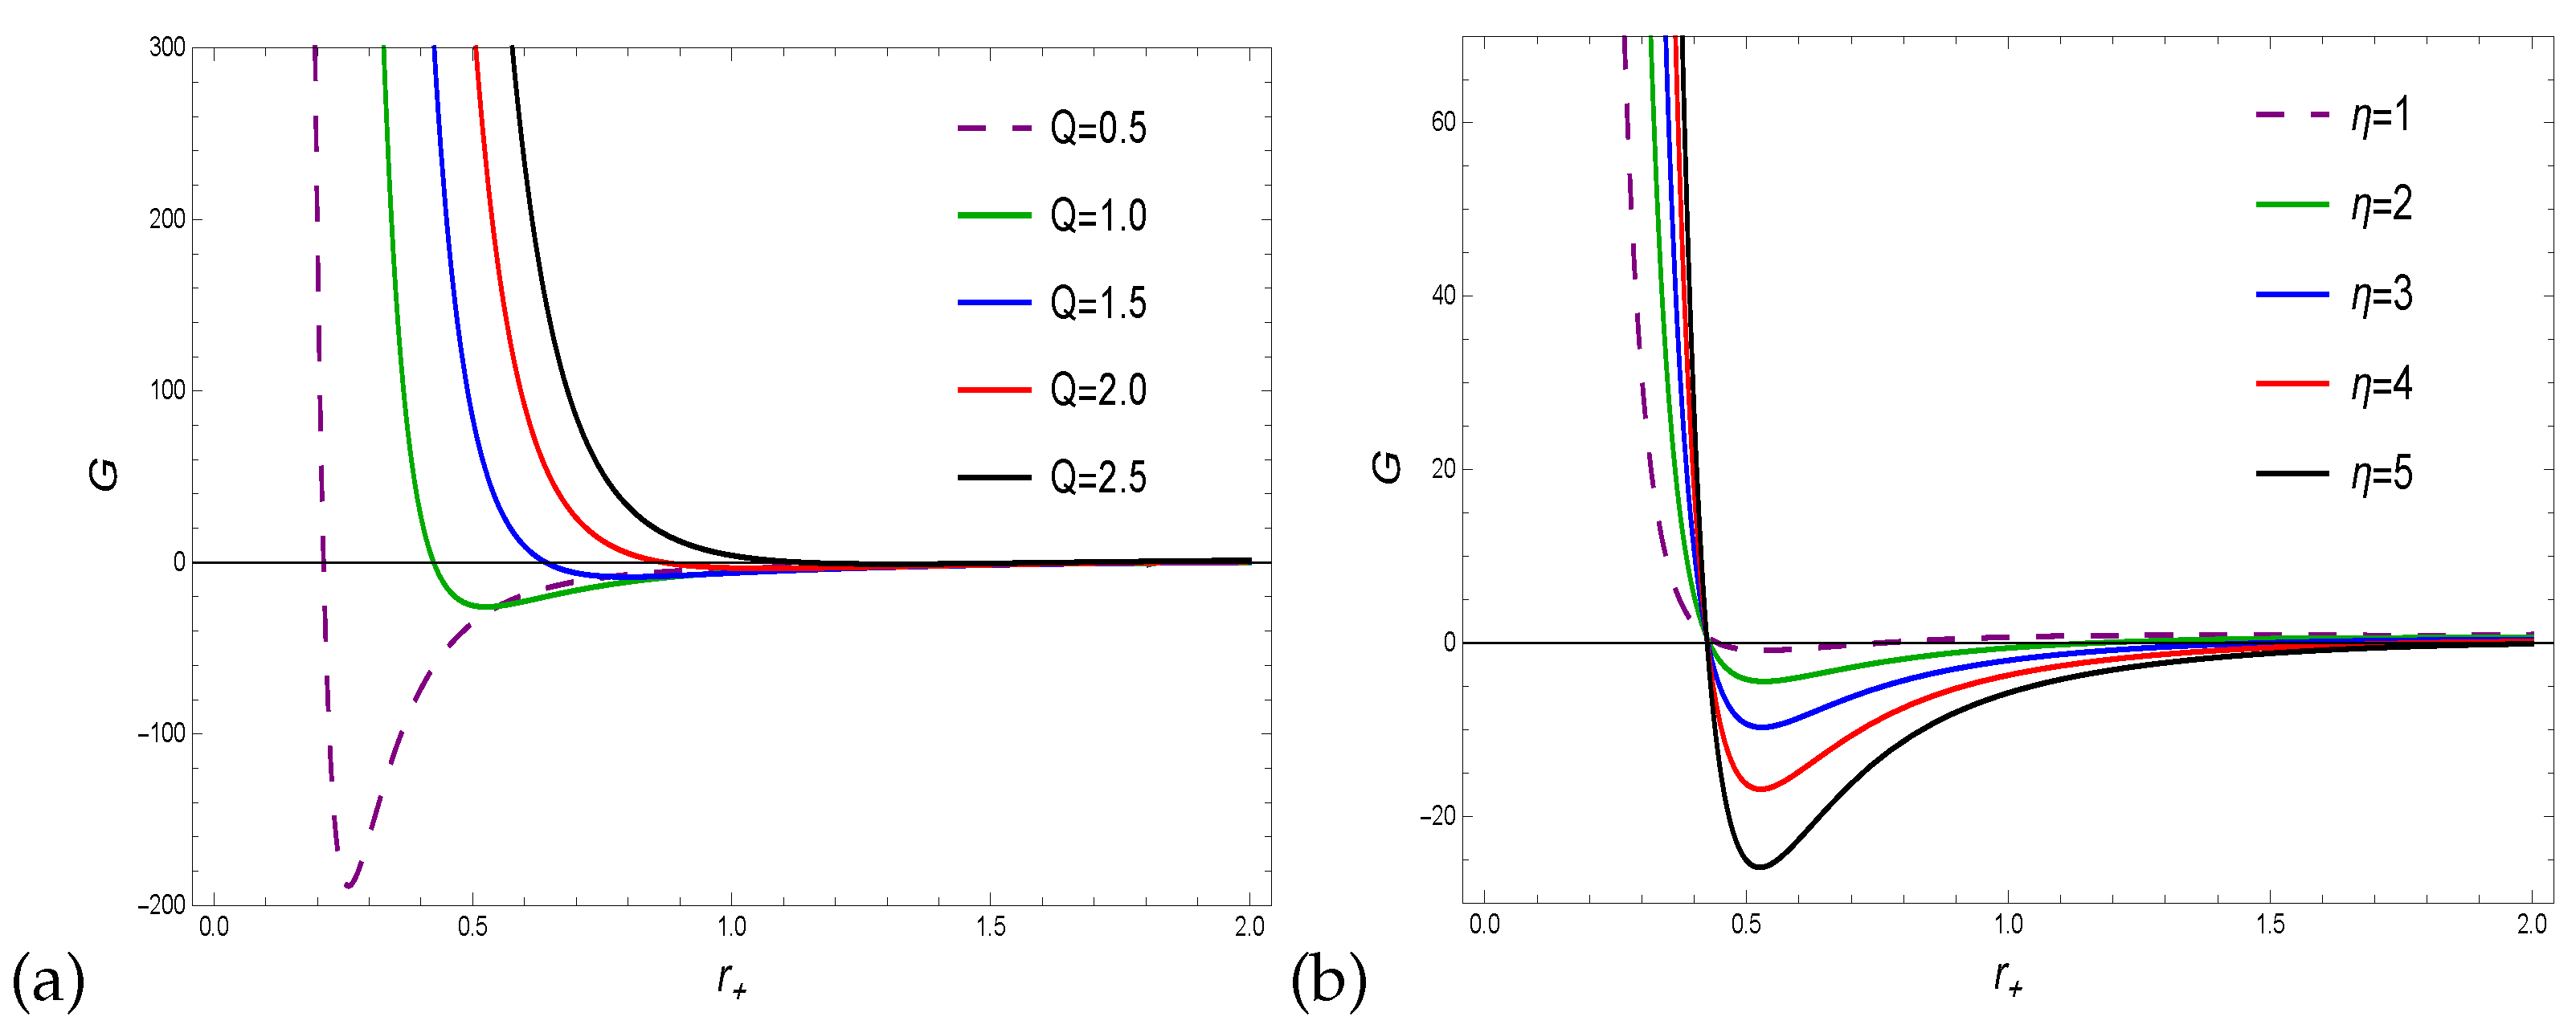
Figure 10 displays the graphical behavior of Gibbs free energy. In (a), the Gibbs free energy is decreasing from a positive region to a negative one as it converges on a point of equilibrium. Gibbs free energy goes from positive to negative and eventually converges to a state of equilibrium for small values of the charge parameter. The phase transition from a stable to an unstable and finally an equilibrium state is depicted in plot (b), which is the result of varying the values of the correction parameters in the system. In BH thermodynamics, the thermal heat capacity of a BH is the amount of heat it takes to change its temperature. The specific heat capacity of a system can be determined by adding heat at a constant pressure, or by adding heat to a system at a constant volume. Specific heat at constant volume (
), which is given by
Specific heat at constant pressure (
) is given by
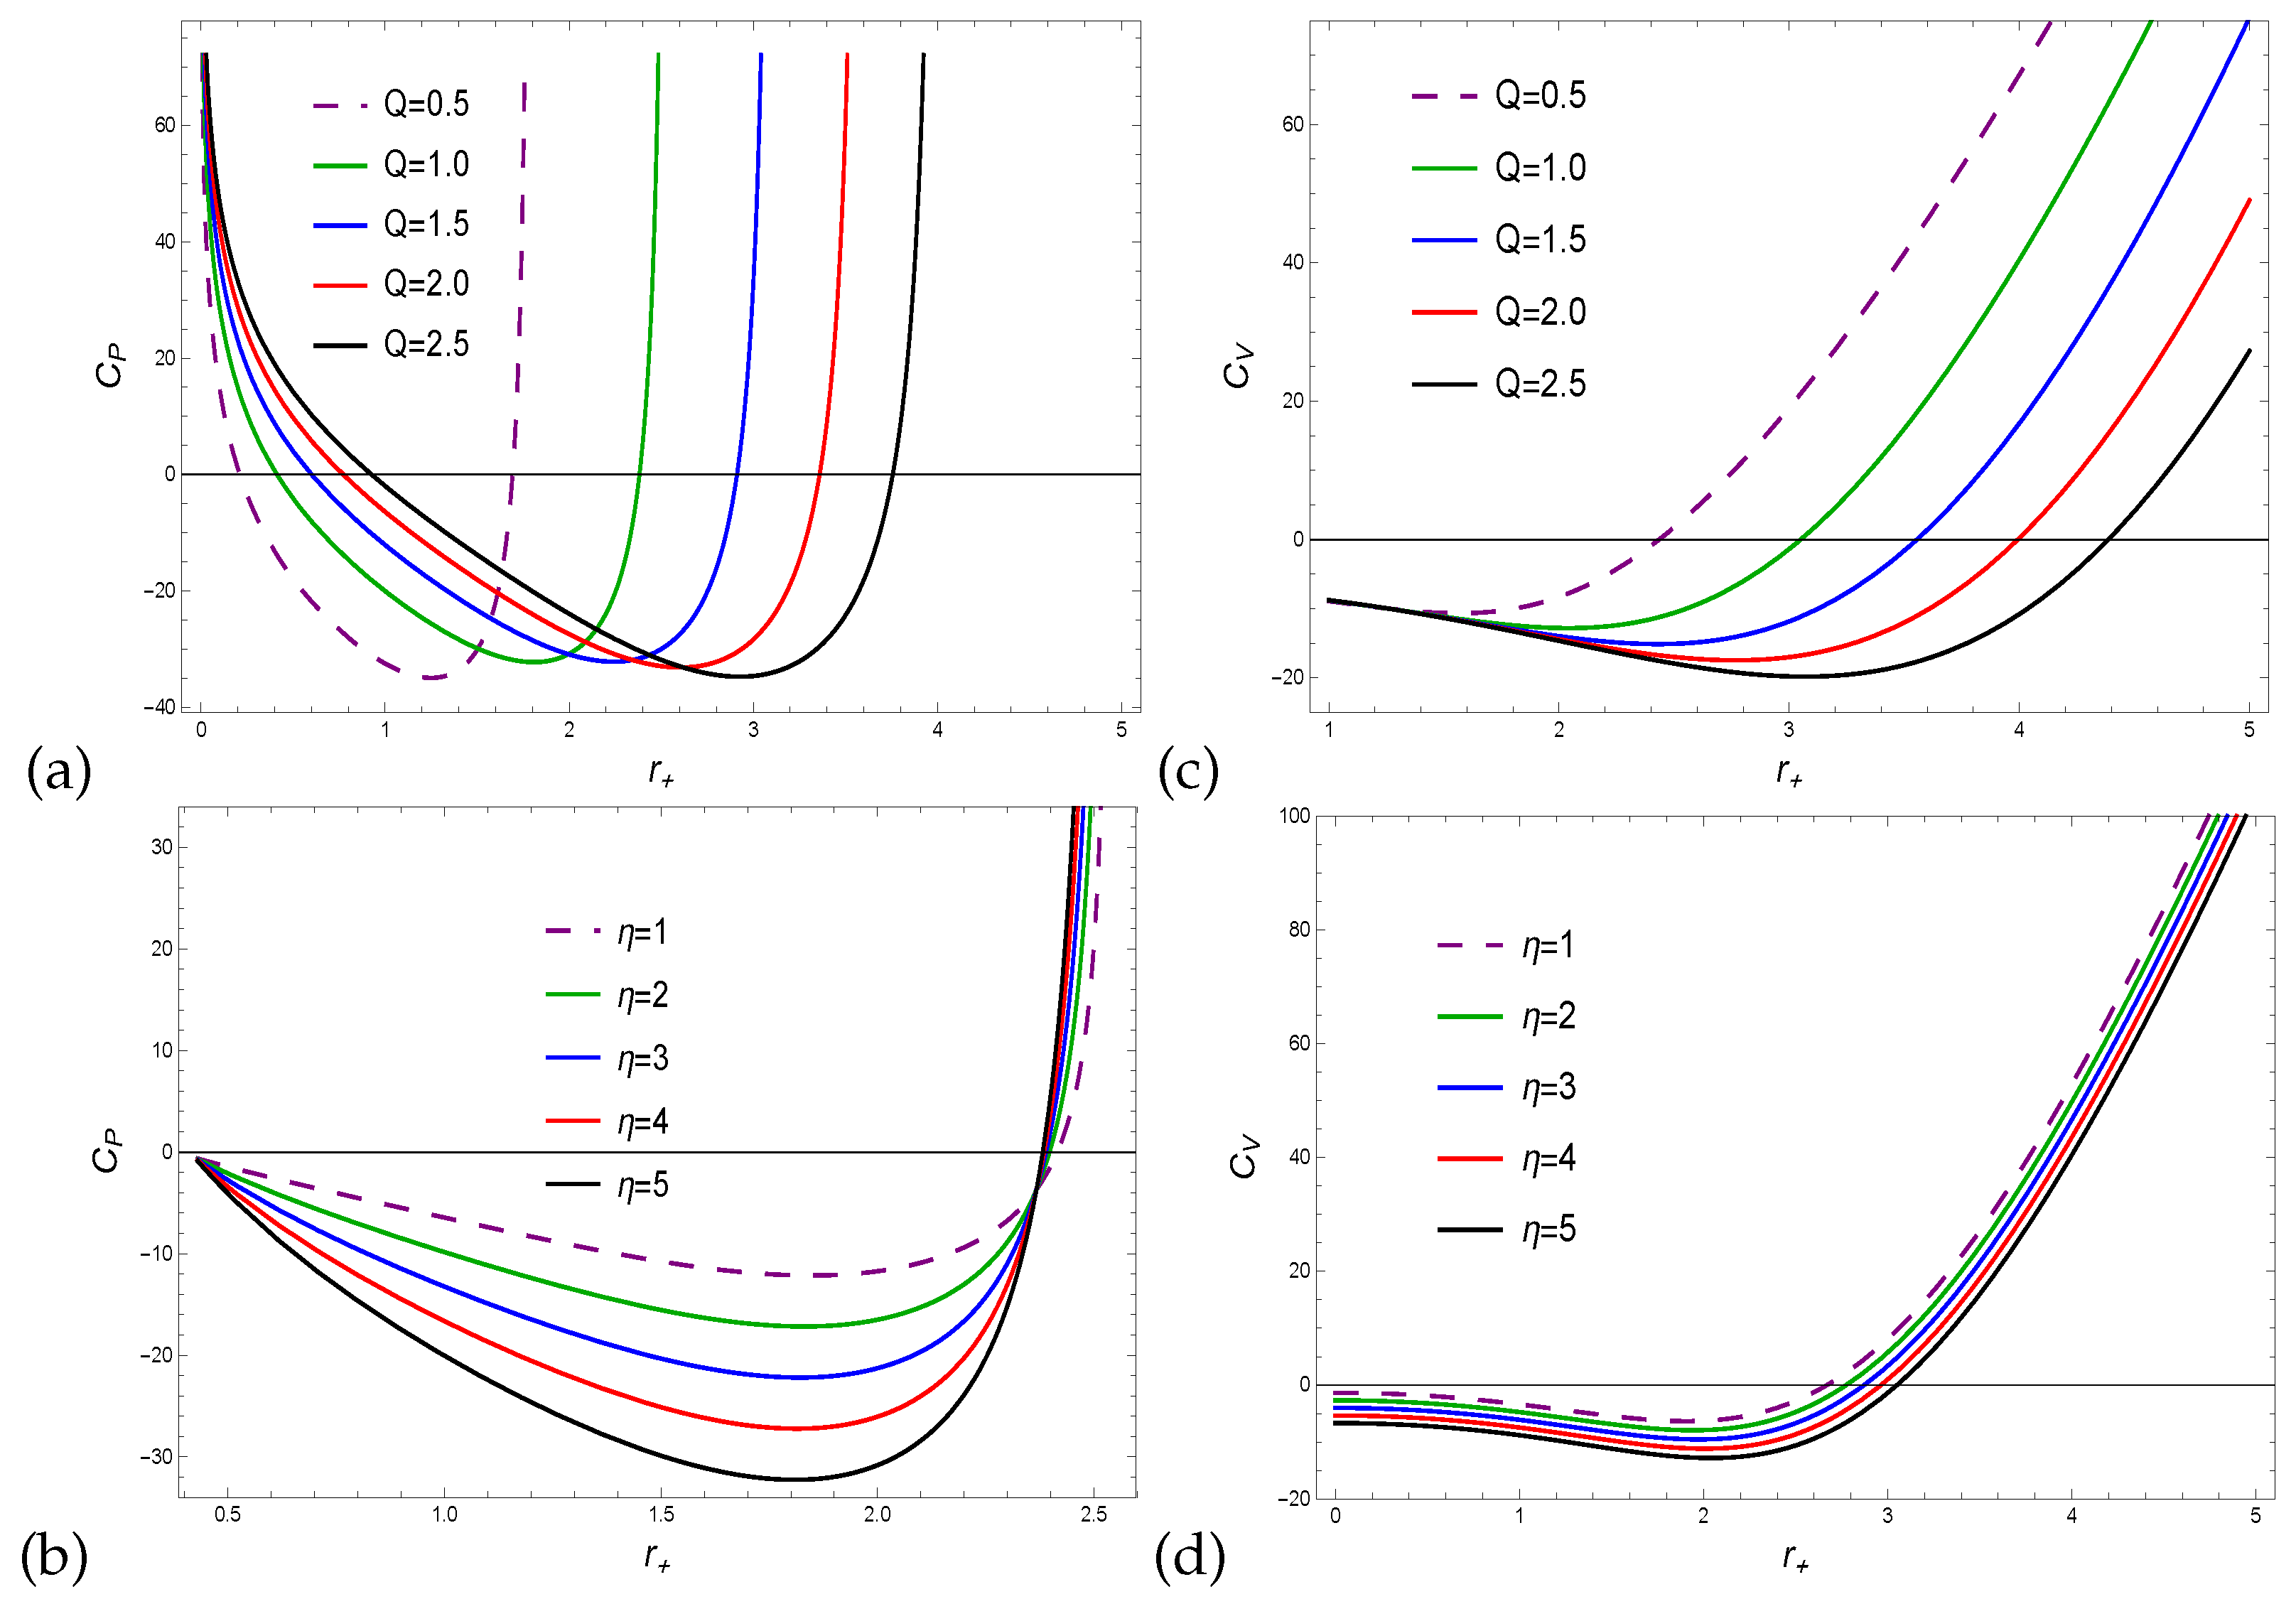
The heat capacity behavior as a function of horizon radius for the torus-like charged AdS BH is demonstrated in
Figure 11. The two figures in the left plot reveal that for large radii,
is more stable. Plot (a) shows the evolution of heat capacity from a stable zone to an unstable region, where a phase change occurs and finally go back to a stable region over a wide range of radii. The phase space of plot (b) moves from the negative to the positive region. The specific heat under constant pressure is an indication of the system stability. The relationship between
and
is shown graphically (in two plots) to the right. Note that the specific heat at constant volume goes from negative to positive region, making it thermodynamically stable. Now, we examine the ratio
of the above heat capabilities, which may be written as
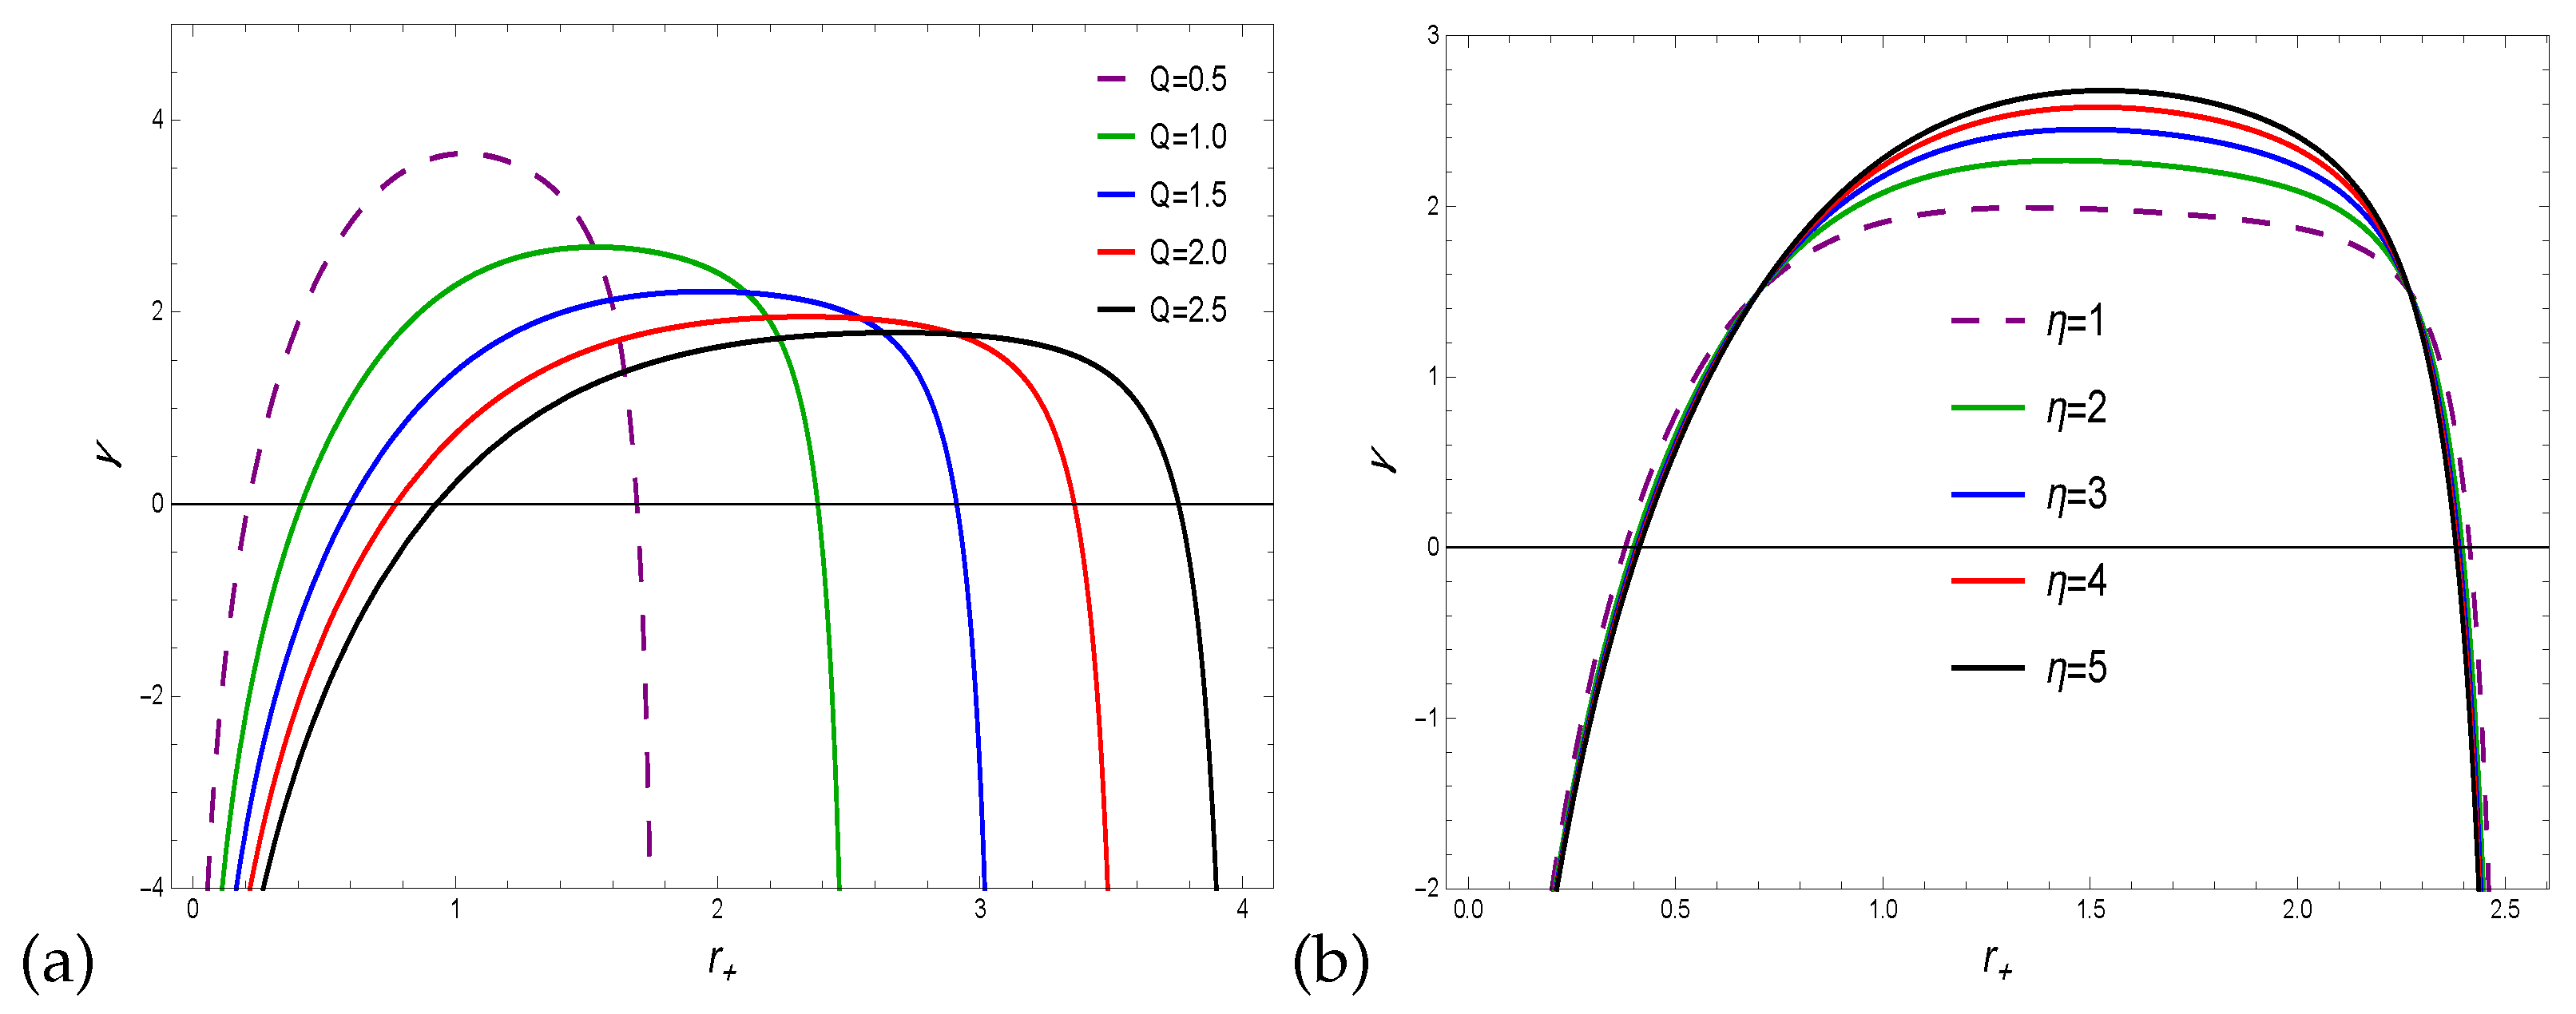
Figure 12 shows how the ratio of heat capacities changes as the horizon radius of the torus-like charge AdS BH changes. The profile of the ratio
shows that it goes from negative region to positive region and then goes back to a negative region. A second-order phase transition occurs in this region and the
becomes unstable. It should be noted that BH is locally stable for small radii, which means that for large BH radii, it is thermodynamically unstable. Hessian matrix (H) can also be employed to test the stability of the system, which involve the second order derivatives of the Helmohtz free energy related to the temperature and chemical potential (
). The Hessian matrix can be written as
where,
,
,
. It is constructive to acknowledge that the stability of the system, such that the trace of the Hessian matrix
should be positive. Where
Therefore, we may express the trace of the Hessian matrix as
Concerning the Hessian matrix, it is now clear that for BHs, the Hessian matrix is still unstable, as it can be seen from
Figure 13. The trace of the Hessian matrix acts as if it was an exothermic reaction, which gives off heat into the surroundings.
3. Null geodesic and quasi-normal modes
In this section, we discuss the null geodesics and radius of photon sphere for the torus-like charge AdS BH. The fundamental properties of BH space-time are characterized by the motion of geodesics. The geodesics reveal an extremely complex structure in the background space-time and provide important data about the BH space-time. The radius of the photon sphere is used to explain the angular velocity and Lyapunov exponent. The motion is being confined to the equatorial plane
. For a photon, the Lagrangian becomes [
61],
where
show angular coordinate. The corresponding components of generalized momentum
are defined by
where the conservation constants
e and
l describe the photon energy and angular momentum. From Equations (
35) and (
37), we get
,
.
Each null geodesic is associated with a corresponding Hamiltonian equation, which may be written as follows:
which leads to
with
In spherically symmetric static space-time, photon spheres can move in circles that are not stable if the three conditions below are met,
Using Equation (
40), we can calculate the photon sphere radius using Equation (
41), and can verify that the photon sphere is stable. By combining the solutions of Equation (
40) and Equation (
41), we get the desired result.
Using the respective metric function in Equation (
2), Equation (
41) takes the form
According to the eikonal limit
, the QNMs can be expressed with the help of photon sphere [
62] as follows
Finally, the two notable quantities of photons sphere are angular velocity and Lyapunov exponent. The QNMs are linked with angular velocity
and Lyapunov exponent
are given by
which produce
furthermore,
yields,
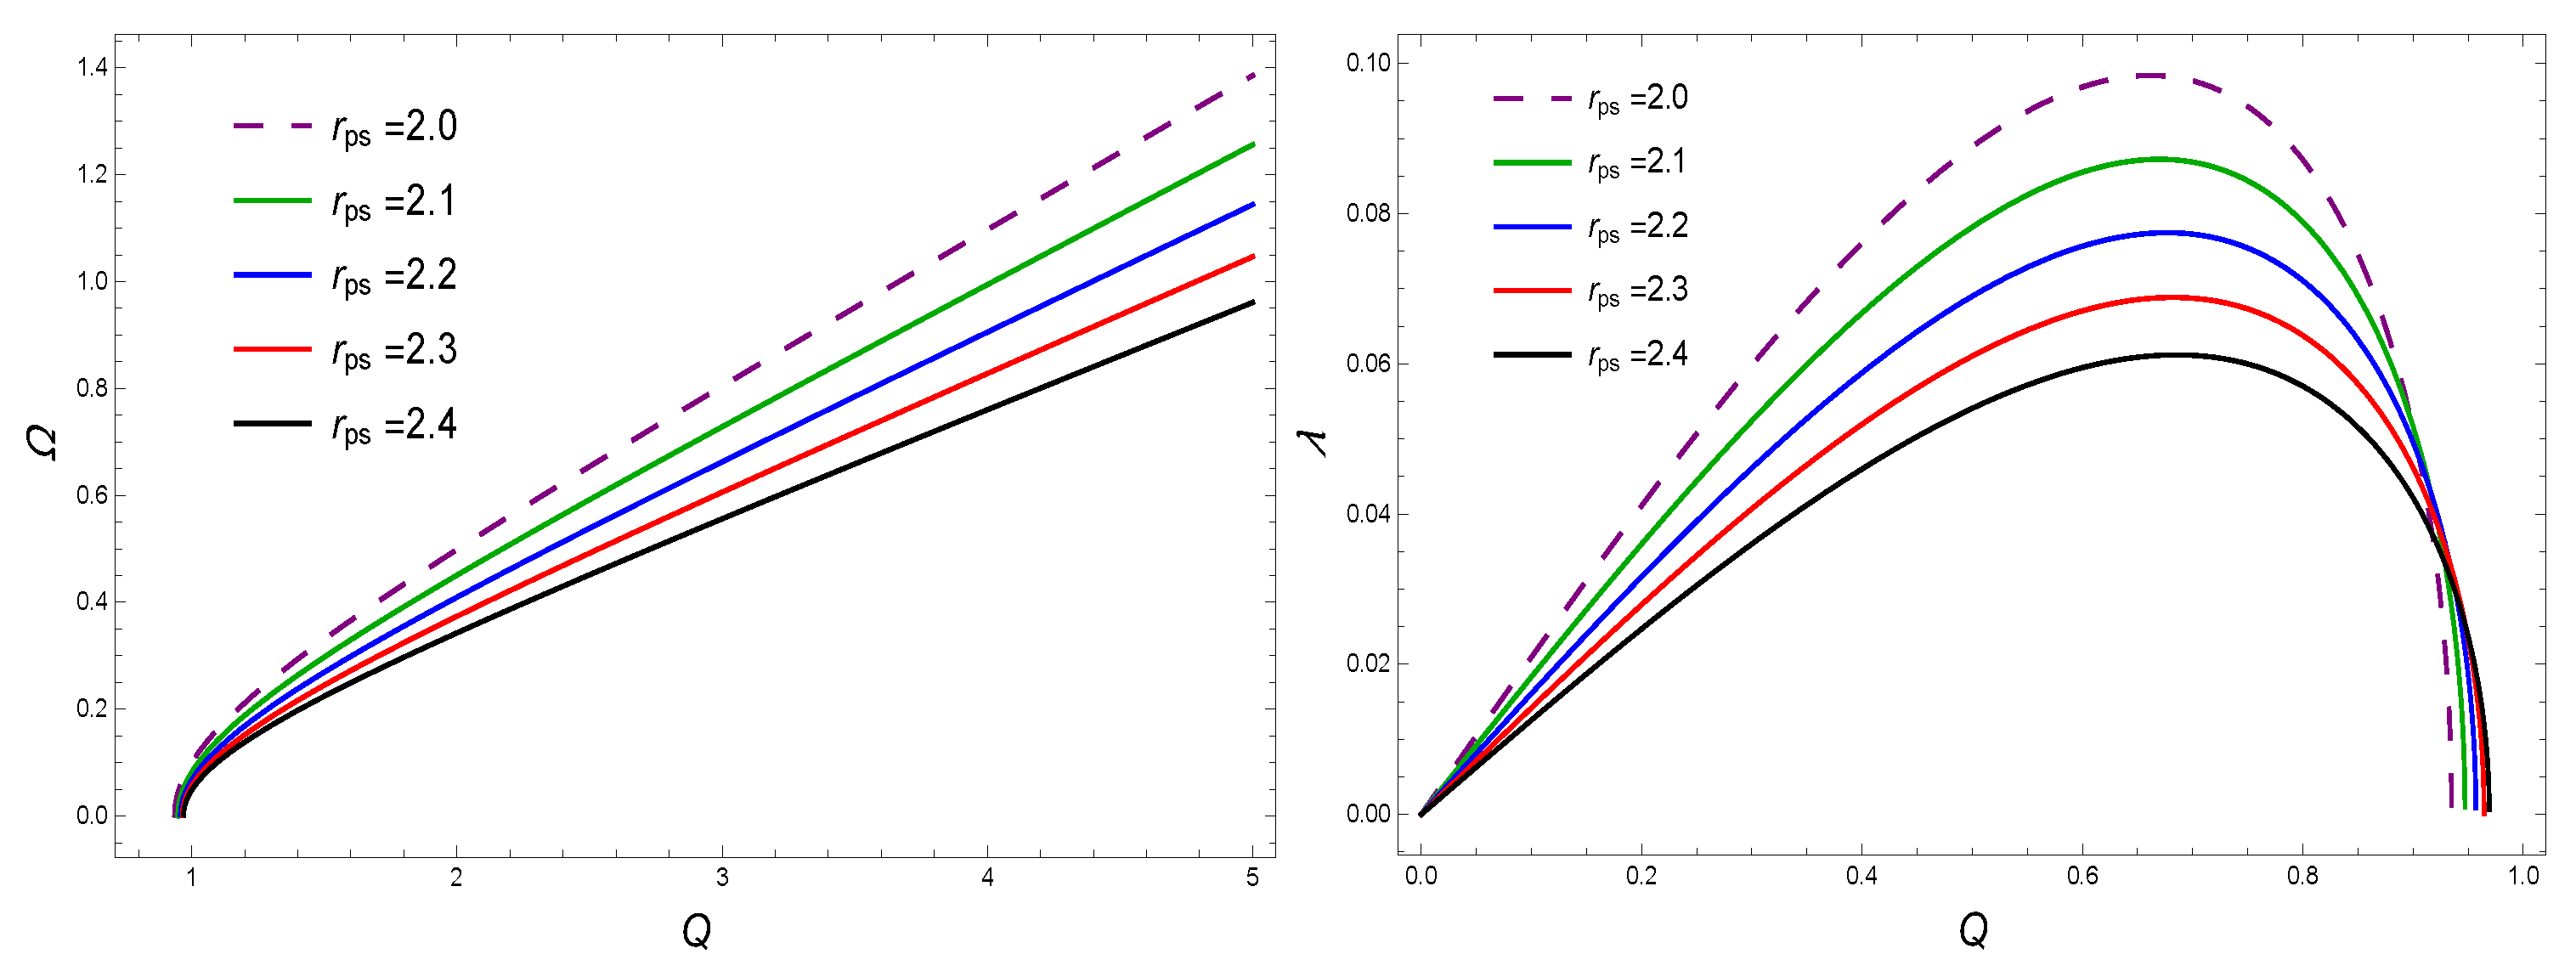
Figure 14 displays the angular velocity and the Lyapunov exponent based on electric charge. This phenomenon expresses the angular velocities of photons, as shown in the left plot, where the maximum angular velocity is shown at the smallest photon radius,
. With a larger photon radius, the angular velocity of the domain grows at a faster rate. According to the physical description of the right plot, as the values of charge increases and the radius of the photons decrease, the Lyapunov exponent grows more rapidly and diverges after demonstrating stability in the Lyapunov exponent system.
4. Conclusions
In this work, we use a thermodynamical perspective to investigate the torus-like AdS charge BH, focusing on the Hawking temperature, entropy, and specific heat. To satisfy BH thermodynamics, the first law of thermodynamics must be valid. We use thermal fluctuation to distinguish modified thermodynamic potentials like the Helmholtz free energy, the Gibbs free energy, the thermodynamic pressure, the enthalpy, and heat capacities at constant pressure and volume. The trace of the Hessian matrix was used to study the effect of thermal fluctuation with a simple logarithmic correction for a torus-like AdS charge BH. It is interesting to see that all physical quantities, including the stability and behavior of the Hessian matrix, are shown after the logarithmic correction for the effects of thermal fluctuations.
First, we used surface gravity to find the Hawking temperature and specific heat. Black holes with large radii are stable and absorb more energy in the considered system. Secondly, the corrected entropy showed the persistent trend at large and small BH radii. By area-entropy relations, corrected entropy increases BH geometry area and satisfies the second law of BH thermodynamics. However, the correction parameter indicates stability for large horizon radii. Thirdly, the Helmholtz free energy is monotonically increasing while decreasing in charge and correction parameters. The physical behavior of Helmholtz free energy describes that system reaching its peak for small radii BH and convergent to its equilibrium state. Table-I and II, describe stability range as well phase transition. The trend in the physical description of total mass presents a positive state, which implies that BH absorb energy from its vicinity and remain stable for a large horizon radius.
It is noted that corrected pressure changes its phase from un-stability to stability only for small values of charge parameter then tends to the equilibrium state throughout the system as can be seen in Fig. . For the various values of the correction parameter, pressure grows to its maximum in the negative region and returns to its equilibrium in Fig. . The graphical depiction of enthalpy illustrates the opposite trend, like pressure. When comparing Gibbs free energy to enthalpy, the two quantities exhibit the same behavior. The specific capacities at constant pressure and volume along with their ratios are also discussed in Fig. 11 and 12. Furthermore, Table-III, IV, V and IV, describe stability range and phase transition. To derive the visual expression for the non-negative Hessian matrix, it is clear that the system remains unstable while the electric charge and correction parameter are allowed to increase and reveal an exothermic reaction. In addition to QNMs and null geodesics, we calculated the real and imaginary components, which are assumed to be angular velocity and the Lyapunov exponent. The Lyapunov exponents reach their maximum for a small charge domain Q and start to diverge at , while the angular velocity rises to its maximum for small photon values.
Figure 2.
The graph of T as a function of with .
Figure 2.
The graph of T as a function of with .
Figure 3.
The graph of T as a function of with .
Figure 3.
The graph of T as a function of with .
Figure 4.
The graph of C as a function of with .
Figure 4.
The graph of C as a function of with .
Figure 5.
The graph of C as a function of with .
Figure 5.
The graph of C as a function of with .
Figure 6.
The graph of S as a function of with and .
Figure 6.
The graph of S as a function of with and .
Figure 7.
The graph of S as a function of with and .
Figure 7.
The graph of S as a function of with and .
Figure 8.
The letf 2 plots in this figure represent the graph of Helmholtz free energy vs. with . We take for plot (a), and for plot (b). Similarly, the right two plots represent the graph of total corrected mass vs. for . For plot (c), we take , and for plot (d).
Figure 8.
The letf 2 plots in this figure represent the graph of Helmholtz free energy vs. with . We take for plot (a), and for plot (b). Similarly, the right two plots represent the graph of total corrected mass vs. for . For plot (c), we take , and for plot (d).
Figure 9.
We show the graph of pressure as a function of (letf 2 plots) for . We use for (a); and for (b). Similarly, the right two plots show the graph of H as a function of for and (c) we take for (d) .
Figure 9.
We show the graph of pressure as a function of (letf 2 plots) for . We use for (a); and for (b). Similarly, the right two plots show the graph of H as a function of for and (c) we take for (d) .
Figure 10.
We show the graph of G as a function of in this figure (letf plot) for . We use for (a) and for (b)
Figure 10.
We show the graph of G as a function of in this figure (letf plot) for . We use for (a) and for (b)
Figure 11.
We show the graph of as a function of in this figure (letf 2 plots) for . We use for (a); for (b). Similarly, the right two plots show the graph of as a function of for and (c) we take for (d)
Figure 11.
We show the graph of as a function of in this figure (letf 2 plots) for . We use for (a); for (b). Similarly, the right two plots show the graph of as a function of for and (c) we take for (d)
Figure 12.
We show the graph of as a function of in this figure for . We use for (a); for (b).
Figure 12.
We show the graph of as a function of in this figure for . We use for (a); for (b).
Figure 13.
The graph of as a function of is shown in this figure with . For (a), we use , for (b), .
Figure 13.
The graph of as a function of is shown in this figure with . For (a), we use , for (b), .
Figure 14.
In this fig (letf plot) represent the graph of Angular velocity as a function of Q with , . Similarly (right plot) represent the graph of Lyapunov exponent as a function of Q with ,
Figure 14.
In this fig (letf plot) represent the graph of Angular velocity as a function of Q with , . Similarly (right plot) represent the graph of Lyapunov exponent as a function of Q with ,
