Preprint
Article

Machine Learning and Explainable Artificial Intelligence using Counterfactual Explanations for Evaluating Posture Parameters

Altmetrics

Downloads

156

Views

37

Comments

0

A peer-reviewed article of this preprint also exists.

Submitted:

28 March 2023

Posted:

29 March 2023

You are already at the latest version

Alerts
Abstract
Postural deficits such as hyperlordosis (hollow back) or hyperkyphosis (hunchback) are relevant health issues. Diagnoses depend on the experience of the examiner and are therefore often subjective and prone to errors. Machine learning (ML) methods in combination with explainable ar-tificial intelligence (XAI) tools have proven useful for providing an objective, data-based orien-tation. However, only a few works have considered posture parameters, leaving the potential of more human-friendly XAI interpretations still untouched. Therefore, the present work proposes an objective, data-driven ML system for medical decision support that enables especially human-friendly interpretations using counterfactual explanations (CFs). Posture data for 1151 subjects were recorded by means of stereophotogrammetry. An expert-based classification of the subjects regarding the presence of hyperlordosis or hyperkyphosis was initially performed. Using a Gaussian progress classifier, the models were trained and interpreted using CFs. Label errors were flagged and re-evaluated using confident learning. Very good classification performances for both hyperlordosis and hyperkyphosis were found, whereby the re-evaluation and correction of the test labels led to a significant improvement (MPRAUC = 0.97). A statistical evaluation showed that the CFs seemed to be plausible in general. In the context of personalized medicine, the present study’s approach could be of importance for reducing diagnostic errors and thereby improving the individual adaptation of therapeutic measures. Likewise, it could be a basis for the development of apps for preventive posture assessment.
Keywords: 
Subject: Medicine and Pharmacology  -   Orthopedics and Sports Medicine

1. Introduction

Promising potentials for objectified, data-based support through the integration of artificial intelligence, and its subcategories of machine learning (ML) and deep learning, for data interpretation have been shown for the healthcare sector in numerous studies. It has been demonstrated that these techniques are beneficial for analyzing complex and multivariate data; finding discriminative, class-specific differences; and ultimately providing objective, data-based decision support to medical practitioners [1,2]. Furthermore, an advantage over the commonly used inference-based statistical analysis methods has been reported [3,4]. It has been shown that ML-based systems even surpass human guidance in disease detection [5,6]. In addition, a reduction in false-positive mistakes and the mitigation of different experience levels of medical practitioners have been reported [7]. In the context of concrete biomechanical use cases, ML has proven useful in the diagnosis of gait disorders [8,9], the recognition of human activities [10], age-related assessments [11,12], and the optimization of the rehabilitation phase [13]. Various biomedical diseases have been considered, e.g., after a stroke [8], in Parkinson’s disease [9], in osteoarthritis [14], and in total hip arthroplasty [15]. However, regarding the application of ML methods for the evaluation of posture parameters, little research has been conducted [16].
A common way to check a person’s posture is to assess the back contour through a visual inspection. However, this procedure is susceptible to subjectivity and potential errors. A comparative study where 28 chiropractors, physical therapists, rheumatologists, and orthopedic surgeons evaluated the posture of subjects from lateral photographs found that the intra-rater reliability was only moderate (kappa = 0.50) and the inter-rater reliability was weak (kappa = 0.16) [17]. There is therefore a great need for research to support medical diagnostics with data-based yet transparent ML methods. This has recently led to the development of smartphone (apps) that assess posture in a semi-automated way [18]. Methods that support these diagnostics while allowing assessments that are comprehensible to the user may therefore be of great medical benefit.
Due to the difficulty and error-proneness of objectively assessing posture by experts, it can be concluded that training as well as test posture data for ML might be negatively affected in terms of wrongly assigned labels by experts. On the one hand, this negatively affects the training process of an ML classifier, and on the other hand, the true performance of the test data is possibly underestimated. This problem is known even for test data from benchmark datasets (e.g., MNIST, ImageNet) [19]. A re-assessment of class labels is often not possible simply because the datasets are large, and therefore, not all cases can be re-examined economically. A recently described approach for dealing with these problems is confident learning for estimating uncertainty in dataset labels [20]. The approaches enable both the supervised training of a model for training data with incorrect labels and the identification of possible errors in the test data, which can then be re-evaluated by experts and thus corrected. Although there are promising results from confident learning [19,20,21,22], and the characteristics of biomechanical expert evaluations, which can be accompanied by errors, highlight the importance of such approaches, no work is known to the best of the authors’ knowledge that has applied confident learning in the context of biomechanical or sports science issues.
Regarding the use of ML models, the model’s opacity often makes it difficult for users to trust and understand its decisions [28]. Such a lack of transparency violates the requirements of the European General Data Protection Regulation (GDPR, EU 2016/679) [23], which greatly limits the practicality of using the model in clinical settings [24]. Recent advances in explainable artificial intelligence (XAI) have made it possible to make ML more and more applicable in practical clinical contexts, for example, in the biomechanical domain [25,26]. XAI provides various methods for increasing the trustworthiness and transparency of black box models [27], such as local interpretable model agnostic explanations (LIME) [28], Shapley additive explanations (SHAP) [29], and deep learning important features (DeepLIFT) [30]. The use of XAI has proven especially valuable in understanding personalized differences in pathology, such as in monitoring pre- and post-operative therapy measures, and is thus highly relevant to the field of personalized medicine [26].
Although these works have shown interesting perspectives, local interpretations have so far mainly focused on a few XAI methods in the biomedical domain, e.g., LIME [25] or layer-wise relevance propagation [2]. Furthermore, until now, these methods have not shown to what extent changes in the implemented features would have an influence on the model prediction. This, however, would be highly relevant both in the context of good comprehensibility and in terms of the planning of therapy measures that normally depend on the classification of a human examiner.
Counterfactual explanations (CFs), an XAI tool, could be a way to address these aspects, which, to the best of the authors’ knowledge, has not yet found its way into the biomedical context. CFs examine which features would need to be changed to achieve a desired prediction. Since human posture is multifactorial, i.e., a large number of individual posture parameters (e.g., depth of lumbar lordosis, forward tilt of the pelvis, degree of thoracic kyphosis) are included in the summary assessment by a physician, it would be interesting to know for which combinations and expressions of these individual parameters he would assess the posture as correct. In the context of this binary classification problem of a posture assessment (“good” or “weak”, which means “no therapy” or “therapy”), this could mean that, for a subject classified with an 80% probability as pathologic: “if we could improve the pelvic tilt by X degrees, the patient would be classified as not having poor posture with a probability of 80%”, whereby individual personal characteristics (e.g., gender, age) could be additionally included. By providing explanations in this way (explanations contrastive to the instance of interest) and usually focusing on a small number of features to change, CFs are particularly human-friendly explanations [31].
Due to the above-mentioned research deficits, the aim of the present work was twofold for using the posture data of subjects with hyperkyphosis or hyperlordosis, as well as healthy subjects: First, we wanted to evaluate the general modelling abilities and check if it is possible to classify the presence of hyperkyphosis or hyperlordosis for giving an objective, data-based orientation. In parallel, we wanted to evaluate confident learning for model training, as well as to test data label error identification and check if the reevaluation of flagged test labels and a potential correction improves the performance of the model. Second, we wanted to analyze if CFs add useful insights into the trained models and provide reasonable/plausible suggestions for the improvement of parameters in biomechanical terms.

2. Materials and Methods

2.1. Subjects and data acquisition

Data were collected from 1.151 subjects. The exclusion criteria were chronic diseases of the spine or the musculoskeletal system, a previous spinal surgery, leg length discrepancies greater than 5 mm, and dizziness. Two subjects with missing data were excluded for further analyses, resulting in a total of 1149 subjects that were used for the further calculations (sex: 691 male, 458 female; age: 35.13 ± 15.91 years; weight: 73.86 ± 17.97 kg; height: 172.97 ± 10.17 cm). No outliers were removed. The study was approved by the ethical committee of the university (Saarland University: UdS 15-6-08; RPTU: 23-57) and met the criteria of the Declaration of Helsinki [32]. All participants signed informed consent forms, including permission to publish the results of the study. In the case of minors, the consent of the legal guardian was obtained.
The examinations were conducted with a mobile scanner (Bodybalance 4D, Paromed Bodybalance GmbH, Neubeuern, Germany). The test persons stood in a habitual position with a bare upper body (women in bras) at a distance of 2.30 meters from the device. The examiner had previously marked the following anatomical landmarks with white marker dots (diameter of 12 mm): the spinous process of the 7th cervical vertebra (C7); the vertices of the cervical, thoracic, and lumbar spine curvatures; the spinous process of the 1st sacral angle (S1); the posterior superior iliac spine (PSIS); and the tips of the shoulder blades. Each scan was performed four times and the obtained values were averaged. The anatomical landmarks were automatically recognized by the system and manually checked and confirmed again by the examiner.
The available features are presented and described in Table 1 and Figure 1. Subject characteristics were included as features for modelling. Based on the measured raw data for distance C7-S1, c-spine, t-spine, and l-spine (see Figure 1), the feature kyphosis index (KI), flèche cervicale (FC), and flèche lombaire (FL) were calculated, as they are commonly used for posture evaluations [33,34]. Further, these calculated features were normalized by the distance between C7 and S1 (corresponding to the subjects’ trunk heights) to allow better comparability between subjects (hereinafter abbreviated as KI%, FC%, and FL%).
Based on the measurements and on a visual inspection of the subjects, four experienced biomedical experts performed a classification of the subjects regarding the presence of hyperkyphosis of the thoracic spine or hyperlordosis of the lumbar spine, with each subject being evaluated by one of the four raters only. All investigators had many years of experience in the field of posture analysis and worked according to the same assessment standards. Accordingly, 420 subjects (36.56 %) showed hyperkyphosis and 411 (35.77 %) showed hyperlordosis.

2.2. Feature set and modelling

When interpreting black box models, the influence of different data representations on both the classification accuracy and interpretability must be kept in mind. It is evident that ML models can only be interpreted as well as their features. Even simple, highly interpretable model types can be difficult or impossible to understand if no human-interpretable features are used [35]. In addition, different levels of background knowledge and expertise must be taken into account when developing interpretable features in order to optimally dock onto the existing knowledge of the users; otherwise, the features quickly become difficult to understand again for specific target groups [1]. Consequently, for predicting the presence of hyperkyphosis and hyperlordosis, interpretable features that are of high relevance in practice as well as supported by former studies were selected for modelling. Therefore, regarding the reported age- and gender-related effects on posture parameters as well as the high practical relevance and comparability of the height-normalized indices [36], the features gender, age, KI%, FC%, and FL% were used for modelling. For an evaluation of the selected feature set, the modelling results were compared with those of models trained on all 15 features presented in Table 1.
For the classification of hyperlordosis and hyperkyphosis, a one vs. rest multi-label strategy was followed. Thus, one classifier was fitted per class against all the other classes. The model training was integrated into a stratified 5-fold cross-validation procedure (with the folds preserving the percentage of samples for each class) to obtain an unbiased accuracy score. For each fold, the data were split with approximately 80% into training and 20% into test data. The test data were completely held out and only used for testing. Due to an imbalanced class distribution, the synthetic minority over-sampling technique for nominal and continuous features (SMOTENC) was applied to create training data with balanced classes using the python library “imbalanced-learn” [37].
A Gaussian process classifier was used for the classification, as research has shown its ability to predict well-calibrated probabilities and its superior performance compared to logistic regression [38]. Further, the Gaussian process classifier has been successfully used in medical studies [39,40]. For model implementation, the scikit-learn python library [41] was used with the hyperparameters set to the default values. Data scaling was performed by removing the mean and scaling to the unit variance based on the respective training dataset for each fold. For an evaluation of the model selection, logistic regression was applied, as it is known to be an interpretable model.
Uncertainties were reported as classification probabilities. Due to imbalanced data, precision–recall curves and the precision–recall area under the curve (PRAUC) metric were reported. The probabilities were transformed into crips values by using the 0.5 threshold. The respective accuracies were reported with the confusion matrix, as well as the F1 score and the Matthews correlation coefficient (MCC) due to imbalanced classes. The calculations were performed in Python (Python Software Foundation, Wilmington, DE, USA).

2.3. Confident Learning, Interpretation, and Evaluation

Potentially wrong test labels were flagged using the Python confident learning library cleanlab [22]. Using cleanlab, and on the basis of the Gaussian process classifier models directly trained on each training fold dataset during cross-validation, potentially wrong test labels were automatically flagged. The flagged test data were then relabeled by experienced experts using a digital survey. Additionally, the age and gender of the subject to be re-evaluated were presented to the experts alongside the data. The original class labels were hidden. In the first step, two experts were asked for their assessment of all flagged subjects. In the event of an inconsistent assessment, a third expert was also called in and the majority vote was selected as the final class label.
As label errors also seemed likely in the training data of each fold, confident learning during the training procedure was additionally applied. To evaluate the influence of the possible correction of the test labels as well as the confident learning during the training process, classification results were therefore presented for the following scenarios:
  • Test performance on the given test labels using the Gaussian process classifier;
  • Test performance on the corrected test labels using the Gaussian process classifier;
  • Test performance on the given test labels using the Gaussian process classifier + confident learning on training data;
  • Test performance on the corrected test labels using the Gaussian process classifier + confident learning on training data.
Local interpretations (interpretations of individual instances/subjects) of the trained models were performed using CFs with the python library diverse counterfactual explanations (DiCE). Studies have shown promising results for using this library to generate CFs [42,43]. The parameters, including proximity and diversity weights, were set to the default values. To capture the variability (also called diversity) of the CFs, ten explanations were generated for each instance that needed to be explained. Therefore, the data from each test set with the respective calibrated models were used. As subject characteristics (age, gender) were impossible to change in a real setting, feature changes were allowed only for the posture parameters, which might be possible to change through therapy measures.
Additionally to the local interpretations, global interpretations (interpretations over multiple instances/subjects) were reported through the aggregation of the local interpretations, similarly to [25]. Thus, the ten CFs per subject were aggregated for each feature using the median. For the global interpretations, the data for wrongly predicted instances according to the crisp values were excluded.
For an evaluation of the CFs in terms of plausibility in biomechanical terms, global changes between the subjects with the postural deficits and global CFs were statistically checked. Further, the global changes were also checked if the CFs for the subjects with hyperkyphosis and hyperlordosis met the characteristics of the healthy subjects. Therefore, the aggregated data used for the global interpretations were used and a Mann–Whitney U test was applied as a non-parametric test to check for potential differences. Statistical tests were performed with the Python library SciPy [44]. The p-values were compared to an alpha level of 0.05.

3. Results

3.1. Re-evaluation results

Originally, of the 1.149 subjects, 420 showed hyperkyphosis and 411 showed hyperlordosis. After a re-evaluation and the correction of the flagged instances, 424 showed hyperkyphosis and 423 showed hyperlordosis. The results of the re-evaluation are presented in Table 2. For the classification of hyperkyphosis, more flagged labels, a larger disagreement among the raters, and more actually corrected labels were found compared to the classification of hyperlordosis.
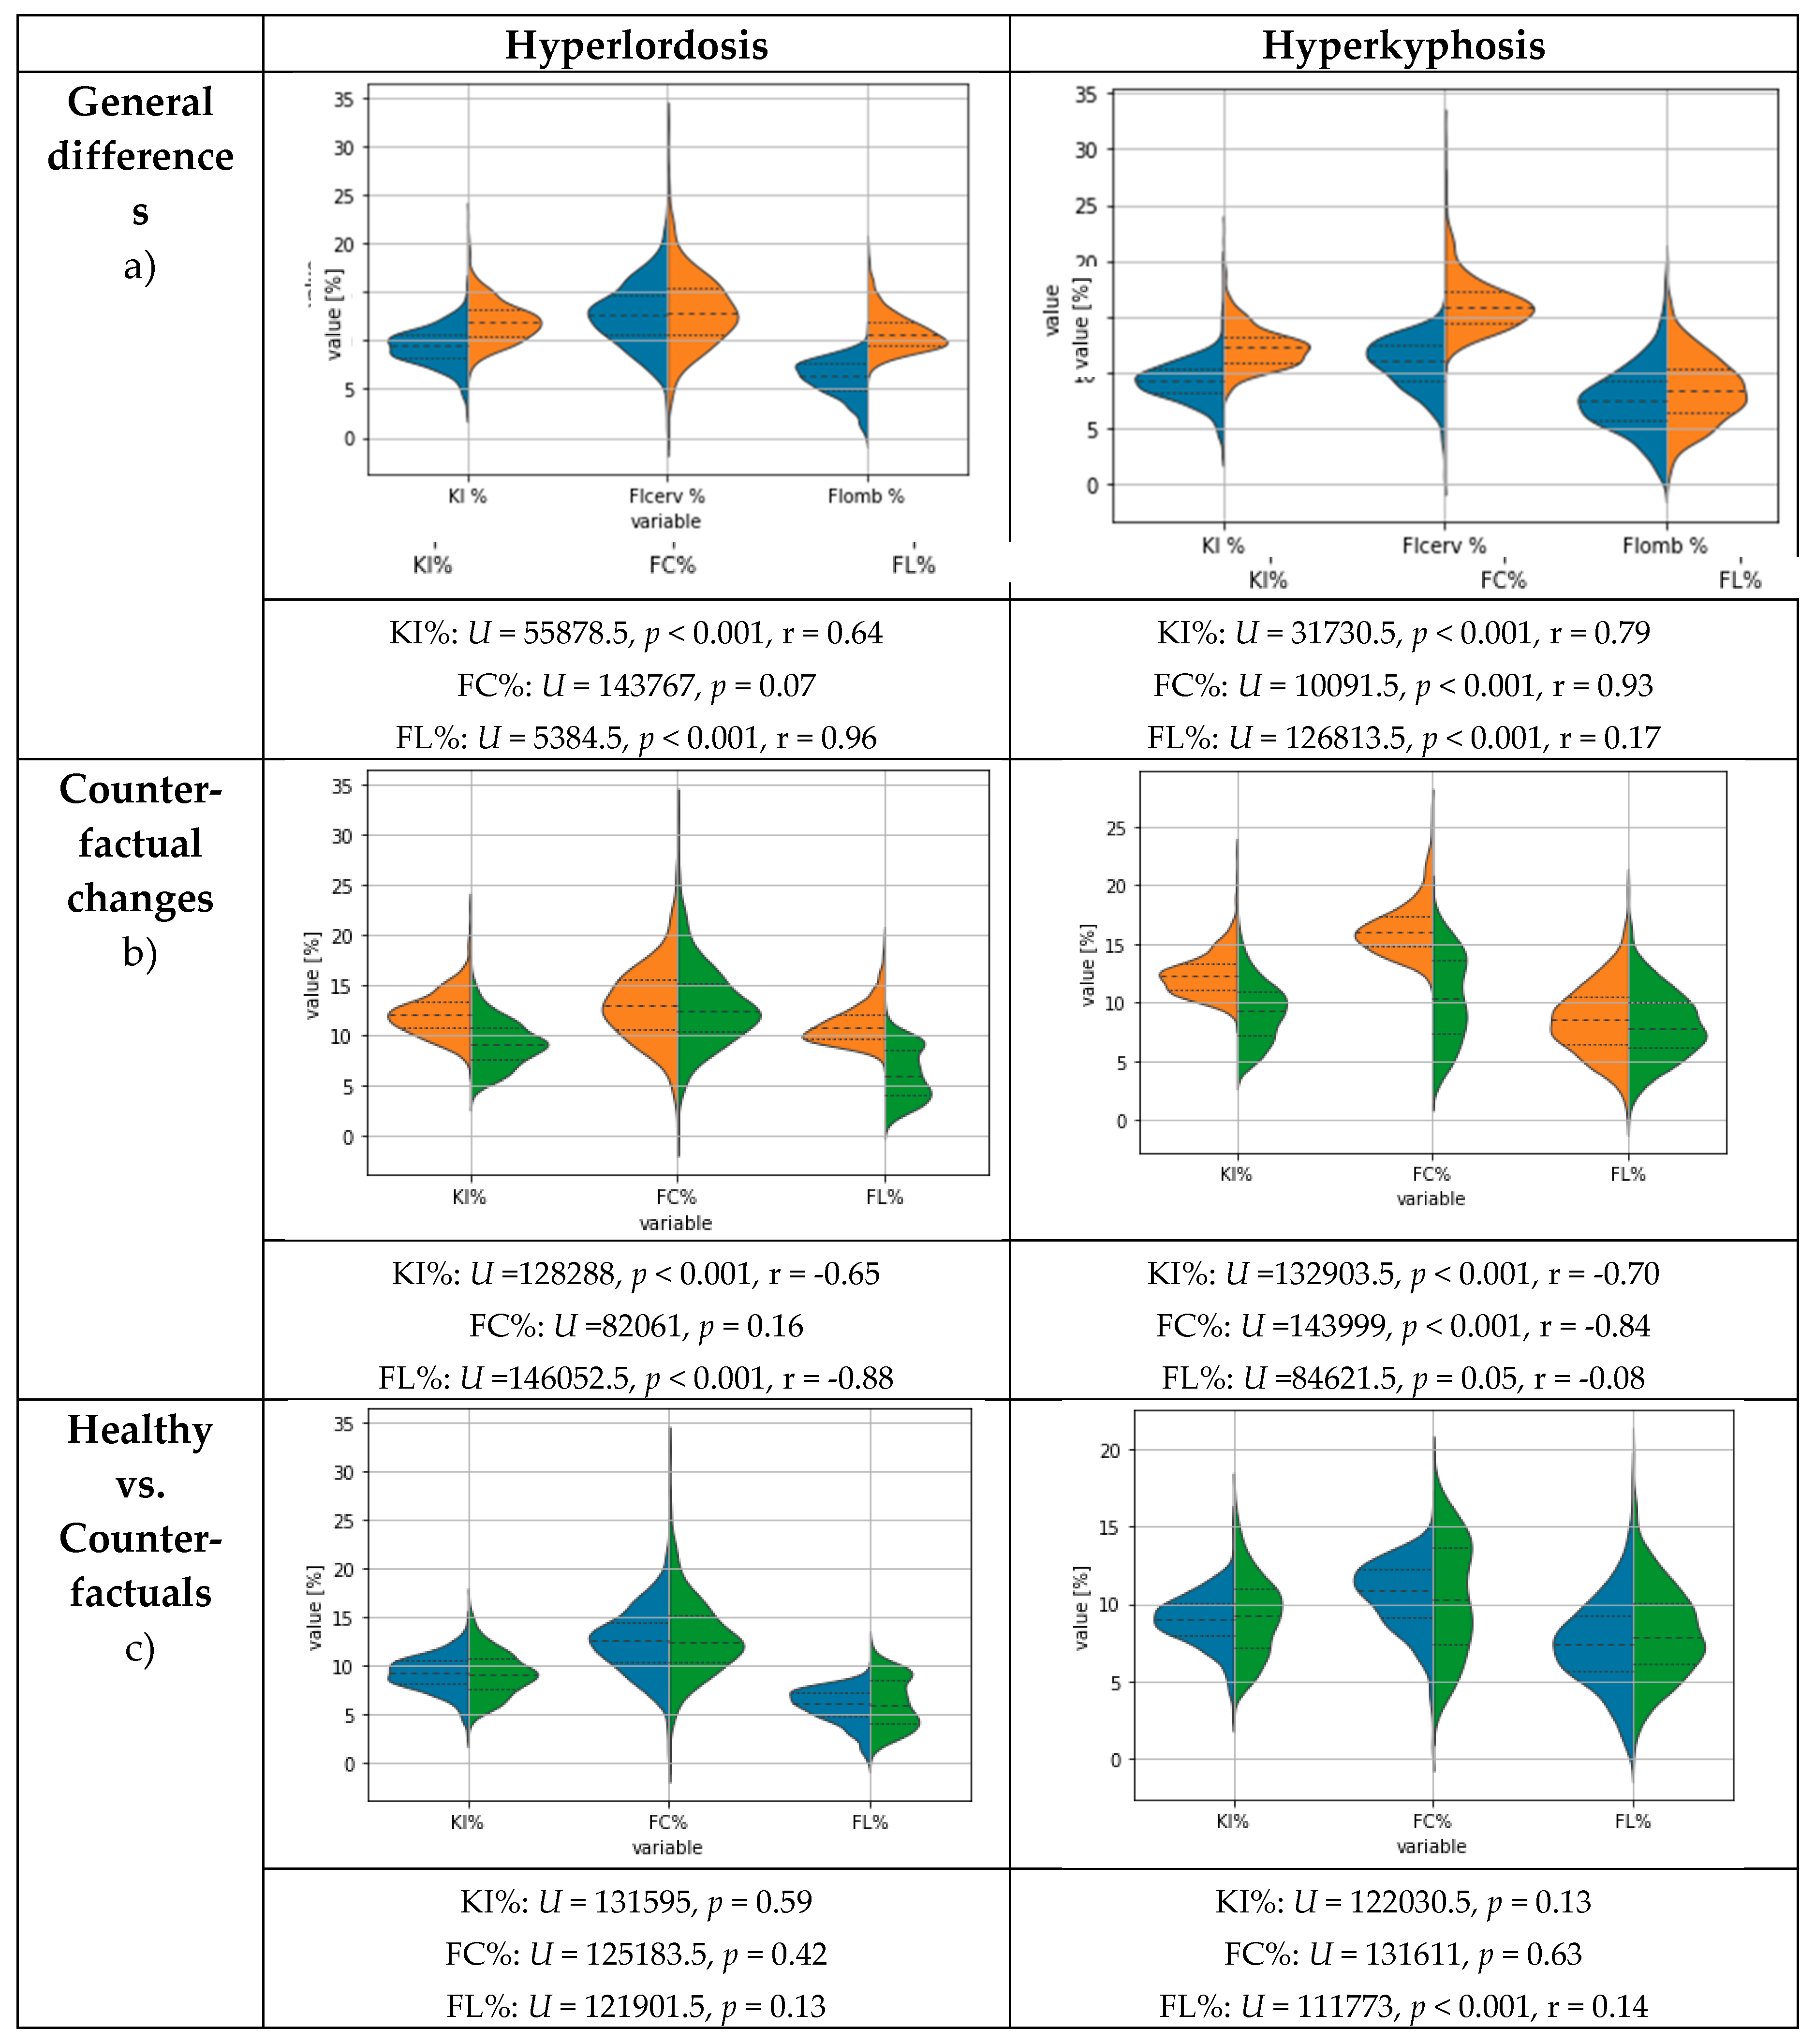
Figure 2 (upper plots) shows the general differences, including the statistical test results, between the features for subjects with and without hyperlordosis or hyperkyphosis and healthy subjects after correcting the flagged test labels. The statistical differences between healthy subjects and subjects with hyperlordosis were mainly observable for the features KI% and FL%. The subjects with hyperkyphosis differed from healthy subjects for the features KI% and FC%.

3.2. Modelling results

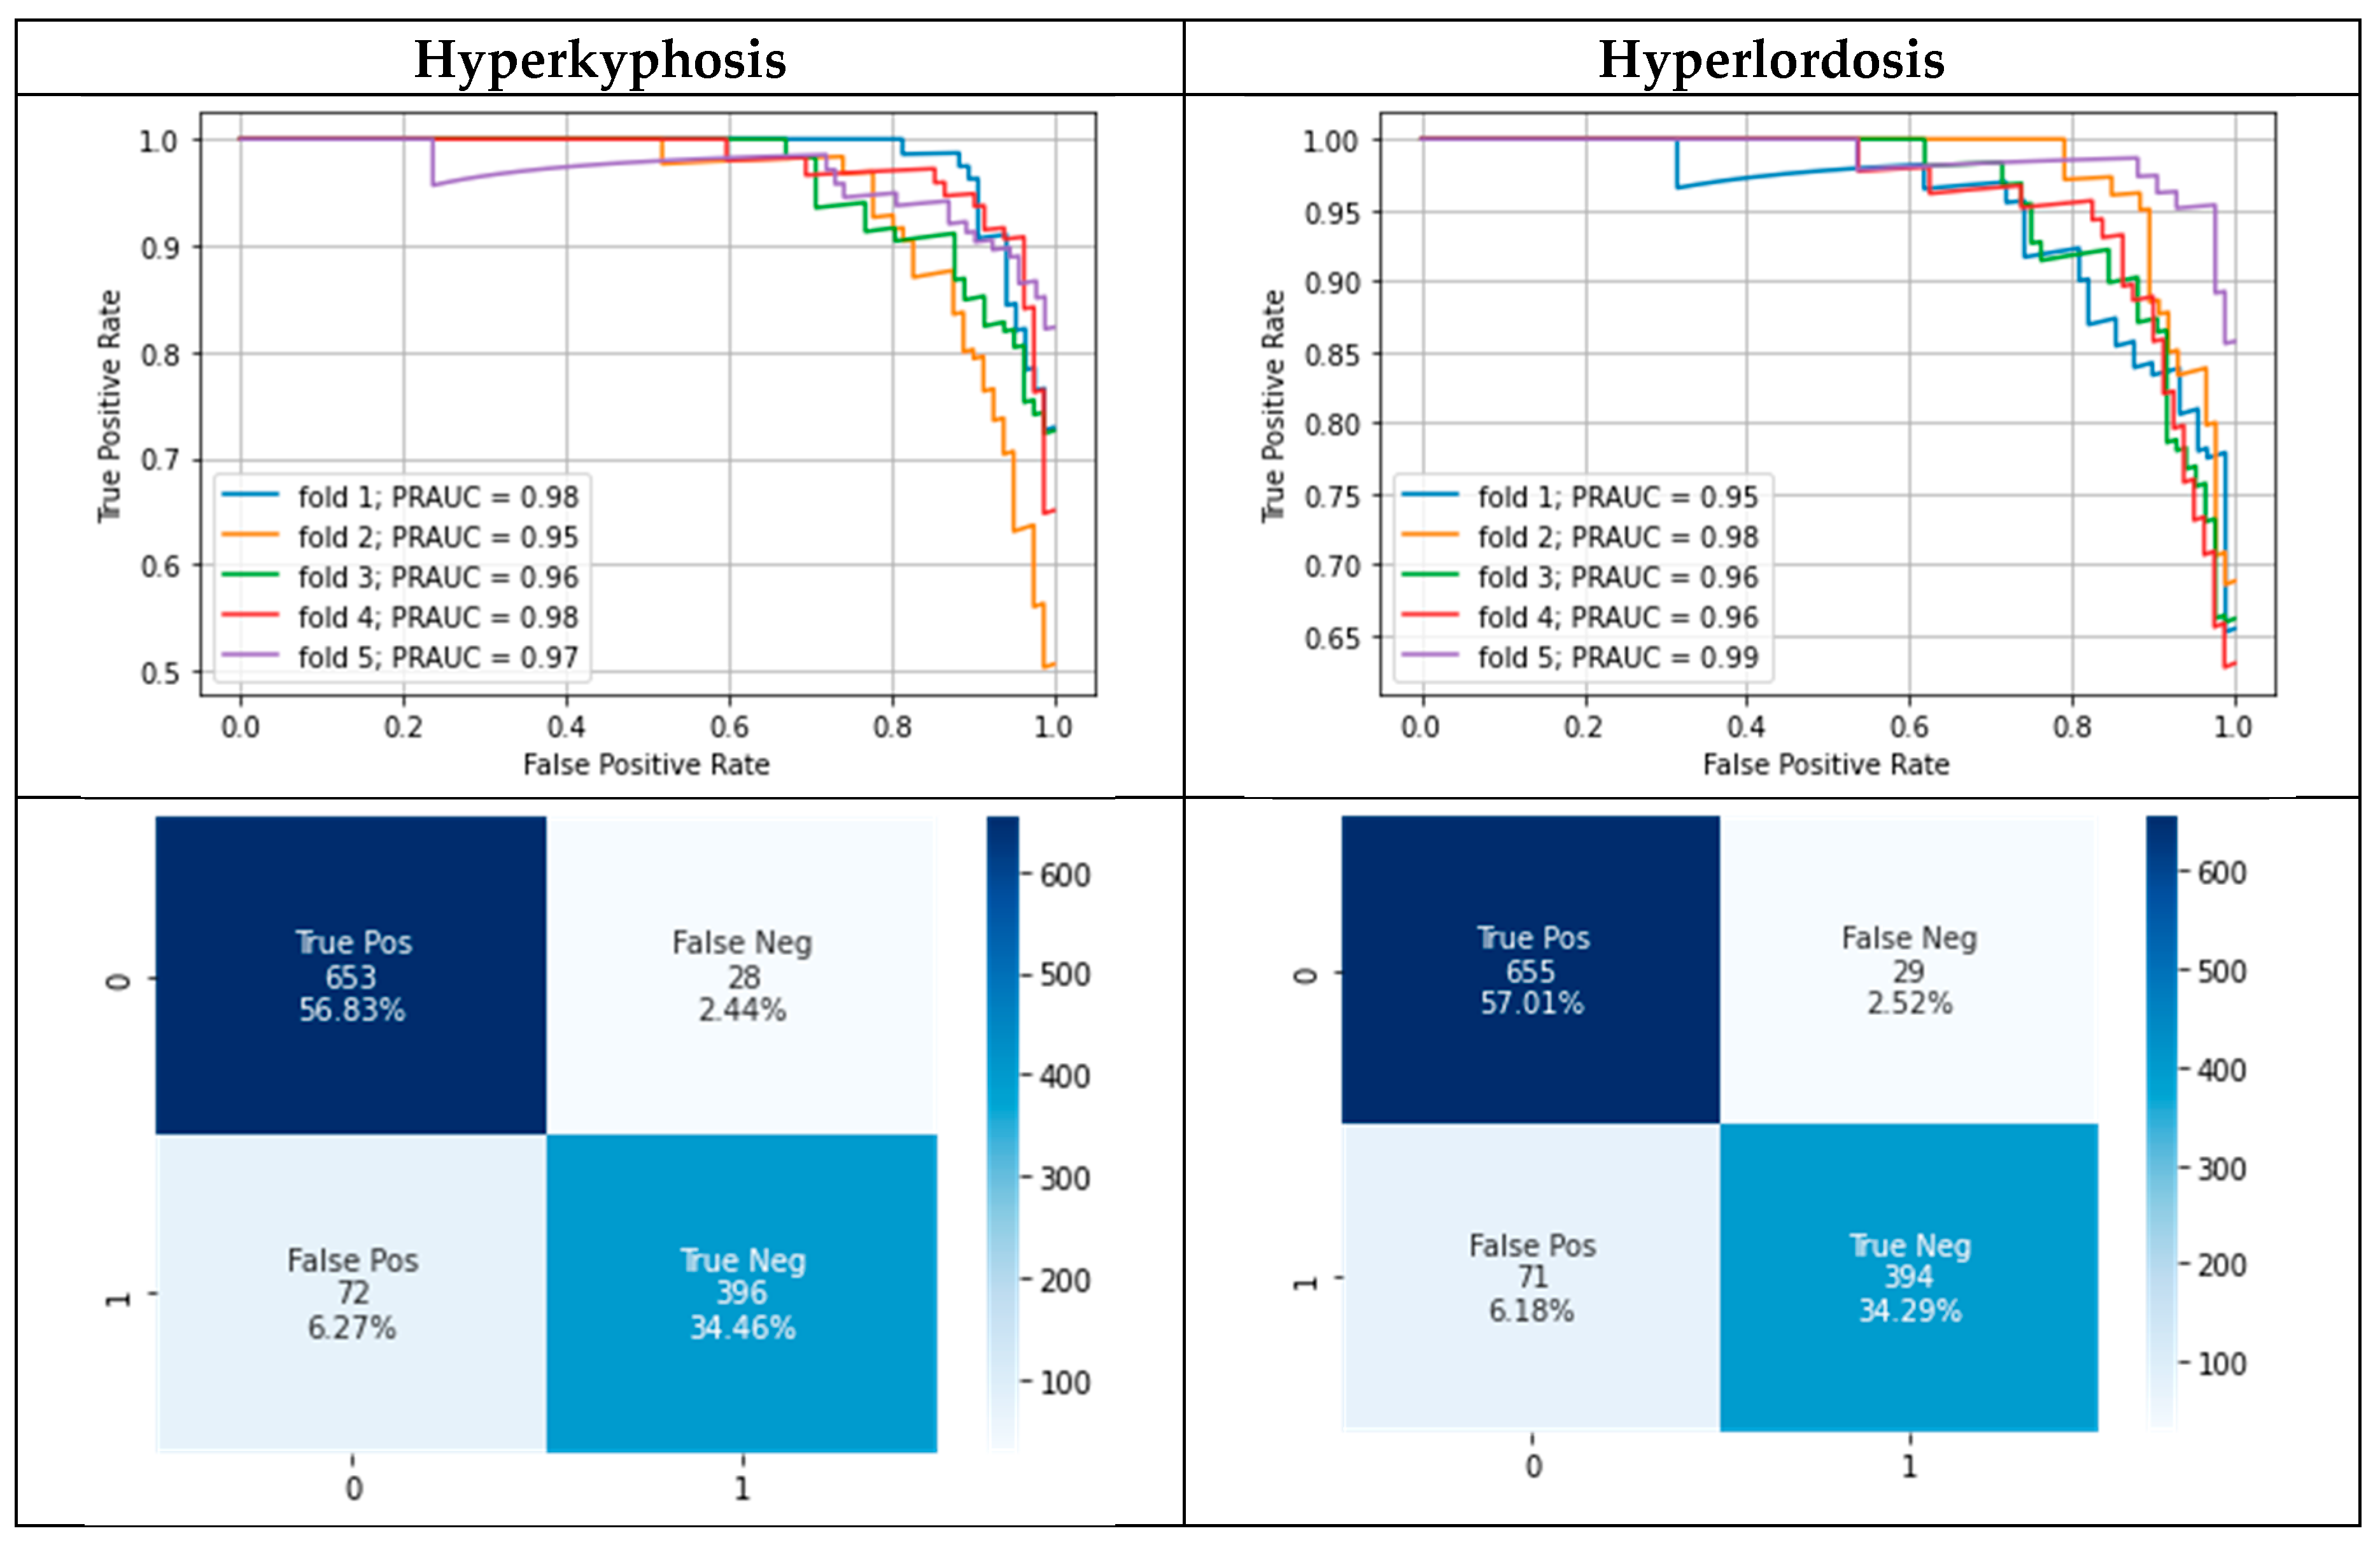
Table 3 and Figure 3 show the modeling results separately for predicting the presence of hyperlordosis and hyperkyphosis. Approximately the same modelling performance for hyperlordosis and hyperkyphosis was present. The best modelling results were achieved after correcting the flagged test labels, whereas an improvement was observable compared to the use of the given test labels. However, no difference in the mean area under the precision–recall curve (MPRAUC) after correcting the flagged test labels was present when using the potentially wrongly labeled training data for model training with confident learning.
Using the selected feature set consisting of the feature gender, age, KI%, FC%, and FL% showed a superior performance compared to using all available features with confident learning and the corrected test labels for both hyperkyphosis (MPRAUC = 0.9 ± 0.04, MF1 = 0.86 ± 0.02, MMCC = 0.77 ± 0.04) and hyperlordosis (MPRAUC = 0.91 ± 0.02, MF1 = 0.88 ± 0.02, MMCC = 0.8 ± 0.03). Logistic regression using the selected features resulted in approximately the same performance for the classification of hyperlordosis (MPRAUC = 0.97 ± 0.01, MF1 = 0.89 ± 0.03, MMCC = 0.83 ± 0.05), but a slightly reduced performance compared with the Gaussian process classifier for the classification of the presence of hyperkyphosis (MPRAUC = 0.95 ± 0.01, MF1 = 0.87 ± 0.02, MMCC = 0.80 ± 0.03).

3.3. Results for Counterfactual Explanations

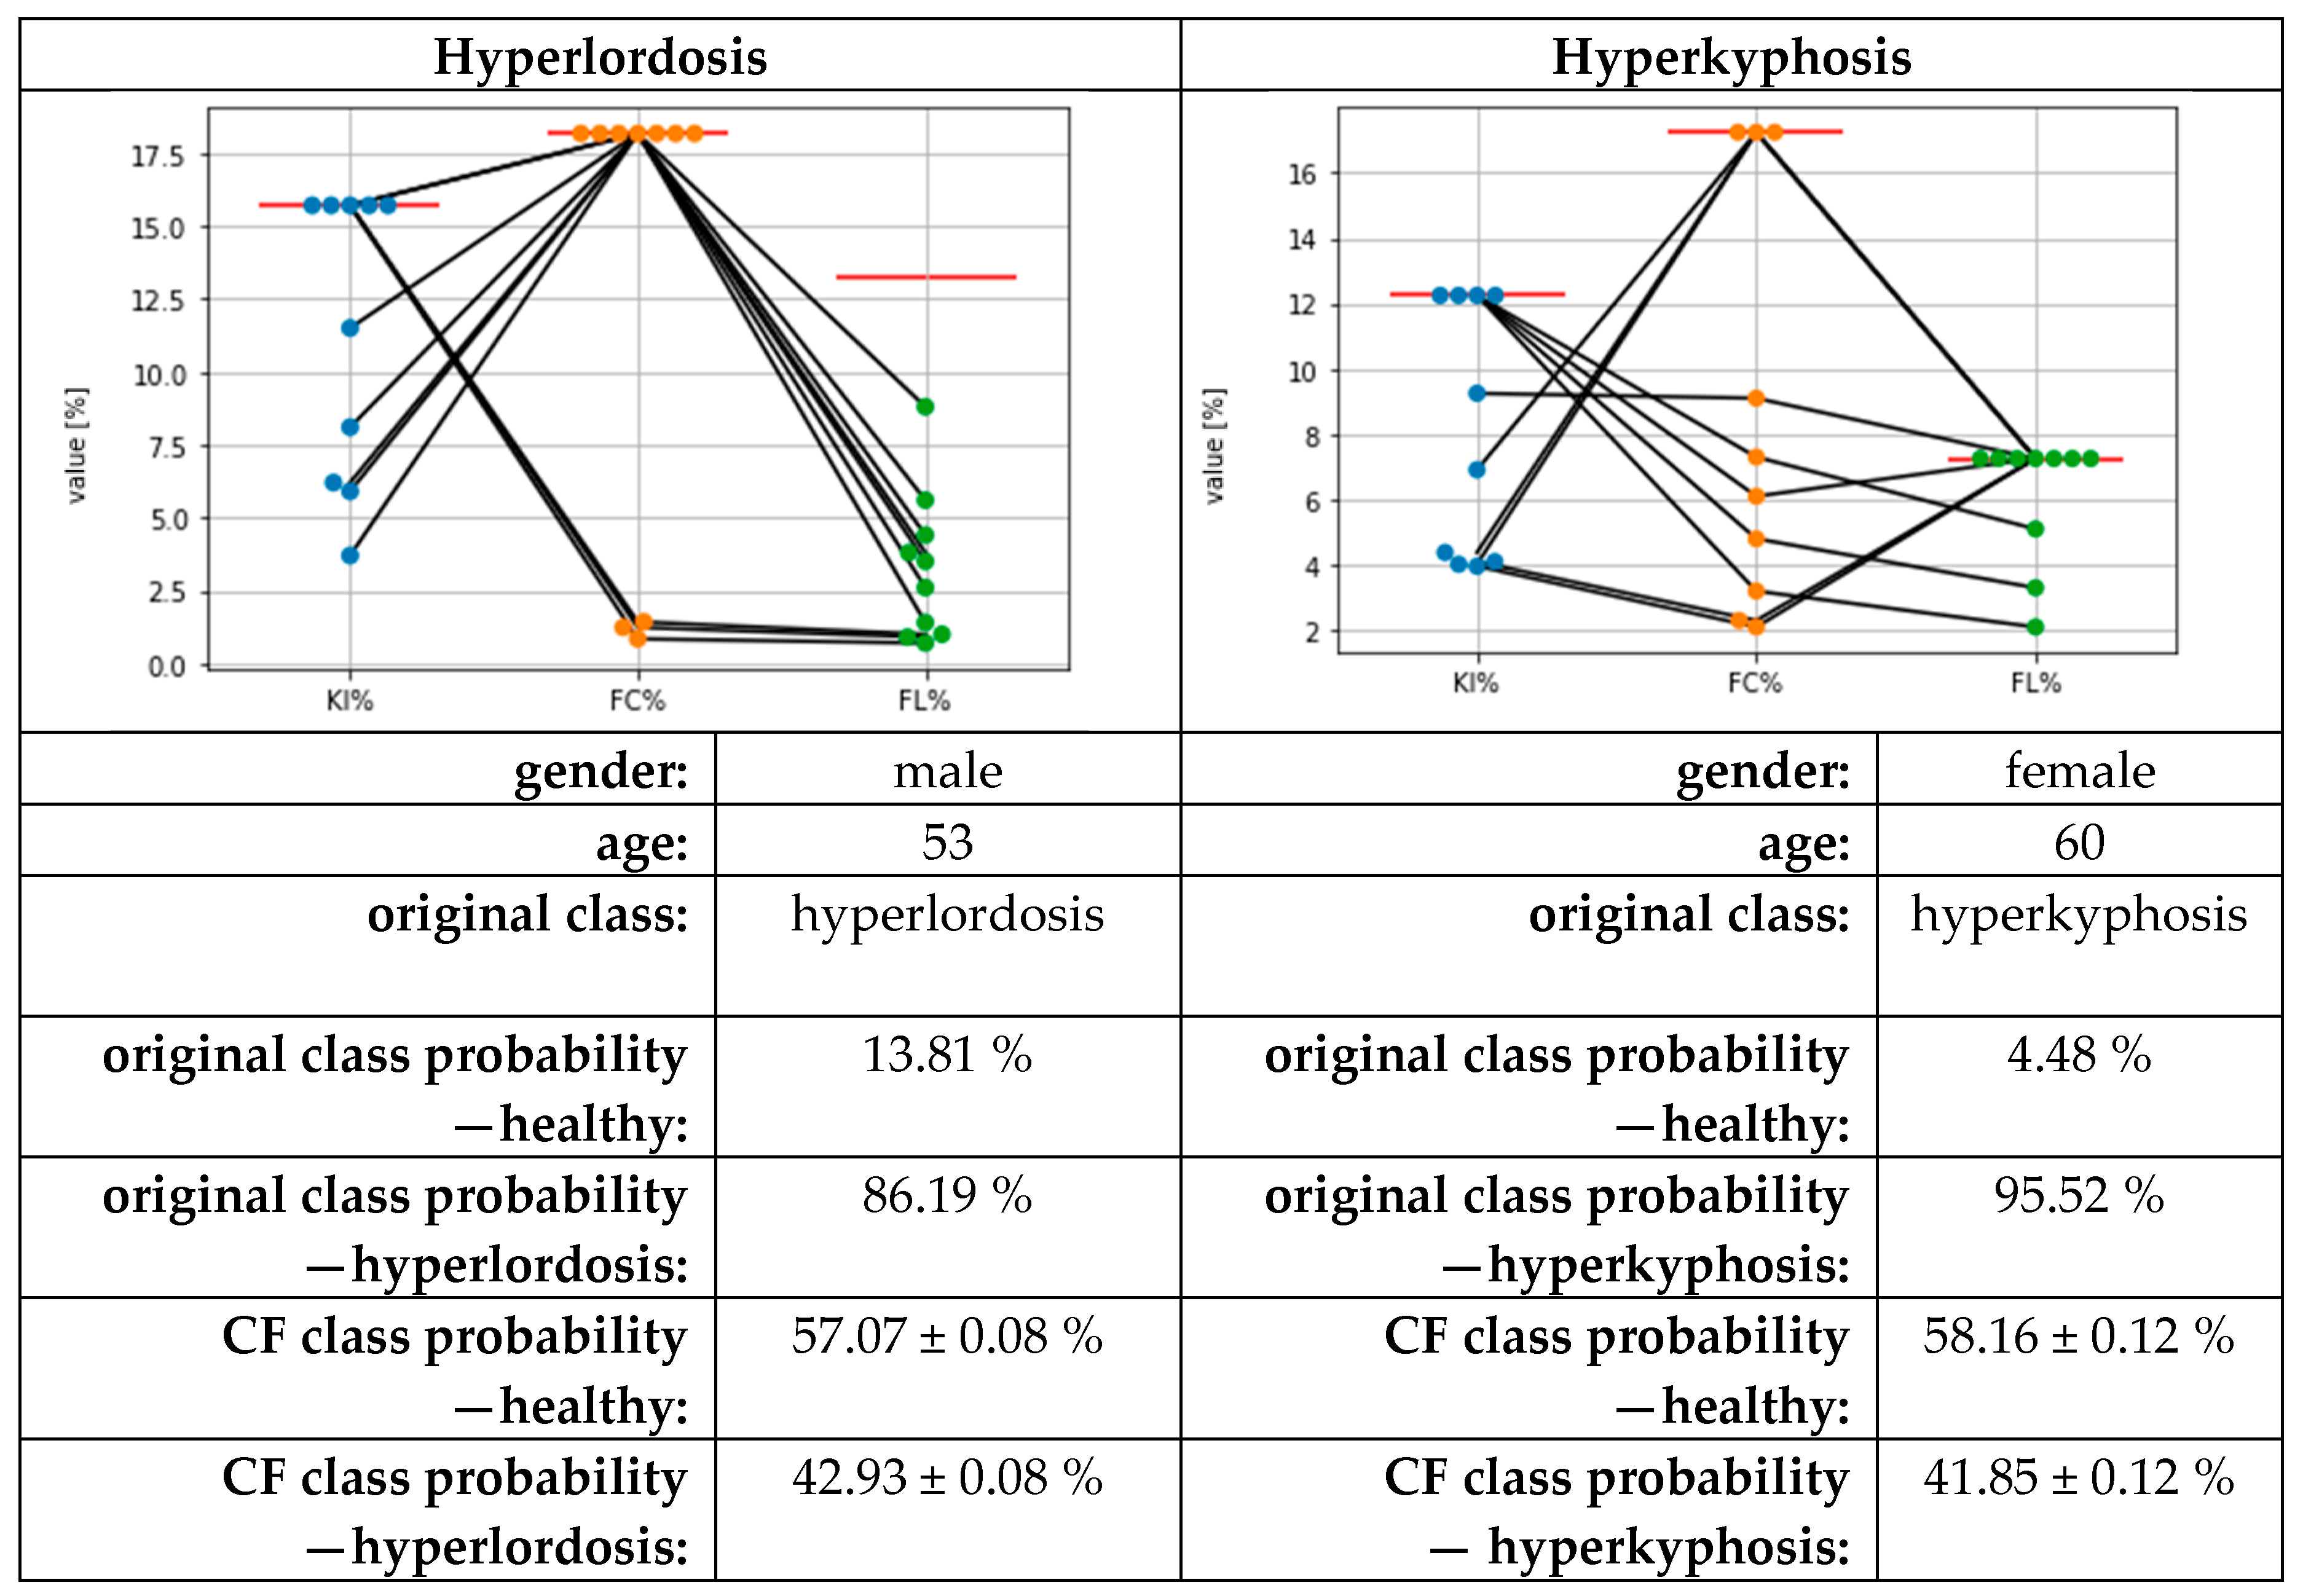
Exemplary local results for two subjects regarding the CFs are presented in Figure 4. Based on these results for hyperlordosis, the CFs mainly suggested reducing KI% and FL% compared to the given feature values and keeping the FC% feature value. In three of the ten cases, the CFs suggested keeping the KI% value and changing the FC% and FL% values. For hyperkyphosis, changes were mainly suggested compared to the given feature values for KI% and FC%, and only in three cases for FL%.
The exemplary CF results are in line with the global feature changes for inverting the class membership of the subjects with hyperkyphosis and hyperlordosis (see Figure 1, middle plots). On a statistical basis, for hyperlordosis, the greatest changes were observed for FL%, followed by KI%. For hyperkyphosis, statistically significant changes were present in descending effect size for FC%, KI%, and FL%. However, the changes for FL% were small and with p = 0.05 at the alpha-level threshold.
The global results for the CFs inverting the class labels in the presence of hyperlordosis and hyperkyphosis are presented and compared with the original feature values of the healthy subjects in Figure 2 (lower plots). Visually, for both hyperlordosis and hyperkyphosis, differing distributions could be observed; however, only small differences were observed in the median values. A statistical comparison by means of a Mann–Whitney U test showed that the CFs did not differ from the healthy group characteristics for all regarded features of the hyperlordosis class. However, for the CFs of the hyperkyphosis class, the feature FL% differed from the healthy group characteristics, but with a small effect size according to Cohen [45]. No further differences were found for hyperkyphosis.

4. Discussion

The present results show that it is possible to classify the presence of hyperlordosis or hyperkyphosis based on postural data measured using stereophotogrammetry by means of ML. The use of confident learning to show possible class label errors in the test set, and the re-evaluation and correction of the respective cases by experts, showed that the original labels of the test data were partially incorrect. After correcting the class labels for both hyperlordosis and hyperkyphosis, the best mean PRAUC value of 0.97 was achieved. The erroneous test labels, therefore, led to the actual performance of the model being underestimated.
In the present case of the ML-based classification of hyperlordosis and hyperkyphosis, around 10% of the test labels were incorrect. In particular, when the datasets were not labeled by combining the expert judgments of several people, as was also the case in the present dataset, the described approach could help to identify errors in the existing data without having to check all the data samples again, which is, in many cases, not feasible for economic reasons. Although the results highlight the benefits of using confident learning to identify potentially mislabeled test set labels, no performance benefits were found when using confident learning for model training with partially mislabeled training data.
Since feature extraction is an important step to improve the accuracy of a model, avoid overfitting, reduce the computing power, and improve the interpretability [46], a reduction in the number of suitable features should be aimed for. With regards to the interpretability, especially in relation to previous research and existing knowledge, expert-based features, which are common in practice and reported in the literature, proved to be superior [25,35]. The results with selected, interpretable, and practice-relevant features led to improved classification results in the study compared to the use of all available features. Nevertheless, in this context, a possible a priori loss of information due to feature selection should be critically discussed, which is particularly related to non-data-based selections [1]. However, the potential a priori loss of information through expert-based feature construction and selection appears to be low overall, since the selected features achieved improved classification results compared to the use of available features as the model input. Therefore, it can be assumed that the present expert-based feature set is highly suitable and superior to the use of the whole set of available features.
According to [32], the criteria for good CFs include the following: (a) a CF with the predefined class prediction can be generated; (b) a CF should be close to the instance in terms of the feature values and it should change as few features as possible; (c) several different CFs should be provided; and (d) a CF should have probable or realistic characteristic values. For evaluation, these aspects are discussed below:
(a) In this study, ten different CFs could be found for each person. Consequently, the results showed that it was, in general, possible to find CFs for the specified task. (b) Considering the global feature changes, the CFs were relatively close to the original feature values, and a maximum of two features were dominantly varied per class. The changes appeared to be necessary to change the class membership, since healthy subjects and subjects with hyperkyphosis and hyperlordosis, according to the results of this study and other research [36], showed differences in their respective features. Accordingly, the analysis of the exemplary local CFs also showed that these were relatively close to the original characteristic values and that individual characteristic changes predominated. Overall, this corresponds to the criterion mentioned.
In the present study, the proximity and diversity were set to the default values of scikit-learn. Depending on the area of application, further tuning of the parameters can be useful. For example, increasing the proximity weight might result in features that are closer to the original query instance and less diverse.
(c) Ten different CFs were given for each instance, which again speaks to the fulfillment of the criterion. However, providing multiple solutions is both advantageous and disadvantageous. The question remains of how to find a reasonable, context-relevant, and meaningful explanation from all the explanations provided. A possible approach could be either the definition of context-specific external criteria to select the most appropriate CF or an expert-based selection based on prior knowledge and suitability for individual subject characteristics.
(d) Looking at the features that were globally modified to change the class prediction of subjects with postural deficits, it can be seen that differences between healthy subjects and subjects with hyperlordosis were mainly observable for the features KI% and FL%. Persons with hyperkyphosis differed from healthy persons by the features KI% and FC%. This is consistent with the differences reported in the literature for hyperkyphosis and hyperlordosis [47], as well as the statistical comparison of healthy subjects and the subjects with postural deficits in this study. The XAI interpretations thus appear plausible overall.
The results showed that the CFs, which changed the characteristics of the persons with postural deficits towards healthy persons with regard to the feature FL% for hyperkyphosis, did not agree with the feature values of the healthy group according to the Mann–Whitney U test. However, the small effect size did not appear to indicate a greater implausibility. No statistical differences were found for any of the other features, which in turn speaks to the general plausibility of the CFs.
On closer inspection, the distributions of the trait values did not match exactly, but the values of the CFs appeared to be closely related to the feature values in the distribution of the healthy subjects, and were, therefore, at least realistic. Thus, it seems likely that CFs can meaningfully shift the class affiliation of individuals with postural deficits based on the postural parameters used for healthy individuals and small possible feature changes. Since this is one of the first works in this field without sufficient comparative studies being available, it is necessary to further evaluate these findings with future studies. Furthermore, the optimization of the parameters proximity and diversity could also have the potential to better correspond with the actual characteristics of healthy people.
Based on [20], the black box problem (a) and the problem of labeling the data (b) can be characterized as central challenges when using AI with biomechanical data. In the present work, contributions were made to solving the problem in (a), which, in contrast to other methods from the XAI area, is particularly user-friendly, and the problem in (b) through label error detection. In the present study, CFs were used as an XAI tool for interpretation. However, it should be noted that it has not been analyzed intensively whether other XAI methods match with the results found for the CFs and, thus, support the local suggestions. In general, the agreement between different XAI methods and the XAI results of different classifiers is little addressed, whereas more or less strong variations of the XAI results are to be expected [26]. Therefore, future work should try to combine different XAI interpretation methods to generate more robust interpretations as an ensemble approach.
Although very good modeling results were obtained, there are several points to discuss that are related to the persistent modeling error and could help to further reduce it; e.g., the experimental design could be optimized to improve the class separation (development of an optimal experimental design). It should also be noted that logistic regression shows a reduced performance only in the classification of hyperkyphosis, and otherwise has a similar model performance to the Gaussian process classifier. Since logistic regression is itself a very interpretable approach, it may also be useful, depending on the area of application, to use logistic regression only for classification and to interpret the model directly, rather than generating CFs. Nevertheless, there are also promising results that have been reported for the use of logistic regression in combination with CFs [48].
For the evaluation, the current study compared the statistical characteristics of the characteristic feature values of healthy test persons with the CFs, which suggest what the characteristics for the test persons with hyperlordosis and hyperkyphosis should look like so that they can be classified as healthy. For the global analysis, the ten CFs of each person were aggregated to form a median, which might possibly eliminate the original relationships between the features. Consequently, for future works, another analysis that takes into account the relationships between the features could be the individual assessment of the local CFs by experts.
Another practical limitation is that the resulting models can only recognize characteristics for which they have been trained (here, hyperlordosis and hyperkyphosis) and are therefore pathology-dependent. Recently, interpretable, pathology-independent classifiers have been proposed to deal with this limitation [16,49]. Transferring the methodology of the present study to these classifiers could potentially create a powerful tool and could further increase the practical relevance of the ML methodology in biomechanical research.

5. Conclusions

As experts tend to show diverging results regarding the rating of human posture (e.g., see [17]), the proposed approach of combining confident learning with XAI using CFs might act as a data-driven, objective orientation for reducing inter-rater differences. In addition, class probabilities are provided that are superior to absolute class assignments for monitoring changes and that may be useful for monitoring therapy progress, e.g., by examining the shift in classification probabilities towards the class of healthy subjects. In the context of personalized medicine, the local interpretations of the proposed approach could be of great use for the individual adaptation of therapeutic measures, since they include further influencing factors (here, age and gender) as well as individual initial conditions. At the same time, the method used in this study could help in the development of apps that assess posture in an automated way.

Author Contributions

Conceptualization, C.D. and O.L.; methodology, C.D. and O.L.; software, C.D.; validation, C.D., O.L., S.S., and S.B.; formal analysis, C.D.; investigation, O.L.; resources, M.F.; data curation, C.D.; writing—original draft preparation, C.D., O.L., S.S., and S.B.; writing—review and editing, C.D., O.L., S.S., S.B., and M.F.; visualization, C.D.; supervision, M.F.; project administration, M.F.; funding acquisition, M.F. All authors have read and agreed to the published version of the manuscript.

Funding

This research received no external funding.

Institutional Review Board Statement

The study was conducted according to the guidelines of the Declaration of Helsinki, and approved by the Institutional Ethics Committee (Saarland University: UdS 15-6-08; RPTU: 23-57).

Informed Consent Statement

Informed consent was obtained from all subjects involved in the study.

Data Availability Statement

The data are available if there is justified research interest.

Conflicts of Interest

The authors declare no conflicts of interest. The funders had no role in the design of the study; in the collection, analyses, or interpretation of data; in the writing of the manuscript; or in the decision to publish the results.

References

  1. Dindorf, C.; Teufl, W.; Taetz, B.; Becker, S.; Bleser, G.; Fröhlich, M. Feature extraction and gait classification in hip replacement patients on the basis of kinematic waveform data. Biomedical Human Kinetics 2021, 13, 177–186. [Google Scholar] [CrossRef]
  2. Horst, F.; Lapuschkin, S.; Samek, W.; Müller, K.-R.; Schöllhorn, W.I. Explaining the unique nature of individual gait patterns with deep learning. Sci. Rep. 2019, 9, 1–13. [Google Scholar] [CrossRef] [PubMed]
  3. Phinyomark, A.; Petri, G.; Ibáñez-Marcelo, E.; Osis, S.T.; Ferber, R. Analysis of Big Data in Gait Biomechanics: Current Trends and Future Directions. J. Med. Biol. Eng. 2018, 38, 244–260. [Google Scholar] [CrossRef] [PubMed]
  4. Halilaj, E.; Rajagopal, A.; Fiterau, M.; Hicks, J.L.; Hastie, T.J.; Delp, S.L. Machine learning in human movement biomechanics: Best practices, common pitfalls, and new opportunities. J. Biomech. 2018, 81, 1–11. [Google Scholar] [CrossRef] [PubMed]
  5. Arnaout, R.; Curran, L.; Zhao, Y.; Levine, J.C.; Chinn, E.; Moon-Grady, A.J. An ensemble of neural networks provides expert-level prenatal detection of complex congenital heart disease. Nat. Med. 2021, 27, 882–891. [Google Scholar] [CrossRef] [PubMed]
  6. Hu, L.; Bell, D.; Antani, S.; Xue, Z.; Yu, K.; Horning, M.P.; Gachuhi, N.; Wilson, B.; Jaiswal, M.S.; Befano, B.; et al. An Observational Study of Deep Learning and Automated Evaluation of Cervical Images for Cancer Screening. J. Natl. Cancer Inst. 2019, 111, 923–932. [Google Scholar] [CrossRef] [PubMed]
  7. Luo, H.; Xu, G.; Li, C.; He, L.; Luo, L.; Wang, Z.; Jing, B.; Deng, Y.; Jin, Y.; Li, Y.; et al. Real-time artificial intelligence for detection of upper gastrointestinal cancer by endoscopy: a multicentre, case-control, diagnostic study. The Lancet Oncology 2019, 20, 1645–1654. [Google Scholar] [CrossRef]
  8. Lau, H.; Tong, K.; Zhu, H. Support vector machine for classification of walking conditions of persons after stroke with dropped foot. Hum. Mov. Sci. 2009, 28, 504–514. [Google Scholar] [CrossRef] [PubMed]
  9. Wahid, F.; Begg, R.K.; Hass, C.J.; Halgamuge, S.; Ackland, D.C. Classification of Parkinson’s Disease Gait Using Spatial-Temporal Gait Features. IEEE J. Biomed. Health Inform. 2015, 19, 1794–1802. [Google Scholar] [CrossRef]
  10. Mitchell, E.; Monaghan, D.; O’Connor, N.E. Classification of sporting activities using smartphone accelerometers. Sensors (Basel) 2013, 13, 5317–5337. [Google Scholar] [CrossRef]
  11. Begg, R.; Kamruzzaman, J. Neural networks for detection and classification of walking pattern changes due to ageing. Australas. Phys. Eng. Sci. Med. 2006, 29, 188–195. [Google Scholar] [CrossRef] [PubMed]
  12. Khodabandehloo, E.; Riboni, D.; Alimohammadi, A. HealthXAI: Collaborative and explainable AI for supporting early diagnosis of cognitive decline. Future Generation Computer Systems 2021, 116, 168–189. [Google Scholar] [CrossRef]
  13. Paulo, J.; Peixoto, P.; Nunes, U.J. ISR-AIWALKER: Robotic Walker for Intuitive and Safe Mobility Assistance and Gait Analysis. IEEE Trans. Human-Mach. Syst. 2017, 47, 1110–1122. [Google Scholar] [CrossRef]
  14. Laroche, D.; Tolambiya, A.; Morisset, C.; Maillefert, J.F.; French, R.M.; Ornetti, P.; Thomas, E. A classification study of kinematic gait trajectories in hip osteoarthritis. Comput. Biol. Med. 2014, 55, 42–48. [Google Scholar] [CrossRef] [PubMed]
  15. Teufl, W.; Taetz, B.; Miezal, M.; Lorenz, M.; Pietschmann, J.; Jöllenbeck, T.; Fröhlich, M.; Bleser, G. Towards an Inertial Sensor-Based Wearable Feedback System for Patients after Total Hip Arthroplasty: Validity and Applicability for Gait Classification with Gait Kinematics-Based Features. Sensors 2019, 19. [Google Scholar] [CrossRef]
  16. Dindorf, C.; Konradi, J.; Wolf, C.; Taetz, B.; Bleser, G.; Huthwelker, J.; Werthmann, F.; Bartaguiz, E.; Kniepert, J.; Drees, P.; et al. Classification and Automated Interpretation of Spinal Posture Data Using a Pathology-Independent Classifier and Explainable Artificial Intelligence (XAI). Sensors 2021, 21, 1–18. [Google Scholar] [CrossRef] [PubMed]
  17. Fedorak, C.; Ashworth, N.; Marshall, J.; Paull, H. Reliability of the visual assessment of cervical and lumbar lordosis: how good are we? Spine (Phila Pa. 1976) 2003, 28, 1857–1859. [Google Scholar] [CrossRef] [PubMed]
  18. Moreira, R.; Teles, A.; Fialho, R.; Baluz, R.; Santos, T.C.; Goulart-Filho, R.; Rocha, L.; Silva, F.J.; Gupta, N.; Bastos, V.H.; et al. Mobile Applications for Assessing Human Posture: A Systematic Literature Review. Electronics 2020, 9, 1196. [Google Scholar] [CrossRef]
  19. Northcutt, C.G.; Athalye, A.; Mueller, J. Pervasive Label Errors in Test Sets Destabilize Machine Learning Benchmarks 2021.
  20. Northcutt, C.G.; Jiang, L.; Chuang, I.L. Confident Learning: Estimating Uncertainty in Dataset Labels 2021.
  21. Zhang, M.; Gao, J.; Lyu, Z.; Zhao, W.; Wang, Q.; Ding, W.; Wang, S.; Li, Z.; Cui, S. Characterizing Label Errors: Confident Learning for Noisy-Labeled Image Segmentation. In Medical image computing and computer assisted intervention -- MICCAI 2020: 23rd International Conference, Lima, Peru, October 4-8, 2020, Proceedings. Part I / Anne L. Martel, Purang Abolmaesumi, Danail Stoyanov, Diana Mateus, Maria A. Zuluaga, S. Kevin Zhou, Daniel Racoceanu, Leo Joskowicz (eds.); Martel, A., Abolmaesumi, P., Stoyanov, D., Mateus, D., Zuluaga, M.A., Zhou, S.K., Racoceanu, D., Joskowicz, L., Eds.; Springer: Cham, 2020; pp. 721–730. ISBN 978-3-030-59709-2. [Google Scholar]
  22. Northcutt, C.G.; Wu, T.; Chuang, I.L. Learning with Confident Examples: Rank Pruning for Robust Classification with Noisy Labels, 2017. Available online: https://arxiv.org/pdf/1705.01936.
  23. European Union. Regulation (EU) 2016/679 of the european parliament and of the council of 27 april 2016 on the protection of natural persons with regard to the processing of personal data and on the free movement of such data, and repealing directive 95/46/ec (General Data Protection Regulation). Official Journal of the European Union 2016, L 119, 1–88.
  24. Holzinger, A.; Biemann, C.; Pattichis, C.S.; Kell, D.B. What do we need to build explainable AI systems for the medical domain? Available online:. Available online: http://arxiv.org/pdf/1712.09923v1 (accessed on 20 February 2020).
  25. Dindorf, C.; Teufl, W.; Taetz, B.; Bleser, G.; Fröhlich, M. Interpretability of Input Representations for Gait Classification in Patients after Total Hip Arthroplasty. Sensors 2020, 20, 1–14. [Google Scholar] [CrossRef]
  26. Horst, F.; Slijepcevic, D.; Lapuschkin, S.; Raberger, A.-M.; Zeppelzauer, M.; Samek, W.; Breiteneder, C.; Schöllhorn, W.I.; Horsak, B. On the Understanding and Interpretation of Machine Learning Predictions in Clinical Gait Analysis Using Explainable Artificial Intelligence. Available online: http://arxiv.org/pdf/1912a.07737v1 (accessed on 10 March 2020).
  27. Adadi, A.; Berrada, M. Peeking Inside the Black-Box: A Survey on Explainable Artificial Intelligence (XAI). IEEE Access 2018, 6, 52138–52160. [Google Scholar] [CrossRef]
  28. Ribeiro, M.T.; Singh, S.; Guestrin, C. Why Should I Trust You?: Explaining the Predictions of Any Classifier. In Proceedings of the 22nd ACM SIGKDD International Conference on Knowledge Discovery and Data Mining. KDD ’16: The 22nd ACM SIGKDD International Conference on Knowledge Discovery and Data Mining, San Francisco, 13-17.08. 2016; Krishnapuram, B., Shah, M., Smola, A., Aggarwal, C., Shen, D., Rastogi, R., Eds.; New York, 2016; pp 1135–1144.
  29. Lundberg, S.M.; Lee, S.-I. A Unified Approach to Interpreting Model Predictions. In 31st Conference on Neural Information Processing Systems (NIPS 2017); Curran Associates Inc.: Red Hook, NY, United States, 2017; pp. 1–10. [Google Scholar]
  30. Shrikumar, A.; Greenside, P.; Kundaje, A. Learning important features through propagating activation differences. In Proceedings of the 34th International Conference on Machine Learning; ICML: Sydney, Australia, 2017; pp. 3145–3153. [Google Scholar]
  31. Molnar, C. Interpretable Machine Learning: A Guide for Making Black Box Models Explainable; Leanpub: n.p., 2018. [Google Scholar]
  32. World Medical Association Declaration of Helsinki: ethical principles for medical research involving human subjects. JAMA 2013, 310, 2191–2194. [CrossRef] [PubMed]
  33. Kechagias, V.A.; Grivas, T.B.; Papagelopoulos, P.J.; Kontogeorgakos, V.A.; Vlasis, K. Truncal Changes in Patients Suffering Severe Hip or Knee Osteoarthritis: A Surface Topography Study. Clin Orthop Surg 2021, 13, 185. [Google Scholar] [CrossRef] [PubMed]
  34. Khallaf, M.E.; Fayed, E.E. Early postural changes in individuals with idiopathic Parkinson’s disease. Parkinsons. Dis. 2015, 2015, 369454. [Google Scholar] [CrossRef] [PubMed]
  35. Zytek, A.; Arnaldo, I.; Liu, D.; Berti-Equille, L.; Veeramachaneni, K. The Need for Interpretable Features: Motivation and Taxonomy, 2022. Available online: https://arxiv.org/pdf/2202.11748.
  36. Ludwig, O.; Dindorf, C.; Kelm, J.; Simon, S.; Nimmrichter, F.; Fröhlich, M. Reference Values for Sagittal Clinical Posture Assessment in People Aged 10 to 69 Years. Int. J. Environ. Res. Public Health 2023, 20. [Google Scholar] [CrossRef]
  37. Lemaitre, G.; Nogueira, F.; Aridas, C.K. Imbalanced-learn: A Python Toolbox to Tackle the Curse of Imbalanced Datasets in Machine Learning, 2016. Available online: https://arxiv.org/pdf/1609.06570.
  38. Buchanan, J.J.; Schneider, M.D.; Armstrong, R.E.; Muyskens, A.L.; Priest, B.W.; Dana, R.J. Gaussian Process Classification for Galaxy Blend Identification in LSST. ApJ 2022, 924, 94. [Google Scholar] [CrossRef]
  39. Desai, R.; Porob, P.; Rebelo, P.; Edla, D.R.; Bablani, A. EEG Data Classification for Mental State Analysis Using Wavelet Packet Transform and Gaussian Process Classifier. Wireless Pers Commun 2020, 115, 2149–2169. [Google Scholar] [CrossRef]
  40. Wang, B.; Wan, F.; Mak, P.U.; Mak, P.; Vai, M.I. EEG signals classification for brain computer interfaces based on Gaussian process classifier. In Information, Communications and Signal Processing, 2009. ICICS 2009. 7th International Conference on. Signal Processing (ICICS), Macau, China, 12/8/2009 - 12/10/2009; IEEE, 2009; pp 1–5, ISBN 978-1-4244-4656-8.
  41. Pedregosa, F.; Varoquaux, G.; Gramfort, A.; Michel, V.; Thirion, B.; Grisel, O.; Blondel, M.; Prettenhofer, P.; Weiss, R.; Dubourg, V.; et al. Scikit-learn: Machine Learning in Python. J. Mach. Learn. Res. 2011, 12, 2825–2830. [Google Scholar]
  42. Mothilal, R.K.; Sharma, A.; Tan, C. Diverse Counterfactual Explanations (DiCE) for ML: How to explain a machine learning model such that the explanation is truthful to the model and yet interpretable to people? Available online:. Available online: https://github.com/interpretml/DiCE (accessed on 2 June 2022).
  43. Hsieh, C.; Moreira, C.; Ouyang, C. DiCE4EL: Interpreting Process Predictions using a Milestone-Aware Counterfactual Approach. In 2021 3rd International Conference on Process Mining (ICPM). 2021 3rd International Conference on Process Mining (ICPM), Eindhoven, Netherlands, 10/31/2021 - 11/4/2021; IEEE, uuuu-uuuu; pp 88–95, ISBN 978-1-6654-3514-7.
  44. Jones, E.; Oliphant, T.; Peterson, P.; et al. SciPy: Open Source Scientific Tools for Python. Available online: http://www.scipy.org (accessed on 3 September 2019).
  45. Cohen, J. A power primer. Psychol. Bull. 1992, 112, 155–159. [Google Scholar] [CrossRef] [PubMed]
  46. Liu, H.; Yu, L. Toward Integrating Feature Selection Algorithms for Classification and Clustering. IEEE Transactions on Knowledge and Data Engineering 2005, 17, 491–502. [Google Scholar] [CrossRef]
  47. Patias, P.; Grivas, T.B.; Kaspiris, A.; Aggouris, C.; Drakoutos, E. A review of the trunk surface metrics used as Scoliosis and other deformities evaluation indices. Scoliosis 2010, 5, 12. [Google Scholar] [CrossRef]
  48. Grath, R.M.; Costabello, L.; van Chan; Sweeney, P.; Kamiab, F.; Shen, Z.; Lecue, F. Interpretable Credit Application Predictions With Counterfactual Explanations, 2018. Available online: https://arxiv.org/pdf/1811.05245.
  49. Teufl, W.; Taetz, B.; Miezal, M.; Dindorf, C.; Fröhlich, M.; Trinler, U.; Hogam, A.; Bleser, G. Automated detection of pathological gait patterns using a one-class support vector machine trained on discrete parameters of IMU based gait data. Clinical Biomechanics 2021, 89, 1–7. [Google Scholar] [CrossRef] [PubMed]
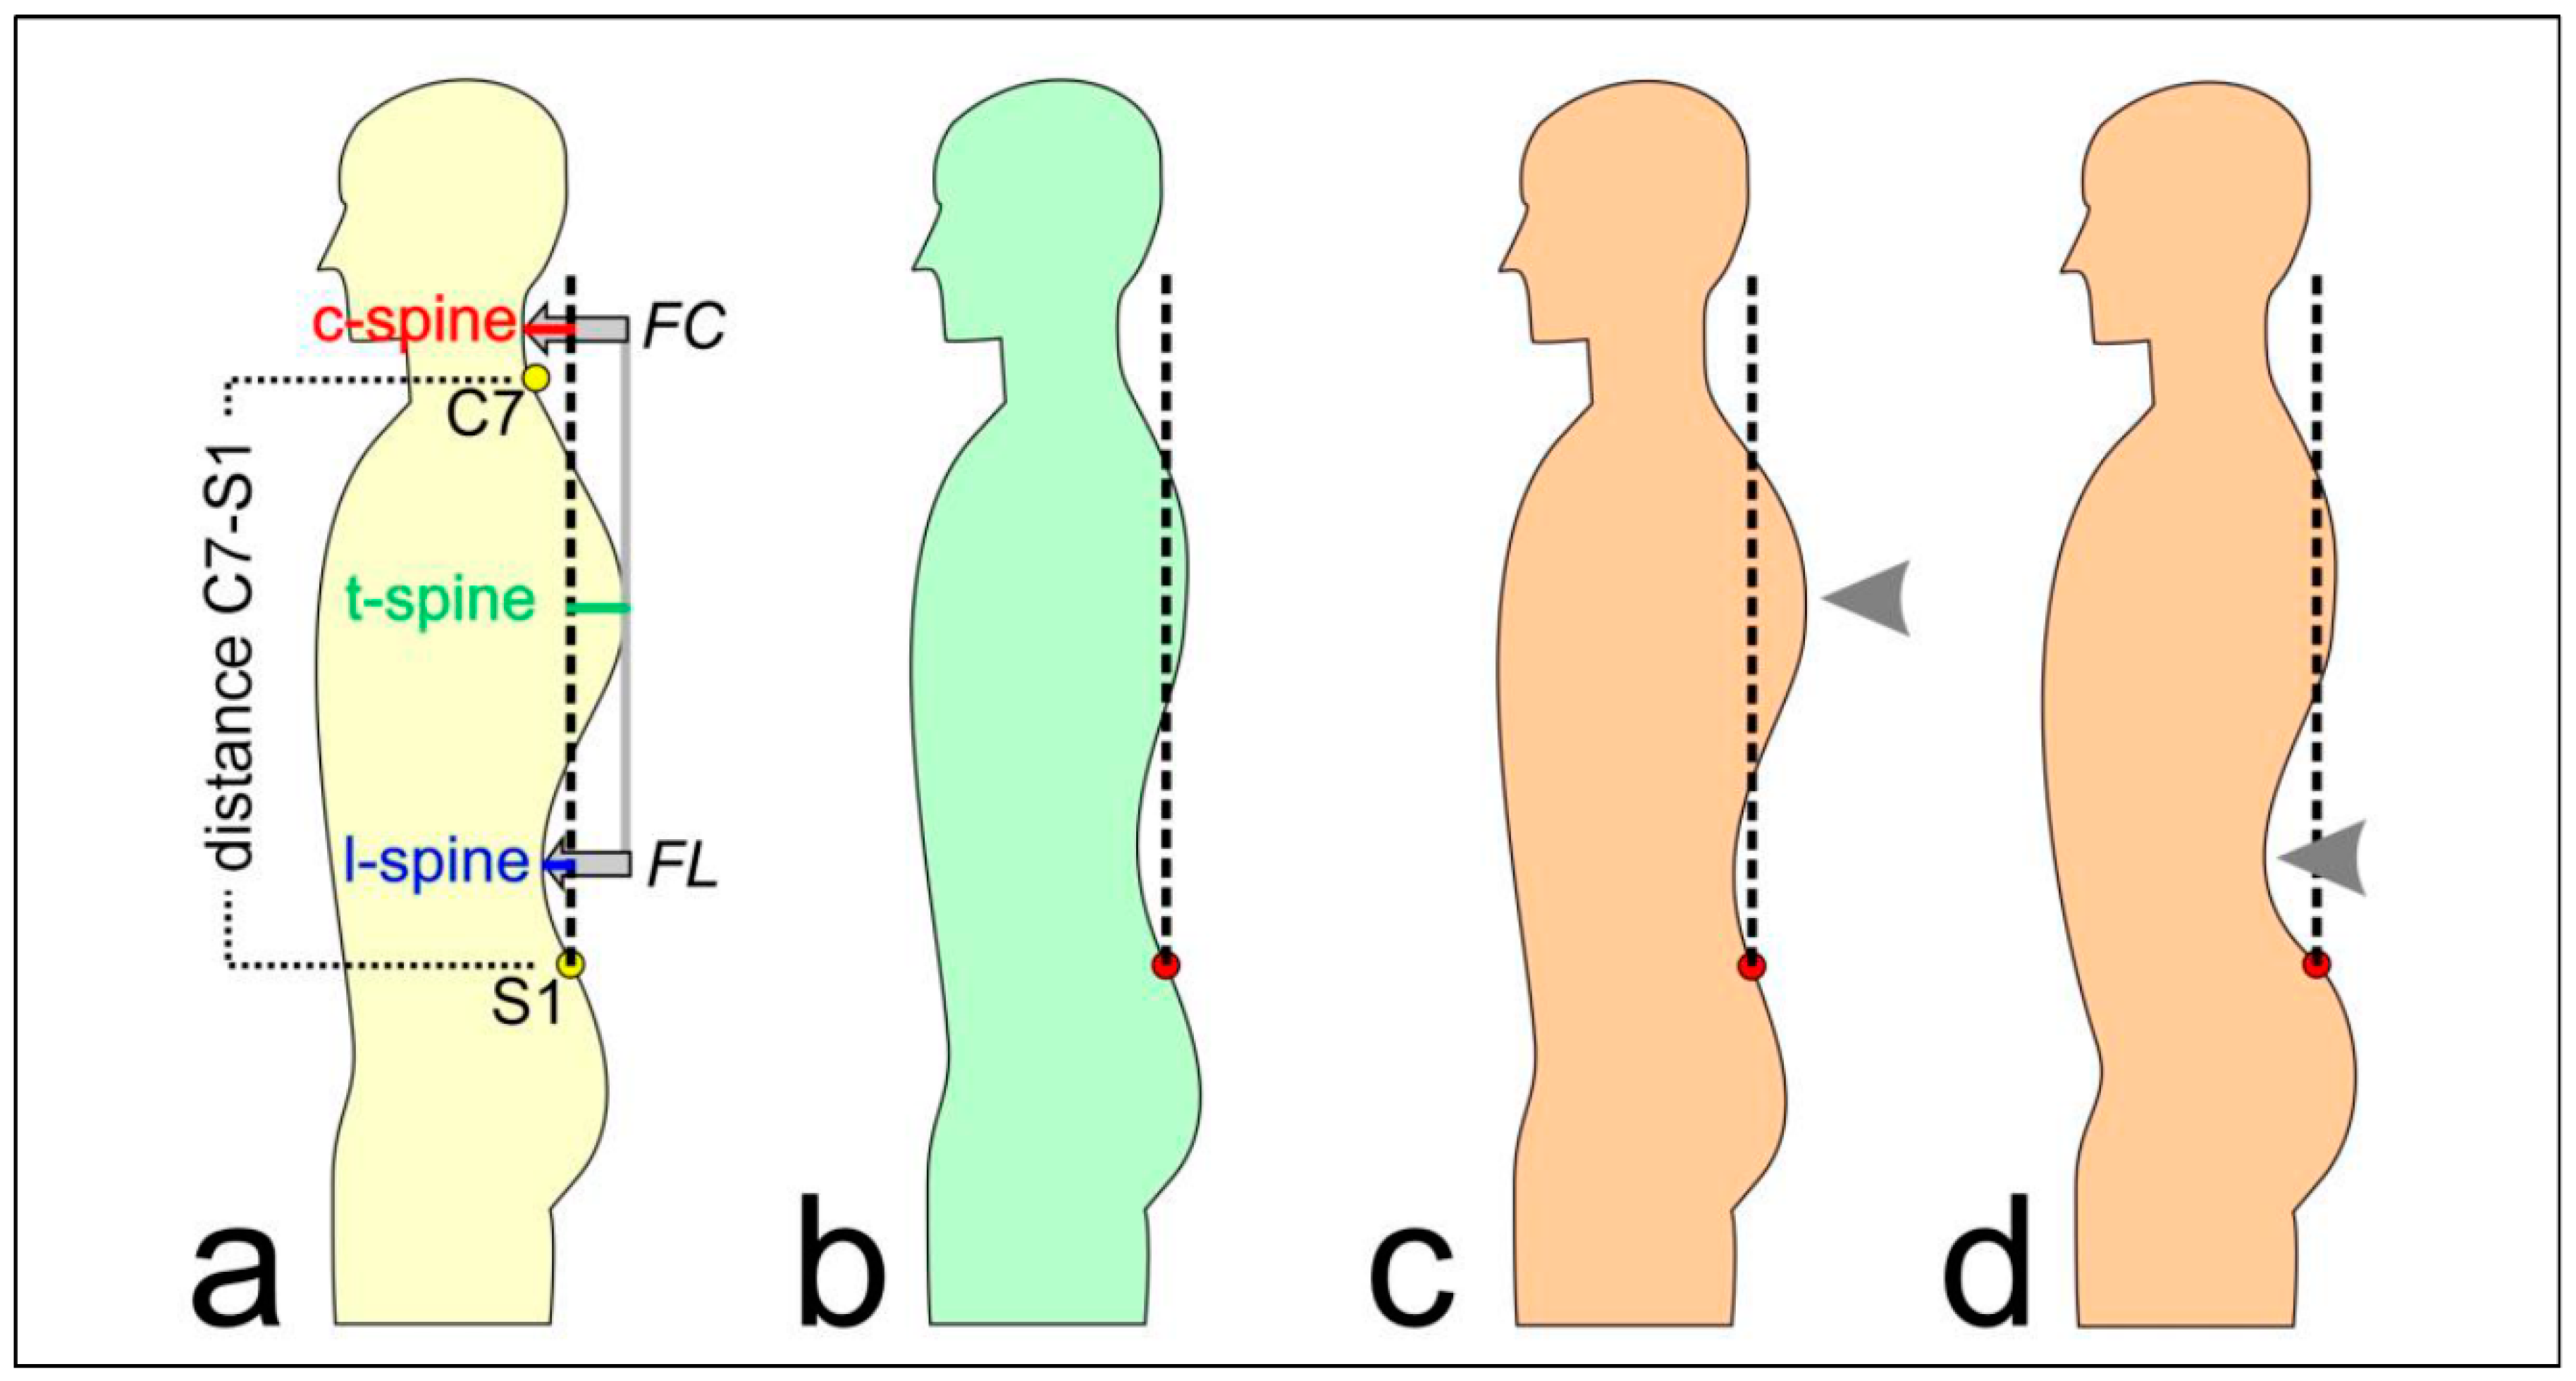
Figure 1. (a) Explanation of the analyzed posture parameters; C7: 7th cervical vertebrae, S1: 1st lumbar vertebrae, FC: flèche cervicale, and FL: flèche lombaire. (b) Normal posture; the dashed line represents the perpendicular axis through S1. (c) Increased thoracic kyphosis (hyperkyphosis, or "hunchback"). (d) Increased lumbar lordosis (hyperlordosis, or "hollow back"). Arrows mark the posture deviations in (c) and (d).
Preprints 70264 g001
Figure 2. Violin plots for the posture parameters. Dashed lines represent median and quartiles. Age and gender were not displayed as features since they were impossible to change. Blue = healthy subjects without postural deficits; orange = subjects with hyperkyphosis or hyperlordosis; green = global counterfactual explanations, suggesting necessary feature changes for the subjects with the postural deficits to be classified as healthy subjects by means of the ML algorithm.
Preprints 70264 g002

Hyperkyphosis Hyperlordosis
n % n %
Highlighted labels 130 11.31% 110 9.57%
Agreement of the first two reviewers 94 72.31% 89 80.91%
Labels additionally assessed by a third expert 36 27.69% 21 19.09%
Highlighted labels corrected 112 86.15% 98 89.09%
Figure 3. Precision–recall curves during 5-fold cross-validation (each curve represents results for test data of one cross-validation fold) as well as a separate confusion matrix for hyperkyphosis and hyperlordosis using confident learning and the corrected test labels. Lower row: 0 = healthy, 1 = postural deficit.
Preprints 70264 g003
Figure 4. Exemplary local counterfactual explanations (CFs) for a subject with hyperlordosis (left) and a subject with hyperkyphosis (right) when changing the class membership to the class of healthy subjects. Each dot per feature represents one out of ten suggested feature values. Red horizontal lines represent the original feature values mapping the postural deficits.
Preprints 70264 g004
Table 1. Measured and calculated features; also see Figure 1.
Type Feature Description
subject characteristics age in years
gender male/female
height body height in cm
weight body weight in kg
BMI weight/height²
directly measured by system distance C7-S1 vertical distance between the 7th cervical and the 1st sacral vertebrae in mm
c-spine horizontal distance between the apex of the cervical lordosis and the perpendicular axis through the 1st sacral vertebrae in mm
t-spine horizontal distance between the apex of the thoracal kyphosis and the perpendicular axis through the 1st sacral vertebrae in mm
l-spine horizontal distance between the apex of the lumbar lordosis and the perpendicular axis through the 1st sacral vertebrae in mm
calculated features KI (FC-FL)/2
FC abs(c-spine - t-spine)
FL abs(l-spine - t-spine)
normalized features KI% KI*100/ distance C7-S1
FC% FC*100/ distance C7-S1
FL% FL*100/ distance C7-S1
Table 2. The results of the re-evaluation of the flagged labels, separated for the classification of hyperkyphosis and hyperlordosis, for the 1149 subjects of all cross-validation folds.
Hyperkyphosis Hyperlordosis
n % n %
Highlighted labels 130 11.31% 110 9.57%
Agreement of the first two reviewers 94 72.31% 89 80.91%
Labels additionally assessed by a third expert 36 27.69% 21 19.09%
Highlighted labels corrected 112 86.15% 98 89.09%
Table 3. Classification results using the original data as well as confident learning and corrected test labels. Note: corrected labels were not used for model training. MPRAUC = mean area under the precision–recall curve; MF1 = mean F1 score; MMCC = mean Matthews correlation coefficient.
Hyperkyphosis Hyperlordosis
Test performance (on given test labels) using Gaussian process classifier MPRAUC 0.80 ± 0.06 0.84 ± 0.05
MF1 0.78 ± 0.03 0.77 ± 0.03
MMCC 0.64 ± 0.05 0.63 ± 0.05
Test performance (on corrected test labels) using Gaussian process classifier MPRAUC 0.97 ± 0.01 0.97 ± 0.01
MF1 0.90 ± 0.03 0.88 ± 0.04
MMCC 0.85 ± 0.05 0.82 ± 0.06
Test performance (on given test labels) using Gaussian process classifier
(+ confident learning on training data)
MPRAUC 0.78 ± 0.06 0.83 ± 0.04
MF1 0.76 ± 0.04 0.77 ± 0.03
MMCC 0.61 ± 0.05 0.64 ± 0.05
Test performance (on corrected test labels) using Gaussian process classifier
(+ confident learning on training data)
MPRAUC 0.97 ± 0.01 0.97 ± 0.02
MF1 0.89 ± 0.04 0.89 ± 0.03
MMCC 0.82 ± 0.06 0.82 ± 0.06
Disclaimer/Publisher’s Note: The statements, opinions and data contained in all publications are solely those of the individual author(s) and contributor(s) and not of MDPI and/or the editor(s). MDPI and/or the editor(s) disclaim responsibility for any injury to people or property resulting from any ideas, methods, instructions or products referred to in the content.
Copyright: This open access article is published under a Creative Commons CC BY 4.0 license, which permit the free download, distribution, and reuse, provided that the author and preprint are cited in any reuse.
Prerpints.org logo

Preprints.org is a free preprint server supported by MDPI in Basel, Switzerland.

Subscribe

© 2024 MDPI (Basel, Switzerland) unless otherwise stated