1. Introduction
The fate of e-wastes is a growing concern of approximately 54 million tonnes per annum worldwide [
1], which is estimated to double by 2050 [
2]. The valorization of these materials is worth
$64 billion but less than half of e-waste plastics are recycled globally [
3,
4]. The Basel Convention on the control of transboundary movements of hazardous wastes limits the cooperation between countries to handle e-waste [
5].Furthermore, the rate is likely to decline as major processing countries are progressively banning importation of plastic wastes [
6]. Therefore, since the modest global recycling efforts underway are crushed, there is a need for decentralized and highly specialized plastic recycling sites (also known as microfactories) that also reduce the transport costs [
4,
7]. E-waste plastics occupy large space on the premises of the recycling companies and the process of identification and sorting is challenging owing to the wide range of polymer mixtures that are used to get the desired properties [
8]. The primary or secondary recycling capabilities using mechanical separation by reading the Resin Identification Code (RIC), which is indented in the e-waste plastics [
8,
9], avoids the loss of functionalities of the polymers, hence these technologies are preferred to other types of upgradation methods. In this way the recycled materials can be used for the same or similar purposes as the original product [
4]. Although tertiary and quaternary recyclings are less cost-effective, these technologies are applied to deal with complex mixtures of polymers, when the mechanical separation is not sufficient [
10]. However, a combination of these technologies (i.e. tertiary chemical treatment with quaternary energy production) can be used to improve techno-economically the performance of the downstream process. For example, removal of brominated flame retardants (BFR) by solvent extraction to enhance the thermal decomposition and mass loss in a subsequent pyrolysis step [
10,
11]. It should be noted that some type of BFR can be in concentrations up to 30% by weight, which means that 1 kg of polymer would contain 50 – 300 g of flame retardant [
12]. On the other hand, the solvent extraction of the BFR might not be convenient for optimizing the downstream processing of primary or secondary mechanically separated polymers. For example, in the manufacturing of different plastic components of the casing of electrical devices the melt-blend extrusion is carried out at temperatures at slightly greater than the melting point. Since the effect of flame retardants can be noticeable even at temperature closed to the glass transition, the presence of these additives might avoid the mass loss of the polymer that is being extruded and, importantly, the emission of pollutants of the ABS [
13].
With these notions in mind, the design of a microfactory for recycling e-waste plastics primarily composed of acrylonitrile-butadiene-styrene copolymer (ABS), polycarbonate (PC), and polypropylene (PP) was investigated in the present article, because they were found to be very abundant in a recycling site in the UK. The ABS and the PC are the main components in telephone handsets, keyboards, monitors, and computer housing, while the PP is widely employed for the manufacturing of boxes and casings. The research objectives were: (a) to find out synergistic approaches of combining these materials, (b) to define the specifications of the equipment required for the processing, and (c) to identify the best component that can be replicated as the best route for the valorization of the e-waste plastic. Given the open-source license of recyclebots and their versatility [
9,
14], this type of equipment was considered suitable for the design of a valorization process and the scaleup to modest real conditions of the rate of handling e-waste plastics by medium-size recycling enterprises (~300 tonnes per annum). In this way, following the instructions of the manufacturer of the melt-blend extruder [
15,
16,
17,
18], virgin polymers were employed to initiate the melt-blend extrusion process and the share of the fresh materials was progressively decreased until the point of operating the equipment with 100 % e-waste plastic. Unlike the selection of the grades of the virgin material, which was based on its Melt-Flow Index (MFI), the different grades of the waste ABS were identified by the flow regime in the extruder and the color of the waste ABS (i.e. white or black). The valorization of the thermoplastics as 3D filaments for additive manufacturing was subsequently confirmed by printing a specimen, in agreement with the methodology of Arostegui et al. [
19], to increase the technology readiness level.
3. Discussion
If the recycled e-waste plastic is intended for the packaging of foodstuff, the removal of the BFR might be required due to their persistence in the environment and the risks that these chemicals pose to public health [
28]. According to the European Food Safety Authority [
28], the plastics containing BFR, whether in use or waste, leach these chemicals to the environment and contaminate air, soil, and water; hence, these pollutants may enter the food chain. The consolidated version of the Waste Electrical and Electronic Equipment (WEEE) Directive of the EU, implementing the decision 2018/2193 prescribes proper treatment for the plastics containing BFR (Article 8 and Annex VII) [
29]. On the other hand, the lobby of the bromine industry BSEF [
30] conducted an independent study to justify their products of BFR [
31], being supported by Sofies international B-Corp certified sustainability consulting firm [
32]. The problems of BFR are also known in the UK, although the charity Breast Cancer UK highlights that the organic flame retardants (including BFR, chlorinated flame retardants and organophosphorus flame retardants) are additive but they are not the most commonly used worldwide, unlike the aluminum hydroxide with 34 % of the market [
33]. Additionally, the Drinking Water Inspectorate confirmed the leachability of the BFR and identified those with high potential for occurrence in water sources in the UK [
34]. The UK Government [
35] requires an special application to stablish the microfactories for the e-waste plastics. Particularly, the Department for Environment, Food & Rural Affairs of the UK still considers the use of the Best Available Treatment, Recovery and Recycling Techniques for the removal of plastic containing BFR [
36]. Since the objective of removal is to ensure that BFR do not enter the material stream, unless the BFR are extracted it is not recommended the recycling of the plastics containing BFR [
36]. The XRF can be implemented as a quick technique to identify bromide in e-waste plastics, enabling the separation of plastics containing BFR prior to recycling, energy recovery or disposal [
37], otherwise the capacity of the current technologies for handling this materials will decrease [
10]. In the case of the polybromodiphenyl ethers, which are a large group of 209 different type of BFR with similar chemical structure, the UK Government has provided specific guidance on how to respond to chemical incidents [
38], as these compounds have particular potential to bioaccumulate in the environment [
39], being the liver and thyroid likely toxicity target [
40].
Given these limitations in the composition, a suitable application of the recycled filament was considering the manufacturing of hard drive caddies of different sizes. The different types of behavior of the e-waste plastics determine their suitability for different applications. The best combination to meet the mechanical specifications would be a blend of black ABS and PP with enough stiffness and flexibility. Since there are available in the market several grades of virgin polymers, the selection of the virgin material relied on the criteria of the melt-flow index (MFI) analysis. For example, for the ABS that is one of the polymers more widely used for 3D printing, the criteria was that the MFI should be around or below 10g/10min 210ºC/10kg (i.e. highly viscous materials). Materials with a MFI of 15g/10min 210ºC/10kg or greater are more suitable for recycling processes that include a molding-injection step rather than the melt-blend extrusion, due to the lower viscosity required [
17]. The MFI technique was not used for the characterization of the e-waste plastics but the difficulties in the operation of the melt-blend extrusion step are an indicator of the suitability of the different materials for this type of valorization process.
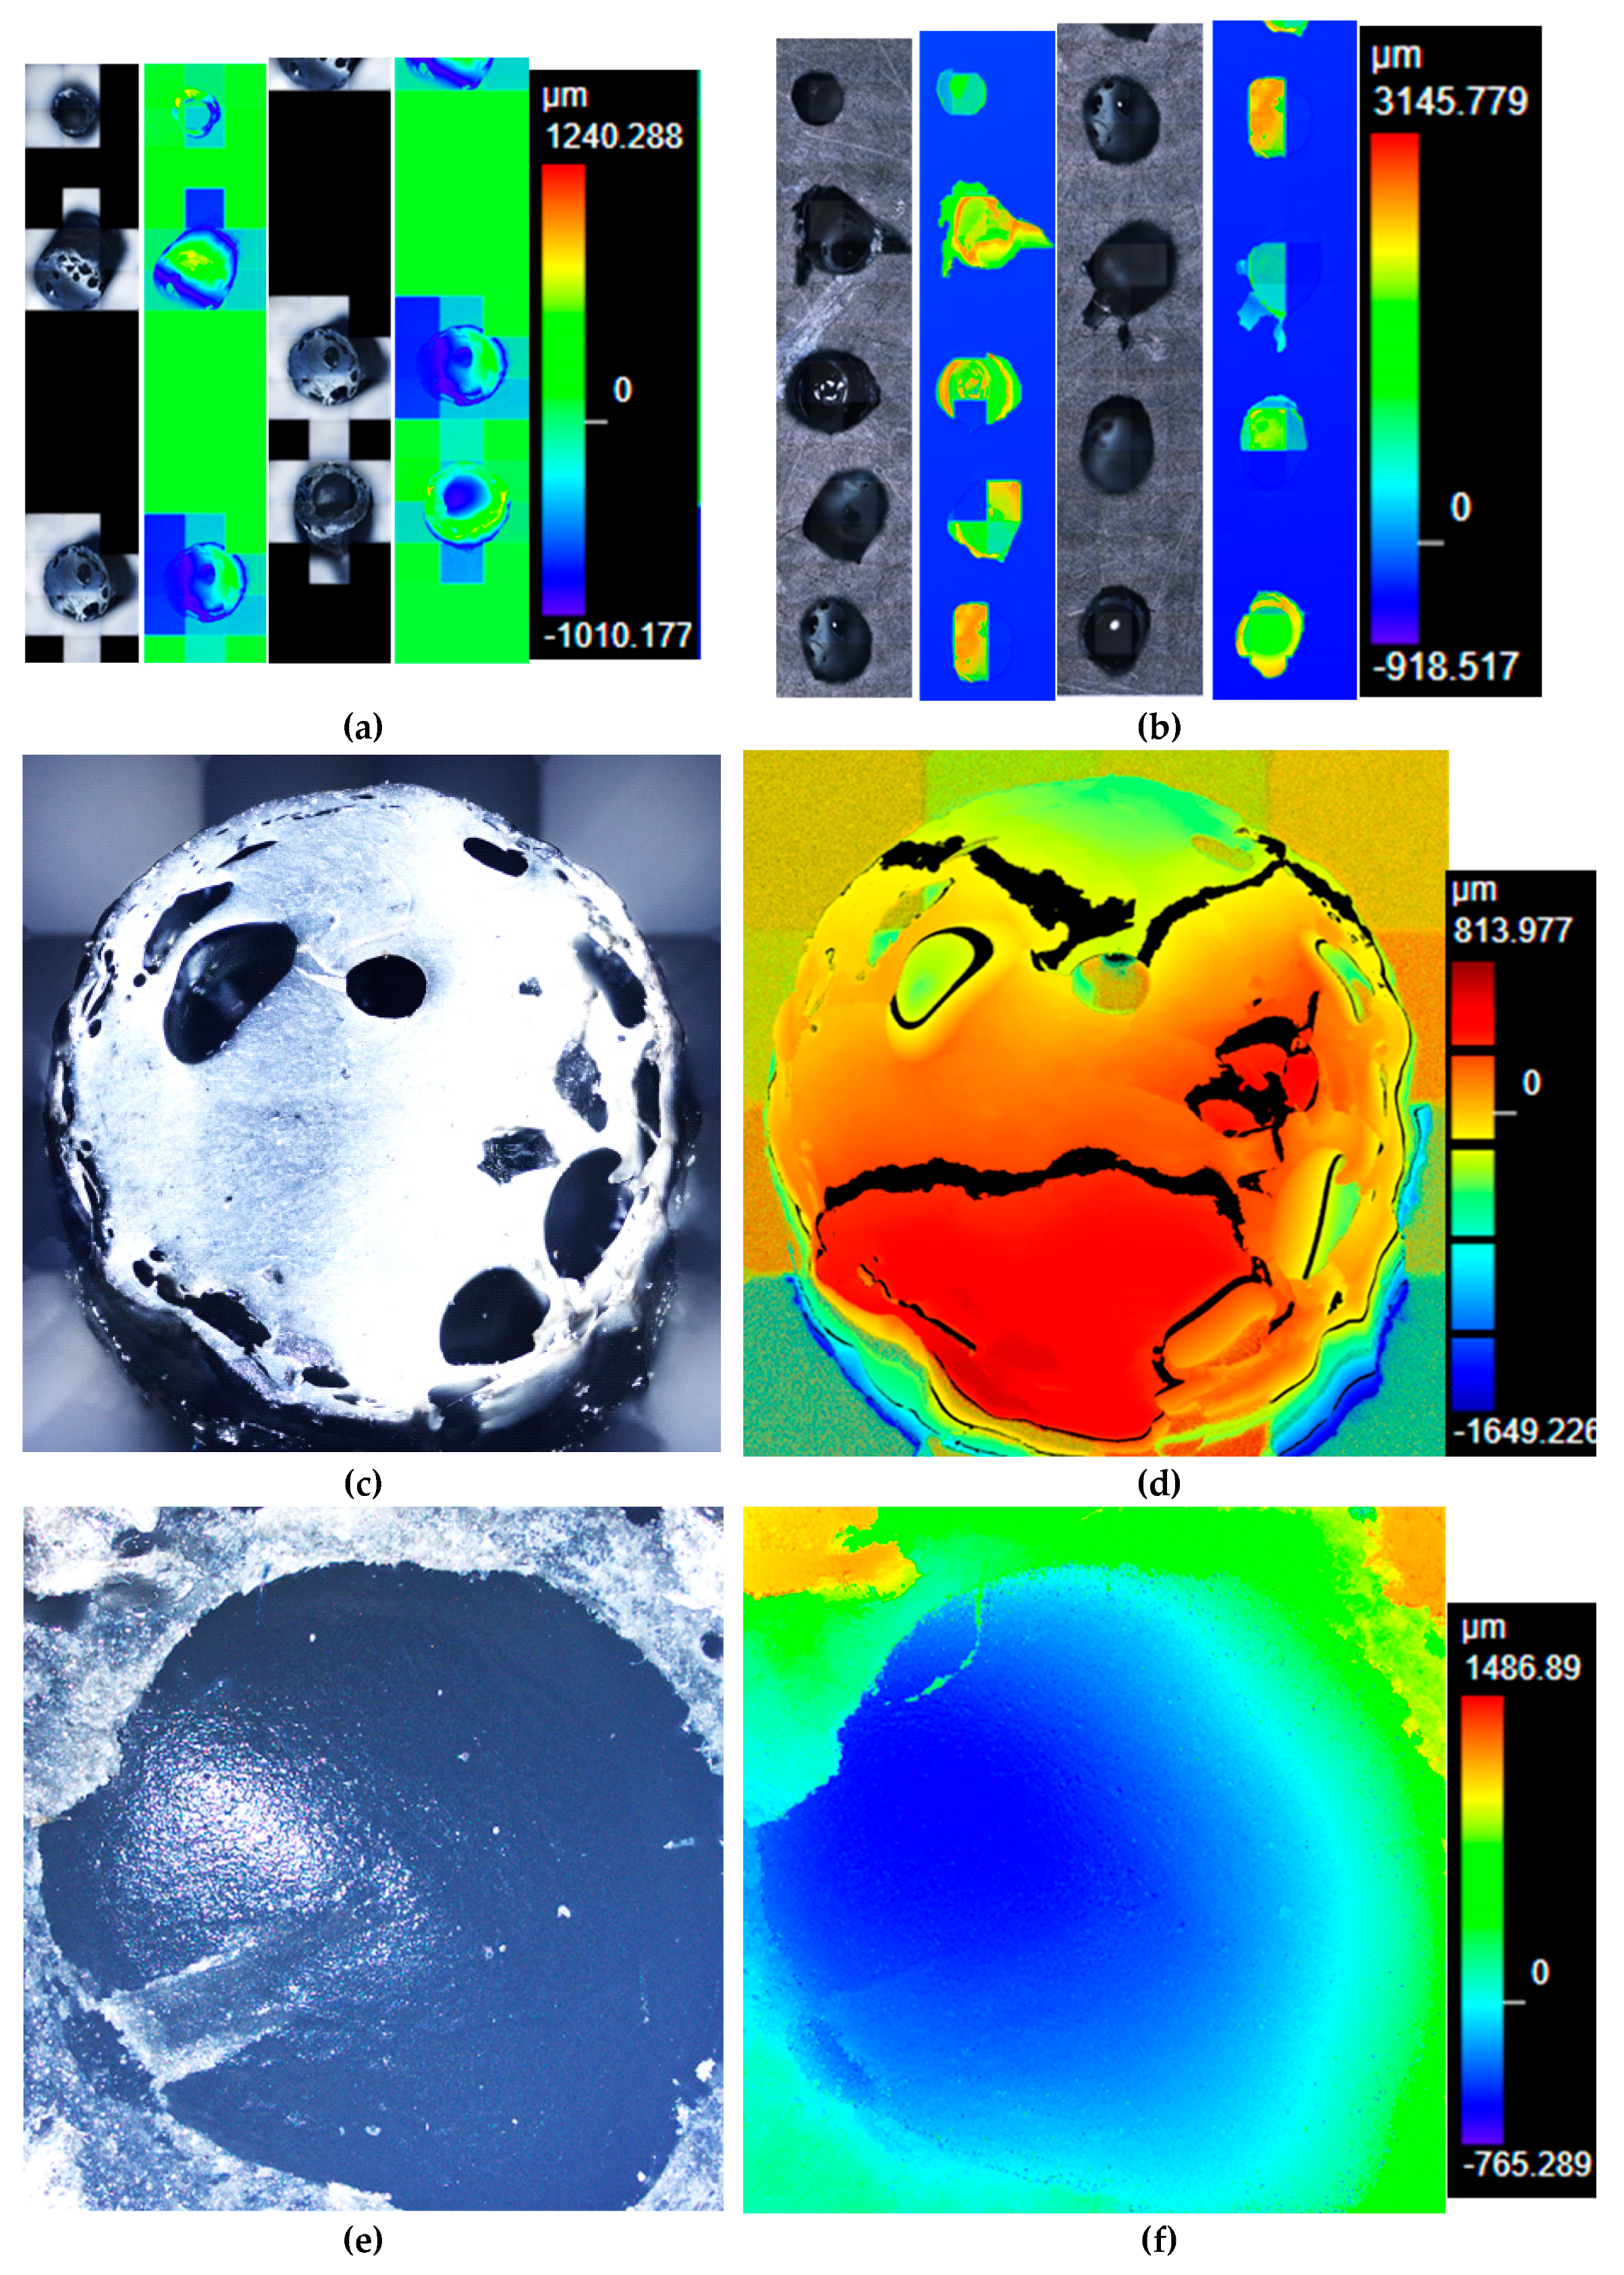
Figure 14a,b show several cross-sections of the clogging black ABS that was originated due to factors such as unmelted particles (
Figure 14c,d), high moisture content that prevents the proper flow of the material, or even metal particles (
Figure S45a) that accompanied the e-waste plastic and could only be unblocked with the Devoclean MidTemp purge (
Figure S45b).
Figure 14e,f show a filament with an unmelted core that went through the extrusion step due to the fusion of the outer layer, which upon cooling become a crust. As explained above, the valorization of the black ABS was done in 2 separate runs (
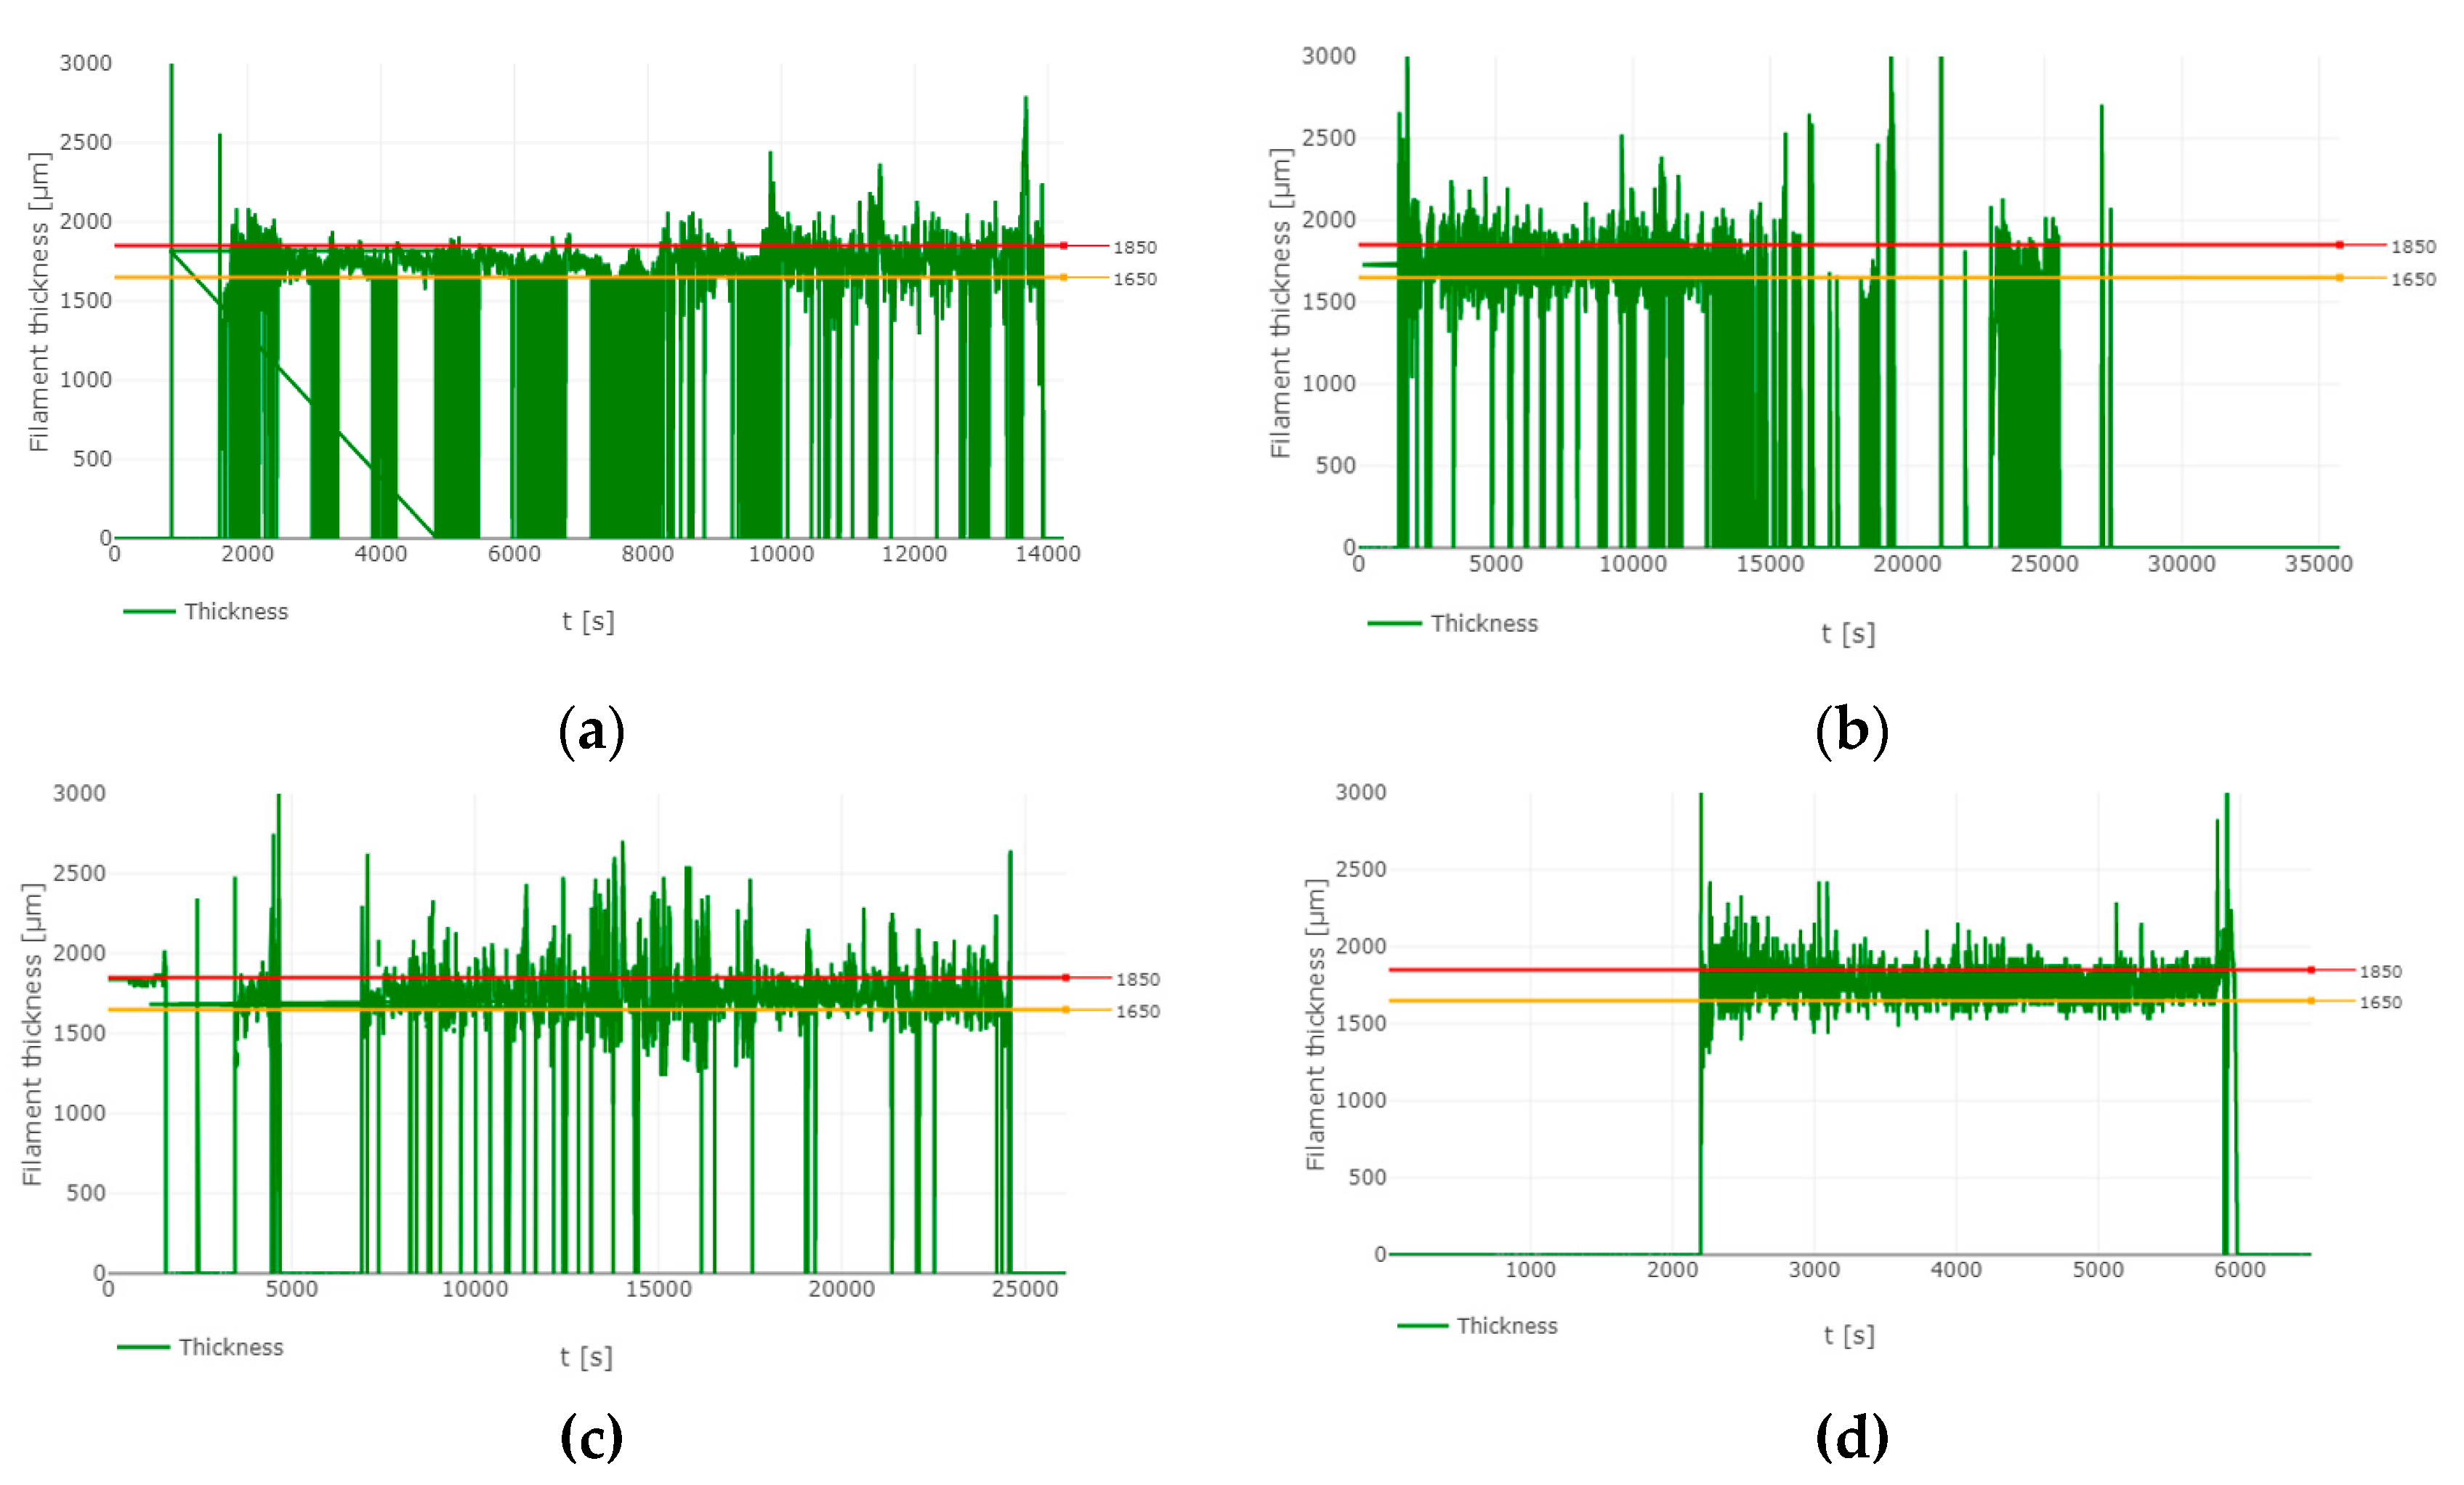
Figure 4a,b) due to this undesired clogging. In
Figure 7 all pictures were taken at the same magnification (x5) but the black ABS (
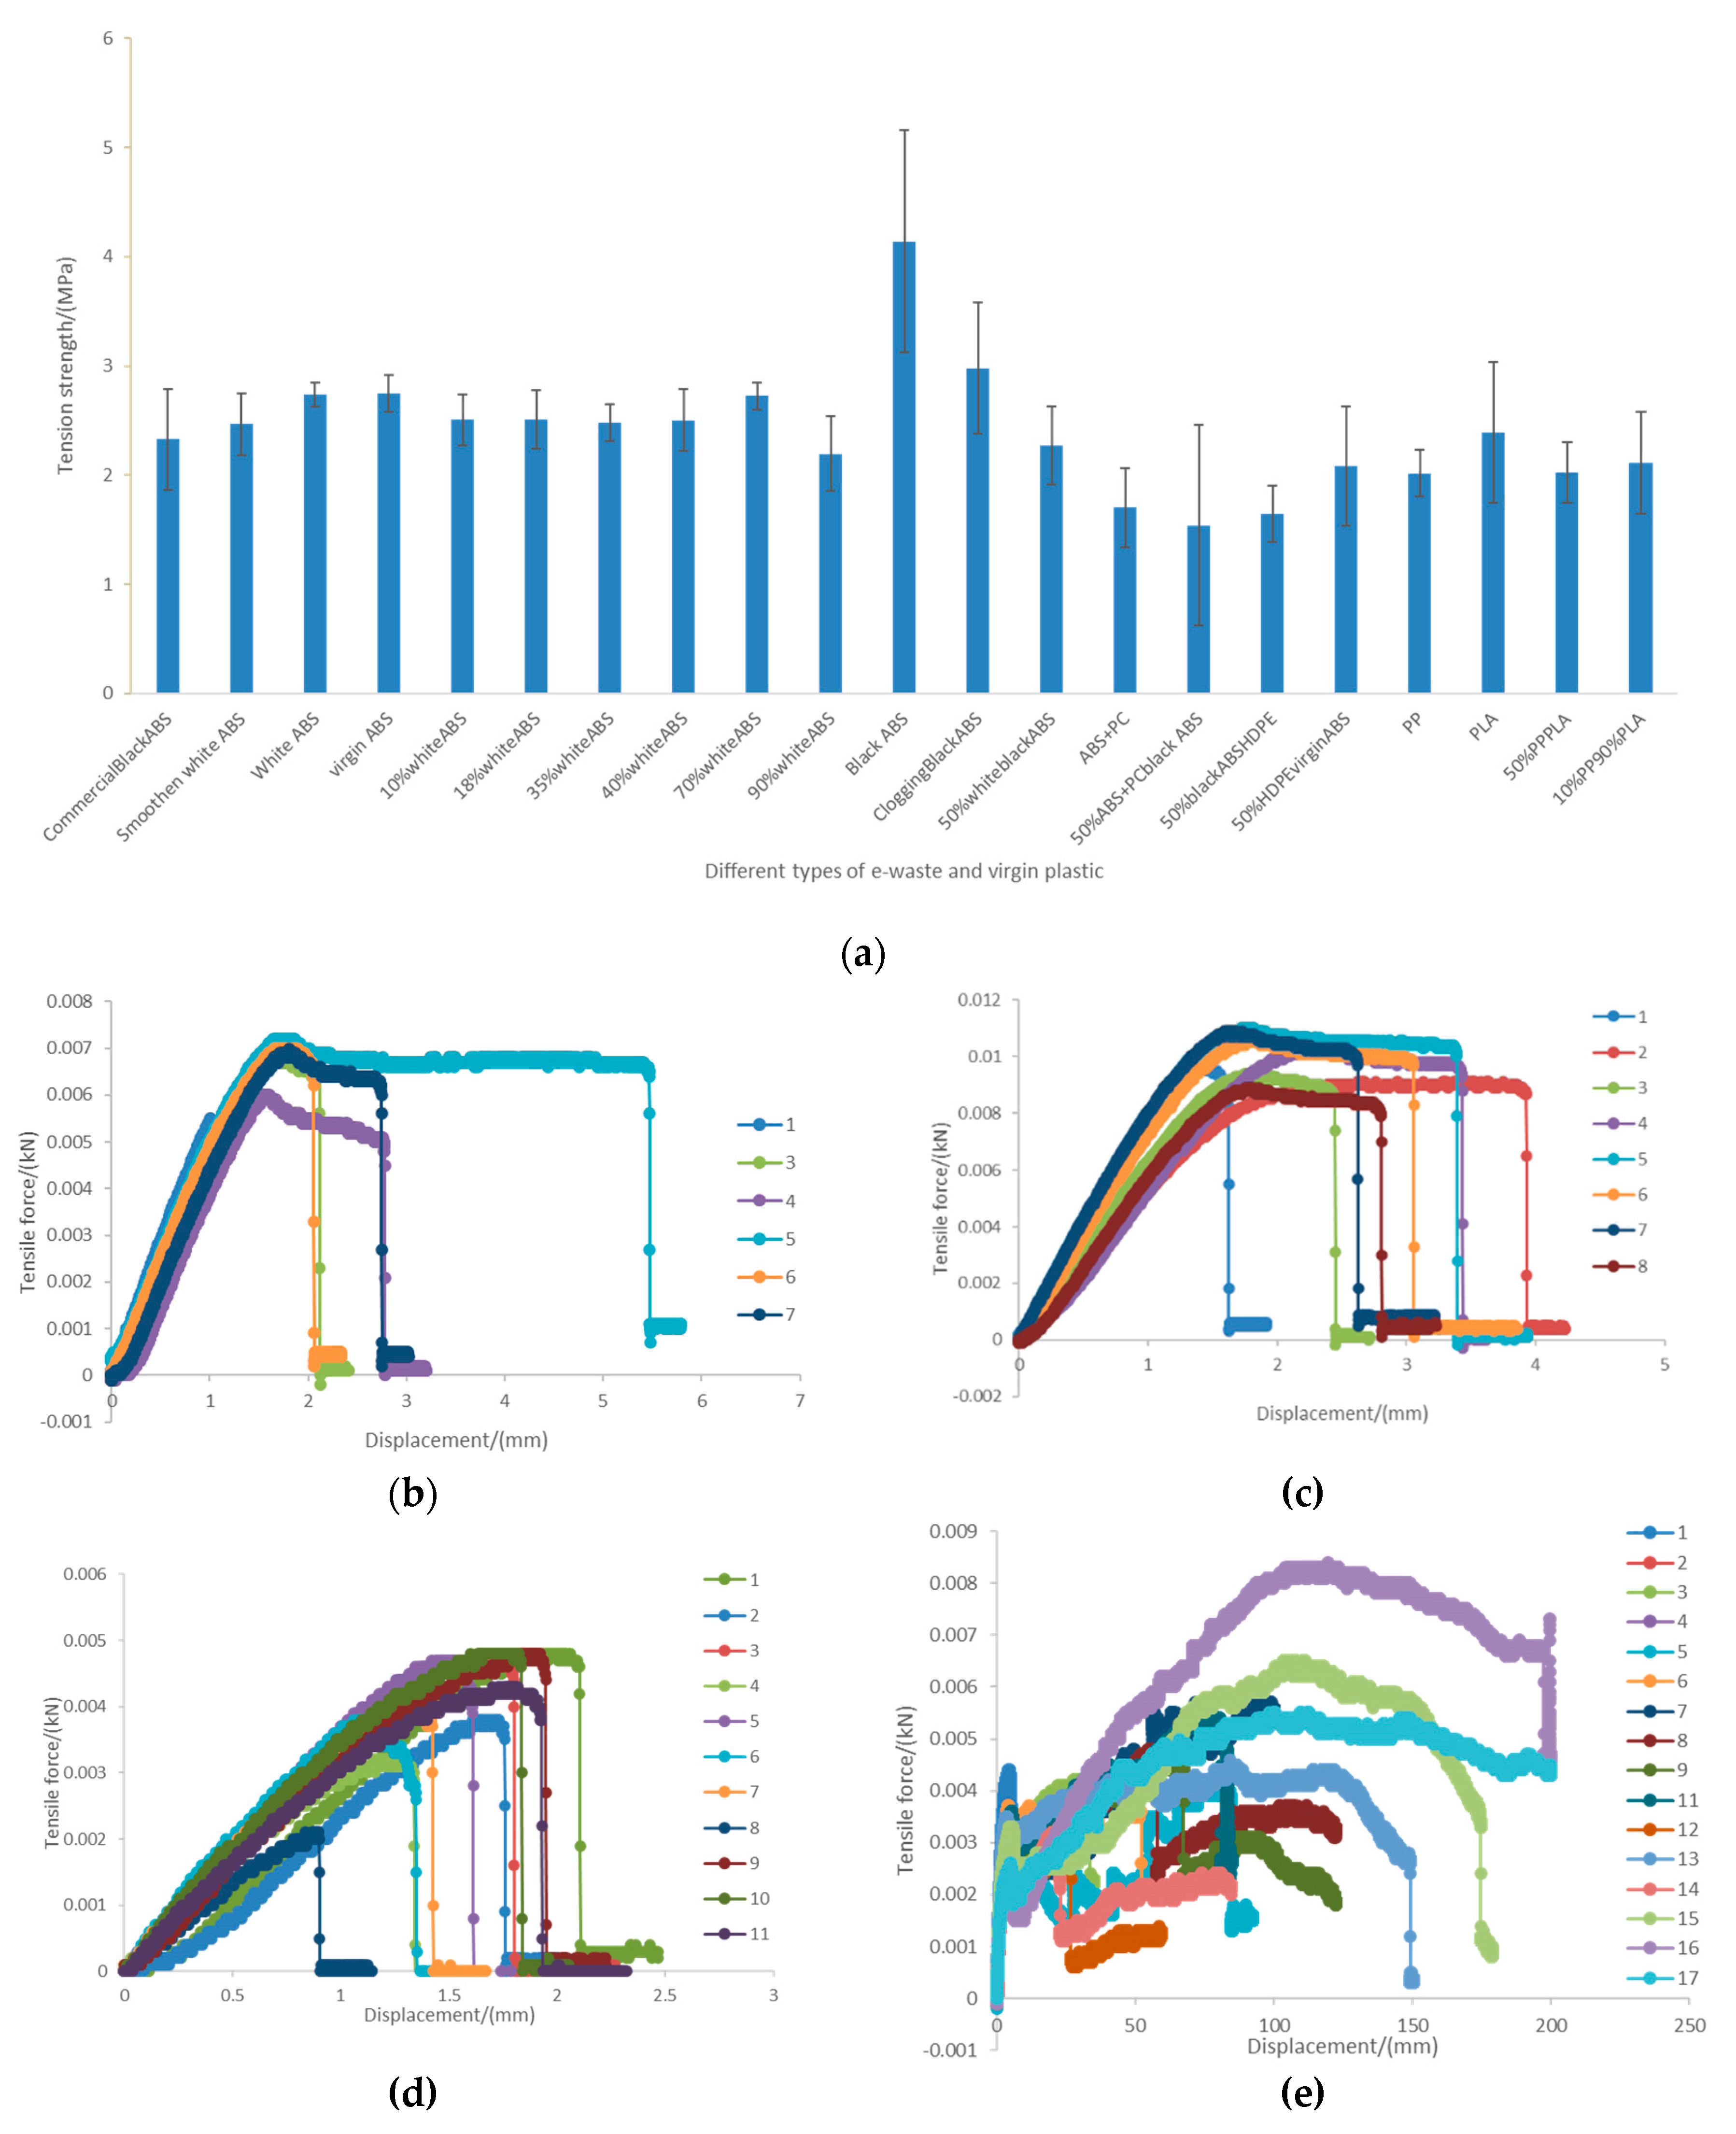
Figure 7d) can be clearly seen thicker than the other filaments. This could be an explanation for the significant greater tensile strength that was found for this material (
Figure 6a) and agrees with the greater viscosity of the black ABS.
Figure S46 offers the microscope pictures of the thickest filament prepared with the clogging black ABS, before it was necessary to introduce the Devoclean MidTemp purge to continue with the operation of the equipment. It is noteworthy to mention that a homogenous composition of the filament is essential and the tensile strength will not increase otherwise. For this reason, despite the greater thickness of the clogging ABS, the mechanical strength was not enhanced (
Figure 6a) since the filament was heterogeneous (
Figure S47).
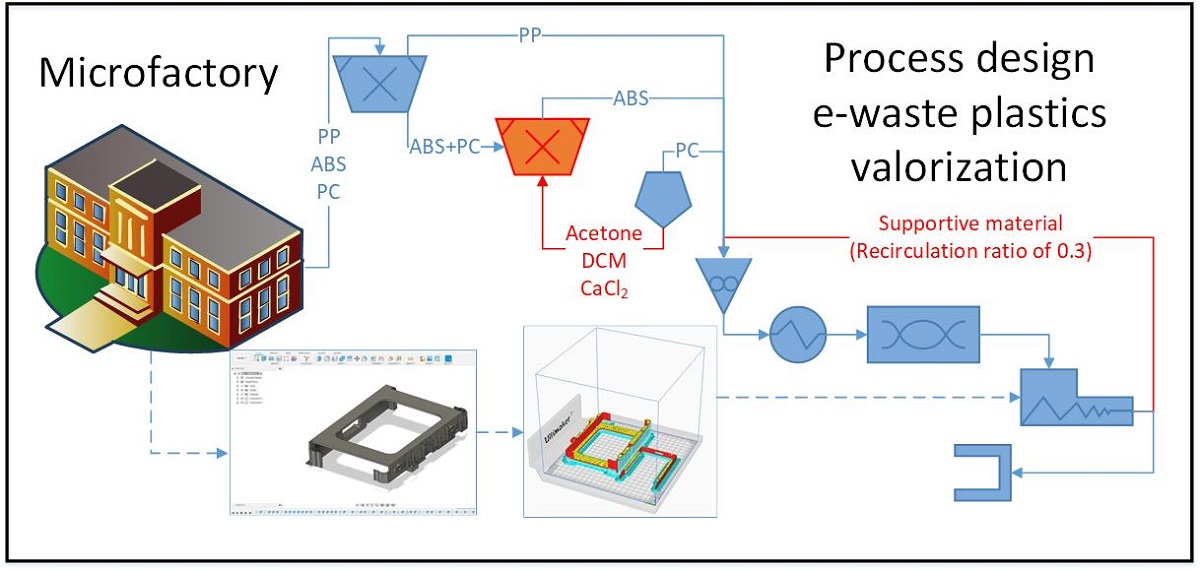
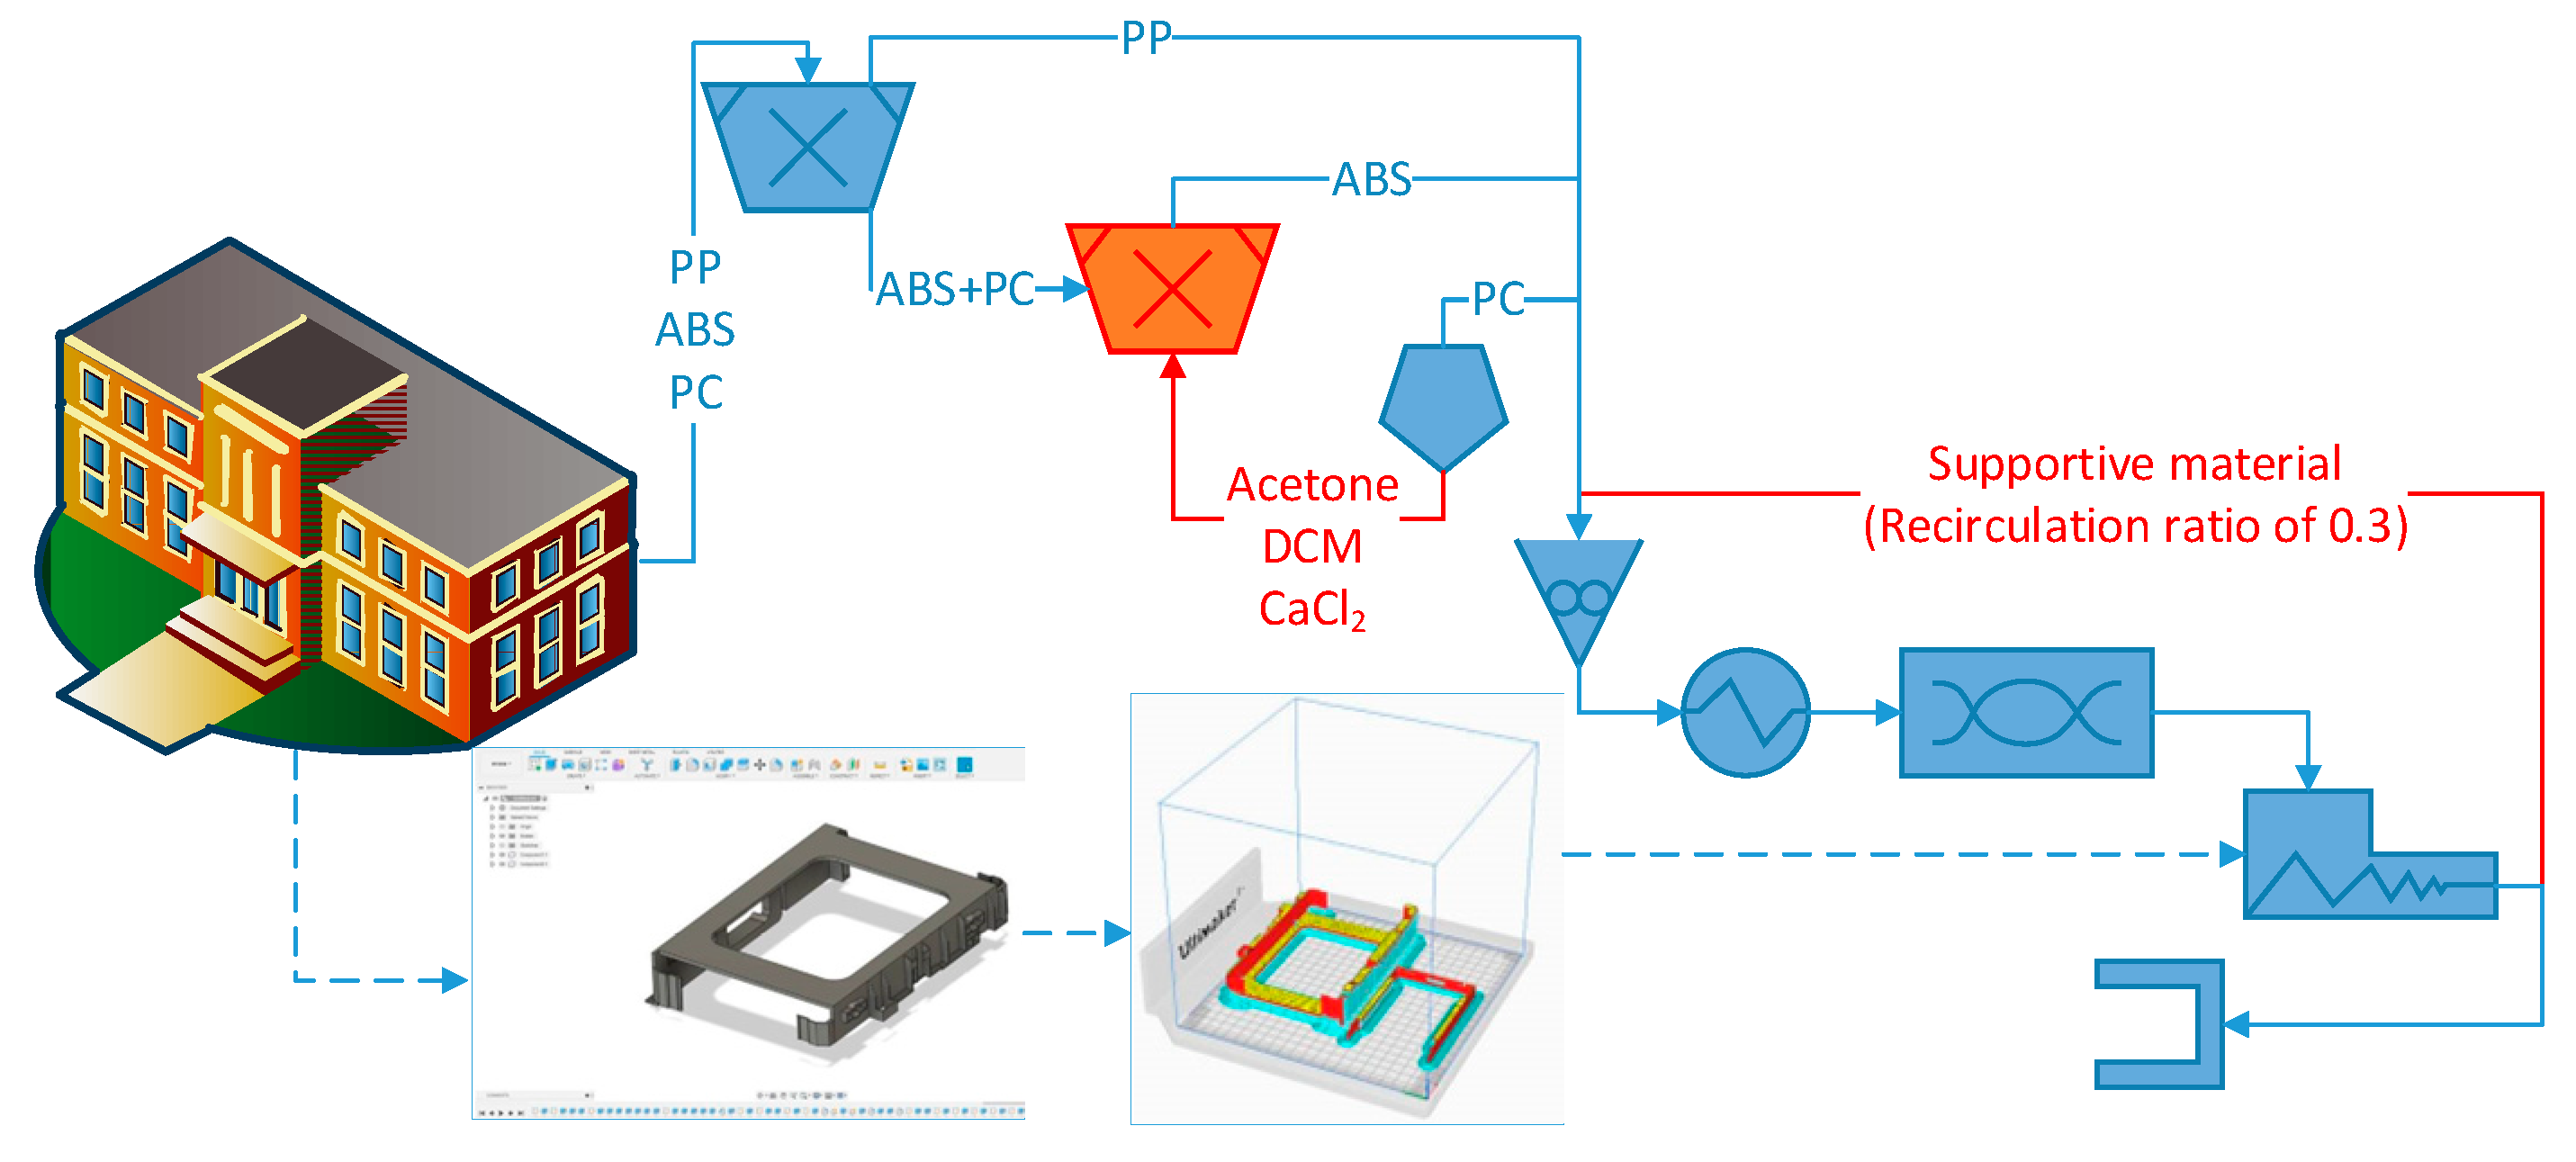
Figure 15 depicts the layout of the microfactory for the manufacturing of hard drive caddies made of e-waste plastic. As part of the float-sink operation [
7,
41], the first tank full of water allows the mechanical separation of the PP (0.85 – 0.95 g/cm
3) from the ABS (1.04 – 1.06 g/cm
3) and the PC (1.20 – 1.22 g/cm
3) [
7]. In order to be able to separate the ABS and the PC, it would be necessary to use a solvent, such as the DCM with a density of 1.33 g/mL and able to solubilize the PC [
27]. Taking into account the problem of using DCM for Health & Safety and the environmental pollution, the manipulation of the density of the water with a brine of CaCl
2 could be more feasible. However, for complex mixtures of e-waste plastics the use of solvents (tertiary recycling) might be the only way to attain the complete separation for the polymer before the melt blend extrusion [
4]. After this float-sink operation, the detection of additives and flame retardants will be possible with a portable handheld XRF equipment [
42]. The results of the present investigation were considered to implement a short contact time between acetone and the ABS. This extraction step would give the best results because avoids excessive degradation of the matrix while still removing the BFR. The quick extraction of the trace elements of the ABS agrees with the techno-economic assessment of contact times lower than 90 minutes and avoid the degradation of the less soluble rubbery-phase of butadiene [
19].
In the next step of shredding, it is necessary to ensure a particle size below 2 mm for the heat subsequently devoted for the melting of the e-waste plastic to be as efficient as possible. Once the recycled 3D filament has been produced, a key decision to make is the type of component that will be replicated by additive manufacturing (Figure 48). The optimization of the use of the recycled material can be done with the software UltiMaker Cura [
43], which informs how much
supporting material will be necessary to print the component (
Figure S48a). It is considered supported material all the recycled plastic that will be printed to maintain the parts of the component being replicated which deviates more than a 45º angle. In order to make this prediction, the only information that requires the software is the CAD file with the dimensions of the component that is going to be printed. For the hard drive caddies printed with ABS, 30 % of the recycled filament will be used as supportive material (
Figure S48b). A recirculation loop has been included in
Figure 15 to describe the mass flow of this supportive material that is removed from the printed component (
Figure S48c) which needs to be reprocessed. Those components that require a large amount of
supporting material when being printed might be more suitable for a microfactory including a molding injection step rather than the melt-blend extrusion. In case a visual element (e.g., screen frames of a laptop, mobile phone casings, etc.) would be printed, an additional downstream process step would need to be included in
Figure 15 for the acetone smoothing. This last step of upgrading the printed piece before reaching the end-user is a very simple technique in which the acetone vapors are forced to interact with the borders of ABS, by means of a fan promoting the turbulence in the closed environment. Thereby, the 2 main variables that needed to be consider for the successful design of the recycling process (
Figure S48d,e) were: the (chemical and mechanical) properties of the e-waste plastic and the structure of the component that is going to be replicated.
4. Materials and Methods
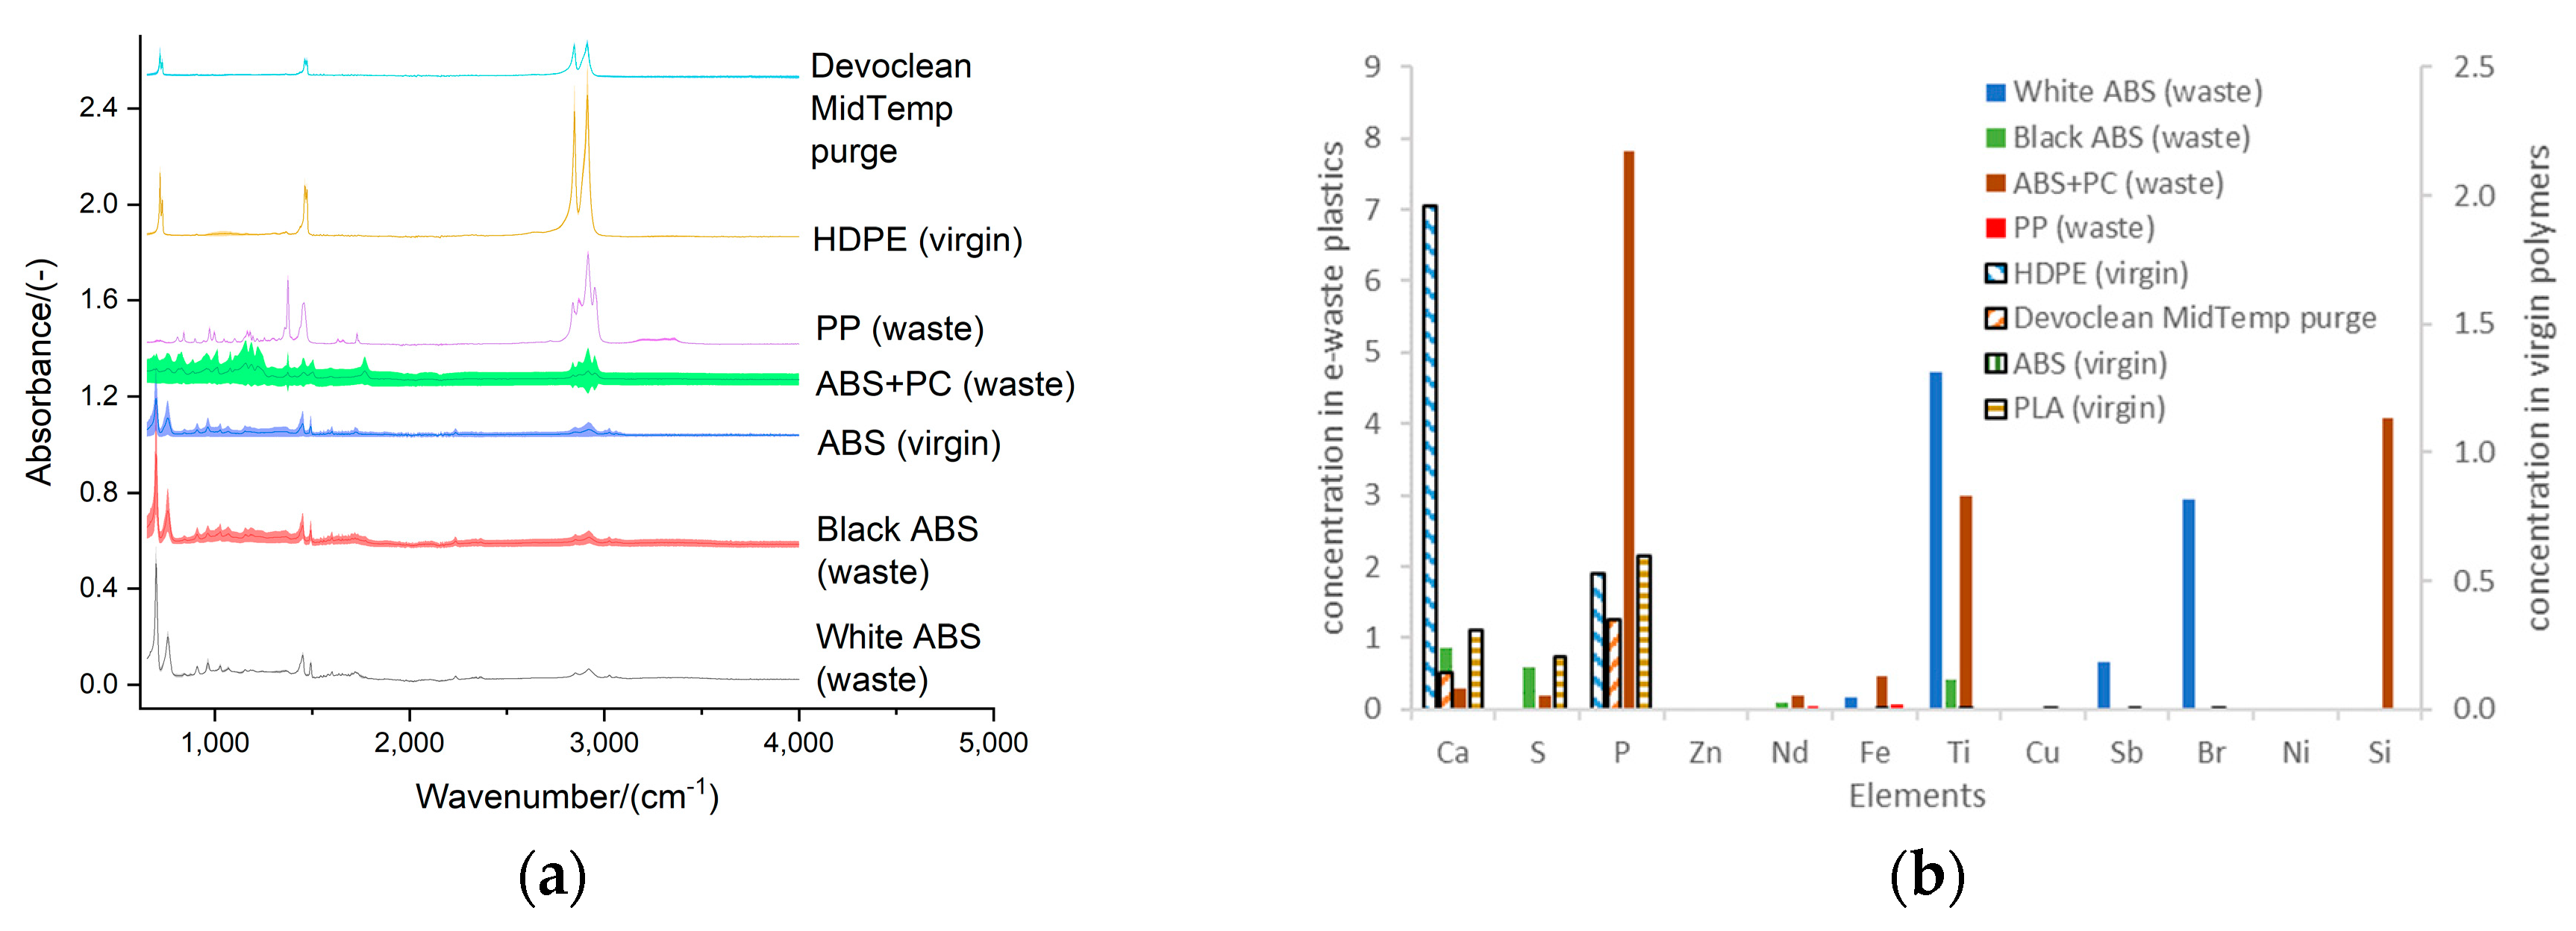
The most abundant e-waste plastics available in a recycling site in the UK were identified based on the indented RIC and the FTIR spectra. These were: ABS, PC, and PP. The difference in the composition of the matrix polymer (main component of the e-waste plastics) was characterized with the Cary 630 FTIR Spectrometer of Agilent Technologies, with ATR sampling module. Furthermore, the differences of the e-waste plastics in terms of the additives were characterized with XRF analysis: Shimadzu EDX8000 instrument equipped with a Rh sealed-source X-ray tube and a silicon strip detector. The samples were mounted on a Mylar film and were irradiated using a 5 mm in diameter collimator. Semi-quantitative concentrations were obtained using a Fundamental Parameter method.
The virgin materials to initiate the melt-blend extrusion process (HDPE, ABS, and PLA) were procured considering that these plastics should have an MFI below 10 (i.e. high viscosity). Before the melt-blend extrusion step, the reduction of the particle size to less than 5 mm was performed with the GP20 Shredder Hybrid of 3devo. The Precision 350 compounder of 3devo was used for processing the e-waste plastics following the protocols provided by the manufacturer of the equipment [
15,
16]. Devoclean MidTemp that initially contained the filament maker was purged with HDPE to ease the transition to the virgin ABS. In order to feed the virgin ABS, the settings used for the melt-blend extruder were: 4 heaters started at 240 ºC, screw speed at 5 rpm, and fan capacity at 50 %. Subsequently, the waste ABS was progressively introduced in the feedstock and once a stable operation was reached, the temperature of the heaters next to the feeding hoper was decreased down to 215 ºC [
15]. Although ABS do not absorb a lot of moisture during storage, the drying was performed at 80°C for only 1 hour in the Airid Polymer Dryer of 3devo.
Similarly, the extrusion report prepared by 3devo was followed to assess the feasibility of recycling the waste PP. The virgin material that was used to ease the feeding of the PP was the PLA, using a bell-shaped setting of 170 – 175 ºC for the heaters of the extruder [
16]. The preparation of the dumbbell-shaped specimen was done with the ZMorph 2.0 SX Multitool 3D Printer. The analysis of the filament thickness was performed with the optical sensor installed in the compounder and the software DevoVision. The characterization of the tensile strength of the filament was done with the equipment Instron 3345, which would be able to provide up to 5 kN of traction and compression forces. The Olympus LEXT OLS5000 SAF Optical 3D Measuring Laser Microscope was used for the characterization of the breakage of the recycled filaments. For the thermogravimetric analysis and the differential scanning calorimetry the NETZSCH STA 449 F3 Jupiter® was used. The acetone extraction of the white ABS was performed following a modified version of the protocol followed by Arostegui et al. [
19]. The difference was that the samples were successively extracted up to 4 times, aiming the isolation of the most soluble fractions of the matrix (SAN copolymer) and additives (BFR) and minimizing the degradation of the rubbery dispersed fraction (butadiene). The subsequent extraction of the PC in the case of the ABS+PC was performed with DCM, similarly to Chandrasekaran et al. [
27].
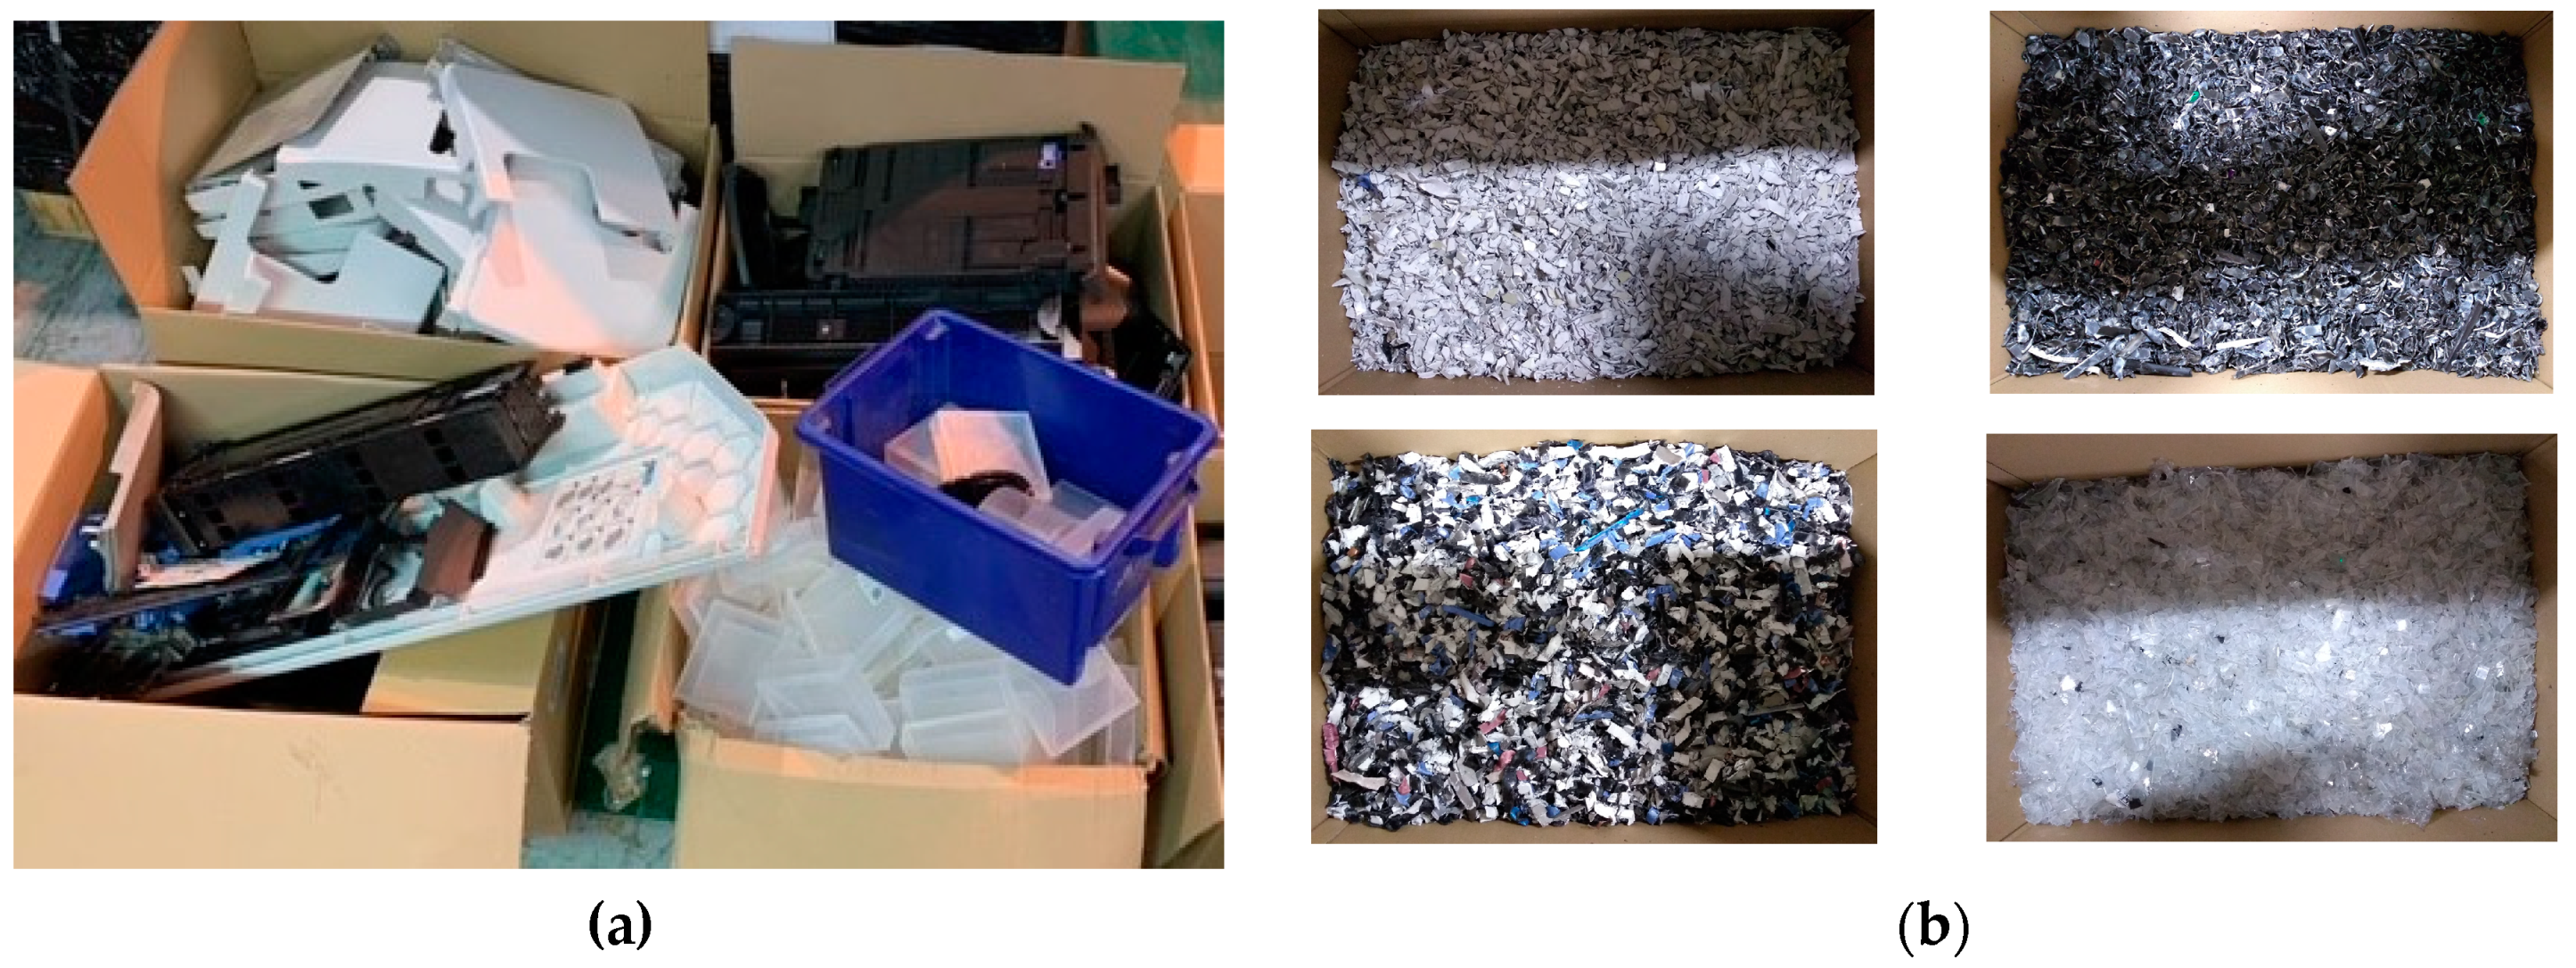
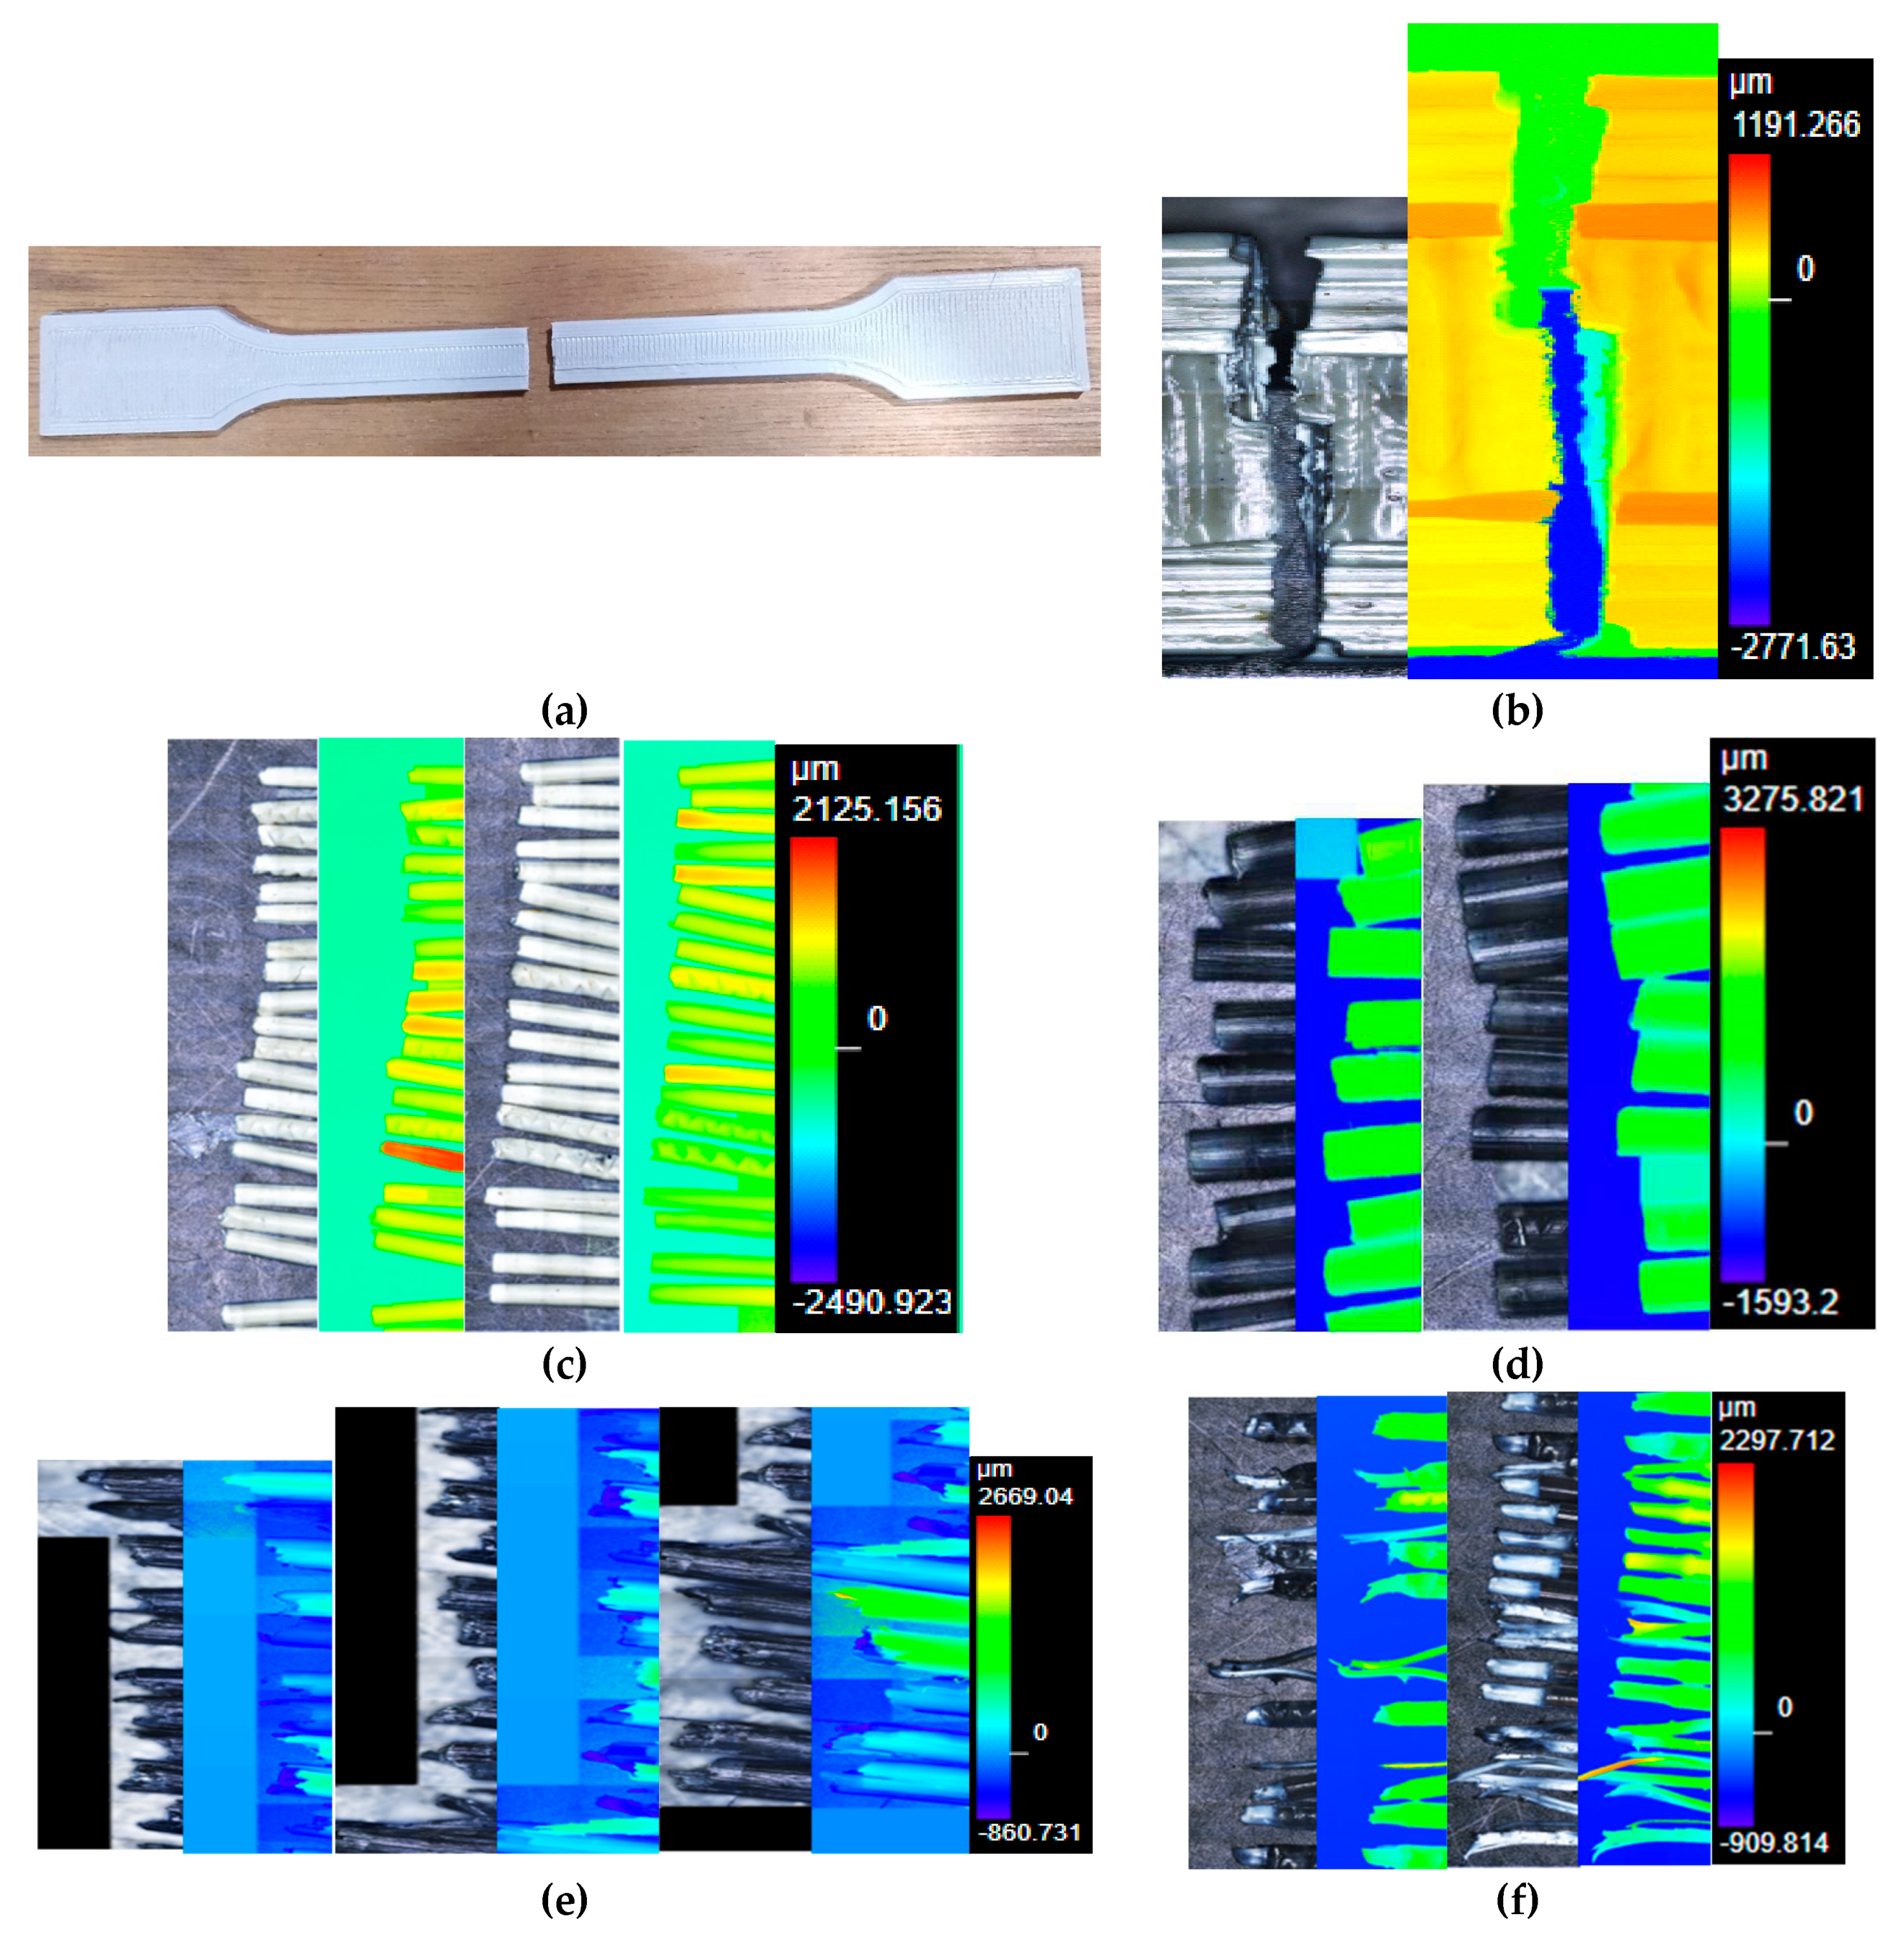
Figure 1.
Bulkiest e-waste plastics identified in the recycling company: (a) raw samples and (b) shredded sample to a particle size to less than 5 mm: white ABS (top-left corner), black ABS (top-right corner), ABS+PC (bottom-left corner), and PP (bottom-right corner).
Figure 1.
Bulkiest e-waste plastics identified in the recycling company: (a) raw samples and (b) shredded sample to a particle size to less than 5 mm: white ABS (top-left corner), black ABS (top-right corner), ABS+PC (bottom-left corner), and PP (bottom-right corner).
Figure 2.
Characterization of the composition of the e-waste plastics (ABS, PC, and PP) and the virgin polymers used to enable the melt-blend extrusion process for the production of 3D filament: (a) matrix in terms of FTIR spectra; (b) additives as described by the XFR results.
Figure 2.
Characterization of the composition of the e-waste plastics (ABS, PC, and PP) and the virgin polymers used to enable the melt-blend extrusion process for the production of 3D filament: (a) matrix in terms of FTIR spectra; (b) additives as described by the XFR results.
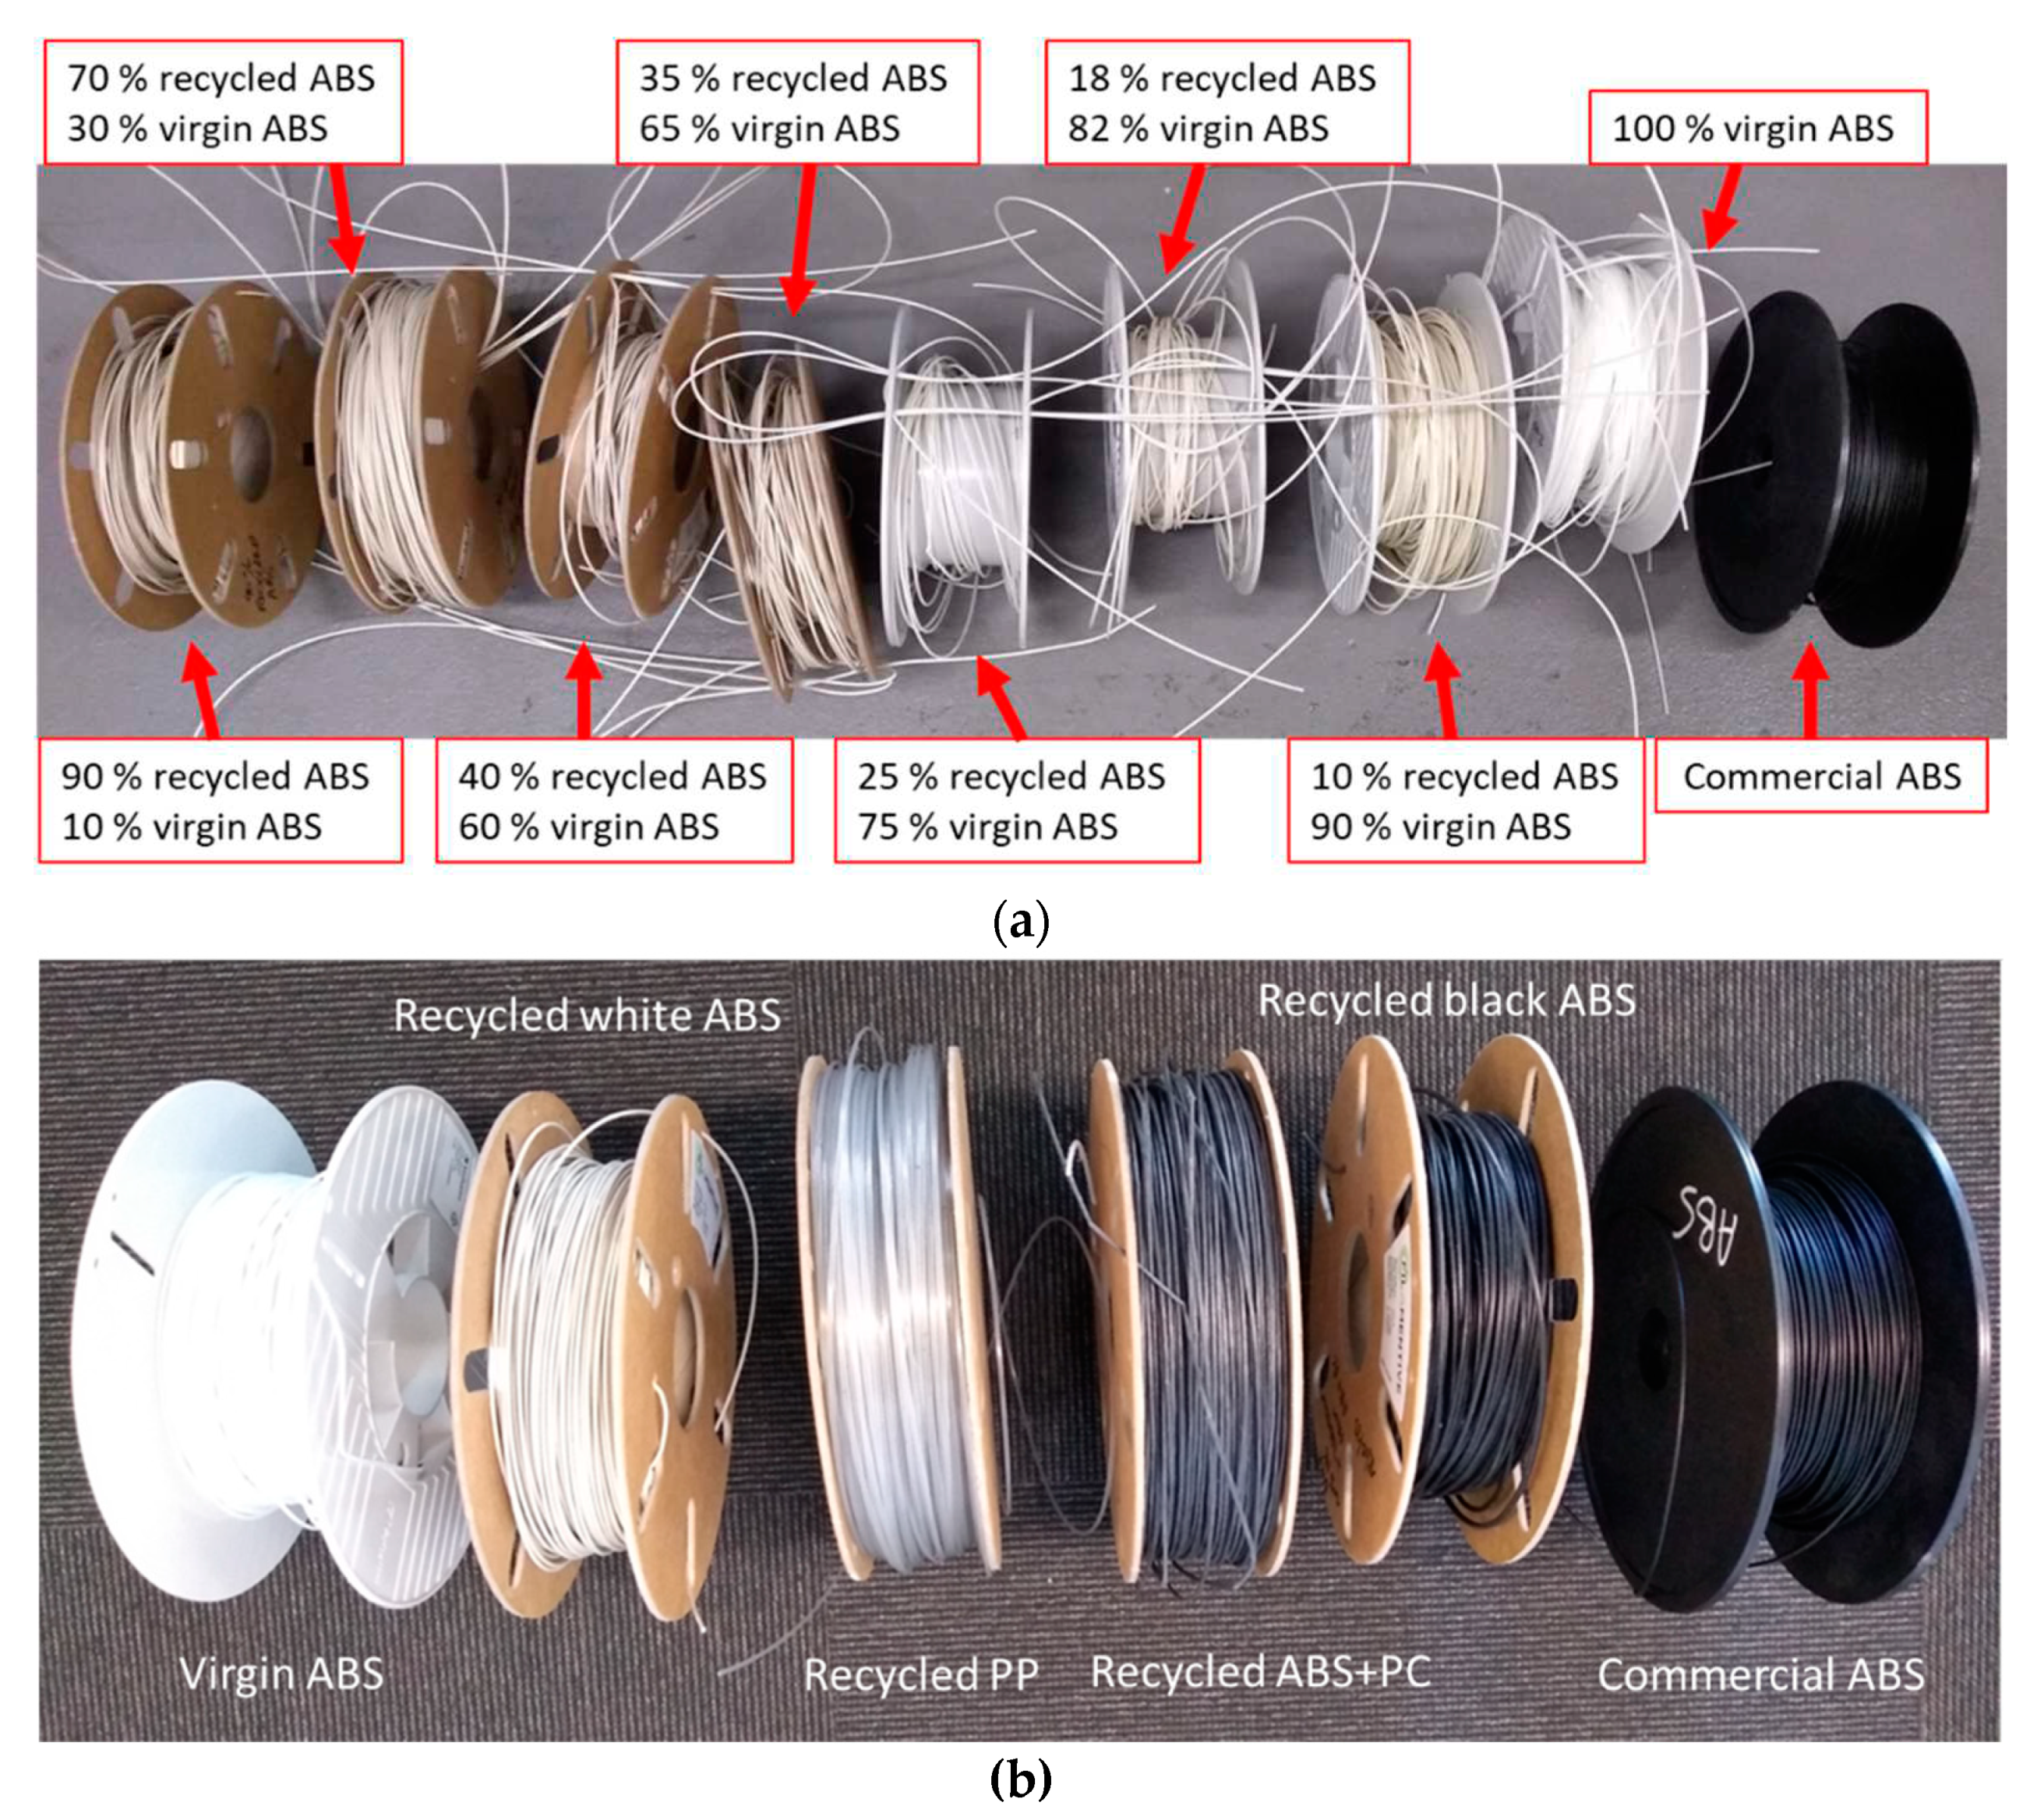
Figure 3.
(a) Progressive increase in the share in the share of e-waste plastic (white ABS) and decrease in that of the virgin polymer (ABS). (b) 3D filament prepared with 100 % recycled material: white ABS, black ABS, PP, and ABS+PP.
Figure 3.
(a) Progressive increase in the share in the share of e-waste plastic (white ABS) and decrease in that of the virgin polymer (ABS). (b) 3D filament prepared with 100 % recycled material: white ABS, black ABS, PP, and ABS+PP.
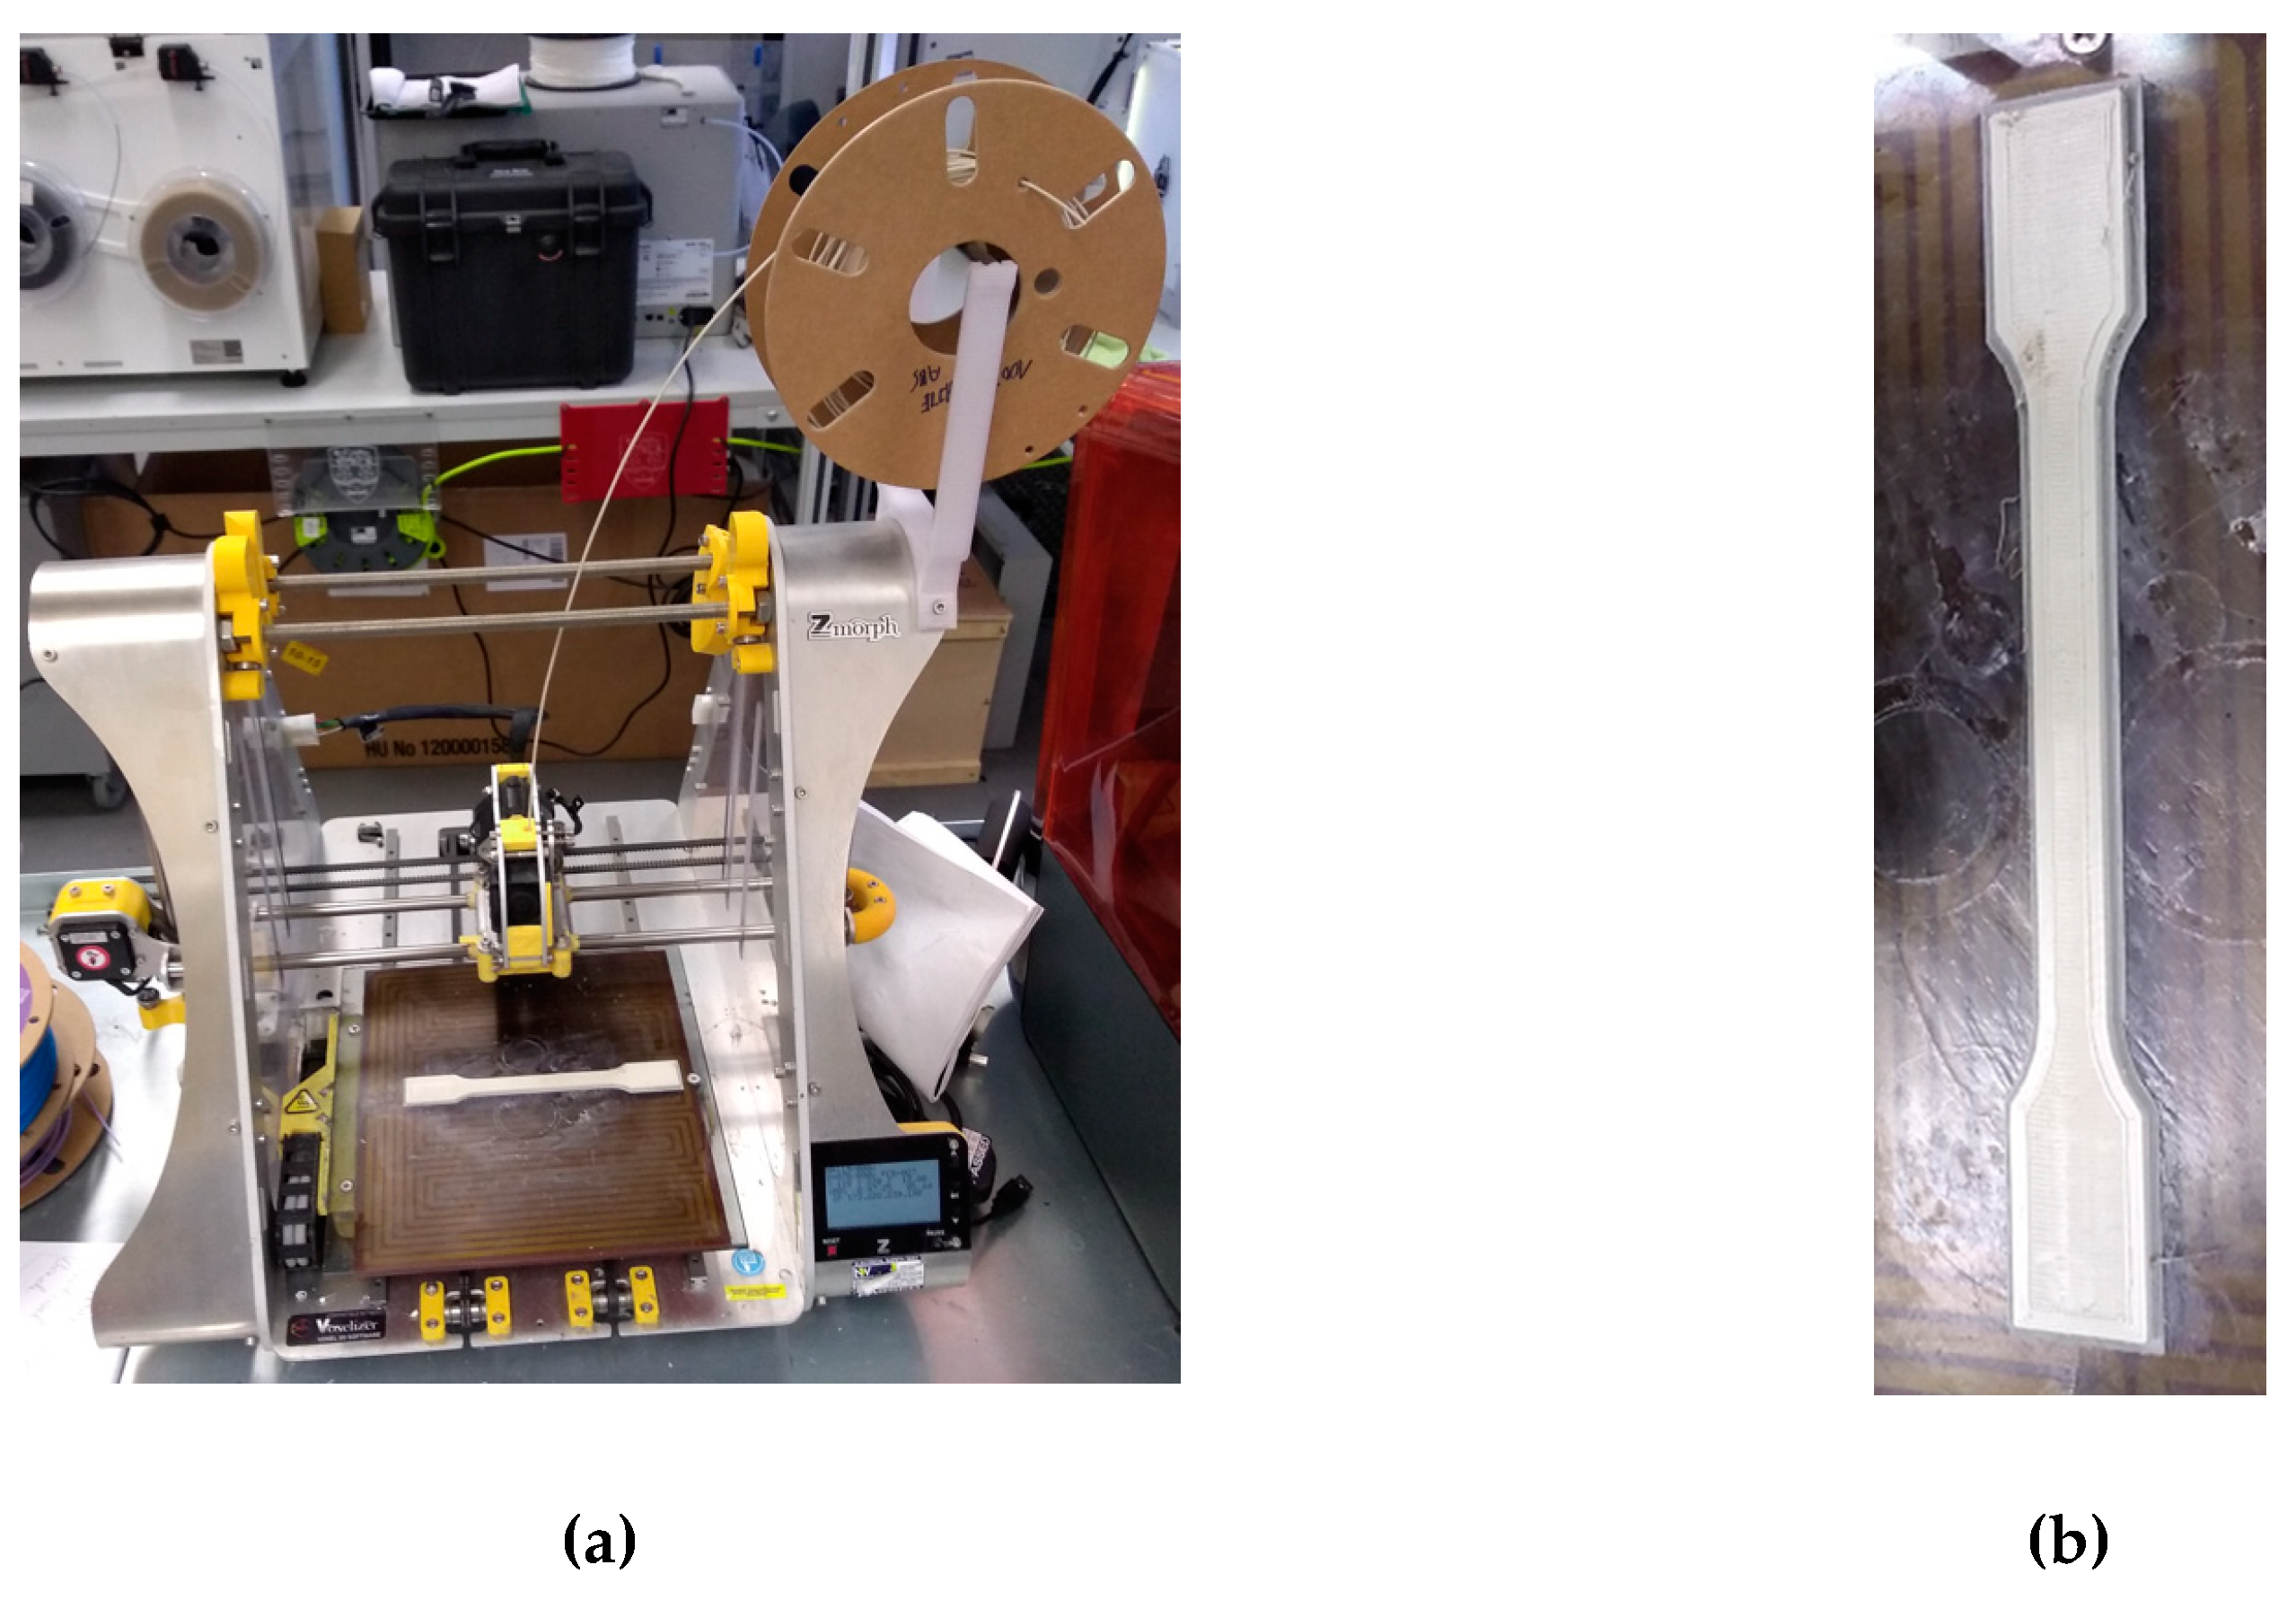
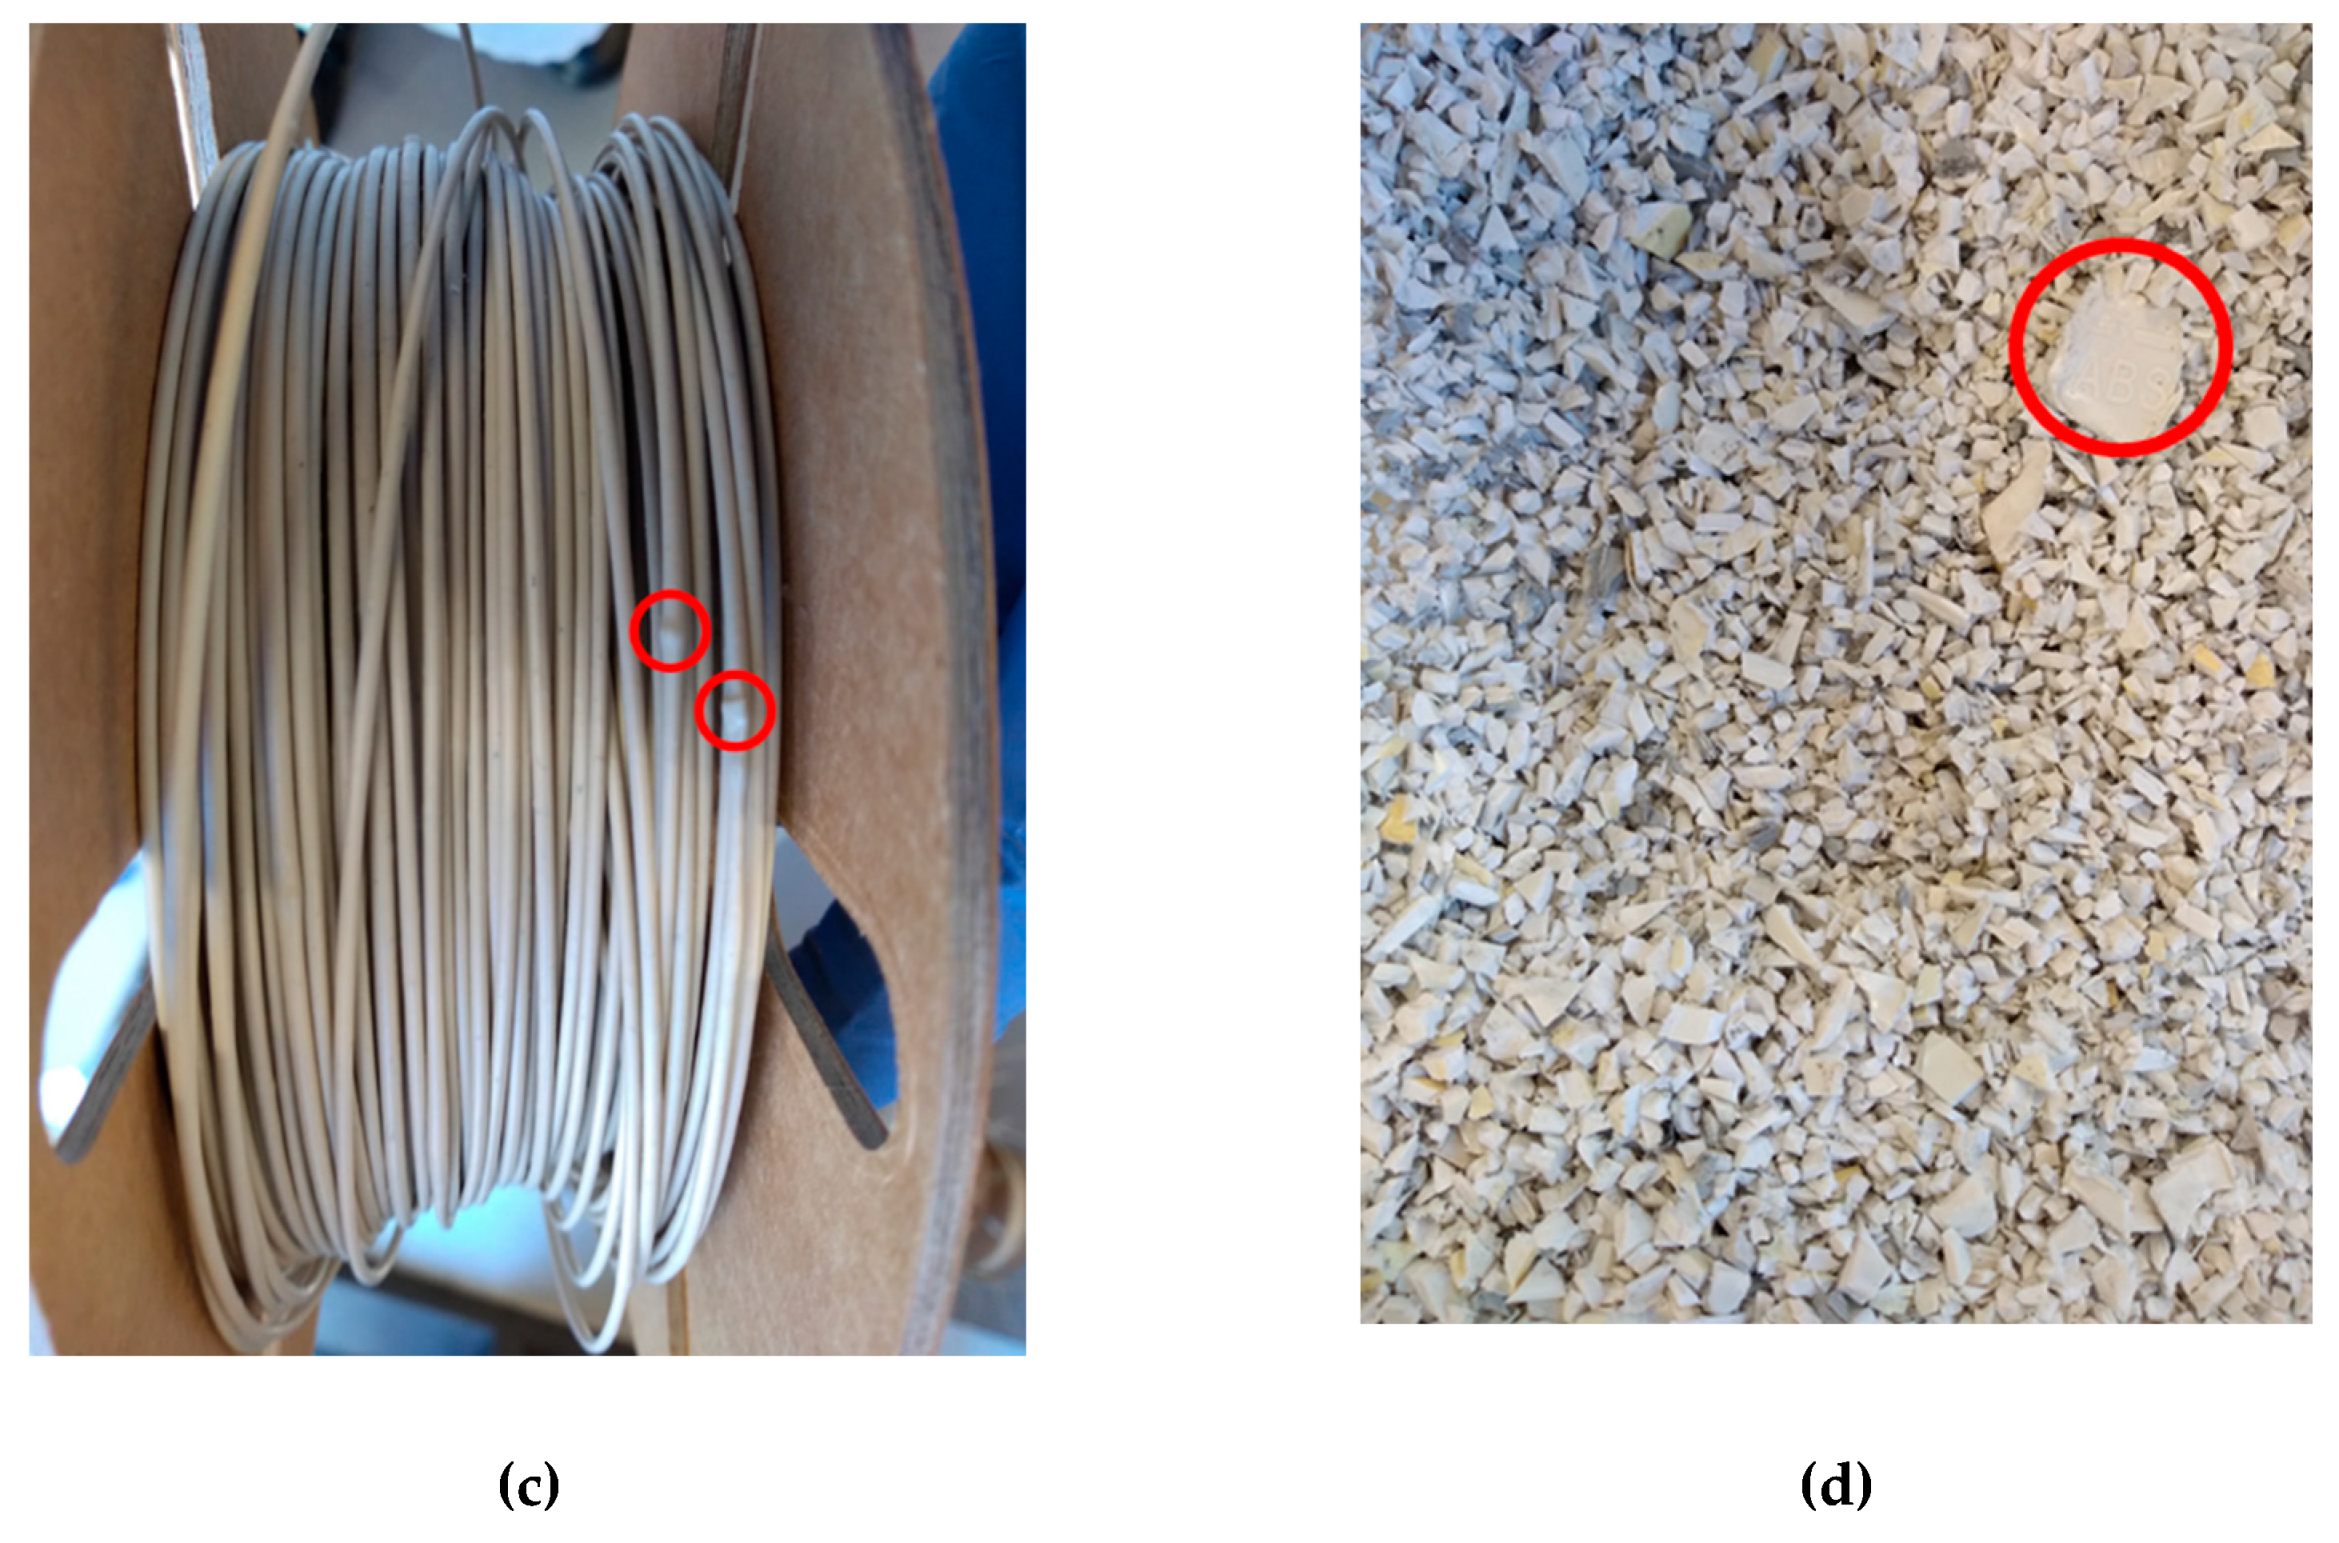
Figure 5.
(a) 3D printing of the dumbbell shaped specimen for tensile testing; (b) dumbbell shaped specimen (zoom in); (c) 1.75±0.20-diameter lumps in the 3D filament (100 % white ABS); and (d) 2-cm particles in shredded white ABS.
Figure 5.
(a) 3D printing of the dumbbell shaped specimen for tensile testing; (b) dumbbell shaped specimen (zoom in); (c) 1.75±0.20-diameter lumps in the 3D filament (100 % white ABS); and (d) 2-cm particles in shredded white ABS.
Figure 6.
(a) summary of the mechanical strength of the 3D filament; (b) profile tensile force vs extension of the 7 replicates of the white ABS filament; (c) profile tensile force vs extension of the 8 replicates of the black ABS filament; (d) profile tensile force vs extension 11 replicates of the ABS+PC filament; and (e) profile tensile force vs extension of the 17 replicates of the PP filament.
Figure 7.
(a) dumbbell shaped specimen after the tensile testing; (b) laser microscope image (x5) of the dumbbell shaped specimen at the point of failure; (c) laser microscope image (x5) of the white ABS filaments at the point of rupture; (d) laser microscope image (x5) of the black ABS filaments at the point of failure; (e) laser microscope image (x5) of the black ABS filaments at the point of rupture; (f) laser microscope image (x5) of the ABS+PC filaments at the point of failure; and (g) laser microscope image (x5) of the PP filaments at the point of rupture.
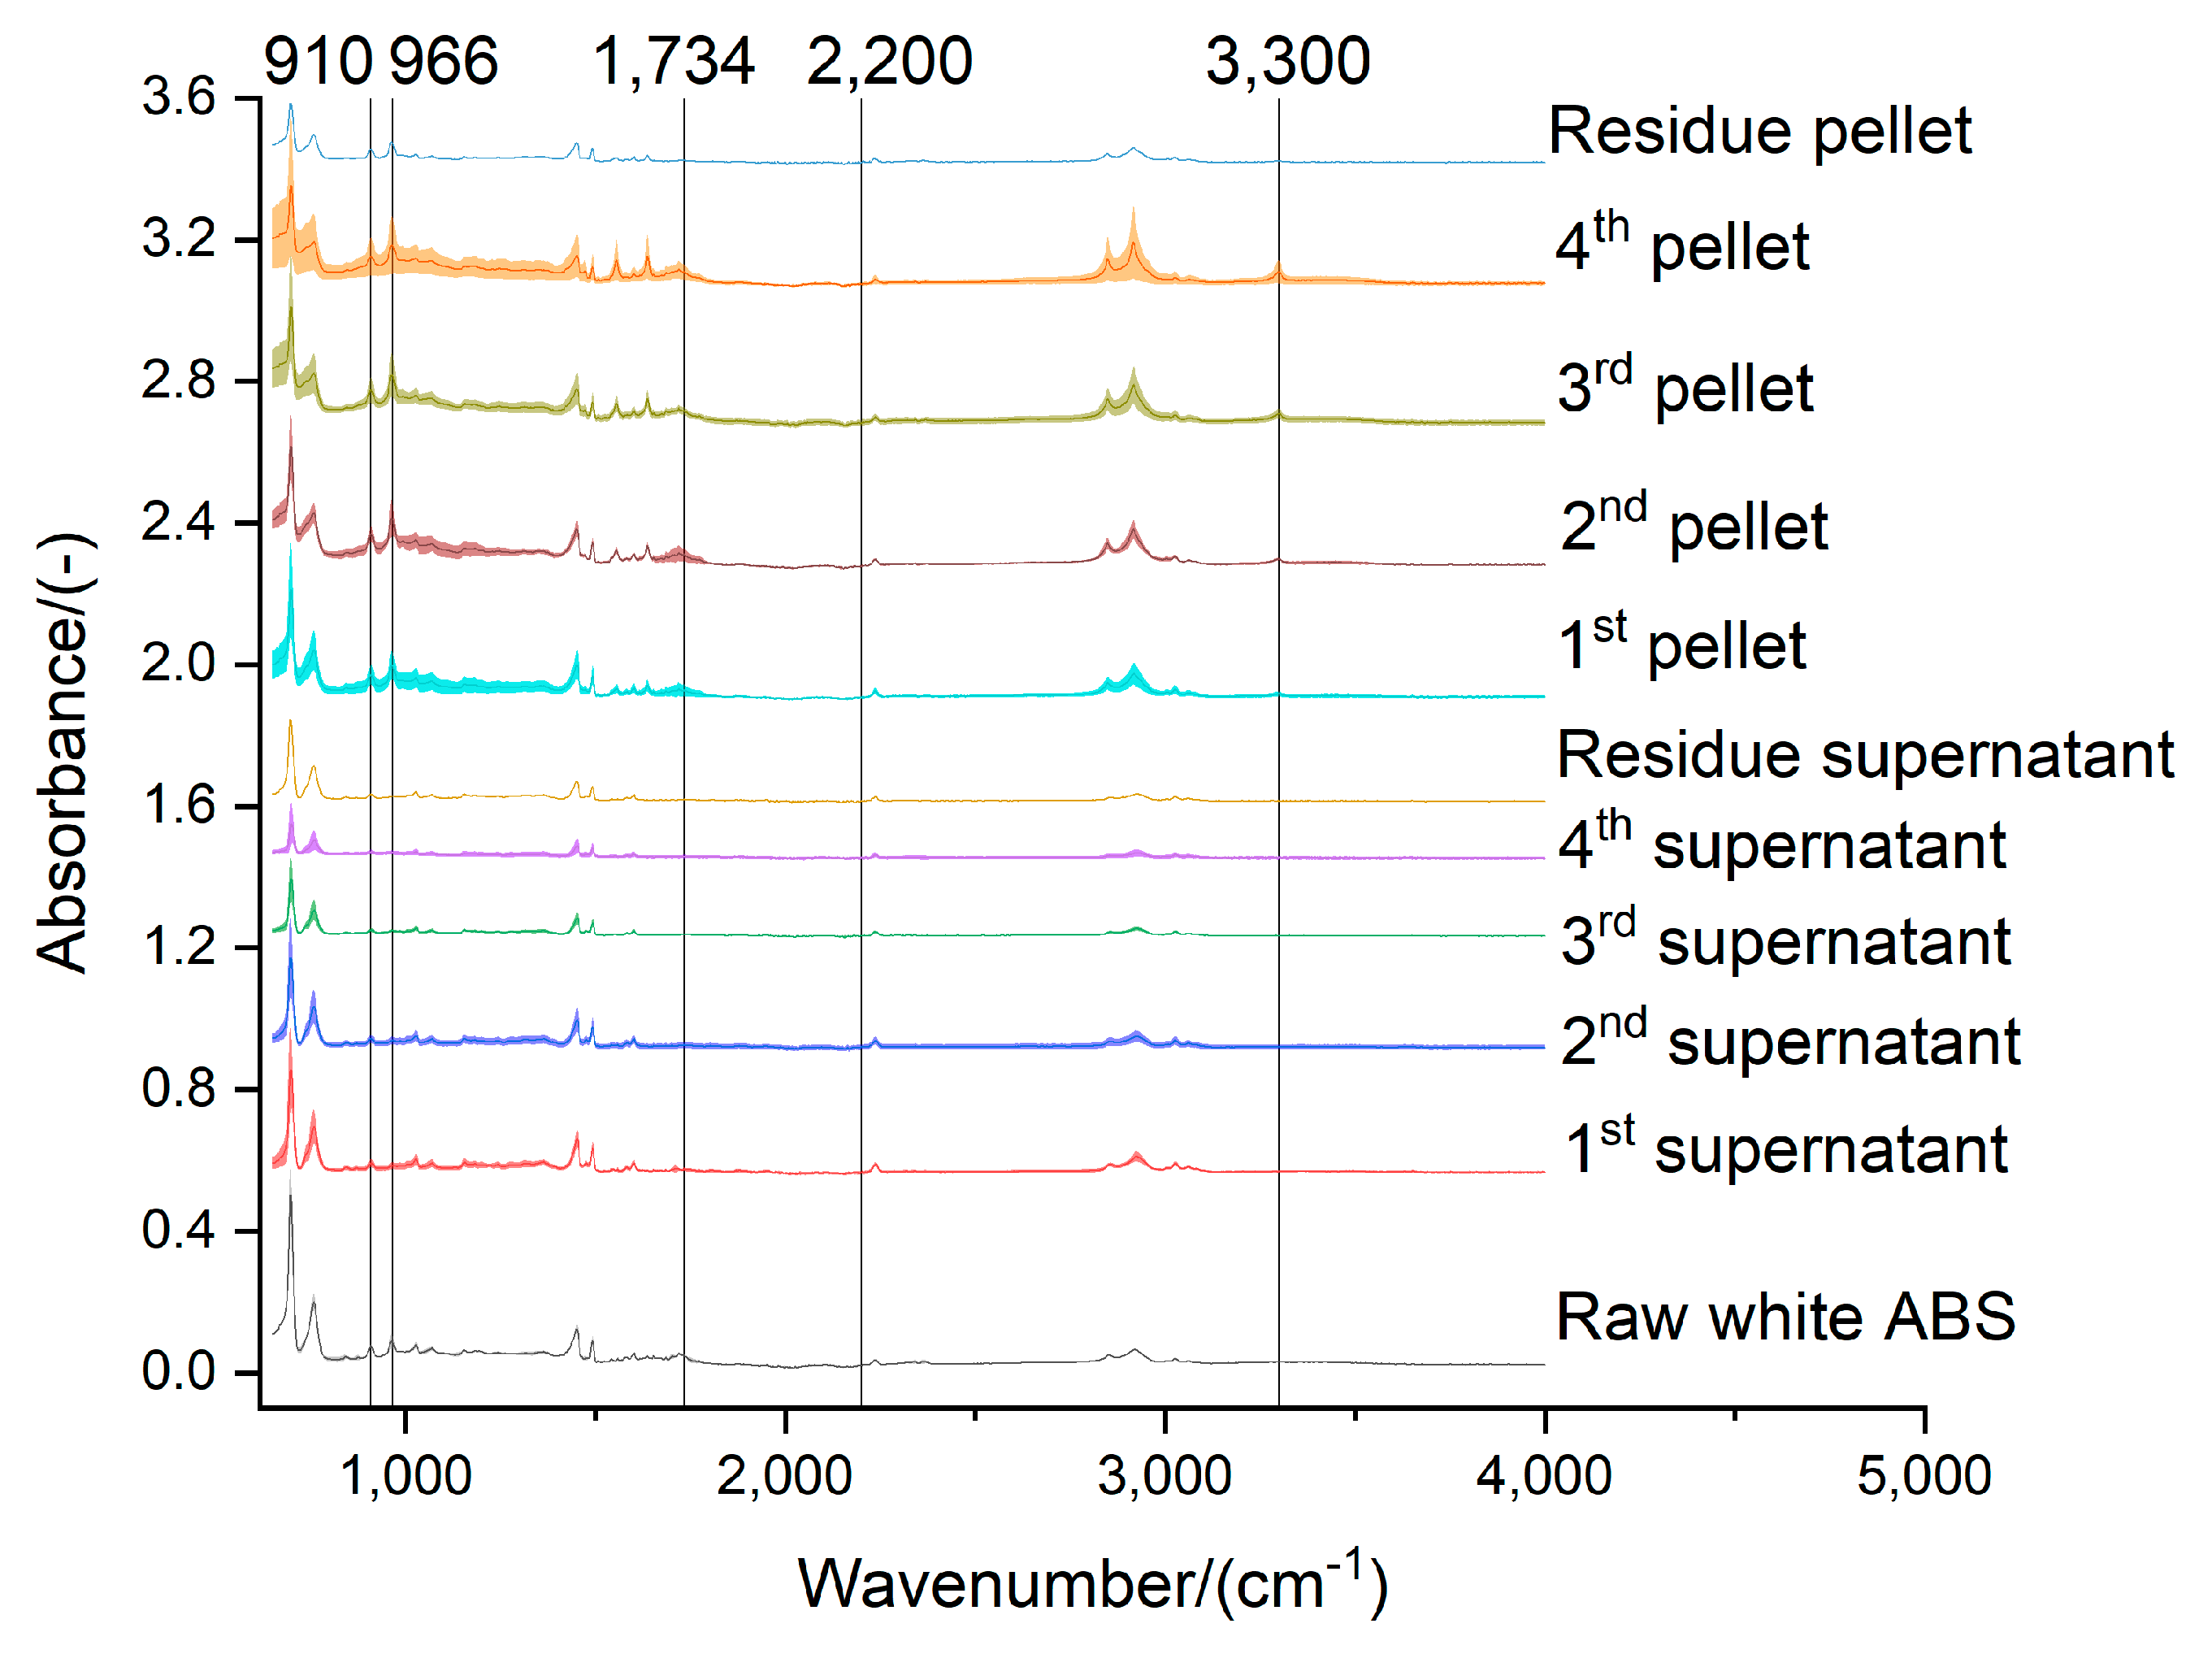
Figure 8.
Effect of the acetone extraction on the functional groups of the white ABS
Figure 8.
Effect of the acetone extraction on the functional groups of the white ABS
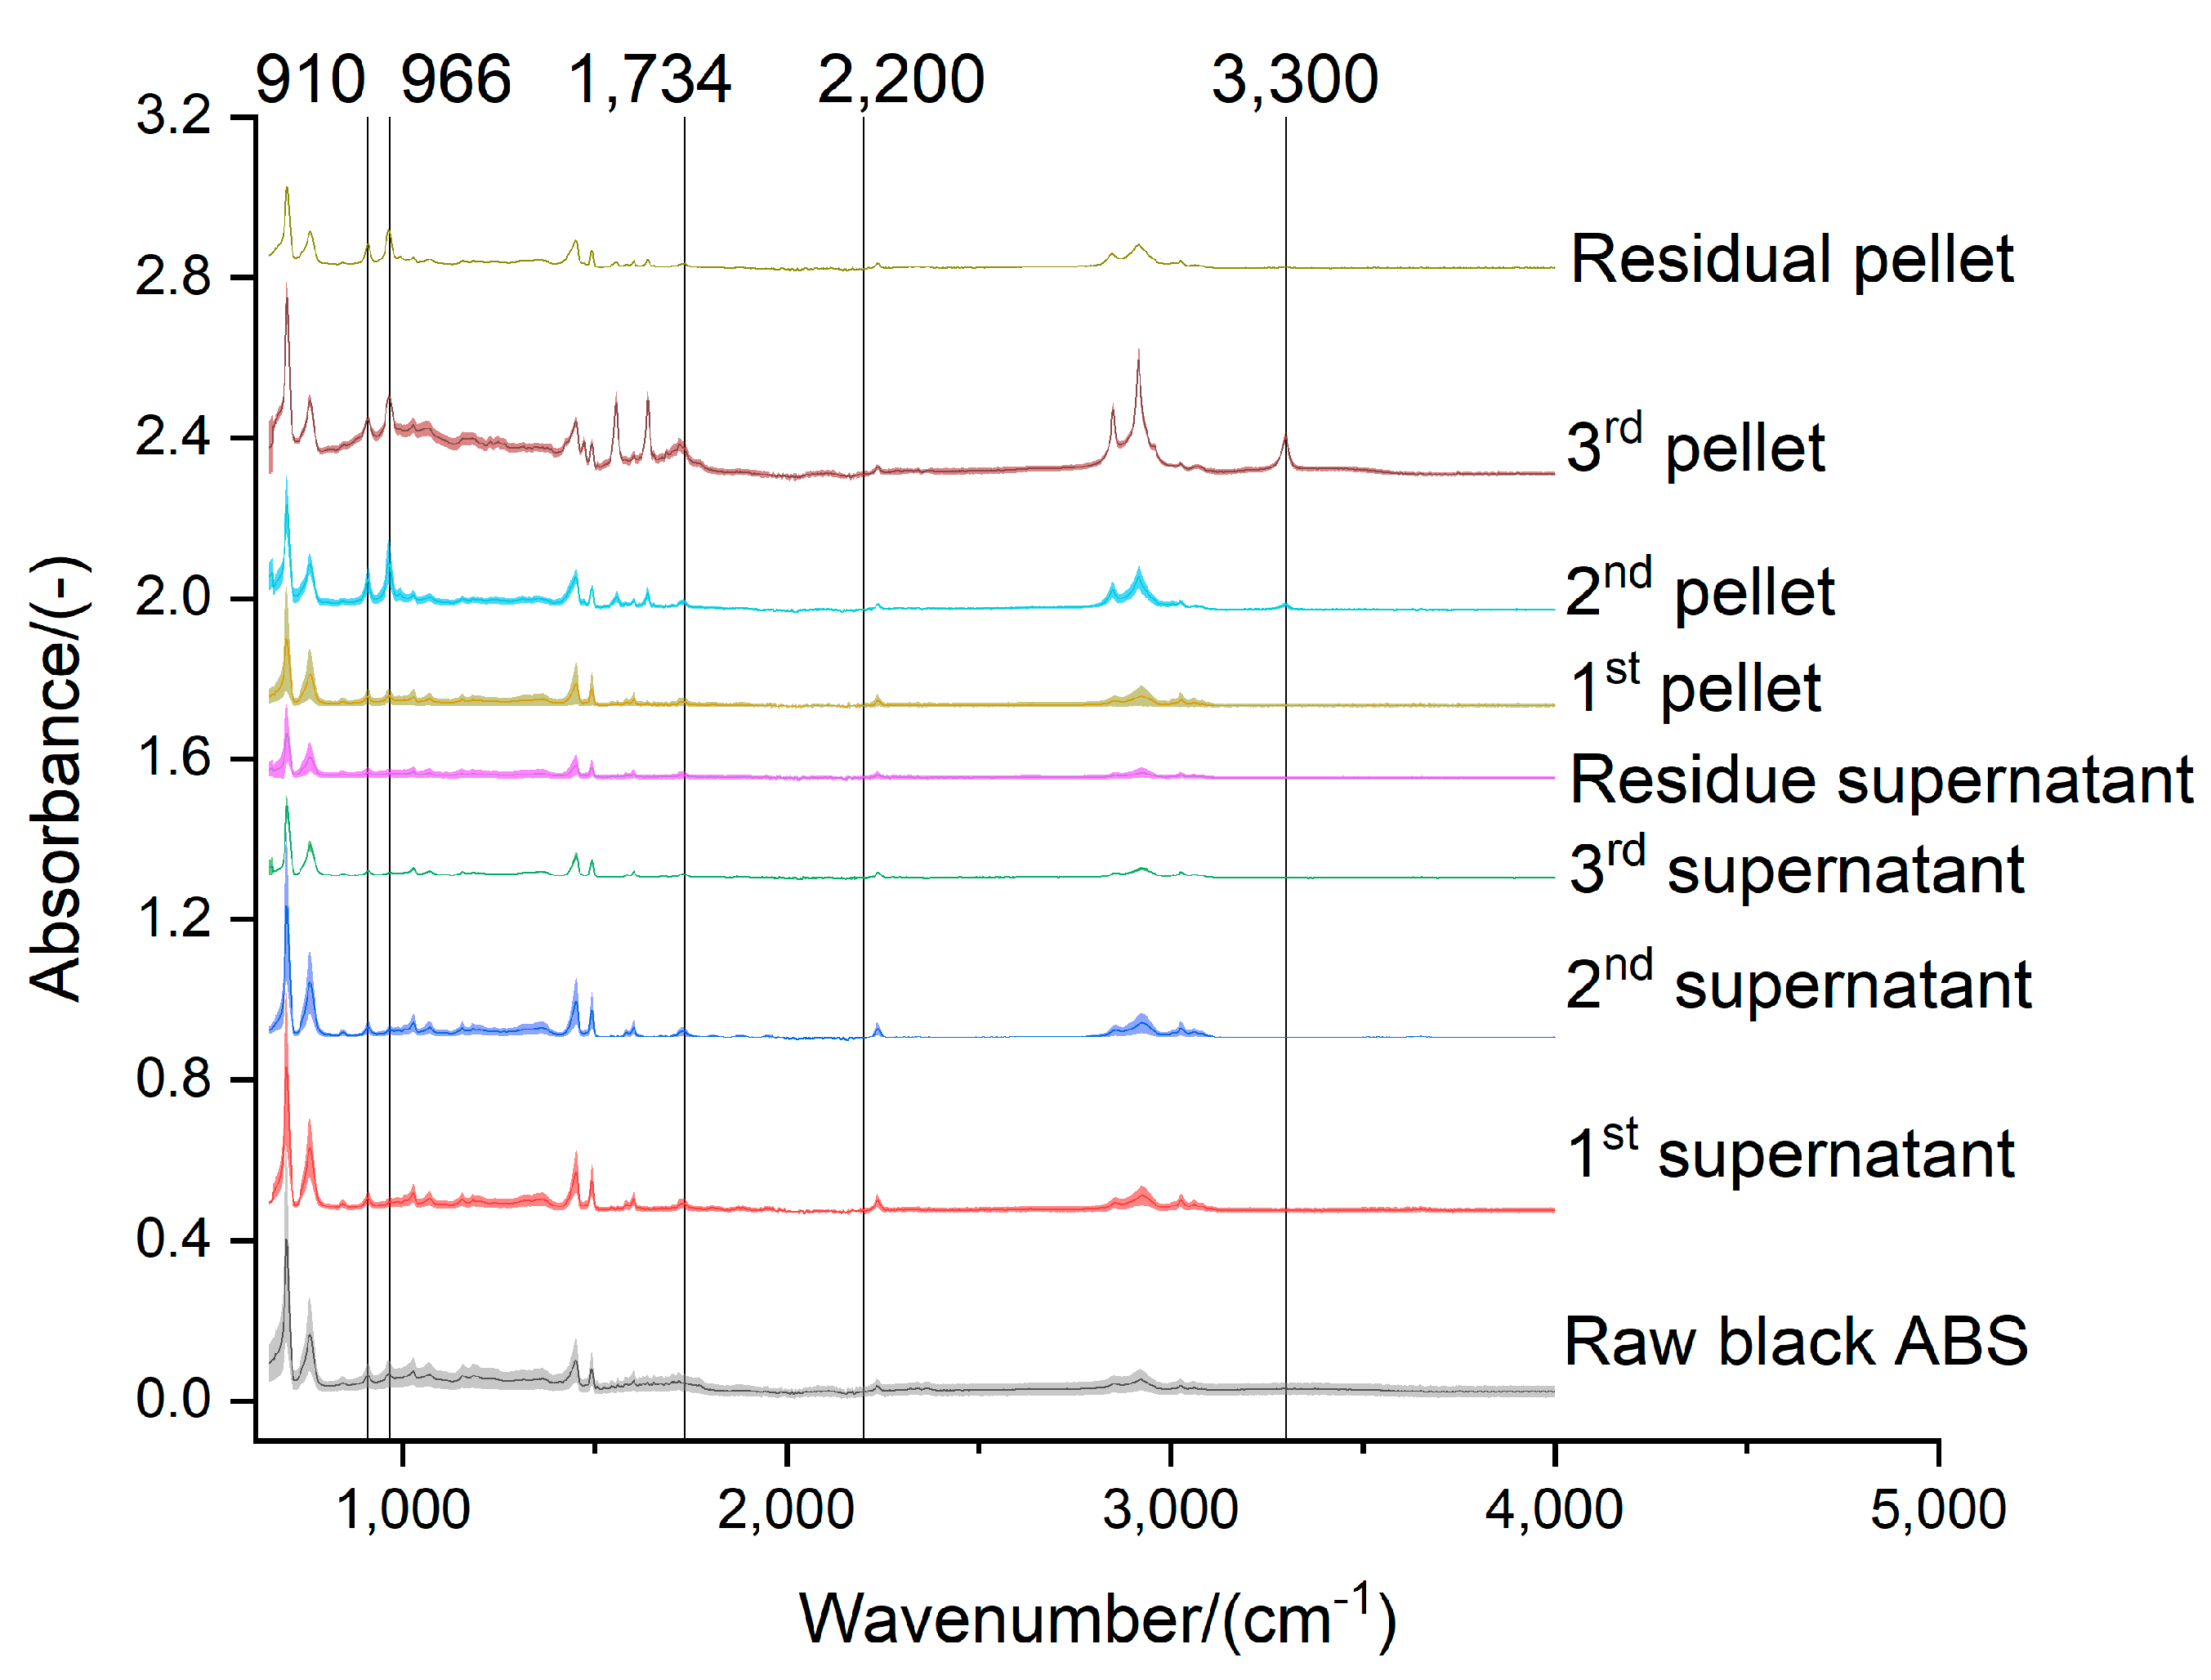
Figure 9.
Effect of the acetone extraction on the functional groups of the black ABS
Figure 9.
Effect of the acetone extraction on the functional groups of the black ABS
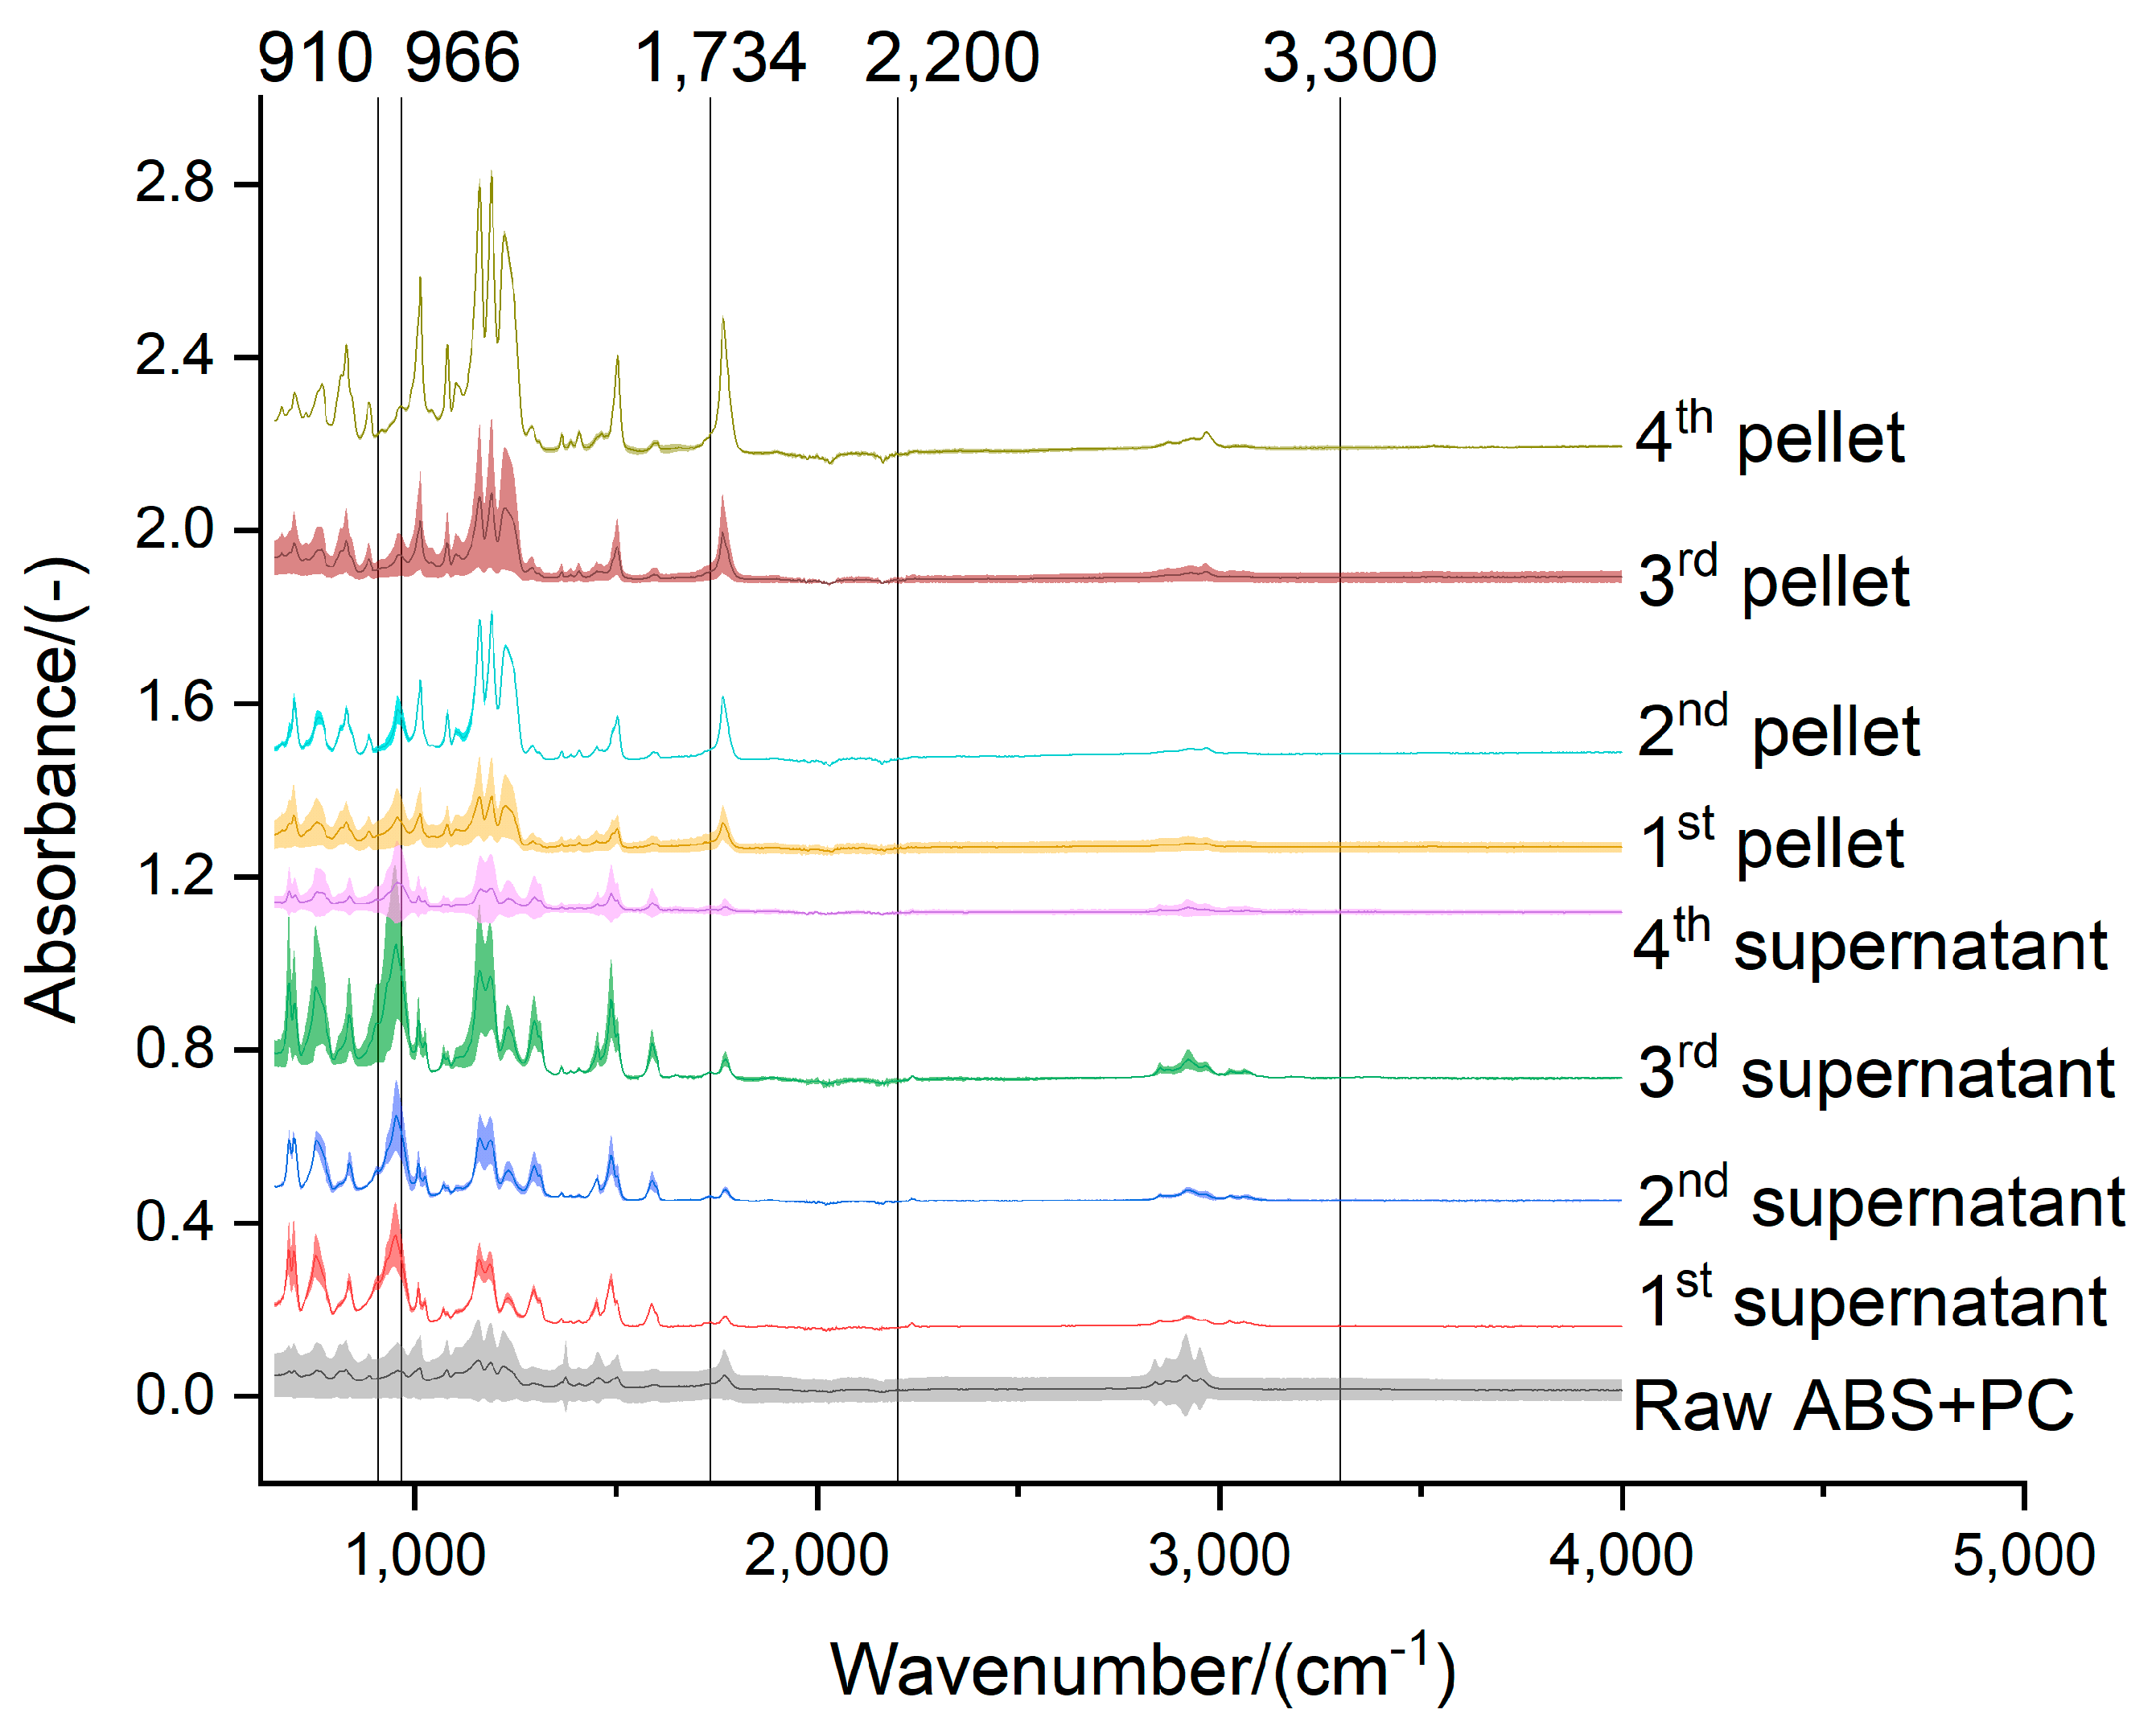
Figure 10.
Effect of the acetone extraction on the functional groups of the ABS+PP.
Figure 10.
Effect of the acetone extraction on the functional groups of the ABS+PP.
Figure 11.
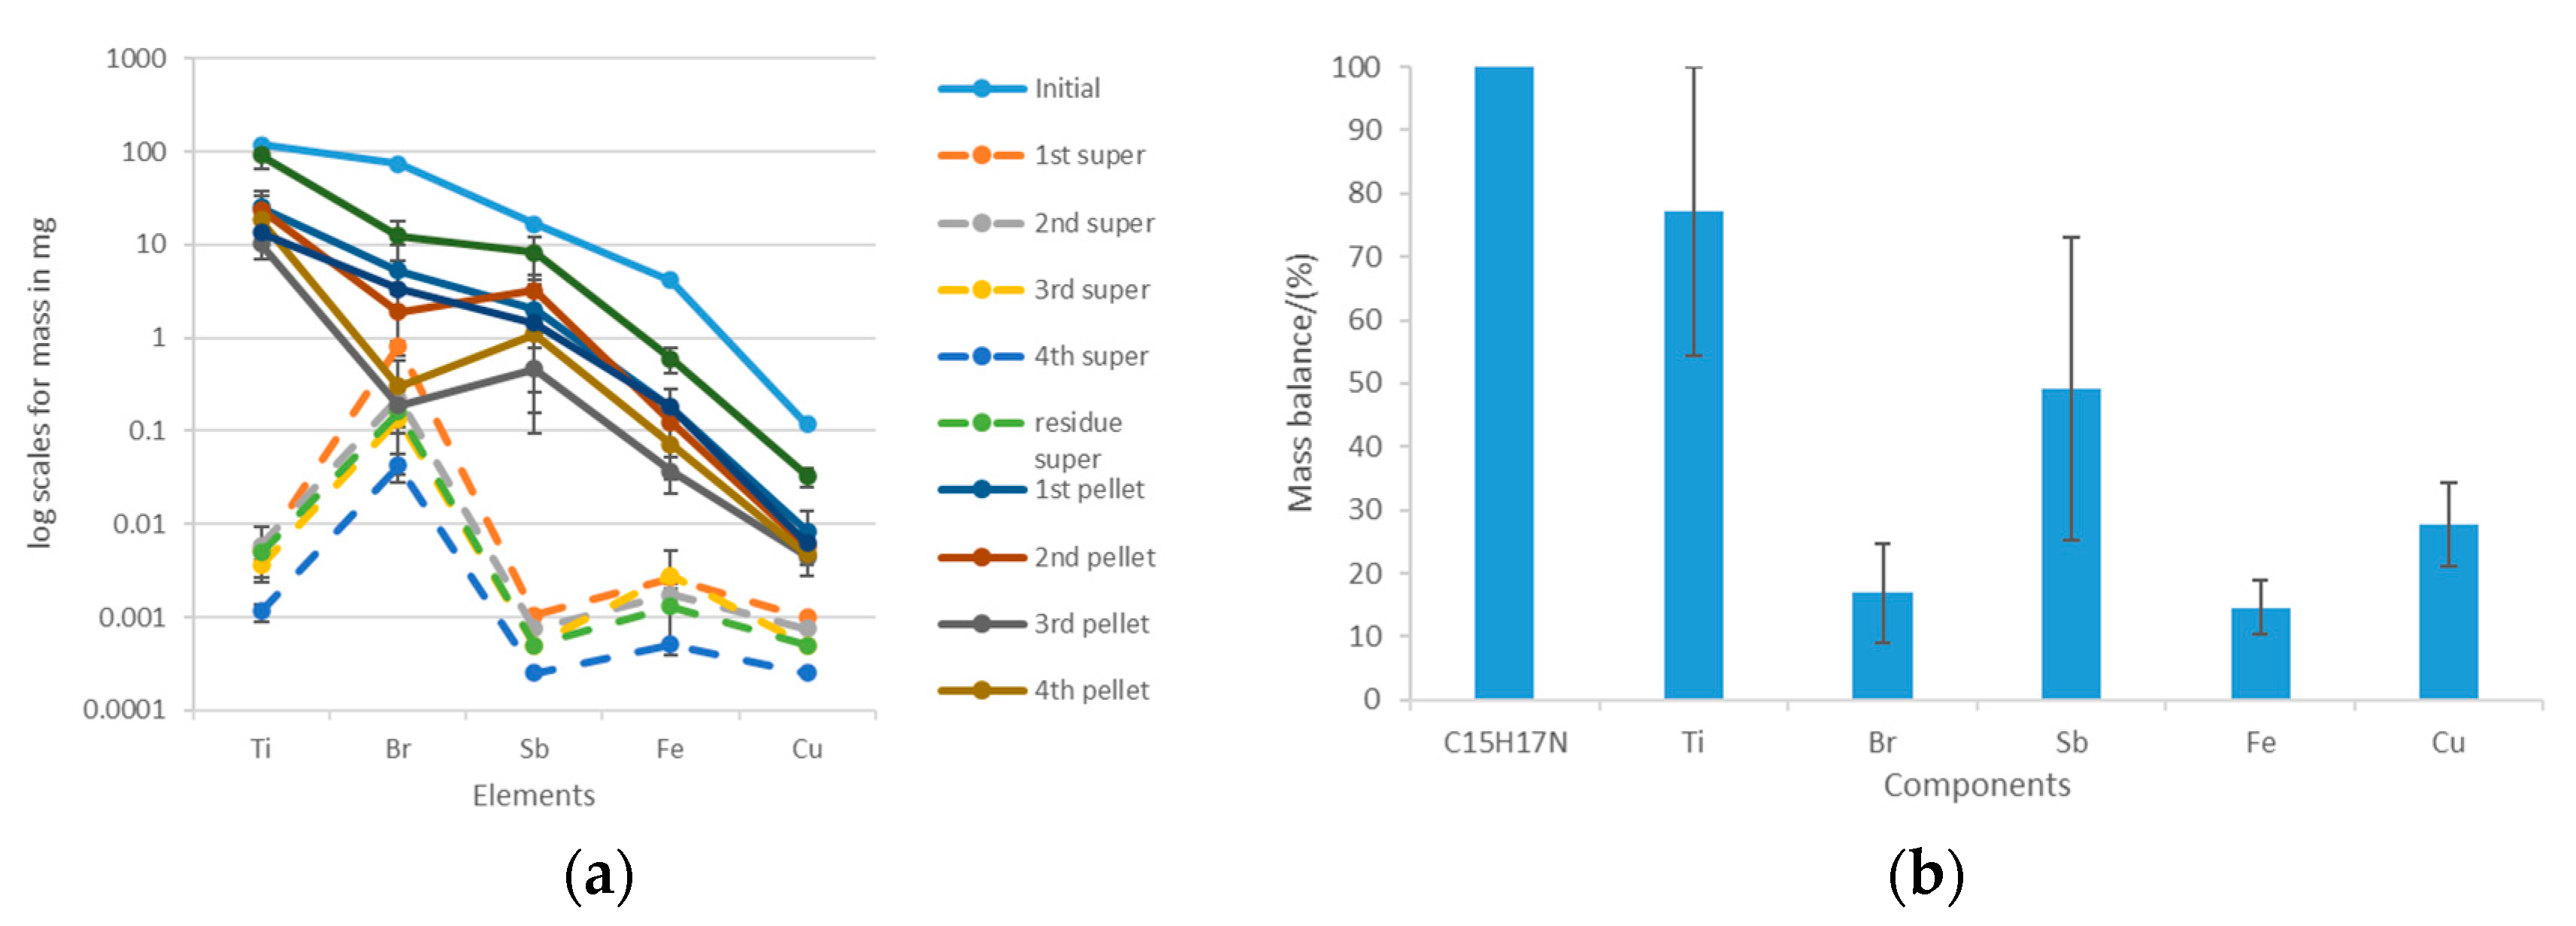
Acetone-based extraction of the most abundant trace elements in the white ABS: (a) distribution of the elements among the supernatant and the pellet after each extraction step; (b) mass balances considering the initial amount of trace elements that were initially in the white ABS and the amounts that were found in the supernatant and the pellet.
Figure 12.
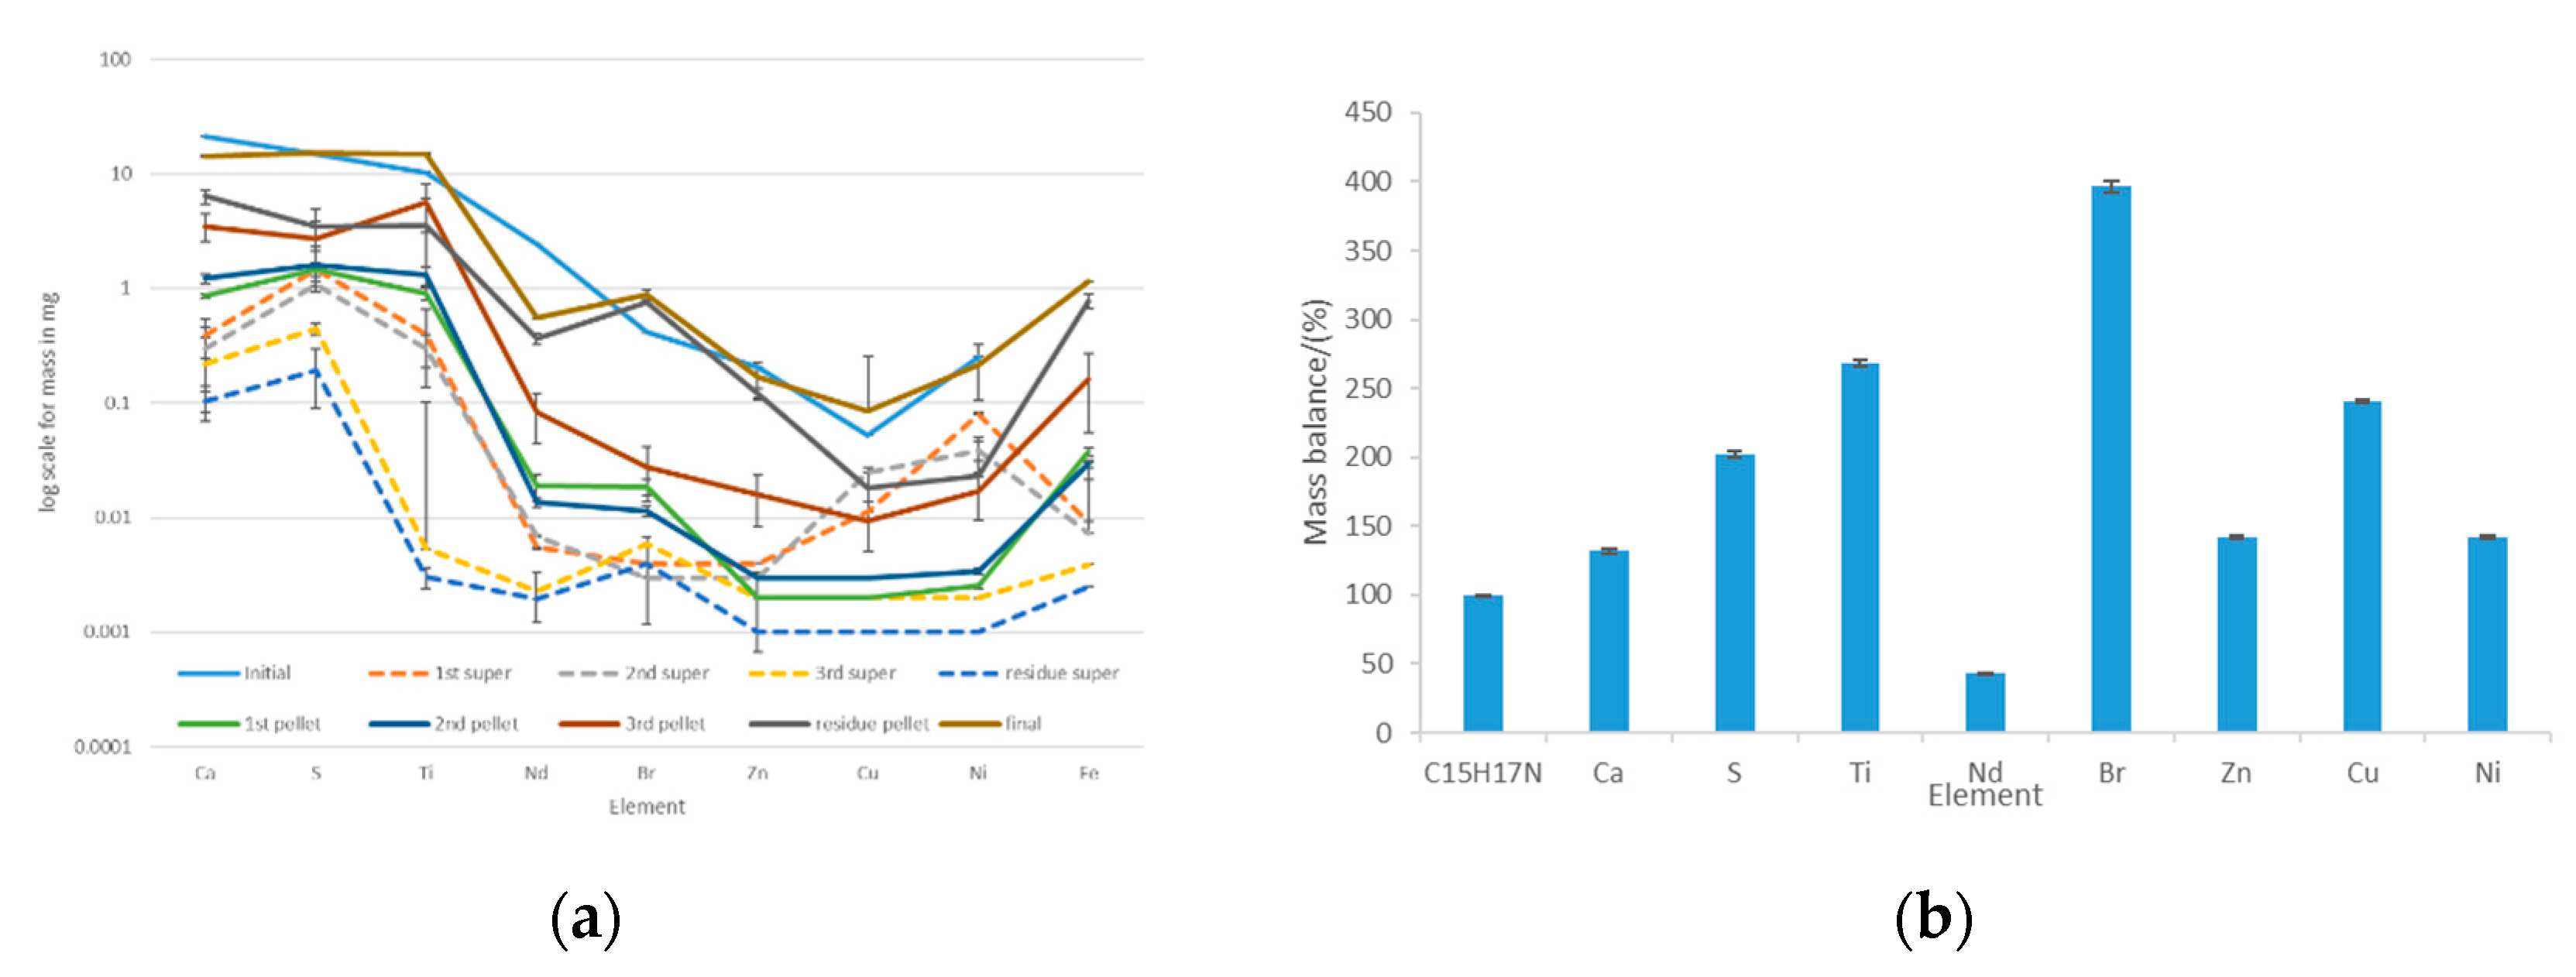
Acetone-based extraction of the most abundant trace elements in the black ABS: (a) distribution of the elements among the supernatant and the pellet after each extraction step; (b) mass balances considering the initial amount of trace elements that were initially in the black ABS and the amounts that were found in the supernatant and the pellet.
Figure 13.
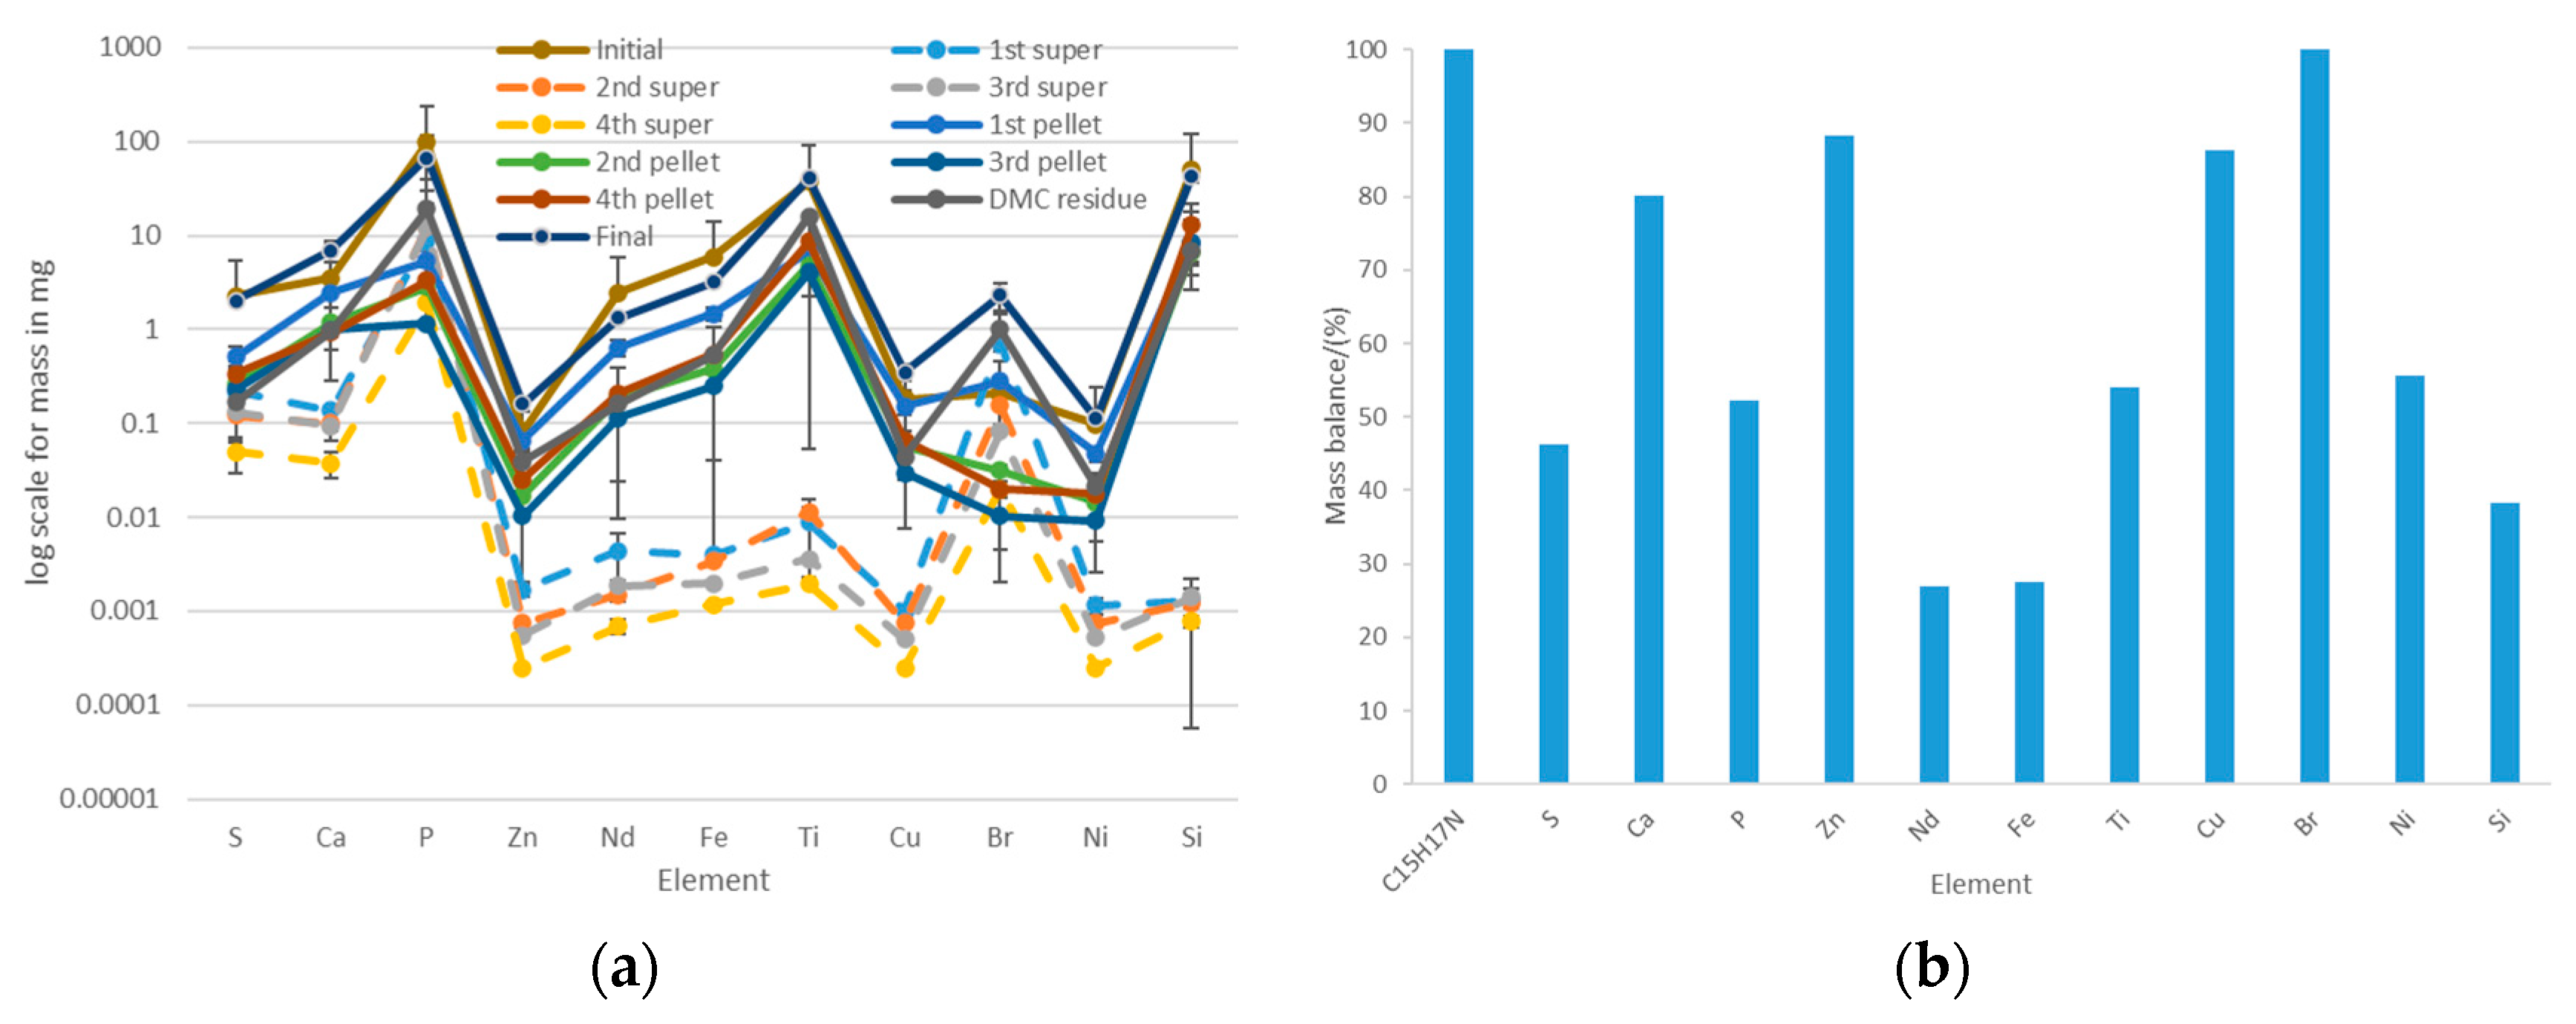
Acetone-based extraction of the most abundant trace elements in the ABS+PC: (a) distribution of the elements among the supernatant and the pellet after each extraction step; (b) mass balances considering the initial amount of trace elements that were initially in the ABS+PC and the amounts that were found in the supernatant and the pellet.
Figure 14.
(a) laser microscope image (x10) of several cross-sectional areas of the filament of black ABS with unmelted particles; (b) laser microscope image (x10) several cross-sectional areas of the filament of black ABS with unmelted core; (c) laser microscope image (x20) of the cross-section of the filament of black ABS with unmelted particles; (d) laser scan (x20) of the cross-sectional area of the filament of black ABS with unmelted particles; (f) laser microscope image (x20) of the cross-section of the filament of black ABS with unmelted core; and (g) laser scan (x20) of the cross-sectional area of the filament of black ABS with unmelted core.
Figure 15.
Design of a microfactory for the manufacturing of hard drive caddies with the recycled e-waste plastic polymers: ABS, PC, and PP.
Figure 15.
Design of a microfactory for the manufacturing of hard drive caddies with the recycled e-waste plastic polymers: ABS, PC, and PP.
