3.1.1. LPS systemic administration activates perivascular astrocytes and microglia.
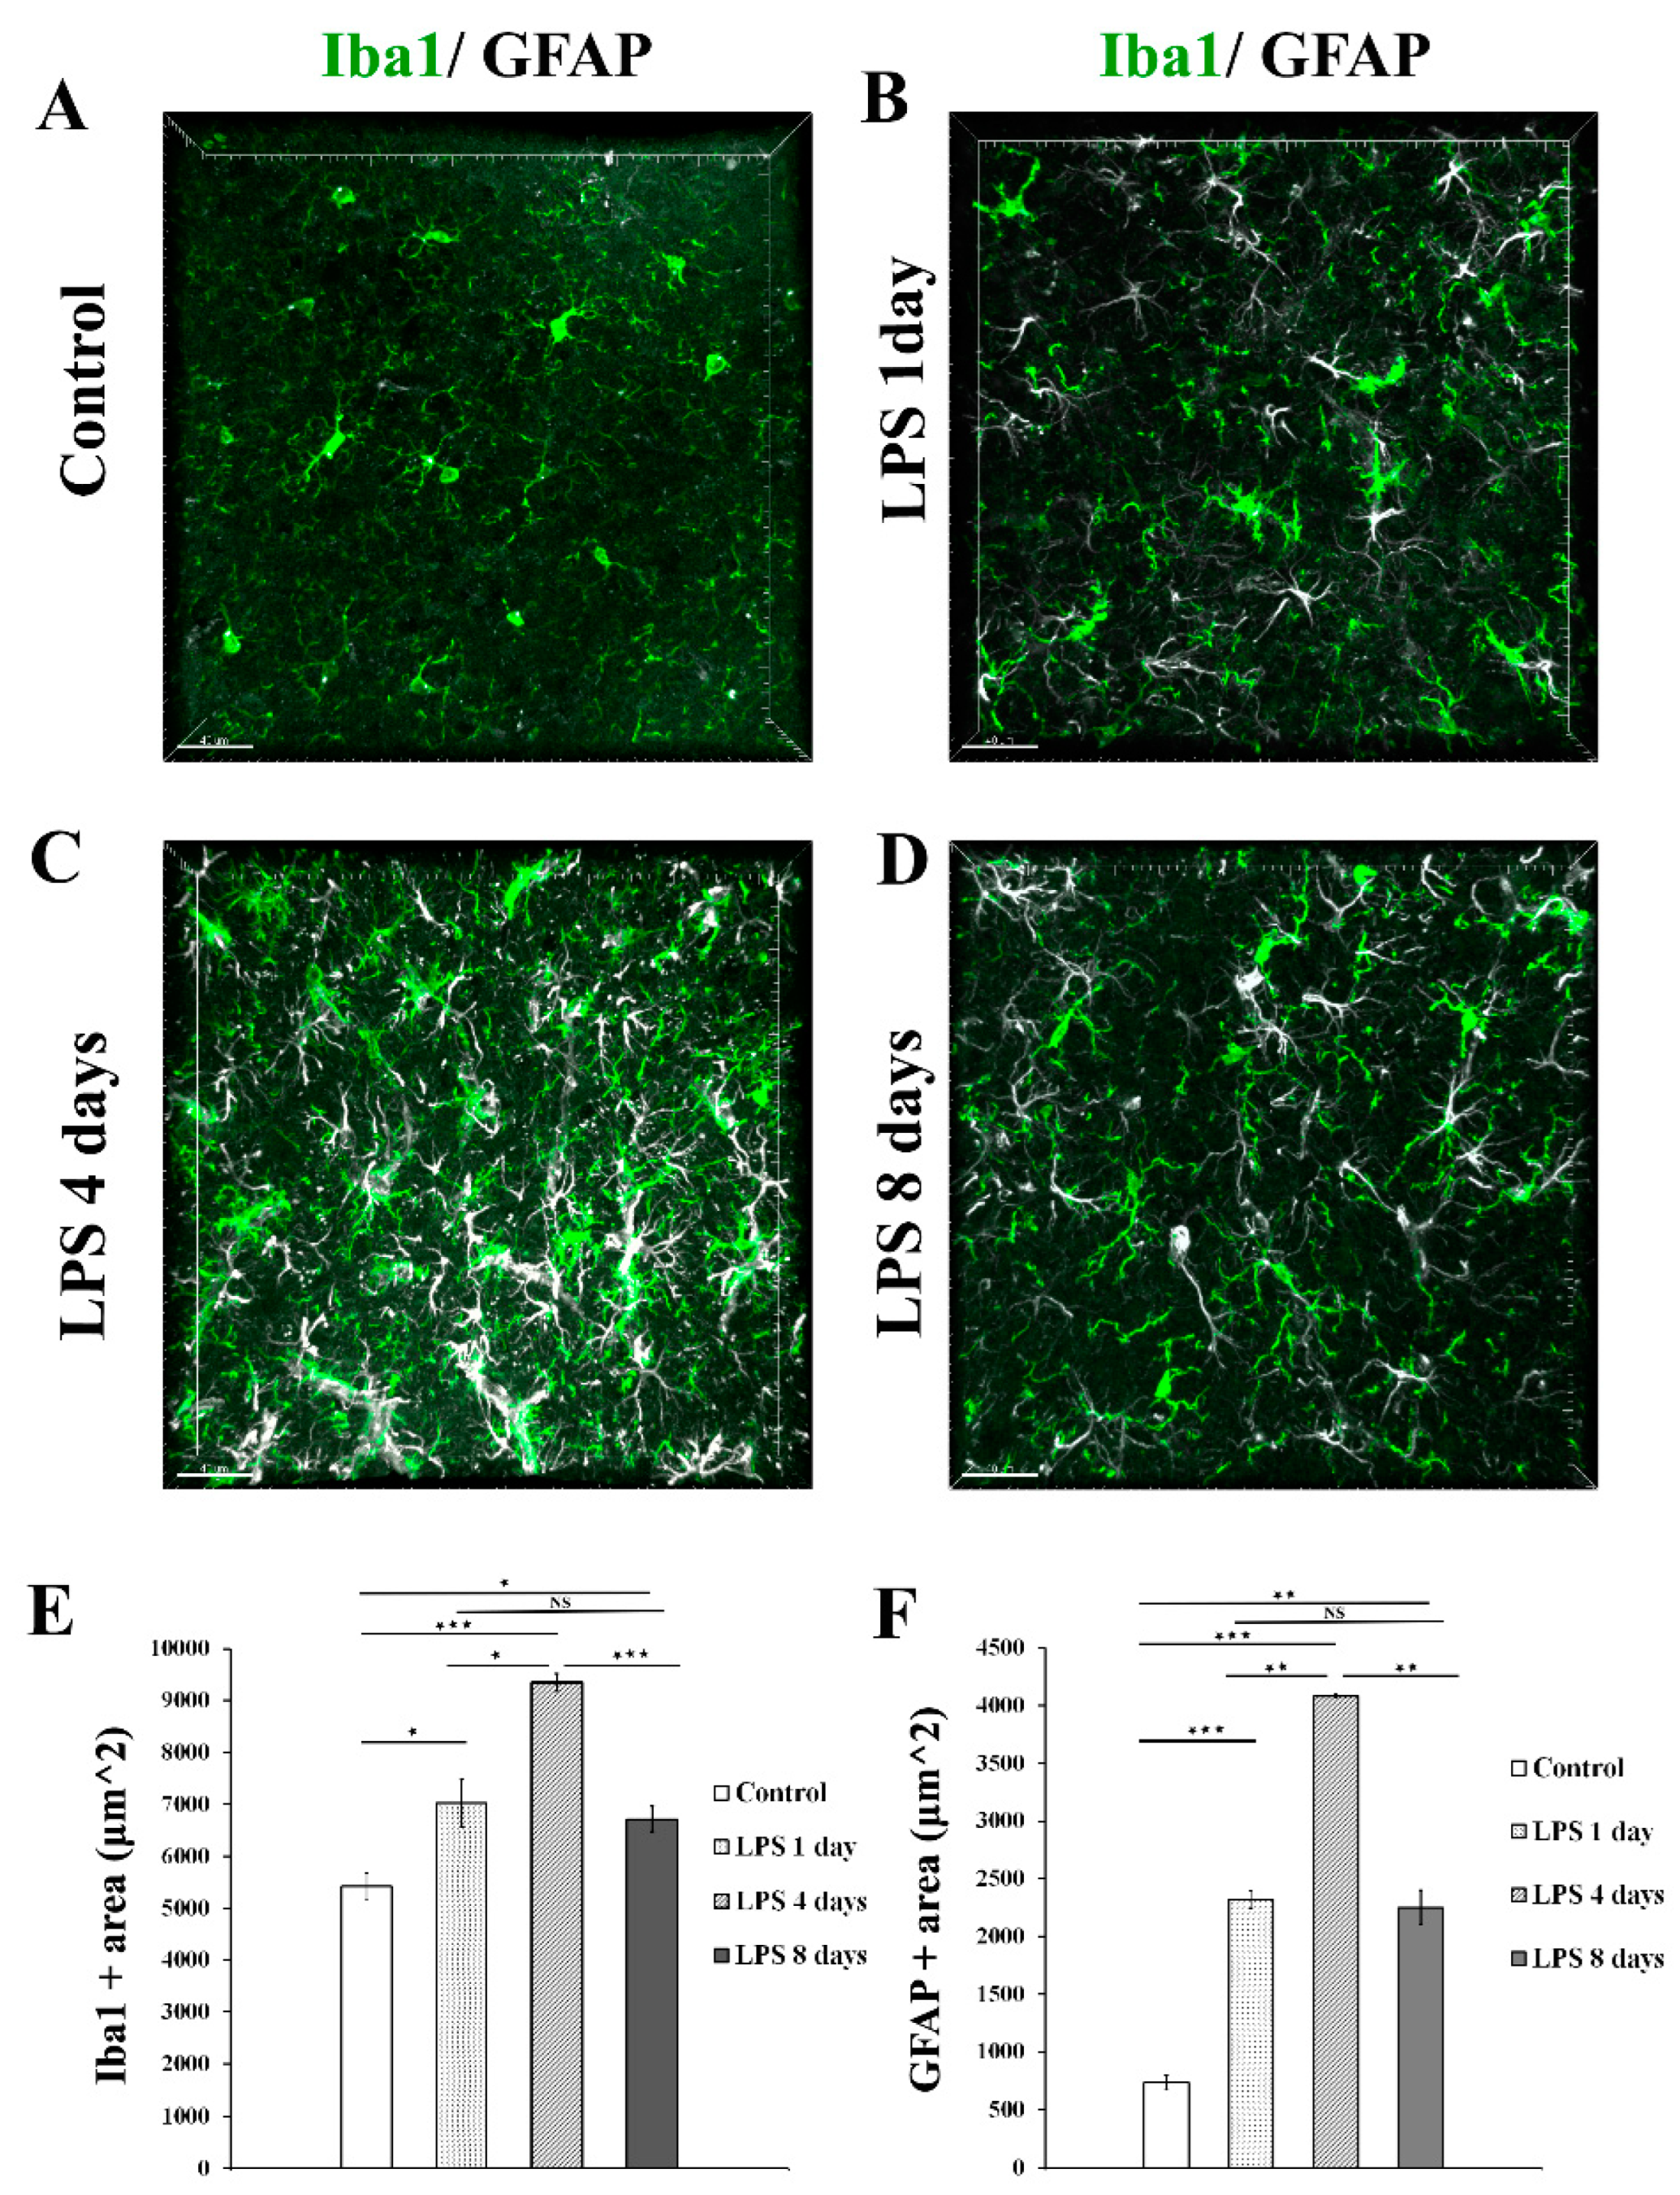
To determine the time frame during which perivascular glial cell populations, including microglia and astrocytes, become activated in response to systemically induced inflammation, we administered to 9-11 weeks old C57BL/6J mice 2 daily doses of LPS (5 mg/kg each). Animals were sacrificed 1, 4 and 8 days following the second dose of LPS administration and their brains further proceeded to immunofluorescence labelling. Immunofluorescence analysis of Iba1 and GFAP expression levels in the somatosensory cortical area at all time points revealed that both microglia and astrocytes exhibited the highest expression of Iba1 and GFAP, respectively, 4 days following LPS administration, indicating the time window of their highest activation (Figure 1A-D). More specifically Iba1 and GFAP immunopositive areas (μm2) were measured on maximum intensity projections of brain cortical z stacks as described in Materials and Methods section (Figure 1 E, F). Regarding microglia, in control mice Iba1 area was 5421 μm2 ± 263 μm2 , whereas 1 day post injection (p.i.) of LPS an increase was already evident [7025 μm2± 448 μm2]. Four days p.i. of LPS Iba1 expression further increased [9347 μm2± 171 μm2], while at 8 days p.i. of LPS the Iba1 area decreased [6718 μm2± 244 μm2]. Regarding astrocytes, in control mice GFAP area was 733.8 μm2 ± 65.7 μm2, whereas 1 day p.i. of LPS 2319 μm2 ± 79 μm2. At the LPS 4 days p.i. time-point, the GFAP area further increased to 4081 μm2± 13 μm2 , while it decreased to 2249 μm2± 149 μm2 8 days p.i. of LPS administration.
Figure 1.
Time course of astrocytes and microglia activation following LPS induced inflammation. (A-D) Immunofluorescence staining for microglia (Iba1-green) and astrocytes (GFAP-white) in the cortex of C57BL/6J mice cortical brain slices, showed the highest Iba1 and GFAP expression levels at 4 days after LPS injection. Images were acquired with a Leica TCS SP5 confocal microscope using a 40x objective. (E-F) Quantification of Iba1 (E)and GFAP (F) immunopositive area (μm2) in maximum intensity projections in control (n=4), LPS day 1 (n=3), LPS day 4 (n=4) and LPS 8 days (n=4). (E) Control vs LPS 1 day p=0.05, control vs LPS 4 days p=0.00005, LPS 4 days vs LPS 8 days p=0.0003. (F) Control vs LPS 1 day p=0.0001, control vs LPS 4 days p=0.00001, LPS 4 days vs LPS 8 days p=0.006 Scale bar: 40μm.
Following confocal analysis, we established a protocol of 2-photon intravital imaging of the cortex of transgenic mice expressing fluorescently labeled proteins in the microglial or astrocytic cell populations following systemic administration of 2 daily doses of LPS, to monitor in real time the dynamic response of microglia and astrocytes to systemically induced inflammation (Figure 2A).To this end, Cx3cr1-EGFP and hGFAP-ECFP transgenic mice were subjected to a surgical operation for establishment of a cranial window and 3 weeks later they were anaesthetized and their cortical microglia and astrocytes were imaged by 2-photon microscopy under control conditions. For each of the next two days (day -1 and day 0) the same mice received 5mg/kg of LPS and were imaged at days 4 and 8 after the second dose of LPS injection. The acquired image z-stacks were analyzed using Fiji-based custom-made macros that allowed quantification of microglial and astrocytic 3D cell body volume as well as the extent of contact with blood vessels in multiple image data sets.
Figure 2.
LPS-induced inflammation results in changes in microglia cell body volume and morphology. (A) Protocol of brain intravital 2-photon imaging following LPS systemic administration. At week 0 a cranial window surgery was performed in 6-8 week old Cx3xr1-EGFP or hGFAP-ECFP transgenic mice. Three weeks after surgery, imaging experiments of untreated control animals were performed, in order to eliminate inflammation caused by the cranial window surgery. The next two sequential days mice were injected with LPS (5 mg/kg) and imaging was performed at 4 days and 8 days after the second dose (LPS day 4 and LPS day 8 time points). (B-D) Two-photon magnified images of Cx3cr1-EGFP microglial cells (green) associated with blood vessels marked with Rhodamine B dextran (red). B) An untreated control animal, imaged 3 weeks after cranial window surgery. C) The same animal imaged 4 days after LPS administration D) The same animal imaged 8 days after LPS administration. E) Bar graph presents quantification of the mean volume of the microglial cell soma in the three time points. Multiple images from Cx3cr1-EGFP mice (n=5) were analyzed. **P < 0.01, and ***P < 0.001. Scale bar: 7 μm.
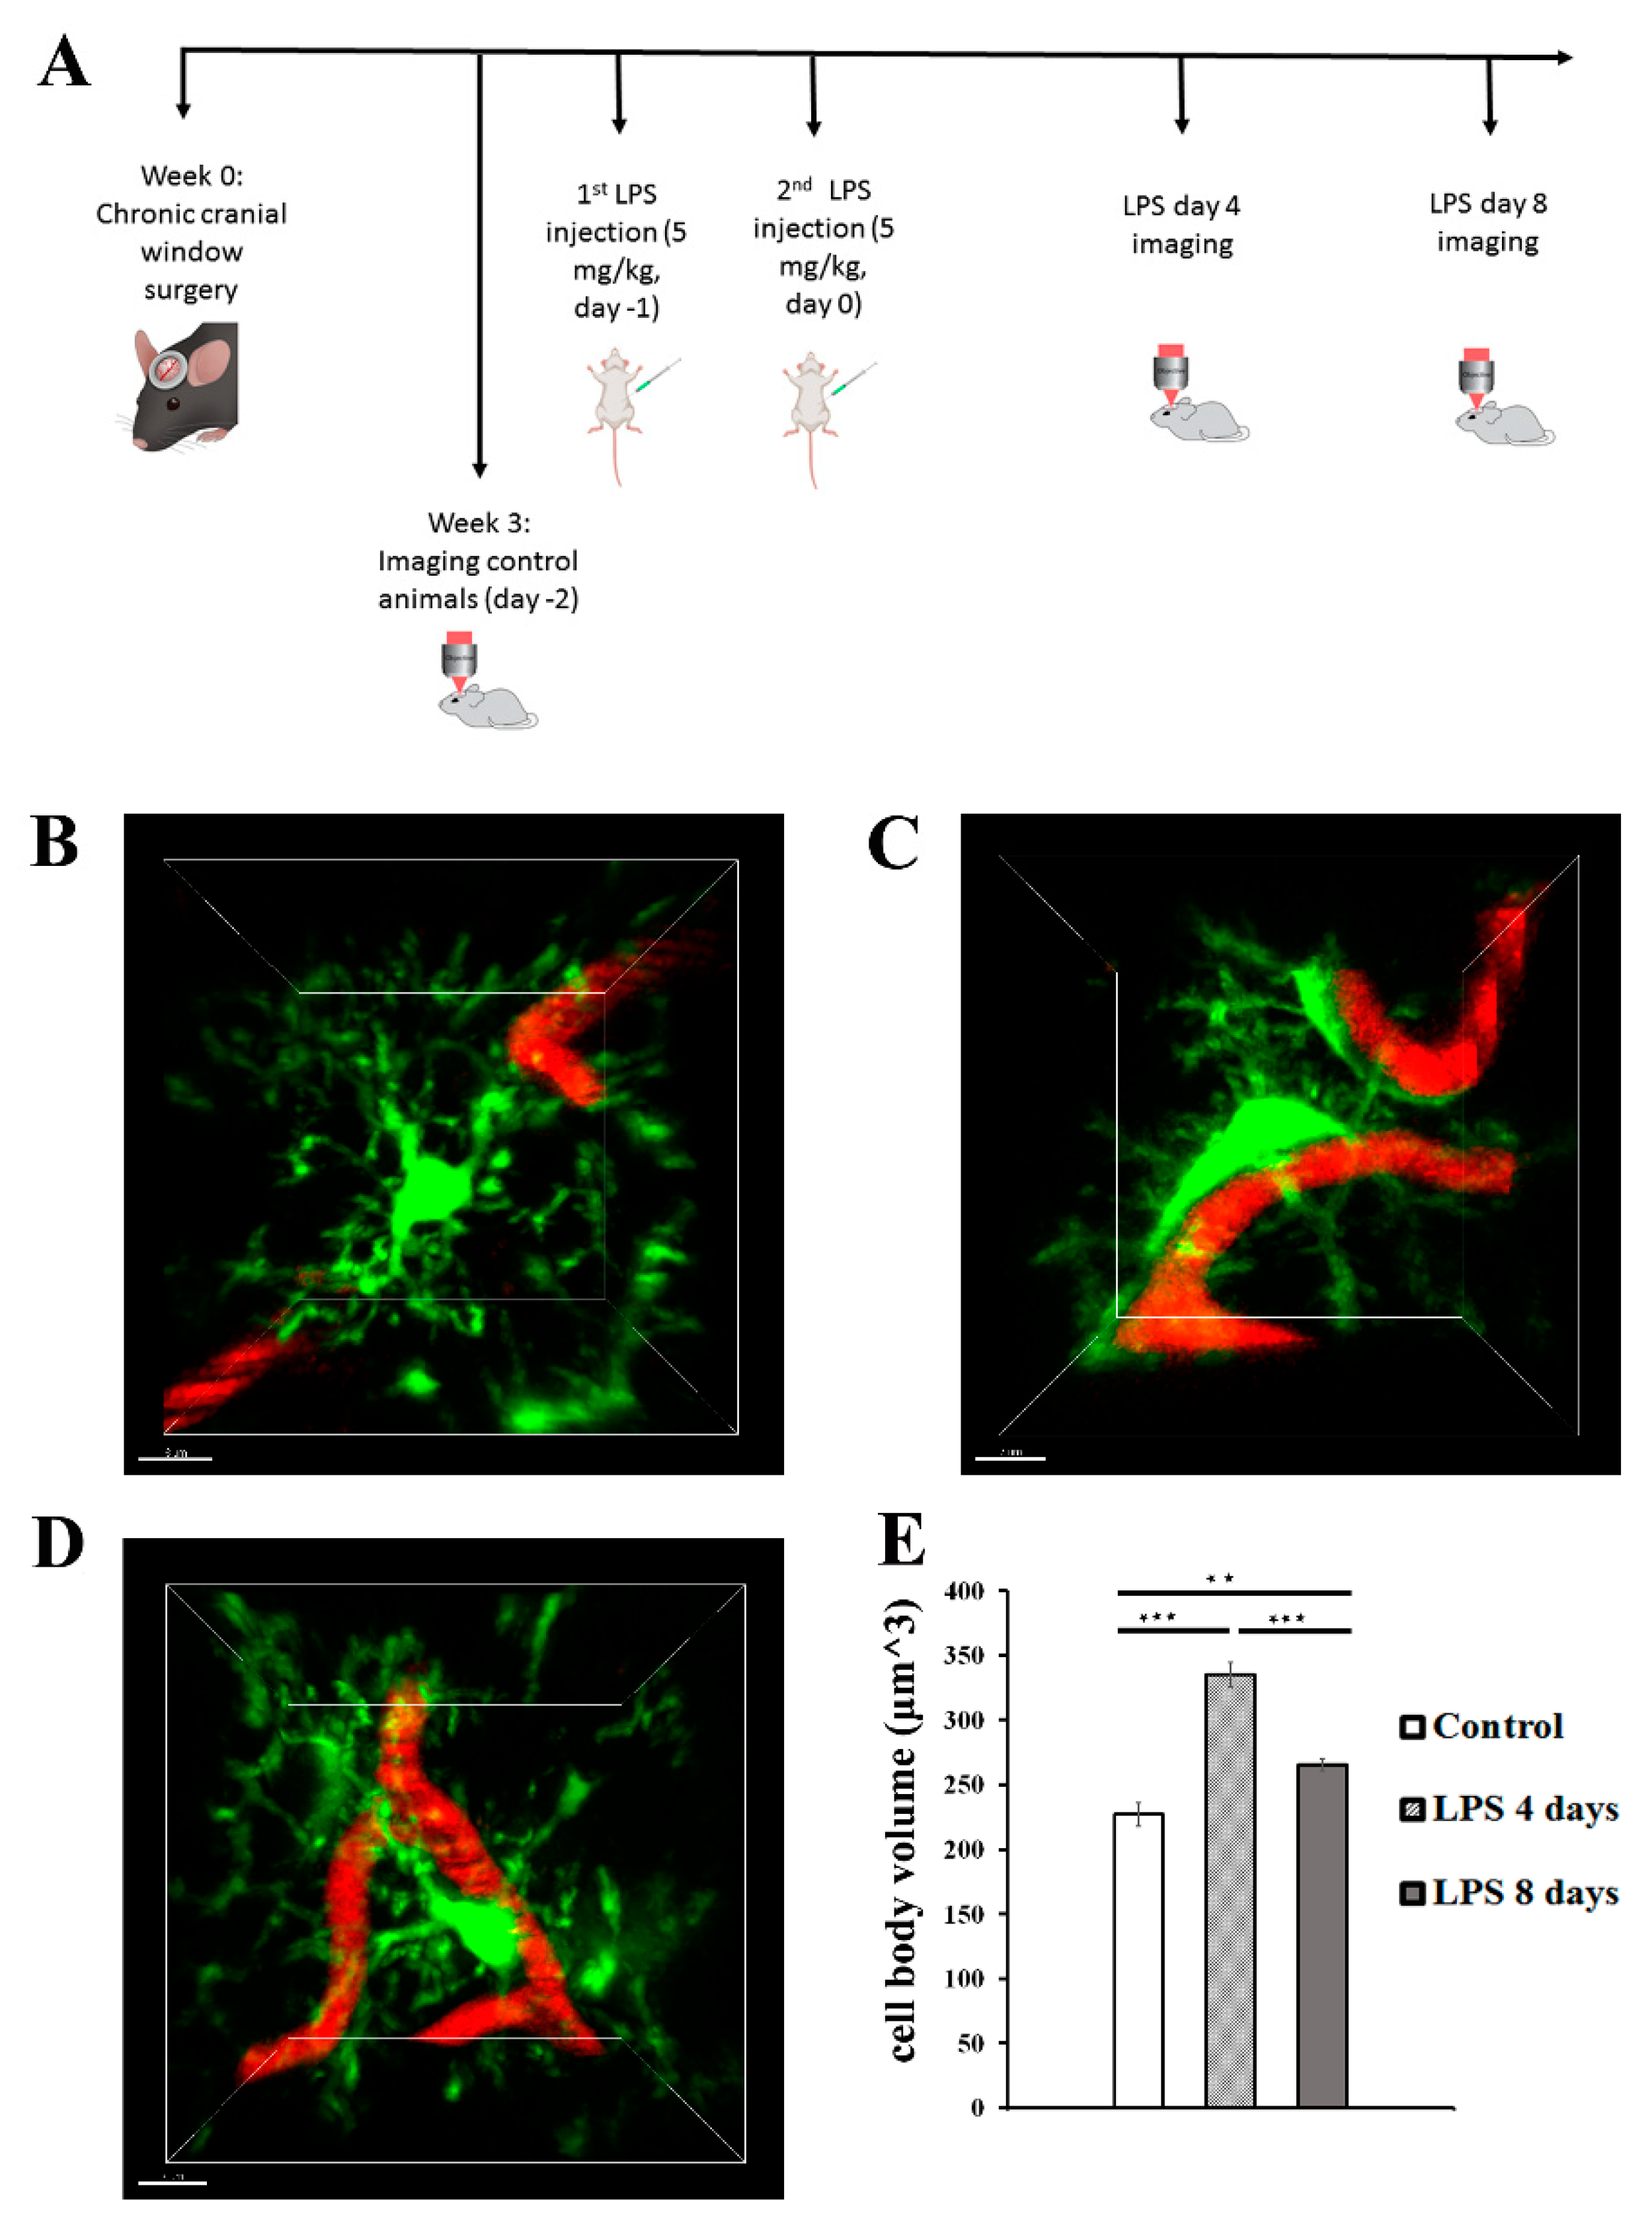
2-photon imaging at 4 days p.i. of LPS revealed the microglial cell response to LPS-inflammation in greater detail, with microglia exhibiting morphological alterations indicative of an activated state, by becoming hypertrophic and acquiring a less ramified amoeboid-like elongated morphology (Figure 2B-D). More specifically data obtained from 5 Cx3cr1-EGFP mice showed a significant increase of the cell body volume by 47. 6% (from 226.9 ± 8.9μm3 to 334.9 ± 9.7 μm3) 4 days p.i. of LPS as compared to control conditions (Figure 2B-C, E). At the same time microglia cell bodies were observed in close proximity to blood vessels (Figure 2B, C, D; Video S1 for LPS day 0 and Video S2 for LPS day 4). Microglia activation was lower but persistent at 8 days p.i. of LPS, as indicated by the statistically significant decrease of microglial cell body volume (265.4± 4.5 μm3) in comparison to 4 days p.i. of LPS (Figure 2B-E); which however didn’t appear to return to control levels, as cell body volume was still increased by 16.9% as compared to control cell body volume (Figure 2E; Video S3). We also observed a relative restoration of ramified morphology and lower extent of contact with blood vessels as compared to 4 days p.i, (Figure 2C, D; Video S2).
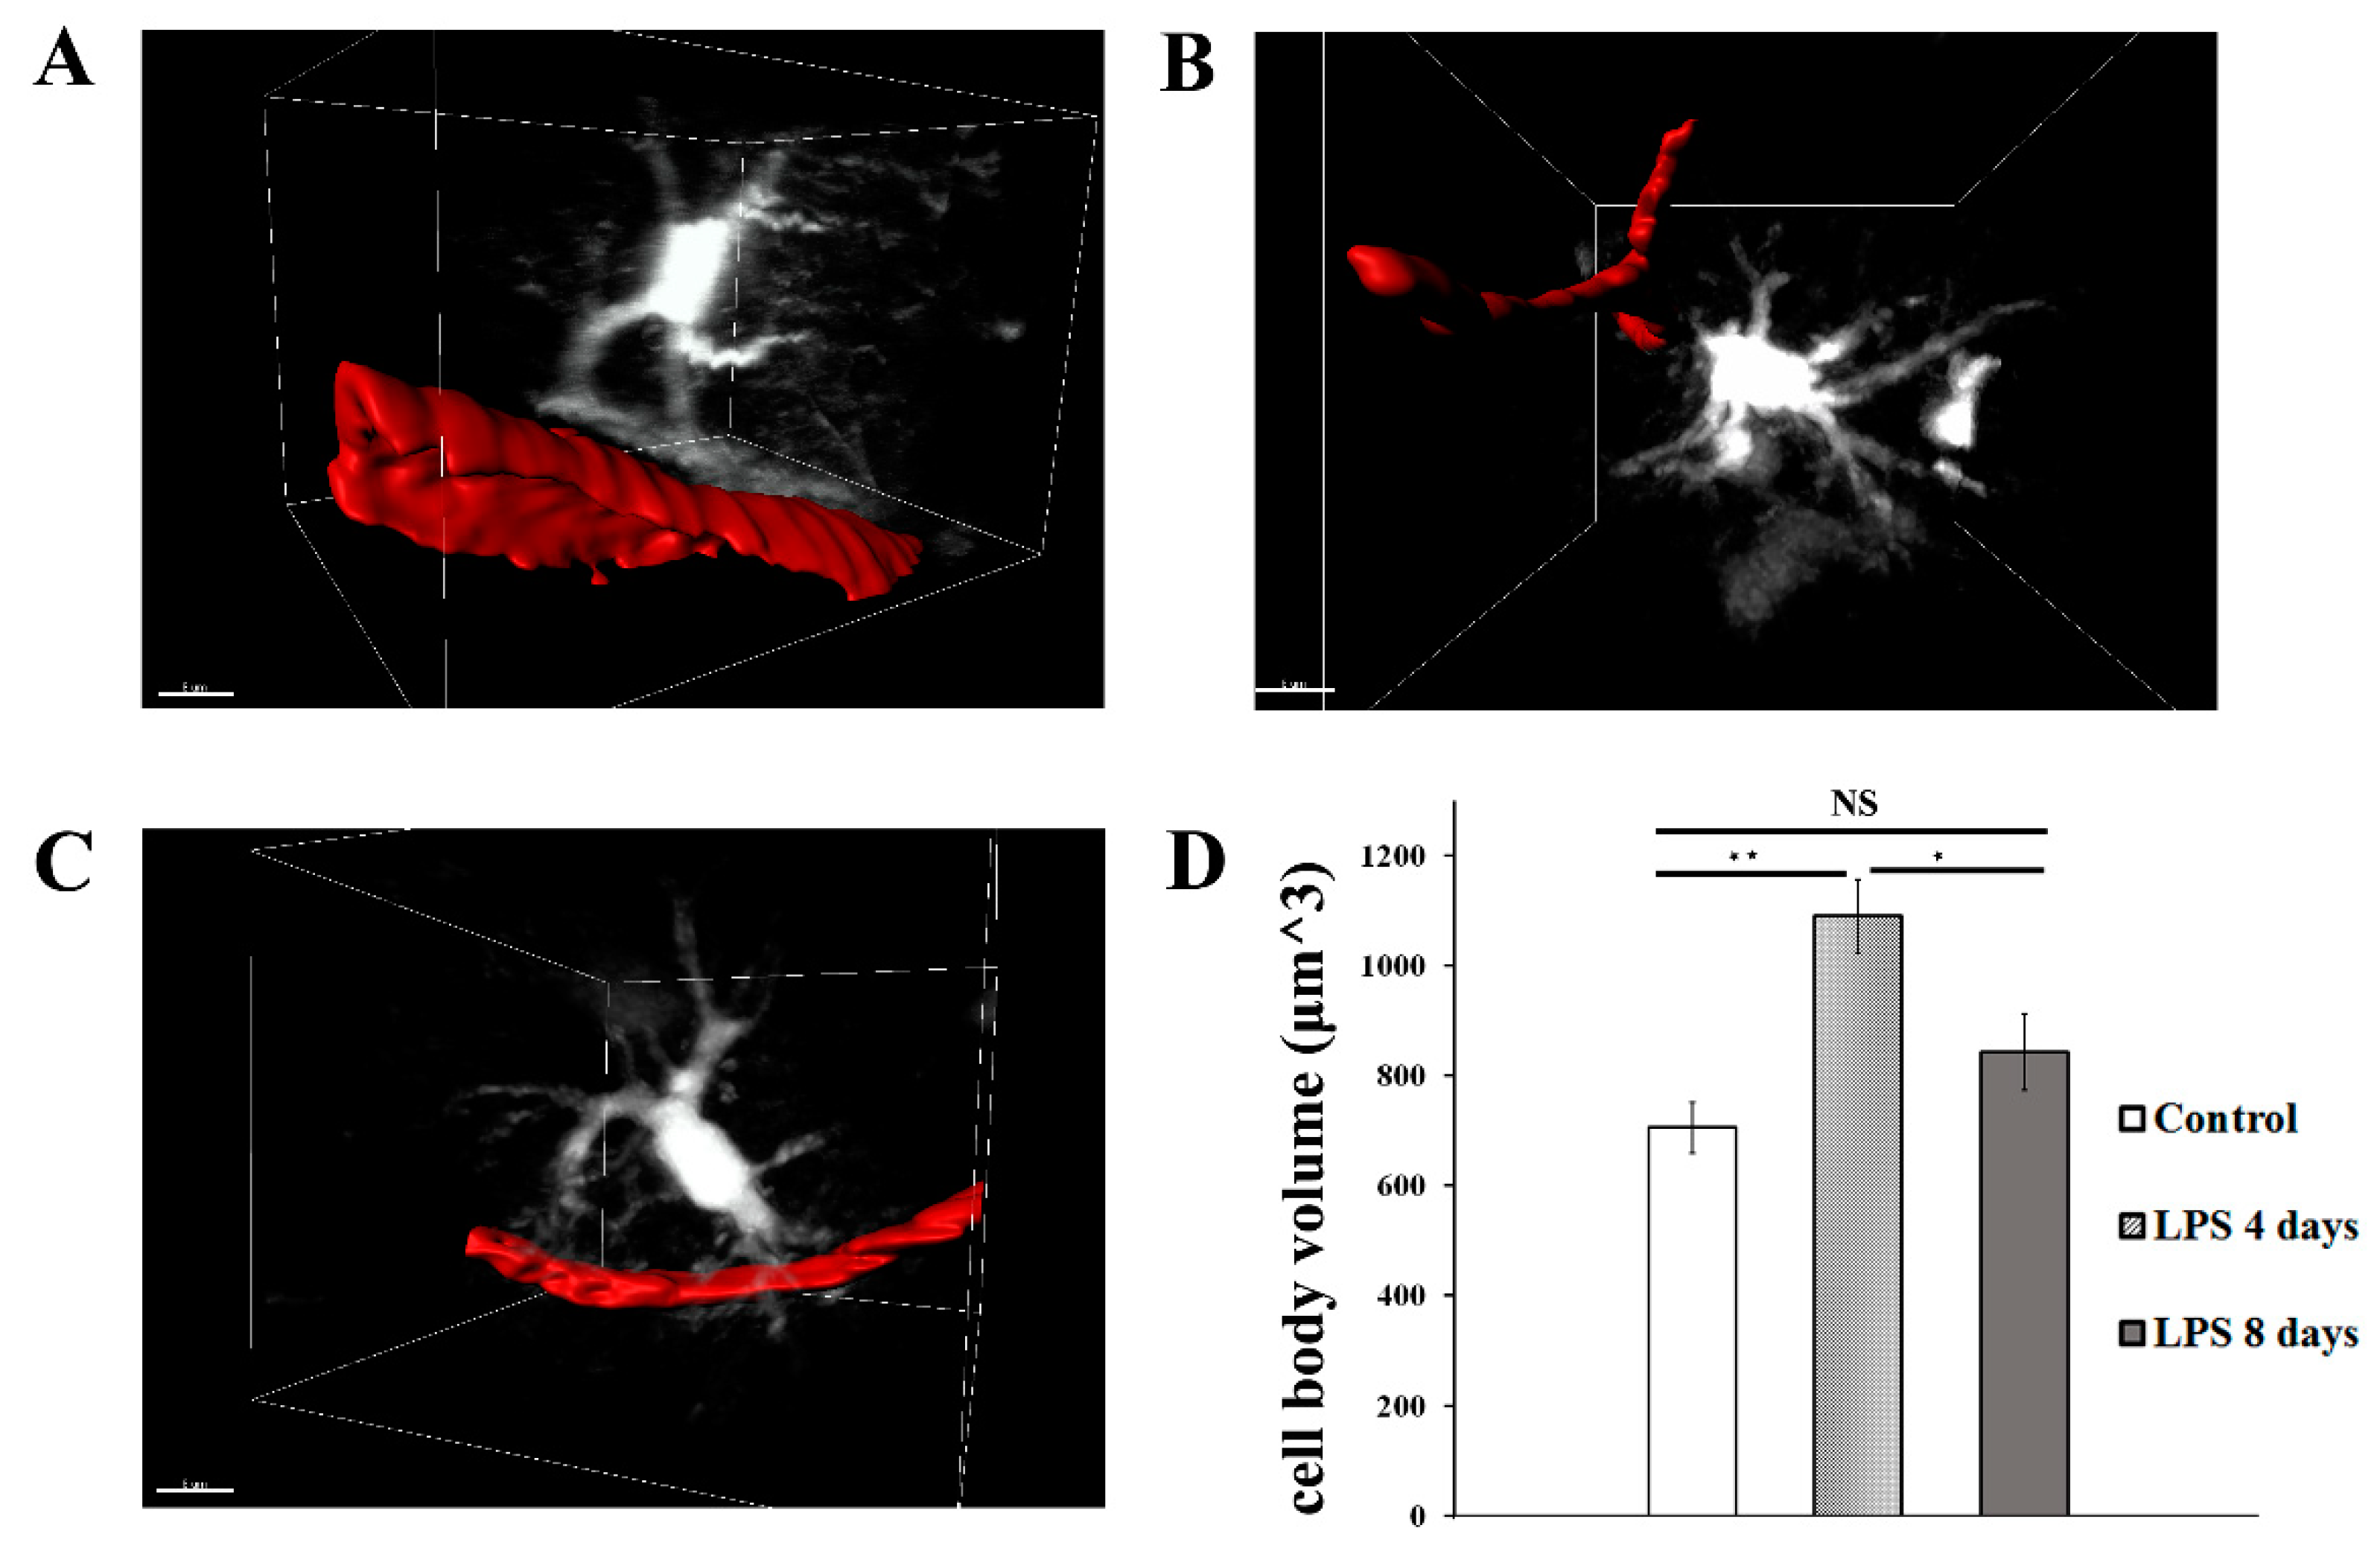
LPS administration also induced a significant increase in astrocytic cell body volume 4 days p.i. indicative of astrocytic activation, which was accompanied by retraction of astrocytic endfeet from blood vessels (Figure 3A, B, D; Video S4 for LPS day 0, Video S5 for LPS day 4), with data obtained from 5 hGFAP-ECFP transgenic mice showing a 54.5% increase of the cell body volume (from 704.8 ± 45.5 μm3 to 1089 ± 66.8 μm3). Astrocytic cell body volume significantly decreased by 22.6% 8 days p.i of LPS (842.8 ± 69 μm3), as compared to 4 days p.i of LPS, and becoming not significantly higher than in control animals (Figure 3C, D; Video S6).
Figure 3.
LPS induced inflammation results in changes in astrocytes cell volume and morphology. 2-photon magnified images of hGFAP-ECFP astrocytes (white) associated with blood vessels marked with Rhodamine B dextran (red). For visualization purposes blood vessels are highlighted with a surface created with Imaris. A) An untreated control animal, imaged 3 weeks after cranial window surgery. B) the same animal imaged 4 days after LPS administration. C) the same animal imaged 8 days after LPS administration D) Bar graph presents quantification of the mean volume of the astrocytic cell soma in three time points. Multiple images from hGFAP-ECFP mice (n=5) were analyzed. *P < 0.05, **P < 0.01, NS not significant. Scale bar 8 μm.
3.1.2. Astrocytic endfeet reduce their close proximity to blood vessels following LPS-induced neuroinflammation
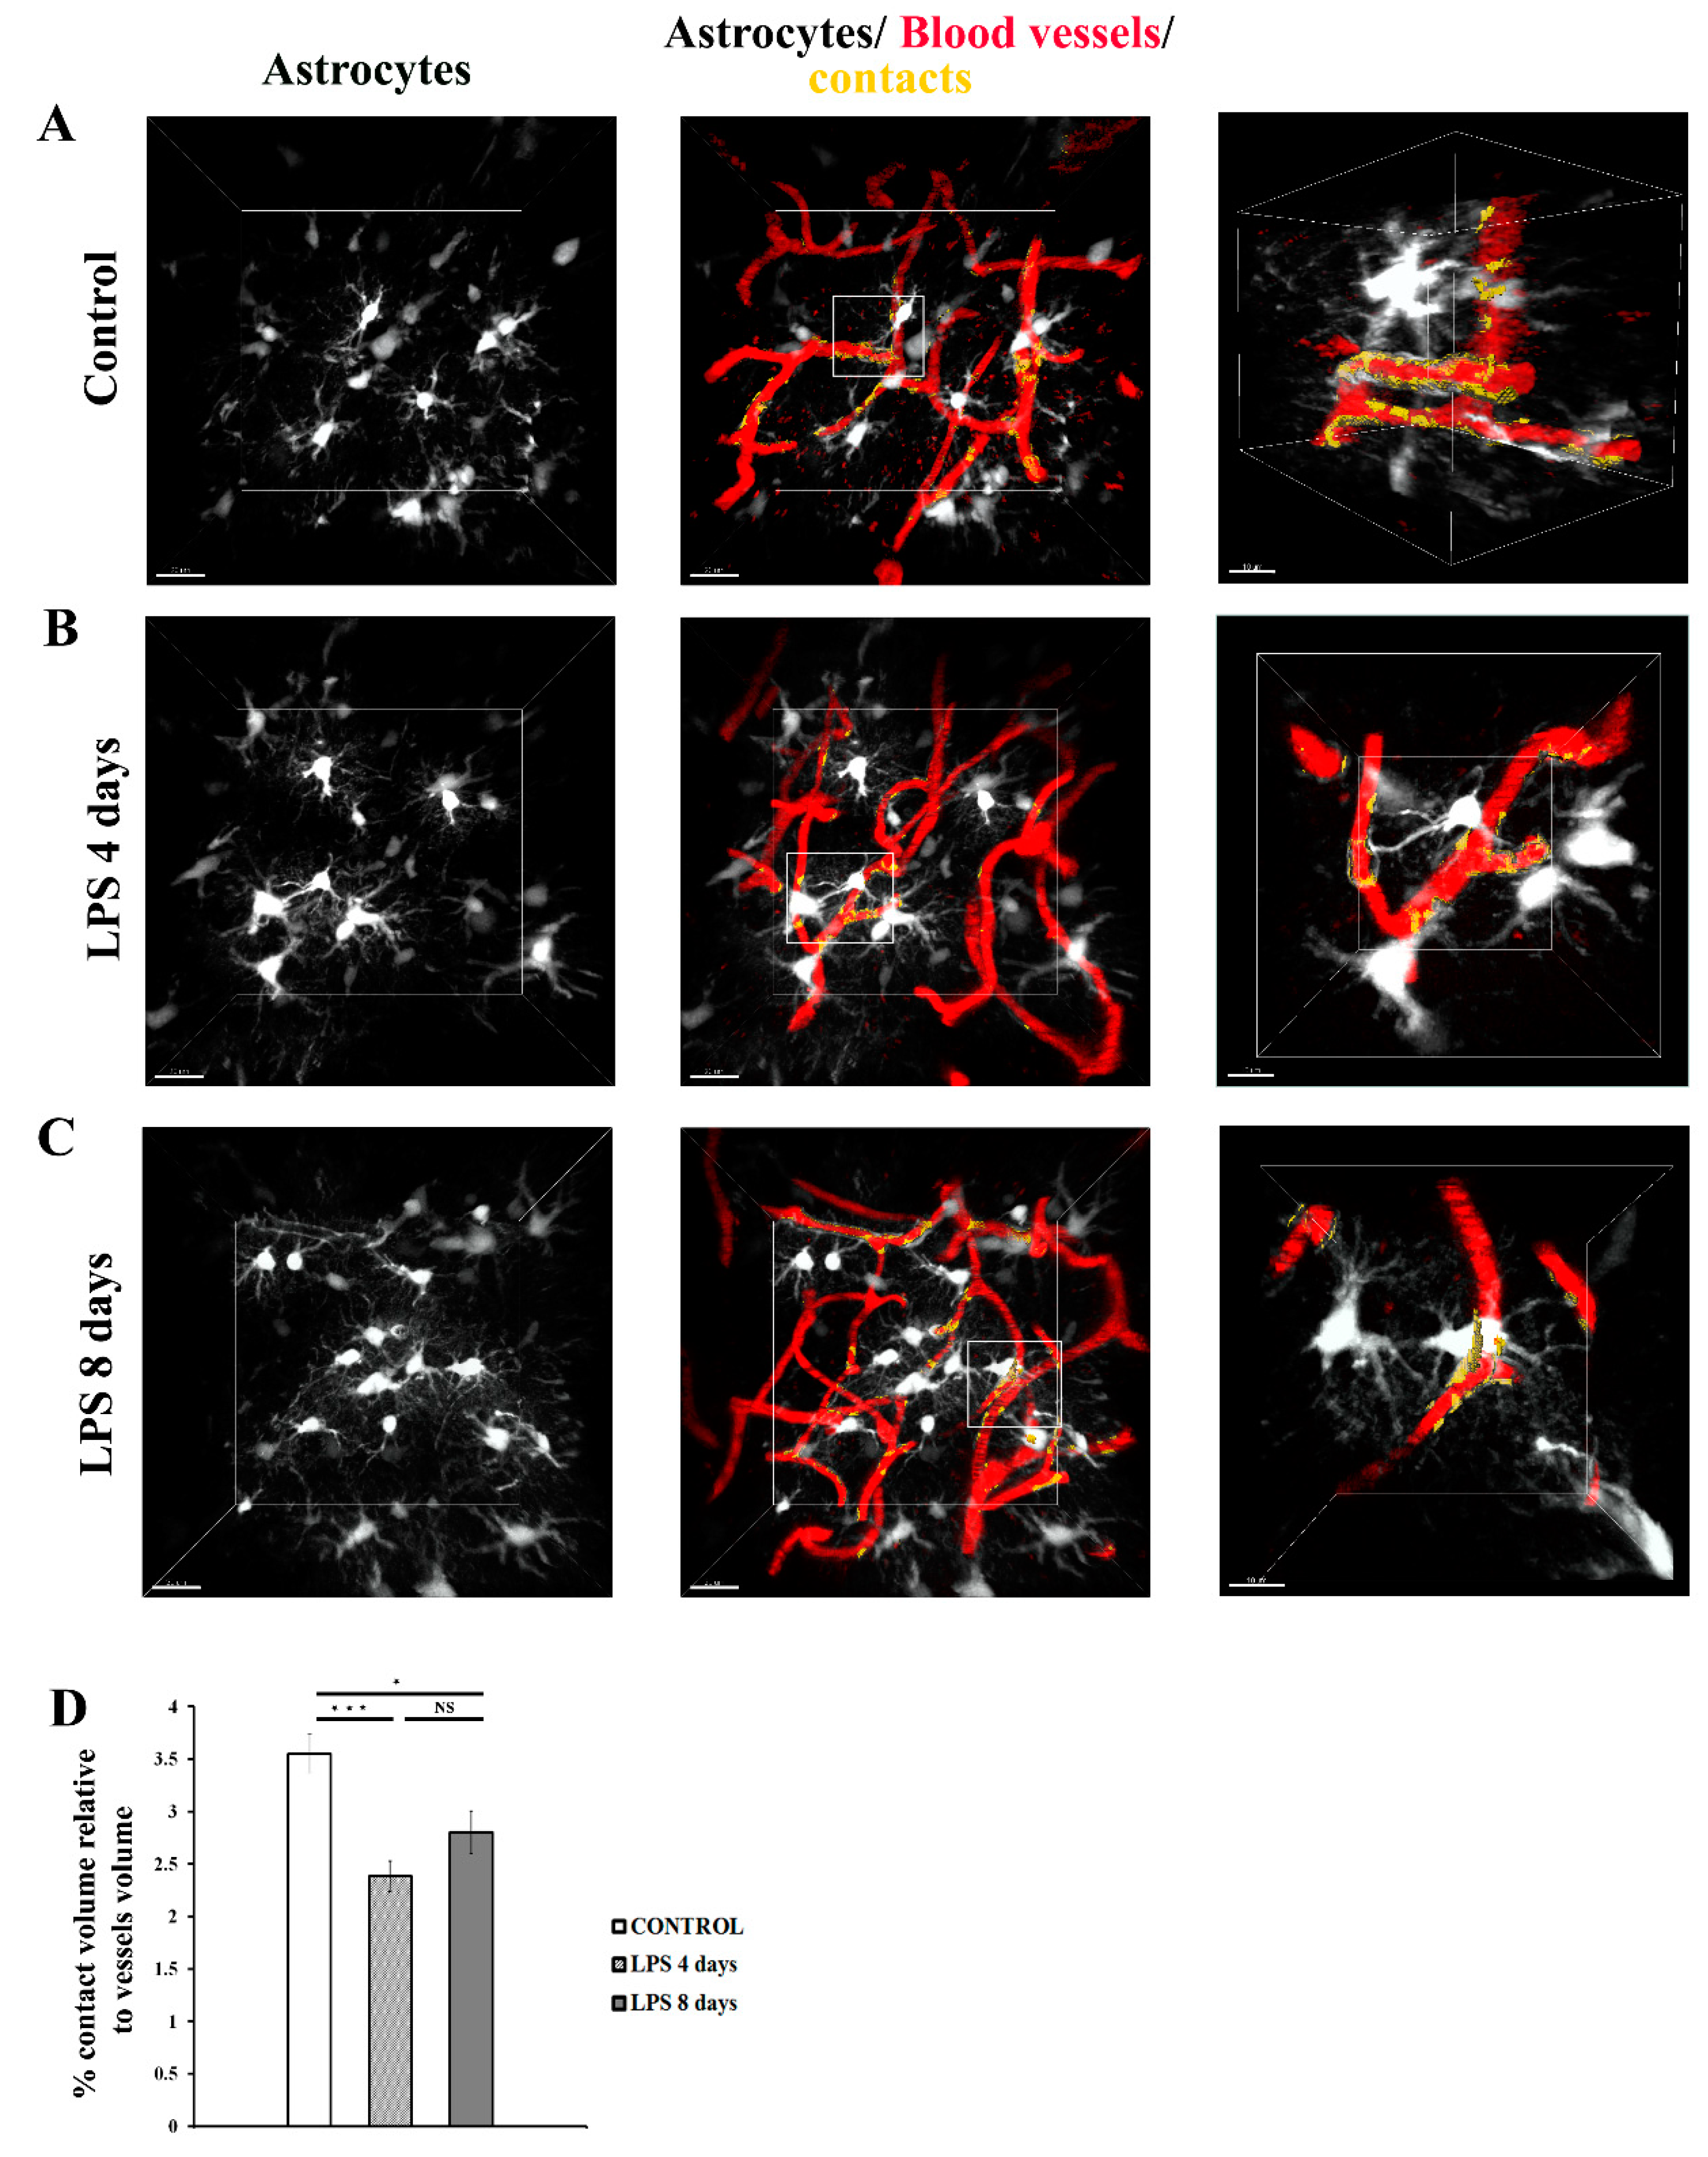
Analysis of 3D intravital imaging data derived from Cx3cr1-EGFP and hGFAP-ECFP mice indicated that LPS systemic administration induced dynamic changes in the contact of both perivascular microglia and astrocytes with the blood vessels. To quantify in real time the extent of contact of each of the two cell populations with the cortical vasculature, we developed a Fiji macro to measure contact volume (of either astrocytes or microglia) to blood vessels volume in a batch mode in multiple image data-sets. Measurements of astrocytes-vessels contact volume relatively to total volume of vessels (illustrated in yellow) in hGFAP-ECFP mice (Figure 4A-C) point to a significant decrease in the contact of astrocytes to the vasculature at 4 days p.i. of LPS by 32.9% as compared to the control condition, confirming our original observation, a phenomenon which was not significantly reversed 8 days p.i. of LPS (Figure 4D).
Figure 4.
Dynamic changes in the contact of astrocytic endfeet with blood vessels following LPS-induced inflammation. 2-photon image z stacks from a single hGFAP-ECFP transgenic mouse demonstrate astrocyte retraction from cerebral vessels during systemic inflammation induced by two doses of LPS (5mg/kg each). The left column shows astrocytes depicted in white, the middle column shows astrocytes, blood vessels (in red) and their contacts (in yellow). The right column shows magnified images of the region indicated in the main panel (scale bar 10 μm). A) An untreated control animal, imaged 3 weeks after cranial window surgery. B) the same animal imaged 4 days after LPS administration. C) the same animal imaged 8 days after LPS administration. Scale bar, 20 μm. D) Bar graph presents quantification of the percentage of the contact volume (between astrocytes and the vessels) relative to the vessels volume (n=5). Quantification was performed using a customized Fiji macro, as described in Materials and Methods section. NS not significant. *P < 0.05, ***P < 0.001. Visualization of contact areas was performed using Imaris software.
To further explore this finding, which is indicative of a less efficient enwrapping of blood vessels by astrocytic endfeet following LPS administration, we investigated the localization pattern of the water channel AQP4, known to be localized in astrocytic endfeet under physiological conditions [
18]. Immunohistochemical labelling of the cortex of C57BL/6J mice using antibodies against AQP4 and CD31 to label blood vessels, revealed that in control animals the percentage of the surface contact area between AQP4 and blood vessels, relative to the surface area of blood vessels is 13.2± 0.6 %
(Figure 5A-C). This value got severely reduced by 54% 4 days p.i. of LPS and remained low 8 days p.i LPS injection [control: 13.2% ± 0.6%, 4 days LPS: 6.06% ± 0.6%, 8 days LPS: 7.48% ± 0.5%],
(Figure 5D). These findings further corroborated reduced physical contact between astrocytes and the blood vessel surface as found by 2-photon imaging experiments, and jointly indicate a loosening of the enwrapping of blood vessels by astrocytic endfeet following LPS administration. In parallel with reduced AQP4+ endfeet physical contact with vessels, a significant reduction in overall AQP4 expression levels was evident both at 4 and 8 days p.i. of LPS as compared to control conditions (
Figure 5E). AQP4 volume in control: 6480 ± 408 μm
3, LPS 4 days: 2875 ± 385 μm
3, LPS 8 days: 3772 ± 444 μm
3), indicating that that of LPS-induced inflammation results in reduction of both diffused and polarized astrocytic endfeet AQP4 expression.
3.1.3. Activated microglia processes enwrap blood vessels following LPS-induced neuroinflammation
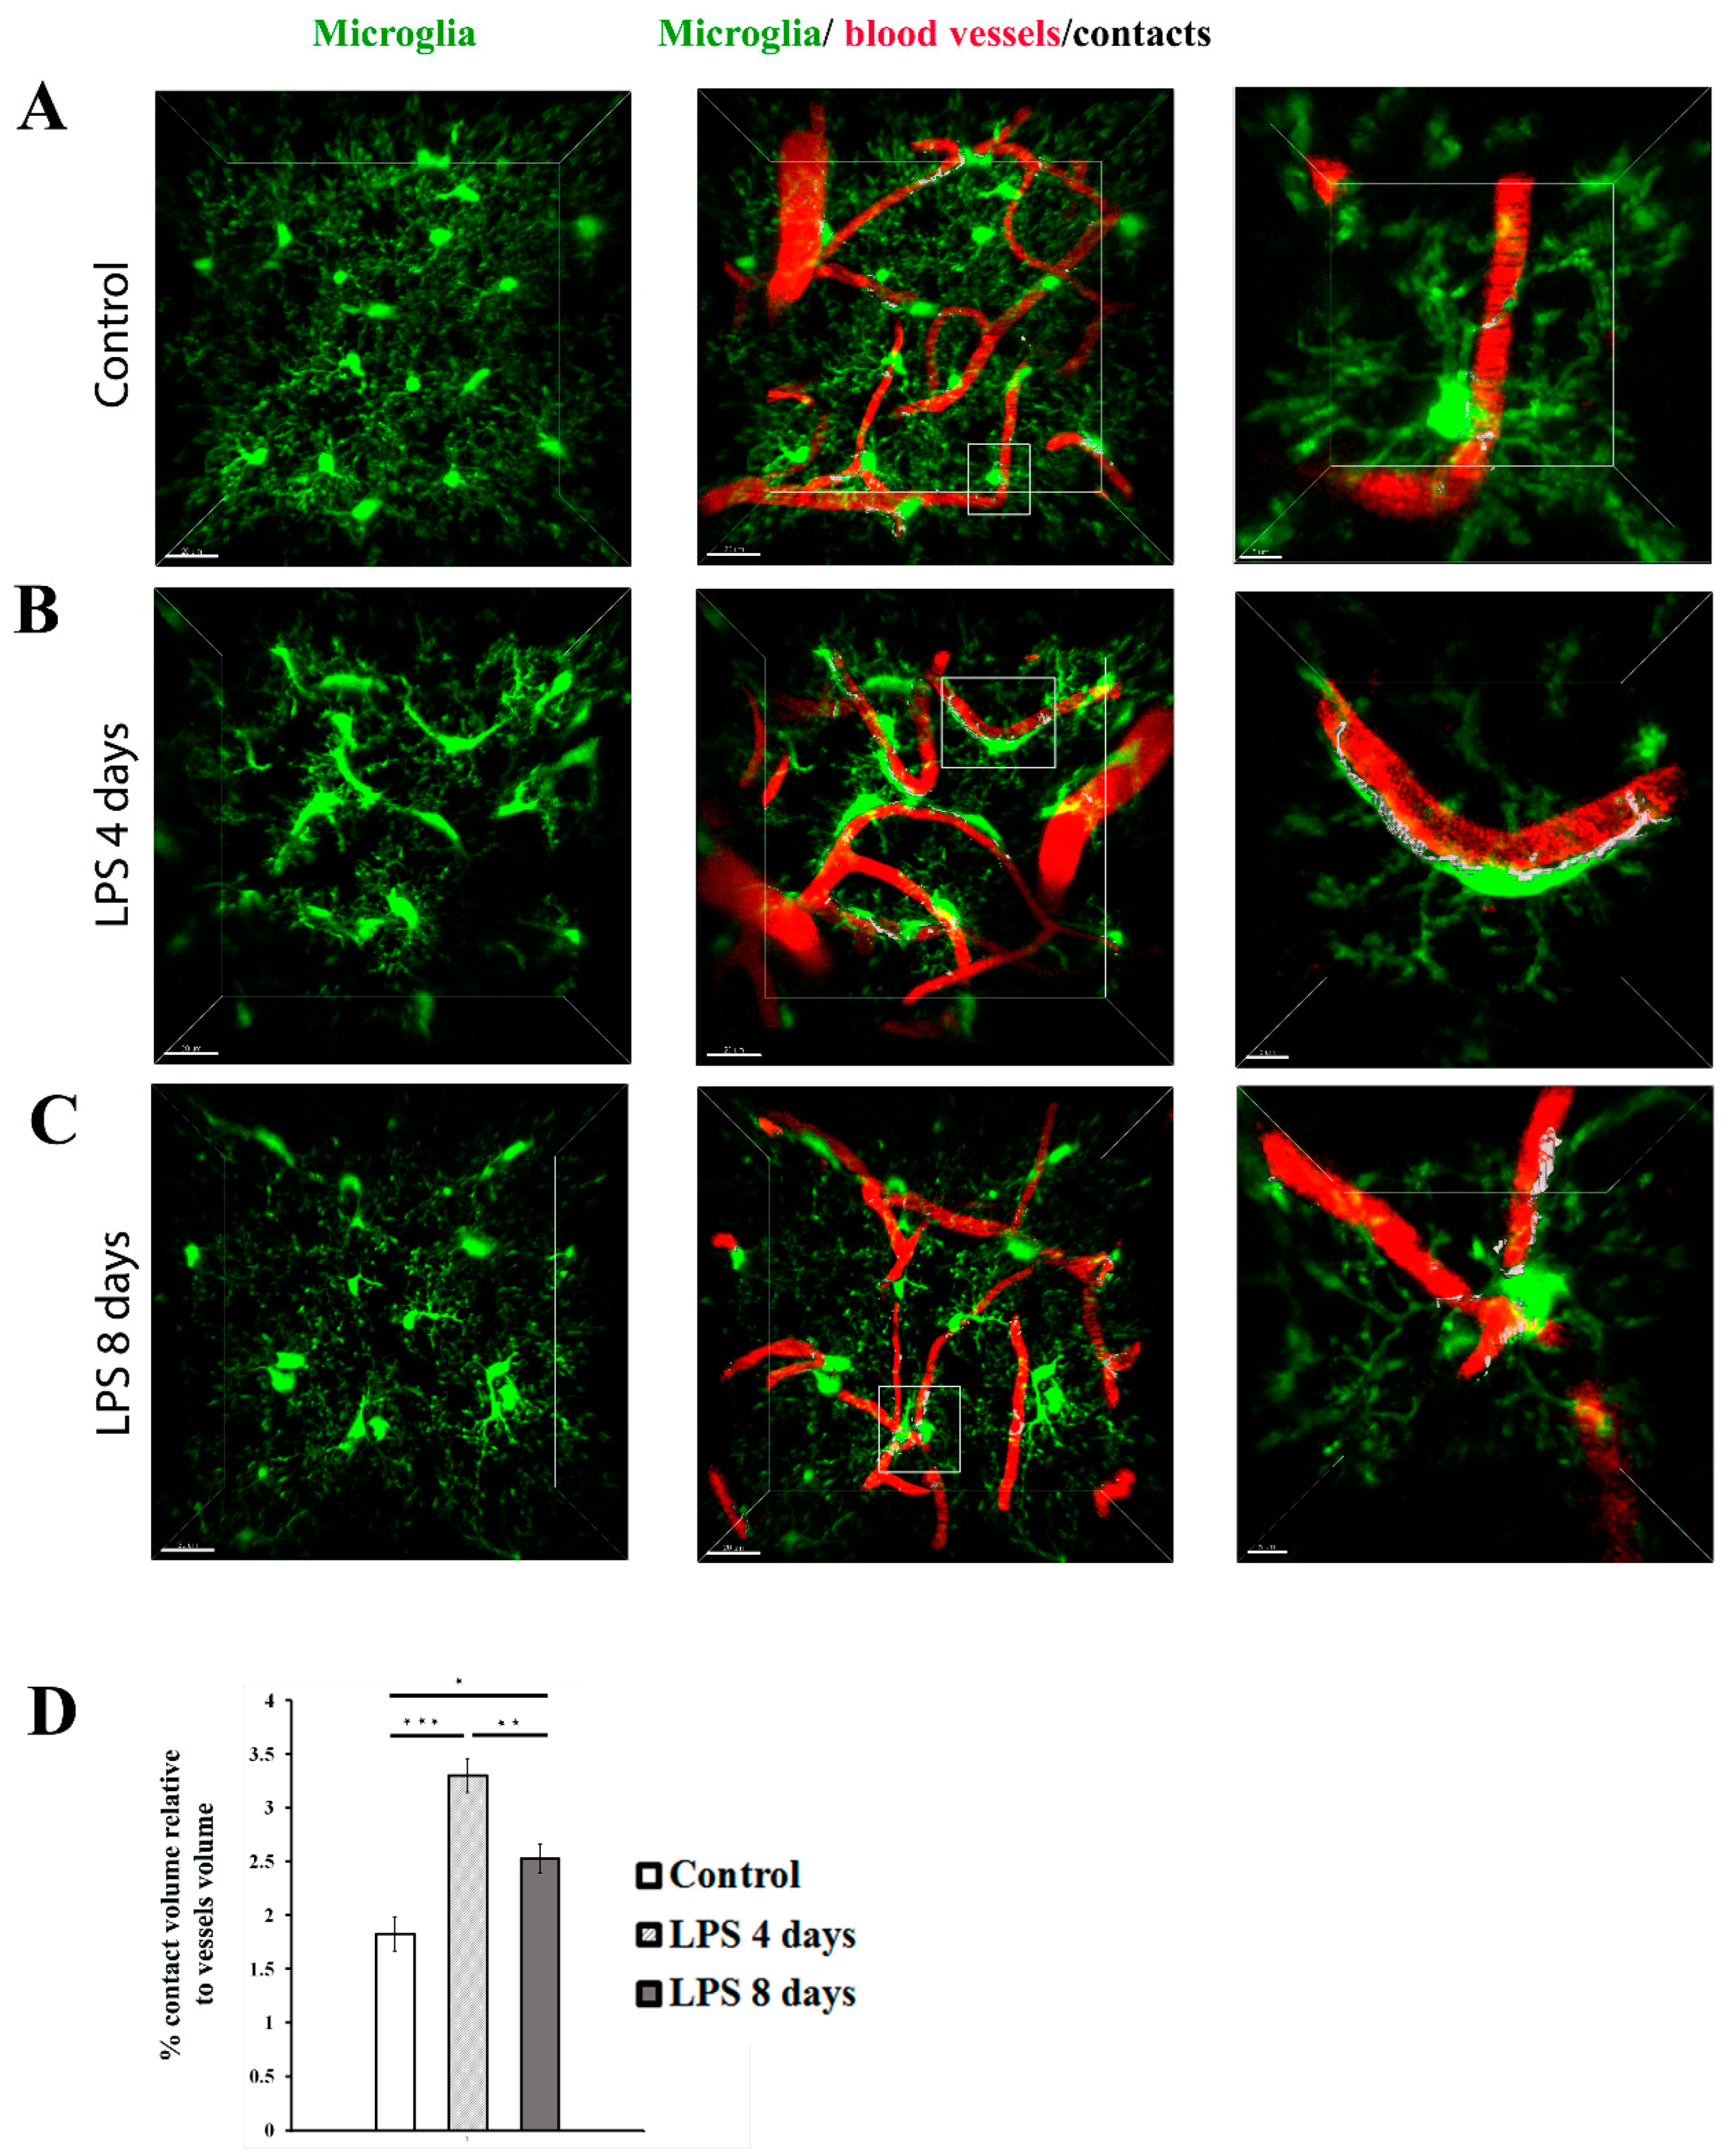
To estimate the dynamic interactions of microglia with blood vessels in our model, we measured the percentage of the microglia-vessels contact volume relatively to the total volume of vessels (illustrated in white) in Cx3cr1-EGFP transgenic mice (Figure 6A-C). Our data indicated that in contrast to astrocyte-vasculature interactions, activated microglial cells exhibited a significant increase in their contacts with the vasculature 4 days p.i. of LPS in comparison to control animals (3.29 ± 0.15% vs 1.82 ± 0.15%, Figure 6D). This increase in microglia-vessel contact volume was partially reversed -in LPS day 8 (2.53± 0.13%), however without returning to control levels.
Figure 5.
Expression of AQP4 in astrocytic endfeet following LPS-induced inflammation. Confocal images from C57BL/6J mice (9-11 weeks old) brain slices acquired with 40x objective using a Leica TCS SP8 confocal microscope. The brain slices were immunolabelled for AQP4 (green) showing astrocytic endfeet, and CD31 (red) showing blood vessels. Scale bar, 30 μm. Contact areas between astrocytic endfeet and the blood vessels are shown in white colour in the third column. The right column shows magnified images of the region indicated in the main panel (scale bar 10 μm). A) Control animal, which received sterile physiological saline i.p. B) mouse injected with 2 doses of LPS (5 mg/kg, i.p. each) for 2 consecutive days and was sacrificed at LPS day 4 time-point, and C) mouse injected with 2 doses of LPS (5 mg/kg, i.p. each) for 2 consecutive days and was sacrificed at LPS day 8 time point. D) Quantitative analysis of the percentage of the surface contact area (between blood vessels and AQP4) relative to the total surface area of the blood vessels in control (n=3), LPS 4 days (n=3) and LPS 8 days (n=3). **P < 0.01, NS not significant. Analysis was performed using the Imaris surface-surface contact area XTension.E) Quantification of AQP4 total volume (μm3) was measured using Imaris v.9.3.1 surfaces module.
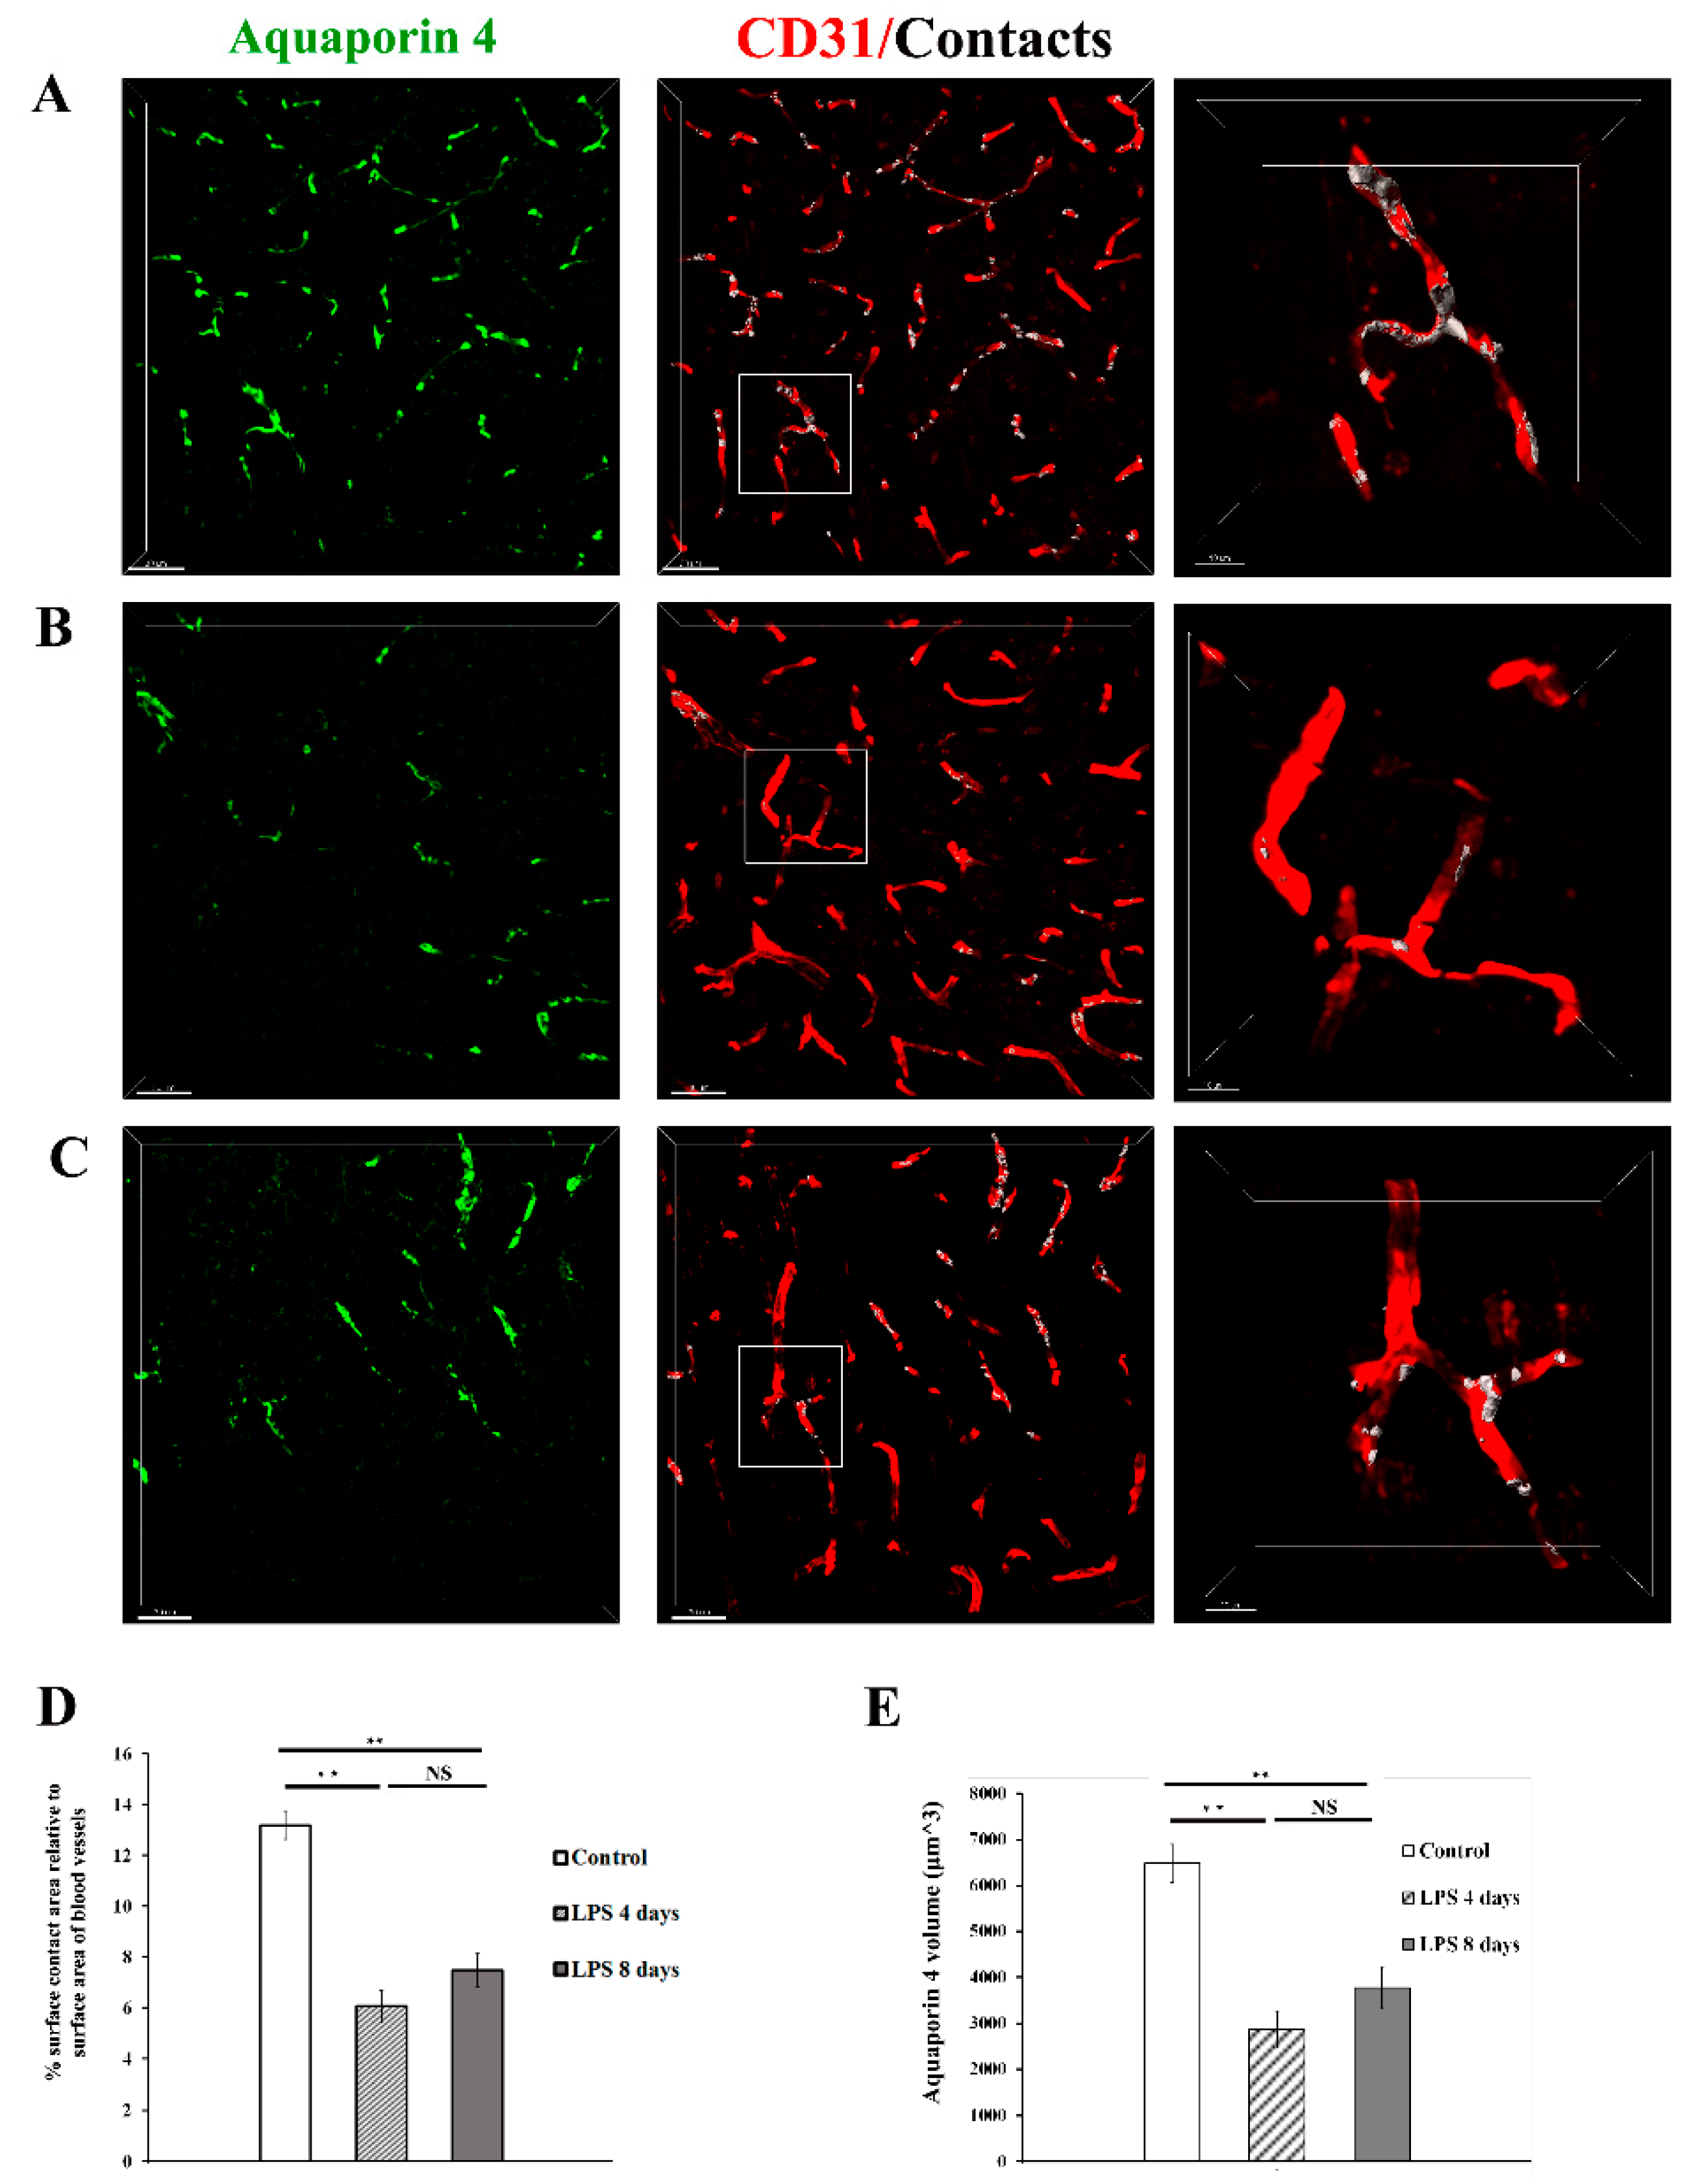
Figure 6.
Dynamic changes in the contact of microglia processes with blood vessels following LPS-induced inflammation. 2-photon image z stacks from a single Cx3cr1-EGFP transgenic mouse demonstrate microglia migration to cerebral vessels during systemic inflammation induced by two doses of LPS (5 mg/kg each). Microglia cells are depicted in green color, blood vessels in red and their contacts in white. Close-ups of the merged images are shown in the right panels. (scale bar 5 μm). A) An untreated control animal, imaged 3 weeks after cranial window surgery. B) The same animal imaged 4 days after LPS administration. C) The same animal imaged 8 days after LPS administration. Scale bar, 20 μm. Visualization was performed using Imaris software. D) Bar graph presenting quantification of the percentage of the contact volume relative to the vessels volume (n=4). *P < 0.05, **P < 0.01, and ***P < 0.001.
