Preprint
Communication

Central Nervous System Source Modulates Microglia Function and Morphology In Vitro

Submitted:

30 March 2023

Posted:

31 March 2023

You are already at the latest version

A peer-reviewed article of this preprint also exists.

Abstract
Regional heterogeneity of microglia was first described a century ago by Pio del Rio Hortega. Currently, new hints on microglia heterogeneity across central nervous system (CNS) regions are still being unraveled by high-throughput techniques. It remains unclear whether these spatial specificities translate into different microglial behaviors in vitro. We cultured microglia isolated from the cortex and spinal cord and analyzed the effect of the CNS spatial source on in vitro behavior by applying the same experimental protocol and culture conditions. We analyzed microglial cell numbers, function, and morphology and found a distinctive in vitro phenotype. We found that microglia were present in higher numbers in spinal cord-derived glial cultures, presenting different expression of inflammatory genes and a lower phagocytosis rate under basal conditions or after activation with LPS and IFN-. Morphologically, cortical microglial cells are more complex and present longer ramifications, which were also observed in vivo in CX3CR1+/GFP transgenic reporter mice. Collectively, our data demonstrated that microglial behavior in vitro is defined according to specific spatial characteristics acquired in the tissue. Thus, our study highlights the importance of microglia as a source of CNS for in vitro studies.
Keywords: 
Subject: 
Medicine and Pharmacology  -   Neuroscience and Neurology

1. Introduction

Rio-Hortega first described microglia in 1919 as a distinct population within the Central Nervous System (CNS) [[1,2]]. These cells adopt several morphological states throughout their life and display high migratory and phagocytic activity under pathological conditions [1,2,3,4]. For almost a century, researchers have considered microglial cells as bystanders of CNS physiology with the sole purpose of clearing CNS debris. However, insights into the complex biology of these cells in the last years have raised relevant questions about their functions in health and disease [5]. Currently, microglia are known as resident immune cells of the CNS that play important roles in the development and homeostasis of the brain and spinal cord, and respond to immune challenges under pathological or injury contexts [6,7,8,9].
Studies in mouse models concerning the origin of microglia revealed that during development, microglial progenitors arise from uncommitted CD31+ C-KIT+ erythromyeloid precursor (EMP) cells within the embryonic yolk sac (YS). These cells migrate into the brain rudiment at embryonic day 9.5 (E9.5), where they establish and maintain their self-renewal capacity during yearly fetal development [10,11,12]. Once established, embryonic microglia expand and colonize the entire CNS until adulthood [11]. Recent studies suggest that the spatial heterogeneity of microglia may be influenced by the surrounding cellular microenvironment and different developmental stages, contributing to the morphological and functional differences of microglia within the CNS in health and disease. It is important to note that although it is still unclear which intrinsic and extrinsic factors shape microglia properties, it is plausible that microglia, when migrating to other areas of the CNS, such as the cortex and spinal cord, can be exposed to different maturation processes, leading to distinct CNS microglia signatures [13,14]. Indeed, in vitro studies have demonstrated that cortex and spinal cord microglial cells present distinct protein signatures and biological properties, and that this differential heterogeneity is present throughout the lifespan and after pathogen exposure [14,15,16]. For instance, microglia from the spinal cord have been shown to be involved in inflammatory processes, whereas microglia from the cortex play a crucial role in neuronal migration [14].
Several studies have indicated that microglial behavior can be highly dynamic and shaped according to spatial and context- (disease) determinants [15,17,17,18,19,20]. However, microglia isolated from the cortex are still commonly used as a gold standard in vitro model to study neuroinflammation. In this study, we focused on further investigating the differences in the activation profile, phagocytosis capacity, and morphology of cortical versus spinal cord microglia in vitro. The data herein support the current evidence that even in the same microenvironment, microglia isolated from the cortex differ from spinal cord microglia in vitro. Importantly, we showed that these morphological differences in vitro are also present in vivo.
This study calls out the need to carefully select the origin of isolated microglia according to the research question to avoid drawing biased conclusions.

2. Results

2.1. Cortex vs spinal cord microglia present distinct activation profiles in vitro

Microglia-distinct behaviors have been documented across central nervous system regions and pathological contexts [13,15,17,20]. It is unclear whether this in vivo heterogeneous behavior translates into distinct functionality at in vitro level. Conclusions from experiments using cortex glial or enriched microglial cultures have been applied transversely to brain and spinal cord-based studies, which may constitute a misguided analysis. We conducted an unbiased in vitro study using a glial culture from the cortex and spinal cord tissue isolated from the same animal, using the same experimental protocol (Figure 1A). After establishing the glial culture, we analyzed the inflammatory profile by examining non-activated (basal conditions) and activated (cells incubated for 24 h with LPS and INF-γ) cultures (Figure 1A). As a first readout, we examined microglial cell numbers using immunocytochemistry (Figure 1B). At the basal state, there were no differences between the cultures (Figure 1C). However, after stimulation, there was an evident increase in microglia numbers in spinal cord cultures compared to cortical cultures, revealing a distinctive response of these cells to a pro-inflammatory stimulus (Figure 1C). Multiple comparison post hoc analysis confirmed that the number of microglia cells was significantly different according to CNS origin |F(1,14)=7.429 p =0.0164| and activation |F(1,14)=4.923, p=0.0435|. To consolidate these data, we assessed the same parameters using flow cytometry. The analysis demonstrated that the concentration of CD11b+ cells in spinal cord cultures was significantly higher than that in cortical glial cultures under activated conditions (Figure 1D and E, F(1,14)=19.90, p =0.0003). To further dissect the activation profile of microglial cells, we verified the expression of iNOS, CD86, and CD200R in these cells (Figure 1F-K). Flow cytometry analysis of iNOS expression revealed that glial cultures derived from spinal cord tissue presented a higher percentage of microglia expressing iNOS when in an activated state compared to cortex-derived glial cultures (Figure 1F and G, F(1,20)=7.271, p=0.0139). Moreover, it is important to highlight the contrast in the expression of this marker between the non-activated and activated glial cultures (Figure 1F and G, F(1,20)=695.8, p <0.0001). The interaction of both factors, CNS origin and activation, revealed that CNS sources modulate the behavior of these cells in vitro, making them react differently to the same stimuli (Figure 1F and G, F(1,20)=7.156, p=0.0145). Interestingly, both CD86 and CD200R were differentially expressed between the spinal cord and cortex-derived cultures under both basal and activated conditions and were highly expressed in cells derived from the cortex (Figure 1H-K and F; F(1,20)=77,90, p <0.0001 and F(1,20)=63,82, p<0.0001, respectively).

2.2. Microglia phagocytosis function in vitro differs according to their primary CNS source

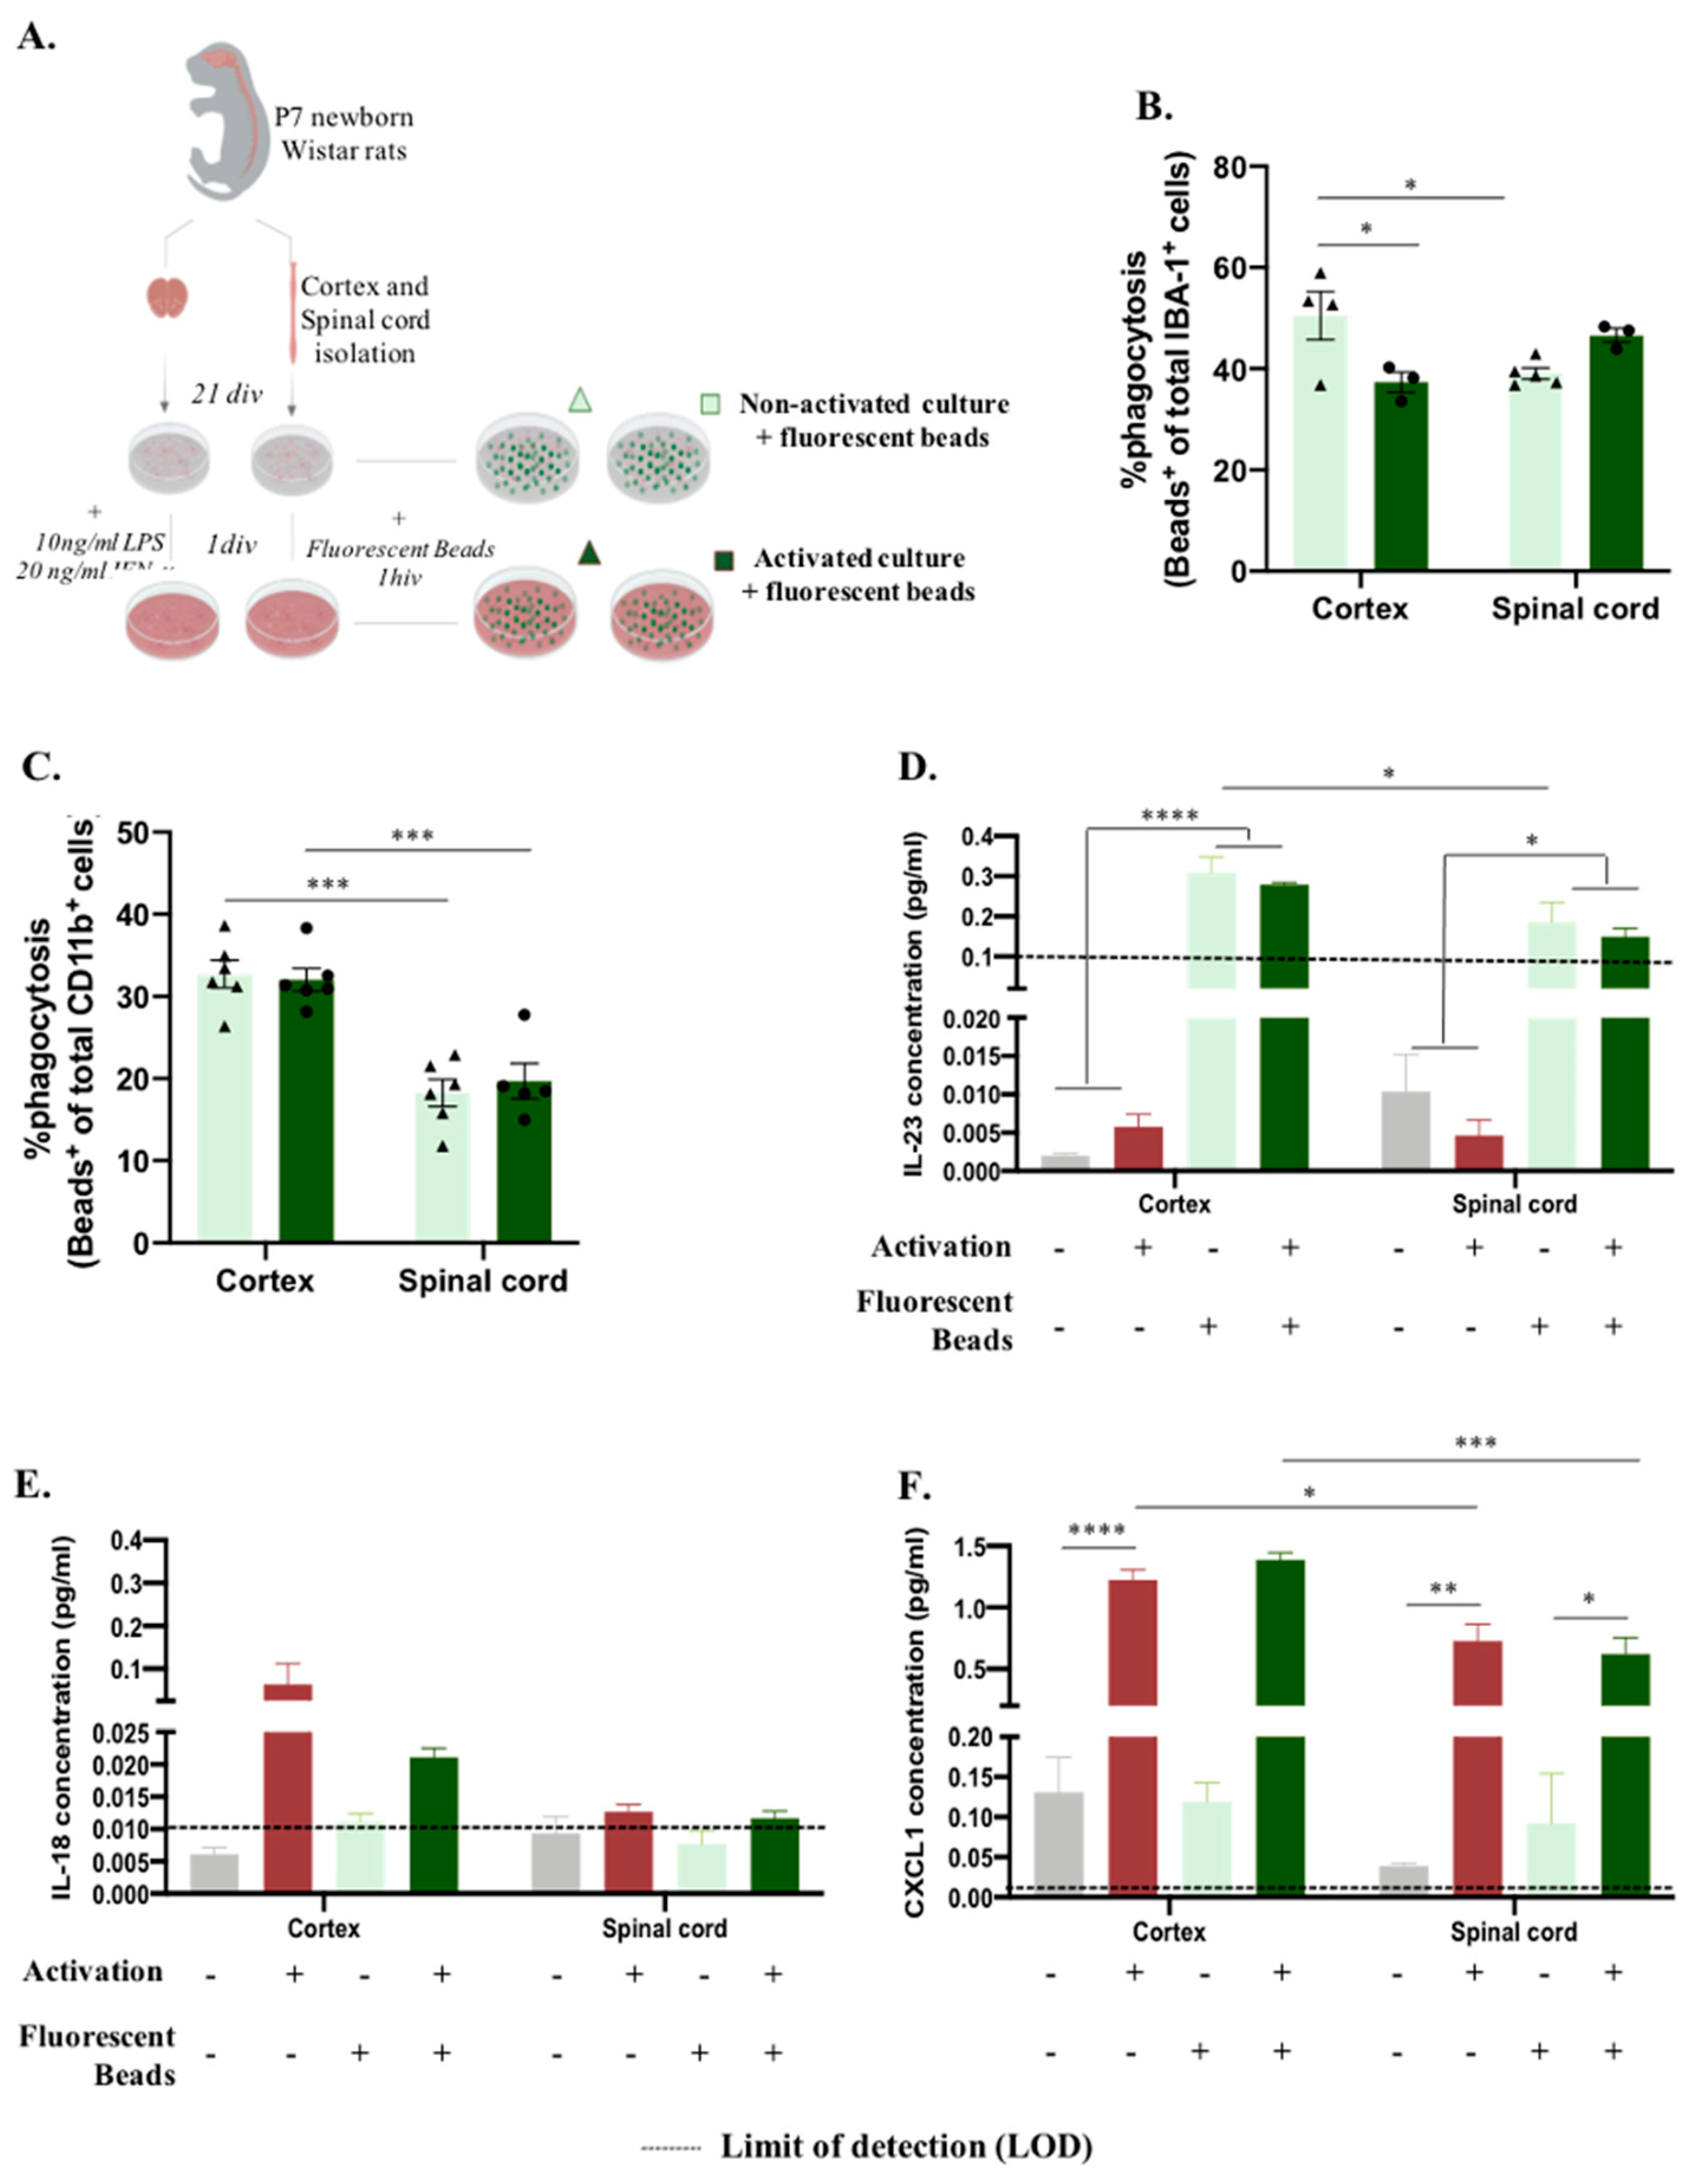
As previously mentioned, microglia significantly contribute to central nervous system function by clearing apoptotic and cell debris through phagocytosis during development, homeostasis, and disease paradigms [24]. We followed the same experimental design to analyze how microglial function is altered in vitro according to the origin region (Figure 2A). After establishing the glial culture, we incubated the cells with GFP fluorescent microspheres and evaluated the phagocytosis rate and cytokine production in non-activated and activated microglia (Figure 2A). Surprisingly, this process was revealed to be dynamic between non-activated and activated conditions, revealing a significant effect of factor interaction (CNS origin and activation) (Figure 2B, F(1,11)=12.72, p=0.0044). Under basal conditions, microglia derived from the spinal cord presented less phagocytosis than microglia isolated from the cortex (Figure 2B SC:39% compared to cortex:50%, p=0.0428). Conversely, after activation, spinal cord microglia increased their phagocytosis function (to 46%) compared to the cortex microglia phagocytosis rate, which significantly decreased (to 37%, p=0.0406) (Figure 2B). We also evaluated microglial phagocytosis by flow cytometry, which allowed us to analyze the presence of engulfed beads, specifically on microglia, by previous gating of this population (Supplementary Figure 1C). This quantification again showed an effect of CNS origin on microglial phagocytosis function |Figure 2C, F(1,19)=62.22, p<0.0001|, where, in accordance with immunocytochemistry data, spinal cord-derived microglia at basal state have a lower phagocytosis rate (Figure 2B and 2C). However, in activated glial cultures, the dynamics previously mentioned were not observed, as spinal cord microglia phagocytosis was significantly lower than cortex microglia phagocytosis (Figure 2C). The supernatants of these cultures were used to characterize the cytokine panel released before and after incubation with the fluorescent beads (Figure 2D-F)). Curiously, the production of IL-23 was influenced by incubation with fluorescent beads, with IL-23 levels below the limit of detection (LOD) before incubation and was highly produced after bead incubation |Figure 2D, F(1,15)=160.2, p<0.0001|. Moreover, cortex-derived glia produced more IL-23 when incubated with fluorescent beads under basal conditions than spinal cord-derived glia |Figure 2D, F(1,15)=11.97, p=0.0035|, which, besides being just a tendency, was maintained after the activation protocol (Figure 2D, p=0.0629). IL-18 was produced in slightly higher amounts after activation; however, no statistically significant difference was observed between the groups (Figure 2E). CXCL1 cytokine followed the same profile, being highly produced after the activation protocol for both cortex and spinal cord-derived cultures, independent of fluorescent bead incubation |Figure 2F, F(1,15)=212,8, p<0.0001|. Moreover, in activated cultures, a CNS origin effect was noted, with cortex-derived cells being more producers of CXCL1 than spinal cord-derived cells |Figure 2F, F(1,15)=31.80, p<0.0001|.

2.3. Microglia derived from cortex vs spinal cord present distinct morphology in vitro and in vivo

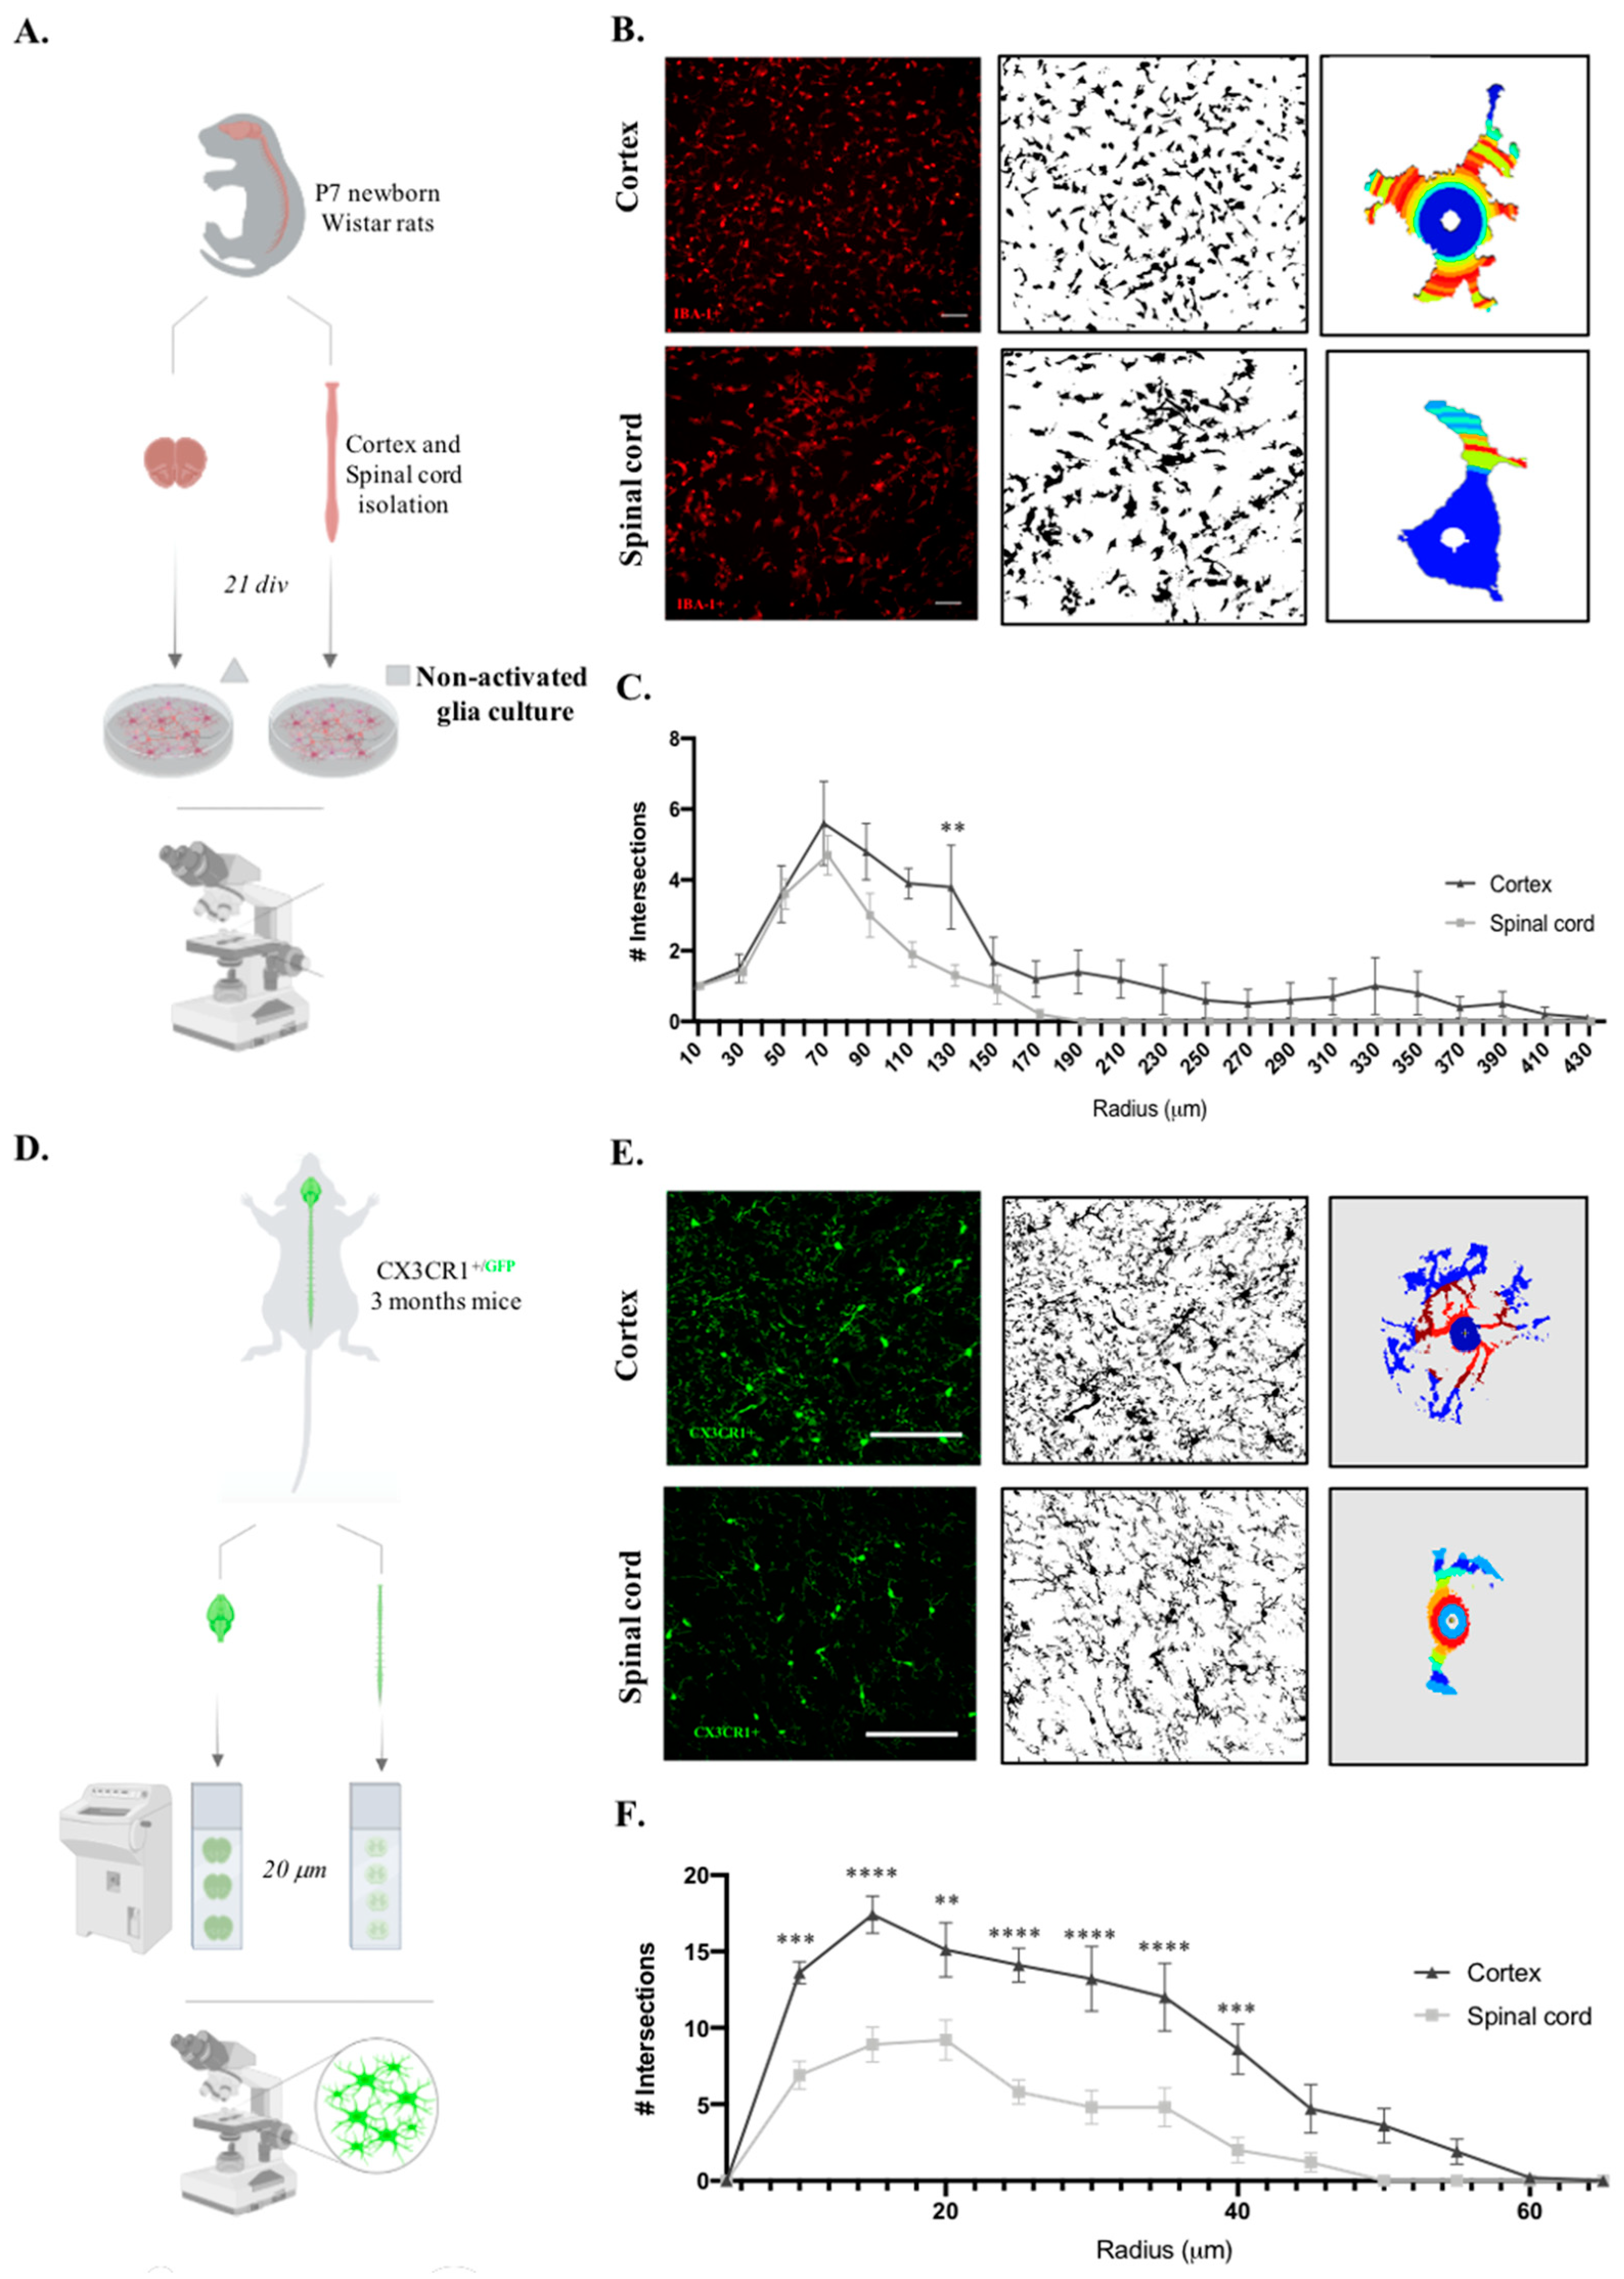
Microglia, which are immune cells of the central nervous system, are in constant surveillance of the surrounding microenvironment, presenting striking morphological plasticity. Also, it is known that microglia morphology and function are closely related [25]. Considering the functional differences in microglia, we sought to compare the cortex and spinal microglial morphology in glial cultures. For this, we followed the same rationale as the experiments presented before and evaluated only the non-activated microglial cells (Figure 3A), since it has already been established how microglial morphology changes after a pro-inflammatory stimulus. Therefore, after imaging IBA-1 staining of both glial cultures, Sholl analysis was performed on the individual microglial cells (Figure 3B). Interestingly, cortical microglial cells showed increased intersecting ramifications, revealing a more complex cell morphology than spinal cord microglial cells, with fewer ramifications and a shorter cell radius |Figure 3C, F(1,396)=32,73, p<0.0001|. Taking advantage of CX3CR1+/GFP transgenic mice, we evaluated these microglial morphological differences in vivo by acquiring high-resolution representative images of microglia in the cortex and spinal cord tissue (Figure 3D). Importantly, we compared only cells located in the gray matter, so our data are not influenced by the previously described differences between microglia on white and gray matter [19]. Sholl analysis of individual CX3CR1-GFP+ cells (Figure 3E) revealed that cortical microglia presented a more complex morphology than spinal cord cells, with a higher number of intersections |Figure 3F, F(1,234)=117,3, p<0.0001|.

3. Discussion

Microglial heterogeneity has been extensively studied in vivo using high-throughput techniques. However, how exactly these differences in vivo are maintained in vitro and how they affect microglial behavior is still to be fully understood. Moreover, it is crucial to use suitable in vitro models to understand and manipulate microglial functions to study microglia in healthy and diseased conditions. However, cortex-derived microglia are still commonly used as the gold standard in vitro model to study distinct CNS injuries or disorders [26,27,28,29,30].
This study compared microglial activation, phagocytosis, and morphology in cultures obtained from cortex or spinal cord tissues. To perform an accurate comparison, we isolated the cells from these two regions (cortex and spinal cord) from the same P7 Wistar rat animal and followed the same protocol (Figure 1A, Figure 2A, and Figure 3A). This procedure controls for confounding factors, such as species, sex, genetic background, and age.
Cortex and spinal cord-derived glial cultures, under basal conditions, presented a similar number of microglia cells (Figure 1C and 1E). However, a slight tendency was observed for higher IBA-1+ cell or CD11b concentrations in spinal cord cultures (Figure 1B-E). This could be explained by the greater microglial representation in the original CNS tissues. However, besides being reported as a regional density difference across the CNS, the number of microglia in the spinal cord is lower than that in the cortex [13,31]. Another hypothesis for the higher number of microglia in spinal cord-derived cultures is a higher survival rate or, for example, more proliferation. Proliferation is the standard reaction of microglia to immune stimuli. Thus, we next evaluated whether microglia from the spinal cord were more reactive towards an inflammatory challenge. We incubated microglial cells with LPS and IFN-γ, known stimuli for inducing cell proliferation [32] and nitric oxide biosynthesis (Lin et al., 2008). Curiously, after 24 h of stimulation, glial cultures derived from spinal cord cells showed a significantly higher number of microglial cells than glial cultures from the cortex (Figure 1C and 1E). This observation, confirmed using immunocytochemistry and flow cytometry, showed that in response to the same stimuli, microglia derived from cortex and spinal cord tissue react differently, reaching higher numbers in spinal cord cultures. Again, these higher microglial densities can be explained by a higher proliferation rate related to a different capacity to react to the activation stimulus. It would be interesting to analyze whether there is a different expression of LPS receptors (TLR4) in the microglia from each CNS source, or even if it can be an in vitro acquired feature. When evaluating iNOS expression in these cells, a marker commonly upregulated upon activation, the stimulatory effect was confirmed in both cultures, with a higher percentage of CD11b+iNOS+ cells after activation (Figure 1G). Second, a CNS effect was observed, with a higher percentage of iNOS+ microglial cells present in the spinal cord-derived culture (Figure 1F-G). Interestingly, when looking at CD86, a membrane co-stimulatory receptor responsible for T cell activation and proliferation [34], and CD200R, an immune receptor involved in cytokine production [35] it is not observed, but only a CNS origin effect (Figure 1H-K). Thus, spinal cord-derived cells presented lower levels of CD86 and CD200R in non-activated and activated conditions (Figure 1H-K), showing that although this specific activation protocol did not induce this immune profile, it is possible to confirm a CNS origin effect on microglia signatures in vitro. Collectively, these data demonstrate a distinct microglial activation profile in vitro according to their primary CNS source, which is in line with previous data from the Haas lab reporting that CD86, as other immunoregulatory proteins, presents region-specific CNS expression [36]. More recently, the Aymerich S. M. group described a different expression of CD86 across distinct brain regions, including the cortex, hippocampus, and striatum, with higher expression of this activation marker in comparison to the midbrain [37]. Although differential microglial CD86 expression has already been described in distinct brain regions and at the in vivo level [36,38,17], our data show that these differences may now have to be considered in in vitro studies.
Besides their capacity to respond and activate inflammatory cascades, microglia also regulate CNS homeostasis through phagocytosis [7]. To study whether phagocytosis function is also affected in vitro according to distinct CNS origin, we followed the same rationale as before with an additional incubation of fluorescent YG carboxylate microspheres (Figure 2A). Immunocytochemistry showed that, in a basal state, microglia isolated from the spinal cord had less phagocytic capacity than cells isolated from the cortex (Figure 2B). In activated cultures, microglial phagocytic capacity was altered, with spinal cord-derived cells presenting a slightly higher phagocytosis rate than cortex-derived cells (Figure 2B). Although these phagocytic dynamics are interesting, we are aware that immunofluorescence analysis of ingested beads may carry some errors since some counted beads may only adhere to the cell surface.
As an alternative, we performed flow cytometry, which allows the discrimination of cells by complexity and size parameters, reducing the counting bias (Supplementary Figure 1C). In this analysis, we did not observe a significant effect of activation protocol (Figure 2C). However, the flow cytometry data support the observation that microglia in vitro phagocytosis capacity is distinct according to their CNS spatial origin, as the spinal cord-derived microglia are less phagocytic (Figure 2C). It is important to highlight that environmental cues modulate microglial transformation from surveying to phagocytic function differently [39] and the effect observed with microspheres should also be tested with other engulfed substrates present in the CNS tissue context, such as synaptosomes, myelin debris, or apoptotic cells [40,41,42,43]. Here, we observed that the impact of unique signals from the cortex or spinal cord microenvironment on microglial cell machinery is most likely conserved in vitro, resulting in different phagocytic capacities.
We then analyzed the microglial cytokine profile according to CNS origin in response to phagocytosis or activation protocol. The production of IL-23 was significantly increased after incubation with fluorescent beads under both basal and activated conditions. This is in line with previous reports that phagocytes secrete this cytokine, mostly described by neutrophils and peripheral macrophages [44,45,46,47]. However, although it has been described that microglial cells are producers of IL-23 [48] and that this cytokine plays a role in different CNS pathologies [49,50], the best of our knowledge still lacks a connection between this cytokine and microglial phagocytosis. Moreover, since microglia also express the IL-23 receptor [48], it is possible that this cytokine acts in an autocrine manner by regulating microglial functions such as phagocytosis. Interestingly, our data show a CNS origin-dependent effect on IL-23 levels that is consistent after inducing microglial phagocytosis, being observed in spinal cord-derived glial cultures, a lower IL-23 production (Figure 2D), and a lower phagocytosis rate (Figure 2B and C). Based on these data, it would be relevant to further explore the possible association between IL-23 and microglial phagocytosis. The possible association between IL-23 and microglial phagocytosis raises new hypotheses concerning the region-specific accumulation of plaques in regions of demyelination and neuronal loss observed in CNS autoimmune pathologies [51,52,53,50].
The signaling molecule IL-18 was only slightly detected after the activation protocol (Figure 2E), which is consistent with its association with microglial pro-inflammatory processes [54,55,56,57,58]. This activation effect was also detected on CXCL1 release, which was highly produced after the activation protocol, independent of the presence of phagocytosis beads (Figure 2F). The CXCL1 profile is associated with its function as a ligand involved in the microglial pro-inflammatory profile following several CNS inflammation processes [59,60]. Besides the activation effect, it is also possible to confirm for CXCL1 a CNS region specific response, being spinal cord-derived cells less producers of this chemokine in comparison to cells present on cortex-derived cultures (Figure 2F). To our knowledge, no studies have addressed CNS region-specific expression and release of CXCL1.
Overall, cytokine/chemokine analysis demonstrated that the CNS source of glial cells affects the production of IL-23 and CXCL1 in vitro, with spinal cord glial cells exhibiting lower production. Importantly, this analysis may lack specificity for the microglial response since it was performed on mixed glial culture supernatants, meaning that the molecules analyzed could have been released by microglia, but also by oligodendrocytes or astrocytes [61,62,57].
In addition to the impressive variety of functions described previously, microglia can easily adapt to a new context/microenvironment through morphological changes. In fact, analysis of cell morphology in the field of microglia research has been largely applied, being in some cases associated with the immune profile – the so-called morphology phenotype. There are several classifications of ramified, amoeboid, hypertrophic, rod, dystrophic, satellite, gitter-cell-like, or dark microglia, all trying to correlate morphology with functionality [63]. Moreover, microglia vary in morphology depending on their location, a fact known since 1990, and has been extensively studied across different CNS regions until nowadays [31]. Thus, microglial morphological characterization has been performed in different brain regions [64,65] and spinal cord tissue, mainly after injury [66].
Considering our previous functional differences, we questioned whether cell morphology was also altered in vitro depending on the original tissue location. To address this, we analyzed the morphology of individual microglial cells (Figure 3A and B). We observed a difference in the number of intersections along the cell radius between cortex and spinal cord microglial cells in cultures that were cortex-derived microglia more complex and long (Figure 3C). Regional differences in microglial morphology between the brain and spinal cord have been previously reported [13]. Curiously, this contrast is particularly striking among grey and white matter tracts where microglia range from 5% to 12% of total cells per region, respectively, with higher densities found in grey matter (Gordon S et al., 1990). Since the cortex and spinal cord tissue present different proportions of white and gray matter, this could explain the observed microglial morphological differences. To overcome this concern and clarify whether microglial morphology already differs in the original location, we took advantage of CX3CR1+/GFP mice and isolated them from the same animal, cortex, and spinal cord tissues (Figure 3D). High-resolution images were taken only from the white matter regions for the Sholl analysis (Figure 3E). An equivalent result was observed in vivo, showing that microglia from the cortex had a complex morphology and presented longer ramifications (Figure 3F). Therefore, our in vivo analysis supports the in vitro observed differences. The shorter and less ramified morphology of spinal cord microglia coupled with previous higher numbers verified in culture and increased expression of iNOS suggest that these cells in culture are more reactive to activation.
In contrast to this hypothesis, Jesudasan et at., revealed that spinal cord microglia exhibit a less inflammatory phenotype and a less amoeboid morphology when compared with brain microglia in response to LPS [15]. However, this data divergence can easily be explained by the different animal ages (postnatal day 1 vs. day 7 in our study), protocol specificities as culture medium (DMEM-F12 vs. DMEM), and activation components (1μg LPS vs 10ng/ml ng/mL LPS + 20ng/ml IFN-γ). More recently, Murgoci et al. showed that cortex and spinal cord microglia cultured in vitro have distinct protein signatures and biological properties [14]. Specifically, they observed that microglia from spinal cord injury are involved in inflammatory processes, while microglia from the cortex play a crucial role in neuronal migration and exogenesis [14]. Importantly, both studies showed that microglial behavior differs in vitro according to the original spatial location of the central nervous system. Moreover, in a study using the amyotrophic lateral sclerosis (ALS) model, Nikodemova et al. reported regional heterogeneity in microglial phenotype and function even within the affected regions, where microglia appear to be more reactive and macrophage-like than cortex microglia [17]. Lastly, a recent study using scRNA-seq to characterize microglial heterogeneity in WT mice and transgenic HIV-1 gp120 mice revealed overlapping but distinct microglial populations in the cortex and spinal cord. They found two clusters of microglia, homeostatic microglia (HOM-M) and inflammatory microglia (IFLAM-M), in distinct proportions, revealing that the cortex may have a more limited capacity for a microglia-mediated inflammatory response. In vitro models have been developed to reliably and efficiently predict in vivo conditions. Our data show that microglia differ throughout the CNS and demonstrate several differences between microglia at in vitro level, depending on their original tissue source.

4. Materials and Methods

4.1. Study design

P7 newborn Wistar rats, of both sexes (Charles River) (RRID_RGD_737929) were used for in vitro experiments. Adult (10-15 weeks; 23-28g) male CX3CR1+/GFP (RRID:IMSR_JAX:005582) (Charles River) mice were used for the in vivo analysis of microglia morphology. Animal used in this study were maintained under standard laboratory conditions (12 h light: 12 h dark cycles, 22 °C, relative humidity of 55%, ad libitum access to standard food and water). Rats were maintained 2 per cage and mice 5-6 per cage, in enriched cages with paper. All experiments were approved by the Portuguese Regulatory Entity (DGAV 022405) and conducted in accordance with the local regulations on animal care and experimentation (European Union Directive 2010/63/EU).

4.2. Cortex and spinal cord glial cultures

Cortical and spinal cord glial cells were isolated from P7 newborn Wistar rats (RRID_RGD_737929) as described previously [21]. Briefly, rats were euthanized by decapitation and the meninges were removed by dissection of the cortical and spinal cord tissues, and the tissues were kept separated. The cortices and spinal cords were enzymatically digested in a dissociation solution (30 mg/mL DNase 30 (Sigma Cat No 9003-98-9, 0,25% trypsin (Gibco, Cat No 25300062) for 30 min at 37°C, followed by mechanical dissociation. This dissociation procedure allows for better separation of cells from the surrounding tissue and simultaneously increases neuronal cell death, which is known to be sensitive to these procedures. Enzymatic digestion was stopped by adding 40% newborn calf serum (NBCS) (Cat No. 26010074, Invitrogen, USA) to the cell suspension, which was further centrifuged at 800rpm for 2 min to obtain glial cells. The glial cell pellet was mechanically resuspended in culture medium (DMEM; Sigma,Cat No D5648) supplemented with NaHCO3 (Sigma, USA, Cat No S5761), 10% newborn calf serum, and 1% penicillin-streptomycin (P/S, Gibco, Cat No. 15070063) using 5 and 10mL pipettes. A second centrifugation at 1 200rpm for 5 min was performed to remove the tissue debris. The pellet was resuspended in culture medium, and a 1:1 dilution of Trypan Blue (Sigma, USA, Cat No T8154) was prepared for cell counting under a light microscope Olympus BX51WI Fixed Stage Upright Microscope (RRID:SCR_023069) using a Neubauer chamber (Marienfeld, Germany, Cat No 0640010). A density of 50 000 cells/well was used for 24 well plate or 1 000 000 cells/well in a 6-well plate for immunocytochemistry or cytometry analysis, respectively. Cells were maintained on culture medium at 37°C and 5% CO2 for 21 days in vitro (DIV), and the medium was changed every 3 days.

4.3. Microglia activation response and phagocytosis function assays

Confluent glial cultures from the cortex or spinal cord were obtained after 21 DIV and their activation response and phagocytosis capacity were assessed. IFN-γ (20ng/mL, PeproTech, Cat No 400-20) and LPS (10ng/mL, Sigma, USA, Cat No L4391) were added to the culture medium to study the activation response. Half of the wells in each condition were stimulated (activated glial culture), while the other half was maintained with basal culture medium (non-activated glial culture). Glial cells were stimulated for 24h at 37°C and 5% CO2. Activated and non-activated cells were incubated with 0,0025% (v/v) fluorescent YG carboxylate microspheres (Polysciences, Inc., USA, Cat no:15700-10), diameter 0,5μm for 1h at 37°C with 5% CO2 to study phagocytic function.

4.4. Microglia immunocytochemistry

Cortical vs. spinal cord microglia were analyzed using immunocytochemistry after activation and phagocytosis assays. The cells were fixed in 4% paraformaldehyde for 30 min at room temperature (RT), and membrane permeabilization was performed with 0.2% Triton-X in PBS (PBS-T) for 5 min at RT. Cells were then blocked with 10% NBCS in PBS-T for 30 min at RT, followed by a 60 min incubation with primary antibodies rabbit anti-IBA-1 (diluted 1:1000 in 10% NBCS/PBS, Wako, Cat No 019-19741) to detect microglial cells and mouse anti-iNOS (diluted 1:100 in 10% NBCS/PBS, (Abcam Cat# ab15323, RRID:AB_301857) to analyze the microglial activation phenotype. Primary antibody incubation was omitted to produce negative controls. The secondary antibodies, Alexa Fluor 594 anti-rabbit (diluted 1:1000 in 10% NBCS/PBS, (Thermo Fisher Scientific Cat# A-11037, RRID:AB_2534095) and Alexa Fluor 488 anti-mouse (diluted 1:1000 in 10% NBCS/PBS, (Thermo Fisher Scientific Cat# A-11034, RRID:AB_2576217), were incubated in the dark for 60 min at RT. DAPI (diluted 1:1000 in 10% NBCS in PBS; 1μg/mL, Invitrogen, Cat No 62248) for 5 min at RT was used for nuclear staining. The wells were maintained in PBS and protected from light until fluorescence microscopy analysis. Microglia were analyzed in IBA-1+ cells, microglia activated by IBA-1+iNOS+ and phagocytosis by IBA-1+GFP+ cells. All histological procedures and evaluation were performed blindly to the experimental groups.

4.5. Flow cytometry analysis

After the activation or phagocytosis assays, glial cells were detached from the wells using 0,05% trypsin (Gibco, Cat No 25300062) for 3 min at 37°C. Trypsinization was stopped by doubling the volume of culture medium. The cells were centrifuged at 1200rpm for 5 min and the pellet was resuspended in DMEM. A 1:1 dilution of Trypan Blue (Sigma, USA, Cat No T8154) was prepared for cell counting under a light microscope Olympus BX51WI Fixed Stage Upright Microscope (RRID:SCR_023069) using a Neubauer Chamber (Marienfeld, Germany, Cat No 0640010). Flow cytometry staining was performed as previously described [22] on 1x10⁶ total cells. For membrane staining, glial cells were resuspended in flow cytometry staining buffer |FACSb: phosphate buffered saline (PBS), 10% BSA (Sigma, USA, Cat No A-9418), 0.1% sodium azide| and then incubated in the dark for 20 min at 4°C with primary antibodies: PECy7 anti-rat CD11b/c (BioLegend Cat# 201817, RRID:AB_2565946), APC anti-rat CD86 (BioLegend Cat# 200315, RRID:AB_2910355)), and FITC anti-rat CD200R (BioLegend Cat# 204905, RRID:AB_2074190).
For intracellular staining, glial cells were fixed in 2% PFA for 20 min atz 4°C followed by one 200rpm centrifugation for 2 min at 4°C. Permeabilization was performed for 5 min at 4°C using a permeabilization buffer solution of 1x (diluted from 10x stock with water). After centrifugation at 1200 rpm for 2 min at 4°C, primary staining was performed using the primary antibody rabbit anti-iNOS (diluted 1:100 with permeabilization buffer solution, (Abcam Cat# ab15323, RRID:AB_301857) for 20 min at 4°C, followed by incubation for 10 min at 4°C with the secondary antibody Alexa Fluor 488 anti-rabbit (diluted 1:1000 in permeabilization buffer solution 1x) (Thermo Fisher Scientific Cat# A-11034, RRID:AB_2576217). The cells were acquired using a BD LSRII Flow Cytometer (BD LSR II Flow Cytometer (RRID:SCR_002159)).
Doublets were excluded by FSC-A versus FSC-H, and dead cells were excluded by positive staining for 7-AAD (BioLegend, Cat. No 420403) (Supplementary Figure 1). Microglial cells were gated by CD11b+ expression (Supplementary Figure 1). Activated microglia were analyzed by the positive expression of CD11b+CD86+, CD11b+CD200R+ (Supplementary Figure 1A), and CD11b+iNOS+ (Supplementary Figure 1B). Phagocytic microglia were analyzed based on the positive expression of CD11b and GFP (Supplementary Figure 1C). Sample acquisition and gating analysis was performed blindly to the experimental groups.

4.6. LEGENDplexTM Multi-Analyte Flow Assay on glia culture supernatants

Cultured glial cell supernatants were assayed using the LEGENDplexTM Mouse Macrophage/Microglia Panel kit (Biolegend,Cat no.740846), according to the manufacturer's instructions. This kit includes the following analytes: CXCL1 (KC), Free Active TGF-β1, IL-18, IL-23, CCL22 (MDC), IL-10, IL-12p70, IL-6, TNF-α, G-CSF, CCL17 (TARC), IL-12p40, and IL-1β. Briefly, reagents were prepared from the stocks provided and standard serial dilutions were prepared to generate a standard curve. Assay buffer (25µL) was added to the standard and sample wells at a 1:1 ratio. 25μL of mixed beads was added to each well, and the plate was incubated for 2h at RT with continuous agitation at 800 rpm. After centrifugation at 250 g for 5 min, the beads were washed with 1x wash buffer for 1 min. Detection antibodies (25µL) were added to each well, followed by 1 h of incubation at RT with agitation at 800 rpm. Streptavidin-phycoerythrin (SA-PE) (25µL) was added directly to the previous solution and the plate was incubated for 30 min at RT with agitation at 800 rpm. After washing with 150μL of 1x wash buffer, the samples were ready to read on the flow cytometer. Samples were vortexed, and 300 beads per analyte were acquired using a Cytometer (BD LSR II Flow Cytometer (RRID:SCR_002159)).
The FCS files were analyzed using the Biolegend’s LEGENDplexTM data analysis software suite. The concentration of each detected analyte was presented in pg/ml. Analytes with concentrations below the detection limit (LOD) in all samples were excluded from the analysis. Analytes that were partly detected in some samples were analyzed and plotted as graphs that included the LOD representation by a dashed line. The experimenter was blind to the experimental groups when performing the protocol, sample acquisition and analysis.

4.7. Microglia morphology analysis

Since microglial morphology has been related to cell functional state, this parameter was also analyzed by comparing cortical and spinal cord microglia at both in vitro and in vivo levels. The morphology was analyzed using the Sholl analysis plugin of the Fiji software Fiji (RRID:SCR_002285) (Cătălin et al., 2013).
For in vitro analysis, IBA-1+ cells from the cortex and spinal cord glial cultures (see protocol in the first section of Materials and Methods) were imaged under an Olympus BX61 Upright Wide Field Microscope (RRID:SCR_020343).
For in vivo analysis, we used transgenic adult (10-15 weeks; 23-28g) male CX3CR1+/GFP (RRID:IMSR_JAX:005582) mice. In this reporter mouse, CX3CR1+ cells, such as monocytes, subsets of natural killer cells, and microglia cells, express enhanced green fluorescent protein (eGFP). Adult heterozygous CX3CR1-GFP mice (3 months of age) were anesthetized with an intraperitoneal injection of a mixture containing ketamine (Imalgene, 75 mg/kg, Merial, France) and medetomidine (Dormitor, 1 mg/kg, Pfizer, USA) to avoid animal suffering and intracardially perfused with saline followed by 4% PFA. The cortex and spinal cord tissues were dissected. Tissues were sectioned in a cryostat, and transversal 20 μm-thick sections were produced and collected on slides. Slides containing cortex and spinal cord sections were placed at room temperature and rehydrated in PBS (1×). Finally, the tissues were mounted on Immu-Mount® (Thermo Scientific, USA, Cat No.FIS9990402), and representative images were taken using an Olympus FV1000 Confocal Microscope (RRID:SCR_020337) (Olympus, Germany).
Both in vitro and in vivo microphotograph analyses were performed, as previously described [23]. Briefly, images were converted into 8 bits, thresholded, and the largest sholl radius was defined by creating a straight line starting at the center of the analysis. Concentric rings spaced 5μm were used to calculate the number of intersections in each radius, as shown in Figure 3. The selection of microglia to analyze was performed blindly to the experimental groups.

4.8. Statistical analysis

Statistical analysis was performed using GraphPadPrism ver.8.0 (RRID:SCR_002798). One way ANOVA, followed by Tukey test was used to compare four groups. When comparing two factors, two-way ANOVA followed by Sidak’s multiple comparisons test. Normality was measured using the Kolmogorov-Smirnov and Shapiro-Wilk statistical tests. Equality of variances was measured using the Levene’s test and was assumed when p > .05. Values were accepted as significant if the p < .05. Data presented as group mean ± standard error of the mean (SEM).

5. Conclusions

In summary, we have reported that the origin of microglia is relevant in determining the behavior of these cells in vitro. Specifically, our results revealed that microglia in spinal cord-derived cultures are functionally and morphologically different from those in cortex-derived cultures. Thus, the selected region to isolate microglia cells will commit cultures accordingly and affect defined outcomes, therefore it is essential to align the research question with the adequate in vitro experimental design.

Supplementary Materials

The following supporting information can be downloaded at the website of this paper posted on Preprints.org.

Author Contributions

Conceptualization, Andreia Pinho, António Salgado, Nuno A. Silva and Susana Monteiro; Formal analysis, Andreia Pinho; Funding acquisition, António Salgado, Nuno A. Silva and Susana Monteiro; Investigation, Andreia Pinho, Andreia Monteiro, Sara Fernandes, Nídia De Sousa and Susana Monteiro; Methodology, Nuno A. Silva and Susana Monteiro; Resources, António Salgado, Nuno A. Silva and Susana Monteiro; Writing – original draft, Andreia Pinho and Andreia Monteiro; Writing – review & editing, Nídia De Sousa, António Salgado, Nuno A. Silva and Susana Monteiro. All authors have read and agreed to the published version of the manuscript

Funding

This work has been funded by Santa Casa Neuroscience Awards – Prize Melo e Castro for Spinal Cord Injury Research (MC-18-2021) and partially funded by Wings for Life Spinal Cord Research Foundation (WFL-ES-03/19); This work has also been funded by National funds, through the Foundation for Science and Technology (FCT) - project UIDB/50026/2020 and UIDP/50026/2020 and EXPL/MED-PAT/0931/2021 and by the project NORTE-01-0145-FEDER-000039, supported by Norte Portugal Regional Operational Programme (NORTE 2020), under the PORTUGAL 2020 Partnership Agreement, through the European Regional Development Fund (ERDF). We would like to acknowledged the support from Portuguese Foundation of Science and Technology to AGP (2020.07534.BD), AM (UMINHO/BIL-CNCG/2022/16), SM (CEECIND/01902/2017) and NAS (CEECIND/04794/2007).

Institutional Review Board Statement

All experiments were approved by the Portuguese Regulatory Entity (DGAV 022405) and conducted in accordance with the local regulations on animal care and experimentation (European Union Directive 2010/63/EU).

Data Availability Statement

The datasets used and/or analyzed during this study are available on reasonable request from the corresponding author.

Conflicts of Interest

The authors declare no conflict of interest.

References

  1. Rezaie, P.; Male, D. Colonisation of the Developing Human Brain and Spinal Cord by Microglia: A Review. 24.
  2. Sierra, A.; de Castro, F.; del Río-Hortega, J.; Rafael Iglesias-Rozas, J.; Garrosa, M.; Kettenmann, H. The “Big-Bang” for Modern Glial Biology: Translation and Comments on Pío Del Río-Hortega 1919 Series of Papers on Microglia: 1919 Río-Hortega Papers on Microglia. Glia 2016, 64, 1801–1840. [Google Scholar] [CrossRef] [PubMed]
  3. Giulian, D.; Baker, T. Characterization of Ameboid Microglia Isolated from Developing Mammalian Brain. J. Neurosci. 1986, 6, 2163–2178. [Google Scholar] [CrossRef] [PubMed]
  4. Barron, K.D. The Microglial Cell. A Historical Review. Journal of the Neurological Sciences 1995, 134, 57–68. [Google Scholar] [CrossRef]
  5. Prinz, M.; Jung, S.; Priller, J. Microglia Biology: One Century of Evolving Concepts. Cell 2019, 179, 292–311. [Google Scholar] [CrossRef]
  6. Wake, H.; Moorhouse, A.J.; Nabekura, J. Functions of Microglia in the Central Nervous System – beyond the Immune Response. Neuron Glia Biol. 2011, 7, 47–53. [Google Scholar] [CrossRef] [PubMed]
  7. Colonna, M.; Butovsky, O. Microglia Function in the Central Nervous System During Health and Neurodegeneration. Annu. Rev. Immunol. 2017, 35, 441–468. [Google Scholar] [CrossRef]
  8. Wolf, S.A.; Boddeke, H.W.G.M.; Kettenmann, H. Microglia in Physiology and Disease. Annu. Rev. Physiol. 2017, 79, 619–643. [Google Scholar] [CrossRef]
  9. Borst, K.; Dumas, A.A.; Prinz, M. Microglia: Immune and Non-Immune Functions. Immunity 2021, 54, 2194–2208. [Google Scholar] [CrossRef]
  10. Ginhoux, F.; Greter, M.; Leboeuf, M.; Nandi, S.; See, P.; Gokhan, S.; Mehler, M.F.; Conway, S.J.; Ng, L.G.; Stanley, E.R.; et al. Fate Mapping Analysis Reveals That Adult Microglia Derive from Primitive Macrophages. Science 2010, 330, 841–845. [Google Scholar] [CrossRef]
  11. Ginhoux, F.; Lim, S.; Hoeffel, G.; Low, D.; Huber, T. Origin and Differentiation of Microglia. Front. Cell. Neurosci. 2013, 7. [Google Scholar] [CrossRef]
  12. Frost, J.L.; Schafer, D.P. Microglia: Architects of the Developing Nervous System. Trends in Cell Biology 2016, 26, 587–597. [Google Scholar] [CrossRef]
  13. Xuan, F.-L.; Chithanathan, K.; Lilleväli, K.; Yuan, X.; Tian, L. Differences of Microglia in the Brain and the Spinal Cord. Front. Cell. Neurosci. 2019, 13, 504. [Google Scholar] [CrossRef] [PubMed]
  14. Murgoci, A.-N.; Duhamel, M.; Raffo-Romero, A.; Mallah, K.; Aboulouard, S.; Lefebvre, C.; Kobeissy, F.; Fournier, I.; Zilkova, M.; Maderova, D.; et al. Location of Neonatal Microglia Drives Small Extracellular Vesicles Content and Biological Functions in Vitro. Journal of Extracellular Vesicles 2020, 9, 1727637. [Google Scholar] [CrossRef] [PubMed]
  15. Baskar Jesudasan, S.J.; Todd, K.G.; Winship, I.R. Reduced Inflammatory Phenotype in Microglia Derived from Neonatal Rat Spinal Cord versus Brain. PLoS ONE 2014, 9, e99443. [Google Scholar] [CrossRef]
  16. Hammond, T.R.; Dufort, C.; Dissing-Olesen, L.; Giera, S.; Young, A.; Wysoker, A.; Walker, A.J.; Gergits, F.; Segel, M.; Nemesh, J.; et al. Single-Cell RNA Sequencing of Microglia throughout the Mouse Lifespan and in the Injured Brain Reveals Complex Cell-State Changes. Immunity 2019, 50, 253–271.e6. [Google Scholar] [CrossRef]
  17. Nikodemova, M.; Small, A.L.; Smith, S.M.C.; Mitchell, G.S.; Watters, J.J. Spinal but Not Cortical Microglia Acquire an Atypical Phenotype with High VEGF, Galectin-3 and Osteopontin, and Blunted Inflammatory Responses in ALS Rats. Neurobiology of Disease 2014, 69, 43–53. [Google Scholar] [CrossRef]
  18. Gosselin, D.; Skola, D.; Coufal, N.G.; Holtman, I.R.; Schlachetzki, J.C.M.; Sajti, E.; Jaeger, B.N.; O’Connor, C.; Fitzpatrick, C.; Pasillas, M.P.; et al. An Environment-Dependent Transcriptional Network Specifies Human Microglia Identity. Science 2017, 356, eaal3222. [Google Scholar] [CrossRef] [PubMed]
  19. van der Poel, M.; Ulas, T.; Mizee, M.R.; Hsiao, C.-C.; Miedema, S.S.M.; Adelia; Schuurman, K.G.; Helder, B.; Tas, S.W.; Schultze, J.L.; et al. Transcriptional Profiling of Human Microglia Reveals Grey–White Matter Heterogeneity and Multiple Sclerosis-Associated Changes. Nat Commun 2019, 10, 1139. [Google Scholar] [CrossRef] [PubMed]
  20. Zheng, J.; Ru, W.; Adolacion, J.R.; Spurgat, M.S.; Liu, X.; Yuan, S.; Liang, R.X.; Dong, J.; Potter, A.S.; Potter, S.S.; et al. Single-Cell RNA-Seq Analysis Reveals Compartment-Specific Heterogeneity and Plasticity of Microglia. iScience 2021, 24, 102186. [Google Scholar] [CrossRef]
  21. Ribeiro, C.A.; Salgado, A.J.; Fraga, J.S.; Silva, N.A.; Reis, R.L.; Sousa, N. The Secretome of Bone Marrow Mesenchymal Stem Cells-Conditioned Media Varies with Time and Drives a Distinct Effect on Mature Neurons and Glial Cells (Primary Cultures). J Tissue Eng Regen Med 2011, 5, 668–672. [Google Scholar] [CrossRef]
  22. Monteiro, S.; Pinho, A.G.; Macieira, M.; Serre-Miranda, C.; Cibrão, J.R.; Lima, R.; Soares-Cunha, C.; Vasconcelos, N.L.; Lentilhas-Graça, J.; Duarte-Silva, S.; et al. Splenic Sympathetic Signaling Contributes to Acute Neutrophil Infiltration of the Injured Spinal Cord. J Neuroinflammation 2020, 17, 282. [Google Scholar] [CrossRef]
  23. Lima, R.; Monteiro, S.; Lopes, J.; Barradas, P.; Vasconcelos, N.; Gomes, E.; Assunção-Silva, R.; Teixeira, F.; Morais, M.; Sousa, N.; et al. Systemic Interleukin-4 Administration after Spinal Cord Injury Modulates Inflammation and Promotes Neuroprotection. Pharmaceuticals 2017, 10, 83. [Google Scholar] [CrossRef]
  24. Galloway, D.A.; Phillips, A.E.M.; Owen, D.R.J.; Moore, C.S. Phagocytosis in the Brain: Homeostasis and Disease. Front. Immunol. 2019, 10, 790. [Google Scholar] [CrossRef]
  25. Leyh, J.; Paeschke, S.; Mages, B.; Michalski, D.; Nowicki, M.; Bechmann, I.; Winter, K. Classification of Microglial Morphological Phenotypes Using Machine Learning. Front. Cell. Neurosci. 2021, 15, 701673. [Google Scholar] [CrossRef]
  26. Cerqueira, S.R.; Oliveira, J.M.; Silva, N.A.; Leite-Almeida, H.; Ribeiro-Samy, S.; Almeida, A.; Mano, J.F.; Sousa, N.; Salgado, A.J.; Reis, R.L. Microglia Response and In Vivo Therapeutic Potential of Methylprednisolone-Loaded Dendrimer Nanoparticles in Spinal Cord Injury. Small 2013, 9, 738–749. [Google Scholar] [CrossRef] [PubMed]
  27. Ribeiro-Samy, S.; Silva, N.A.; Correlo, V.M.; Fraga, J.S.; Pinto, L.; Teixeira-Castro, A.; Leite-Almeida, H.; Almeida, A.; Gimble, J.M.; Sousa, N.; et al. Development and Characterization of a PHB-HV-Based 3D Scaffold for a Tissue Engineering and Cell-Therapy Combinatorial Approach for Spinal Cord Injury Regeneration: Development and Characterization of a PHB-HV-Based 3D …. Macromol. Biosci. 2013, 13, 1576–1592. [Google Scholar] [CrossRef] [PubMed]
  28. Ciechanowska, A.; Popiolek-Barczyk, K.; Ciapała, K.; Pawlik, K.; Oggioni, M.; Mercurio, D.; de Simoni, M.-G.; Mika, J. Traumatic Brain Injury in Mice Induces Changes in the Expression of the XCL1/XCR1 and XCL1/ITGA9 Axes. Pharmacol. Rep 2020, 72, 1579–1592. [Google Scholar] [CrossRef]
  29. Lima, R.; Gomes, E.D.; Cibrão, J.R.; Rocha, L.A.; Assunção-Silva, R.C.; Rodrigues, C.S.; Neves-Carvalho, A.; Monteiro, S.; Salgado, A.J.; Silva, N.A. Levetiracetam Treatment Leads to Functional Recovery after Thoracic or Cervical Injuries of the Spinal Cord. npj Regen Med 2021, 6, 11. [Google Scholar] [CrossRef] [PubMed]
  30. Cai, L.; Gong, Q.; Qi, L.; Xu, T.; Suo, Q.; Li, X.; Wang, W.; Jing, Y.; Yang, D.; Xu, Z.; et al. ACT001 Attenuates Microglia-Mediated Neuroinflammation after Traumatic Brain Injury via Inhibiting AKT/NFκB/NLRP3 Pathway. Cell Commun Signal 2022, 20, 56. [Google Scholar] [CrossRef] [PubMed]
  31. Tan, Y.-L.; Yuan, Y.; Tian, L. Microglial Regional Heterogeneity and Its Role in the Brain. Mol Psychiatry 2020, 25, 351–367. [Google Scholar] [CrossRef]
  32. He, Y. Mouse Primary Microglia Respond Differently to LPS and Poly(I:C) in Vitro. Scientific Reports 2021, 14. [Google Scholar] [CrossRef]
  33. Lin, C.-F.; Tsai, C.-C.; Huang, W.-C.; Wang, C.-Y.; Tseng, H.-C.; Wang, Y.; Kai, J.-I.; Wang, S.-W.; Cheng, Y.-L. IFN-γ Synergizes with LPS to Induce Nitric Oxide Biosynthesis through Glycogen Synthase Kinase-3-Inhibited IL-10. J. Cell. Biochem. 2008, 105, 746–755. [Google Scholar] [CrossRef] [PubMed]
  34. Jurga, A.M.; Paleczna, M.; Kuter, K.Z. Overview of General and Discriminating Markers of Differential Microglia Phenotypes. Front. Cell. Neurosci. 2020, 14, 198. [Google Scholar] [CrossRef] [PubMed]
  35. Oria, M.; Figueira, R.L.; Scorletti, F.; Sbragia, L.; Owens, K.; Li, Z.; Pathak, B.; Corona, M.U.; Marotta, M.; Encinas, J.L.; et al. CD200-CD200R Imbalance Correlates with Microglia and pro-Inflammatory Activation in Rat Spinal Cords Exposed to Amniotic Fluid in Retinoic Acid-Induced Spina Bifida. Sci Rep 2018, 8, 10638. [Google Scholar] [CrossRef] [PubMed]
  36. de Haas, A.H.; Boddeke, H.W.G.M.; Biber, K. Region-Specific Expression of Immunoregulatory Proteins on Microglia in the Healthy CNS. Glia 2008, 56, 888–894. [Google Scholar] [CrossRef]
  37. Abellanas, M.A.; Zamarbide, M.; Basurco, L.; Luquin, E.; Garcia-Granero, M.; Clavero, P.; San Martin-Uriz, P.; Vilas, A.; Mengual, E.; Hervas-Stubbs, S.; et al. Midbrain Microglia Mediate a Specific Immunosuppressive Response under Inflammatory Conditions. J Neuroinflammation 2019, 16, 233. [Google Scholar] [CrossRef] [PubMed]
  38. Zhang, F.; Vadakkan, K.I.; Kim, S.S.; Wu, L.-J.; Shang, Y.; Zhuo, M. Selective Activation of Microglia in Spinal Cord but Not Higher Cortical Regions Following Nerve Injury in Adult Mouse. Mol Pain 2008, 4, 1744-8069-4–15. [Google Scholar] [CrossRef]
  39. Benusa, S.D.; George, N.M.; Dupree, J.L. Microglial Heterogeneity: Distinct Cell Types or Differential Functional Adaptation? NN 2020, 2020. [Google Scholar] [CrossRef]
  40. Sierra-Torre, V.; Plaza-Zabala, A.; Bonifazi, P.; Abiega, O.; Díaz-Aparicio, I.; Tegelberg, S.; Lehesjoki, A.-E.; Valero, J.; Sierra, A. Microglial Phagocytosis Dysfunction Is Related to Local Neuronal Activity in a Genetic Model of Epilepsy; Neuroscience, 2020;
  41. Ding, Z.-B.; Han, Q.-X.; Song, L.-J.; Wang, Q.; Han, G.-Y.; Chu, G.-G.; Li, Y.-Q.; Chai, Z.; Yu, J.-Z.; Xiao, B.-G.; et al. Fasudil-Triggered Phagocytosis of Myelin Debris Promoted Meylin Regeneration via the Activation of TREM2/DAP12 Signaling Pathway in Cuprizone-Induced Mice; In Review, 2021;
  42. Morini, R.; Bizzotto, M.; Perrucci, F.; Filipello, F.; Matteoli, M. Strategies and Tools for Studying Microglial-Mediated Synapse Elimination and Refinement. Front. Immunol. 2021, 12, 640937. [Google Scholar] [CrossRef]
  43. Sinha, A.; Kushwaha, R.; Molesworth, K.; Mychko, O.; Makarava, N.; Baskakov, I.V. Phagocytic Activities of Reactive Microglia and Astrocytes Associated with Prion Diseases Are Dysregulated in Opposite Directions. Cells 2021, 10, 1728. [Google Scholar] [CrossRef]
  44. Stark, M.A.; Huo, Y.; Burcin, T.L.; Morris, M.A.; Olson, T.S.; Ley, K. Phagocytosis of Apoptotic Neutrophils Regulates Granulopoiesis via IL-23 and IL-17. Immunity 2005, 22, 285–294. [Google Scholar] [CrossRef]
  45. Chung, E.Y.; Kim, S.J.; Ma, X.J. Regulation of Cytokine Production during Phagocytosis of Apoptotic Cells. Cell Res 2006, 16, 154–161. [Google Scholar] [CrossRef]
  46. Smith, E.; Zarbock, A.; Stark, M.A.; Burcin, T.L.; Bruce, A.C.; Foley, P.; Ley, K. IL-23 Is Required for Neutrophil Homeostasis in Normal and Neutrophilic Mice. J Immunol 2007, 179, 8274–8279. [Google Scholar] [CrossRef]
  47. Hou, Y.; Zhu, L.; Tian, H.; Sun, H.-X.; Wang, R.; Zhang, L.; Zhao, Y. IL-23-Induced Macrophage Polarization and Its Pathological Roles in Mice with Imiquimod-Induced Psoriasis. Protein Cell 2018, 9, 1027–1038. [Google Scholar] [CrossRef]
  48. Sonobe, Y.; Liang, J.; Jin, S.; Zhang, G.; Takeuchi, H.; Mizuno, T.; Suzumura, A. Microglia Express a Functional Receptor for Interleukin-23. Biochemical and Biophysical Research Communications 2008, 370, 129–133. [Google Scholar] [CrossRef] [PubMed]
  49. Khader, S.A.; Thirunavukkarasu, S. The Tale of IL-12 and IL-23: A Paradigm Shift. J.I. 2019, 202, 629–630. [Google Scholar] [CrossRef] [PubMed]
  50. Nitsch, L.; Schneider, L.; Zimmermann, J.; Müller, M. Microglia-Derived Interleukin 23: A Crucial Cytokine in Alzheimer’s Disease? Front. Neurol. 2021, 12, 639353. [Google Scholar] [CrossRef] [PubMed]
  51. Li, J.; Gran, B.; Zhang, G.-X.; Ventura, E.S.; Siglienti, I.; Rostami, A.; Kamoun, M. Differential Expression and Regulation of IL-23 and IL-12 Subunits and Receptors in Adult Mouse Microglia. Journal of the Neurological Sciences 2003, 215, 95–103. [Google Scholar] [CrossRef] [PubMed]
  52. Tang, C.; Chen, S.; Qian, H.; Huang, W. Interleukin-23: As a Drug Target for Autoimmune Inflammatory Diseases. Immunology 2012, 135, 112–124. [Google Scholar] [CrossRef]
  53. Grubman, A.; Choo, X.Y.; Chew, G.; Ouyang, J.F.; Sun, G.; Croft, N.P.; Rossello, F.J.; Simmons, R.; Buckberry, S.; Landin, D.V.; et al. Transcriptional Signature in Microglia Associated with Aβ Plaque Phagocytosis. Nat Commun 2021, 12, 3015. [Google Scholar] [CrossRef] [PubMed]
  54. Wheeler, R.D.; Brough, D.; Le Feuvre, R.A.; Takeda, K.; Iwakura, Y.; Luheshi, G.N.; Rothwell, N.J. Interleukin-18 Induces Expression and Release of Cytokines from Murine Glial Cells: Interactions with Interleukin-1β: IL-18 and IL-1β in Microglia. Journal of Neurochemistry 2003, 85, 1412–1420. [Google Scholar] [CrossRef]
  55. Alboni, S.; Cervia, D.; Sugama, S.; Conti, B. Interleukin 18 in the CNS. J Neuroinflammation 2010, 7, 9. [Google Scholar] [CrossRef] [PubMed]
  56. Wu, D.; Zhang, G.; Zhao, C.; Yang, Y.; Miao, Z.; Xu, X. Interleukin-18 from Neurons and Microglia Mediates Depressive Behaviors in Mice with Post-Stroke Depression. Brain, Behavior, and Immunity 2020, 88, 411–420. [Google Scholar] [CrossRef]
  57. Gong, Q.; Lin, Y.; Lu, Z.; Xiao, Z. Involvement of Interleukin-18-Mediated Microglia/Astrocyte Interaction in Experimental Models of Migraine; In Review, 2020;
  58. Yamanishi, K.; Doe, N.; Mukai, K.; Hashimoto, T.; Gamachi, N.; Hata, M.; Watanabe, Y.; Yamanishi, C.; Yagi, H.; Okamura, H.; et al. Acute Stress Induces Severe Neural Inflammation and Overactivation of Glucocorticoid Signaling in Interleukin-18-Deficient Mice. Transl Psychiatry 2022, 12, 404. [Google Scholar] [CrossRef]
  59. Moraes, T.R.; Elisei, L.S.; Malta, I.H.; Galdino, G. Participation of CXCL1 in the Glial Cells during Neuropathic Pain. European Journal of Pharmacology 2020, 875, 173039. [Google Scholar] [CrossRef]
  60. Serdar, M.; Kempe, K.; Herrmann, R.; Picard, D.; Remke, M.; Herz, J.; Bendix, I.; Felderhoff-Müser, U.; Sabir, H. Involvement of CXCL1/CXCR2 During Microglia Activation Following Inflammation-Sensitized Hypoxic-Ischemic Brain Injury in Neonatal Rats. Front. Neurol. 2020, 11, 540878. [Google Scholar] [CrossRef] [PubMed]
  61. Constantinescu, C.S.; Tani, M.; Ransohoff, R.M.; Wysocka, M.; Hilliard, B.; Fujioka, T.; Murphy, S.; Tighe, P.J.; Sarma, J.D.; Trinchieri, G.; et al. Astrocytes as Antigen-Presenting Cells: Expression of IL-12/IL-23. J Neurochem 2005, 95, 331–340. [Google Scholar] [CrossRef] [PubMed]
  62. Omari, K.M.; John, G.R.; Sealfon, S.C.; Raine, C.S. CXC Chemokine Receptors on Human Oligodendrocytes: Implications for Multiple Sclerosis. Brain 2005, 128, 1003–1015. [Google Scholar] [CrossRef]
  63. Savage, J.C.; Carrier, M.; Tremblay, M.-È. Morphology of Microglia Across Contexts of Health and Disease. In Microglia; Garaschuk, O., Verkhratsky, A., Eds.; Methods in Molecular Biology; Springer New York: New York, NY, 2019; Volume 2034, pp. 13–26. ISBN 978-1-4939-9657-5. [Google Scholar]
  64. Kongsui, R.; Beynon, S.B.; Johnson, S.J.; Walker, F.R. Quantitative Assessment of Microglial Morphology and Density Reveals Remarkable Consistency in the Distribution and Morphology of Cells within the Healthy Prefrontal Cortex of the Rat. 2014, 9.
  65. Colombo, G.; Cubero, R.J.A.; Kanari, L.; Venturino, A.; Schulz, R.; Scolamiero, M.; Agerberg, J.; Mathys, H.; Tsai, L.-H.; Chachólski, W.; et al. A Tool for Mapping Microglial Morphology, MorphOMICs, Reveals Brain-Region and Sex-Dependent Phenotypes. Nat Neurosci 2022, 25, 1379–1393. [Google Scholar] [CrossRef]
  66. Xu, L.; Wang, J.; Ding, Y.; Wang, L.; Zhu, Y.-J. Current Knowledge of Microglia in Traumatic Spinal Cord Injury. Front. Neurol. 2022, 12, 796704. [Google Scholar] [CrossRef]
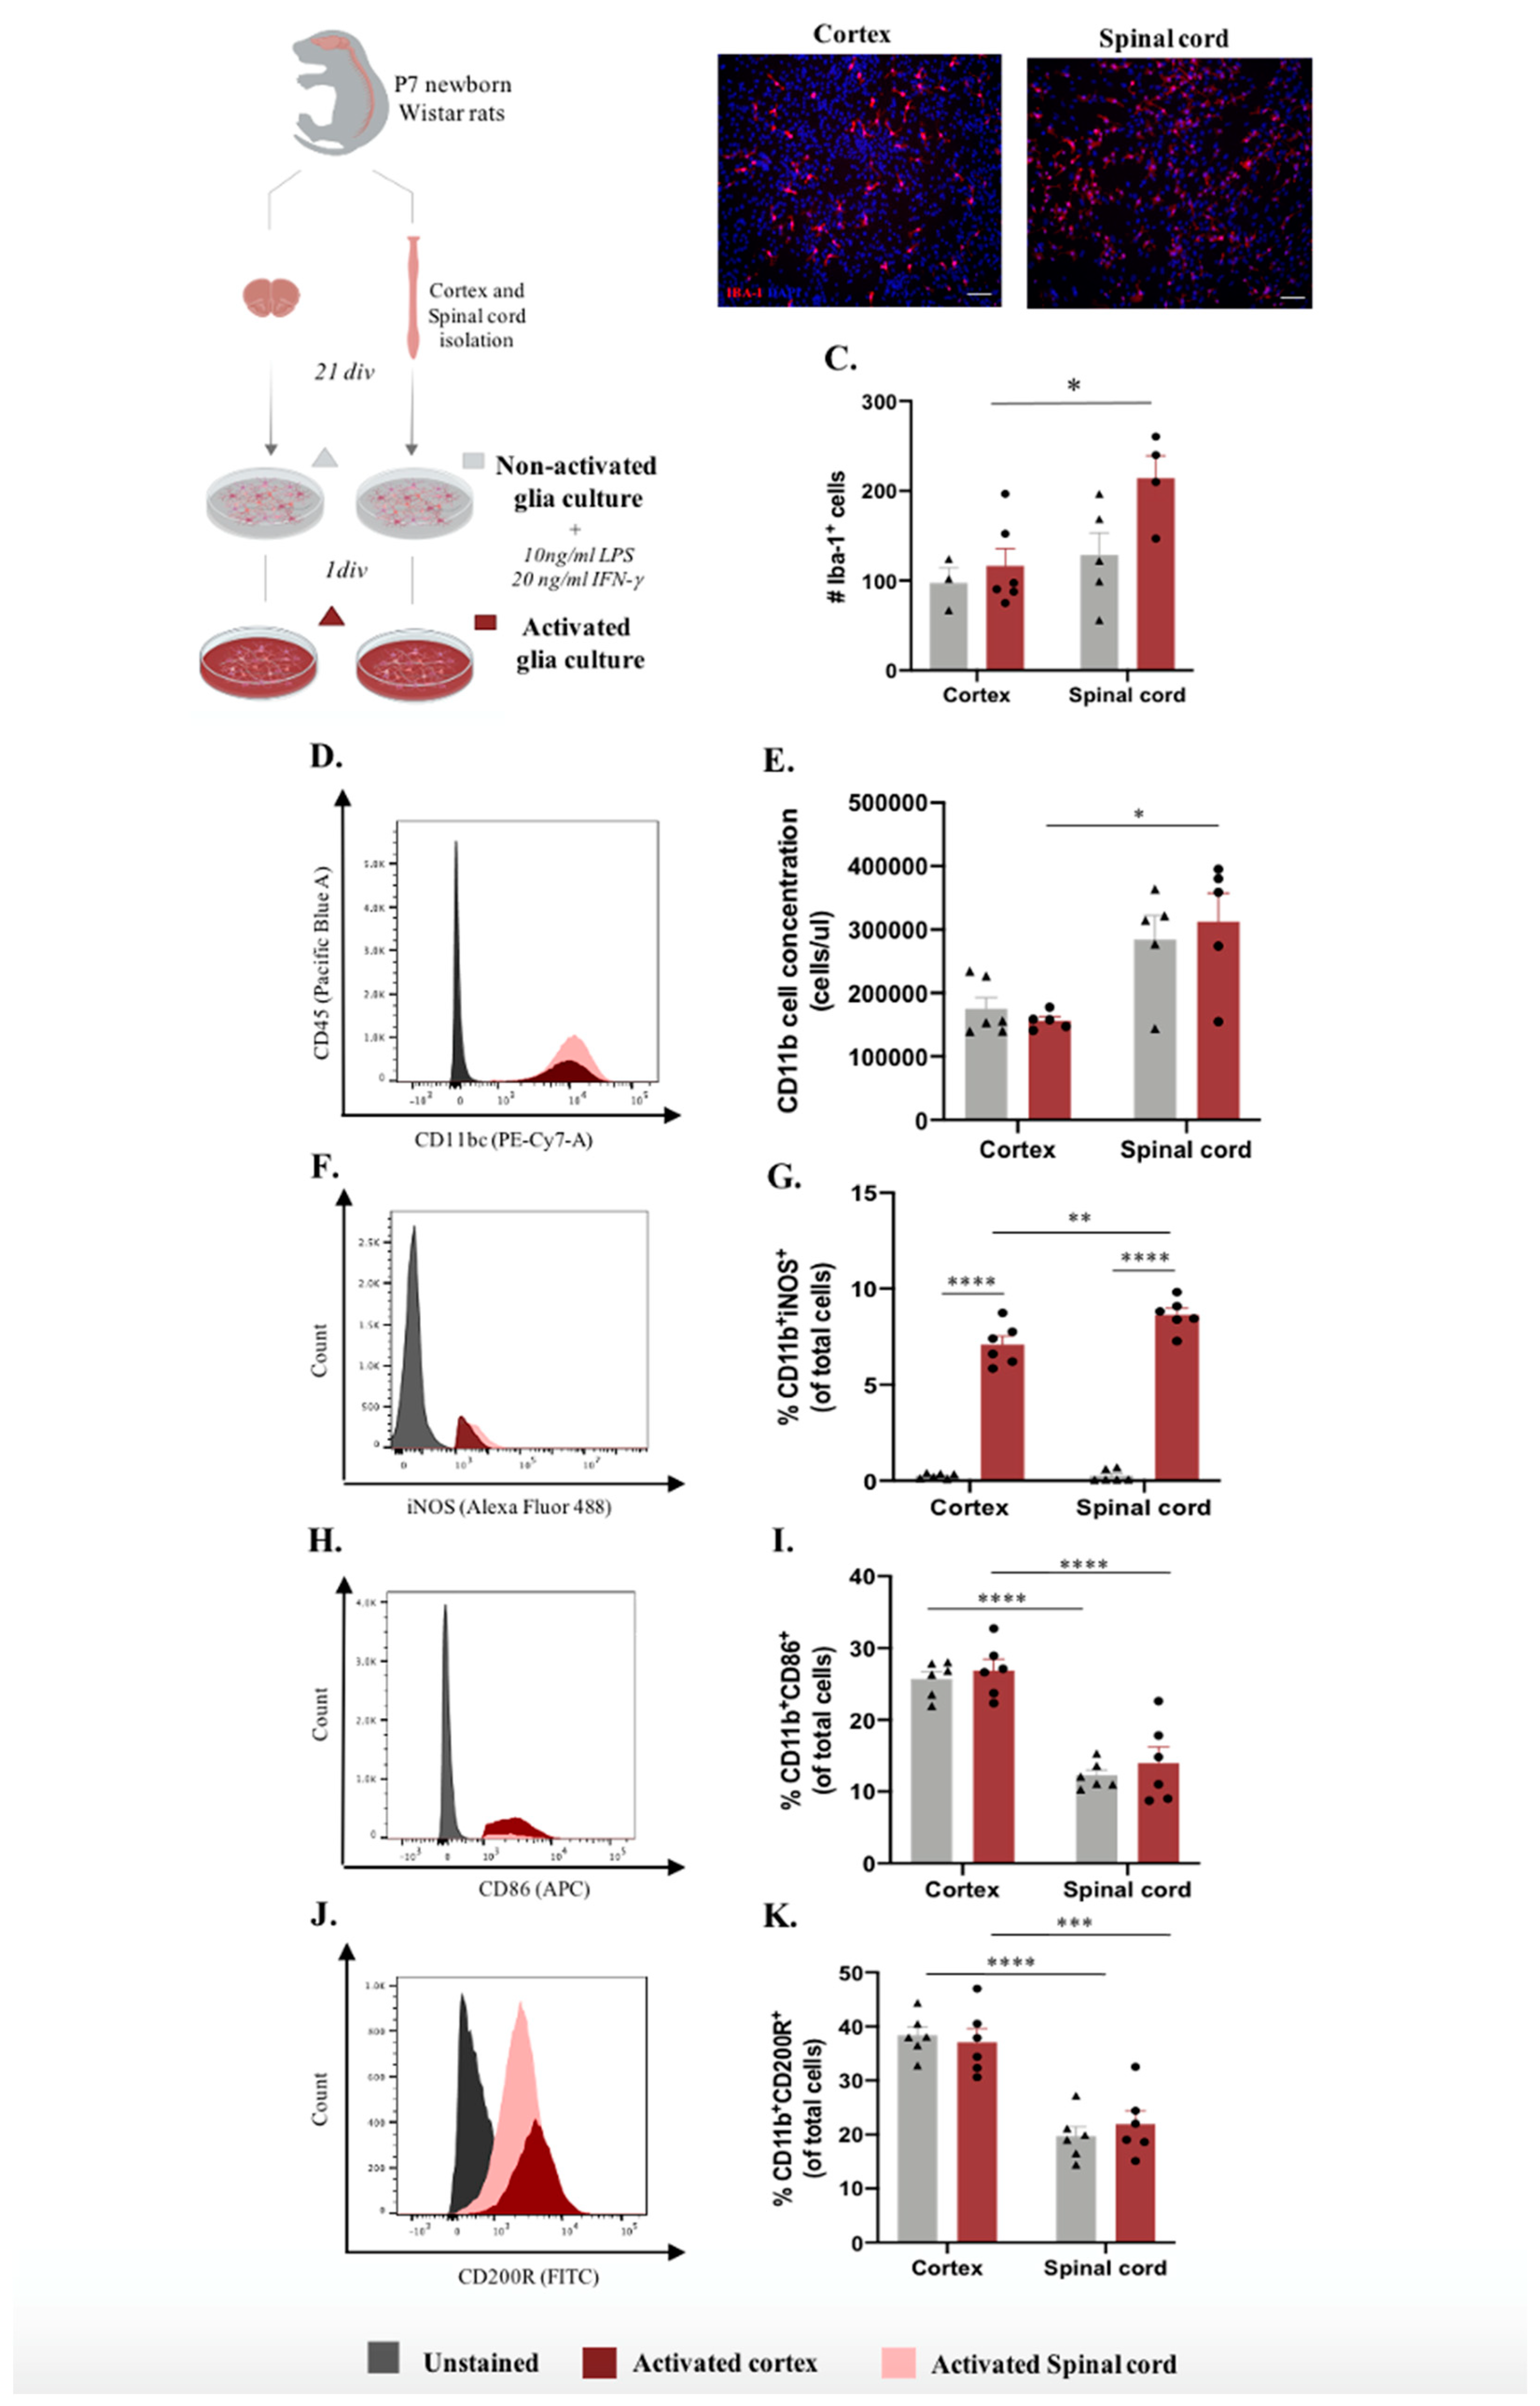
Figure 1. Microglia differences in vitro according to Central Nervous System (CNS) spatial origin. A. Experimental setup of the in vitro protocol used to compare microglia from the cortex and spinal cord on both non-activated and activated conditions. B. Representative images of cortex and spinal cord non-activated glial cultures. Scale bar: 100μm. C. Quantification of the IBA-1+ cells in basal and activated conditions D. Representative histogram of CD11b/c population in cortex cultures (highlighted in red) and spinal cord (highlighted in pink). E. Cell concentration of microglia in glial cultures in basal and activated conditions. F. Representative histogram of iNOS expression on activated cortex (highlighted in red) and spinal cord (highlighted in pink) microglial cells. G. Cell concentration of microglia iNOS+ in basal and activated conditions. H. Representative histogram of CD86 expression in activated cortex cultures (highlighted in red) and spinal cord (highlighted in pink) microglial cells. I. Cell concentration of microglia CD86+ on basal and activated conditions. J. Representative histogram of CD200R expression activated cortex (highlighted in red) and spinal cord (highlighted in pink) microglial cells. K. Cell concentration of microglia CD200R+ on basal and activated conditions. n=3-6, number of independent cell culture wells. Results expressed as mean ± SEM. *p <0.05; **p <0.01, ***p < 0.001 and ****p < 0.0001.
Preprints 70327 g001
Figure 2. - Central nervous system spatial origin alters microglia phagocytosis in vitro. A. Experimental setup of the in vitro protocol used to compare microglia phagocytosis B. Microglia phagocytosis rate quantification by immunocytochemistry on basal and activated culture conditions C. Microglia phagocytosis rate determination by flow cytometry in glial cultures non and activated conditions. D. IL-23 concentration on basal and activated glial cultures supernatants before and after incubation with GFP microspheres. E. IL-18 concentration on basal and activated glial cultures supernatants before and after incubation with GFP microspheres. F. CXCL1 concentration on the different paradigms. Limit of detection on cytokine analysis: 0.1065 (IL-23), 0.0138 (IL-18) and 0.0044 (CXCL1). n=3-6, number of independent cell culture wells. Results expressed as mean ± SEM. *p <0.05, **p <0.01, ***p < 0.001 and ****p < 0.0001.
Preprints 70327 g002
Figure 3. Cortex microglial cells are morphologically more complex than spinal cord microglia at in vitro and in vivo levels. A. Experimental setup of the in vitro protocol used to compare microglia morphology. B. Sholl analysis protocol steps from acquired microscope images of IBA-1 staining, binary conversion on Fiji software and application of Sholl analysis plugin on individual microglial cells. Scale bar in white represents 100 μm. C. Quantification of microglial cell intersections. D. Experimental setup of the in vivo protocol used to compare microglia morphology. E. Sholl analysis protocol steps from acquired confocal images of CX3CR1-GFP+ cells, binary conversion on Fiji software and application of Sholl analysis plugin on individual microglial cells. Scale bar in white represents 100 μm. F. Quantification of microglial cell intersections. n=10, number of individual cells analyzed. Results expressed as mean ± SEM. *p <0.05, **p <0.01, ***p < 0.001 and ****p < 0.0001.
Preprints 70327 g003
Disclaimer/Publisher’s Note: The statements, opinions and data contained in all publications are solely those of the individual author(s) and contributor(s) and not of MDPI and/or the editor(s). MDPI and/or the editor(s) disclaim responsibility for any injury to people or property resulting from any ideas, methods, instructions or products referred to in the content.
Copyright: This open access article is published under a Creative Commons CC BY 4.0 license, which permit the free download, distribution, and reuse, provided that the author and preprint are cited in any reuse.
Alerts
Prerpints.org logo

Preprints.org is a free preprint server supported by MDPI in Basel, Switzerland.

Subscribe

© 2025 MDPI (Basel, Switzerland) unless otherwise stated