Submitted:
02 April 2023
Posted:
03 April 2023
You are already at the latest version
Abstract
Keywords:
1. Introduction
2. Materials and methods
2.1. Pilot plant setup and operating conditions
2.2. Metabolic activity batch tests
2.3. Microbial community analysis
2.4. Single-cell Raman micro-spectroscopy-based phenotyping
2.5. Chemical analyses
2.6. Statistics
3. Results and Discussion
3.1. Performance of the P(D)N-S2EBPR system
3.2. Mass balance of the P(D)N-S2EBPR system
3.2.1. Mass balance of carbon and impact of carbon load and composition on S2EBPR
3.2.2. Mass balance of phosphorus and nitrogen
3.3. Metabolic activities of functionally relevant microorganisms
3.3.1. Temporal dynamics of EBPR activities
3.3.2. EBPR kinetic rates and stoichiometric ratios
3.3.3. DPAO activity
3.4. Microbial community analysis revealed higher PAO diversity and unknown candidate PAOs
3.5. Quantification and phenotypic profiling of PAOs via SCRS analysis
3.6. Quantification of intracellular polymers indicated carbon flux at population levels
4. Conclusions
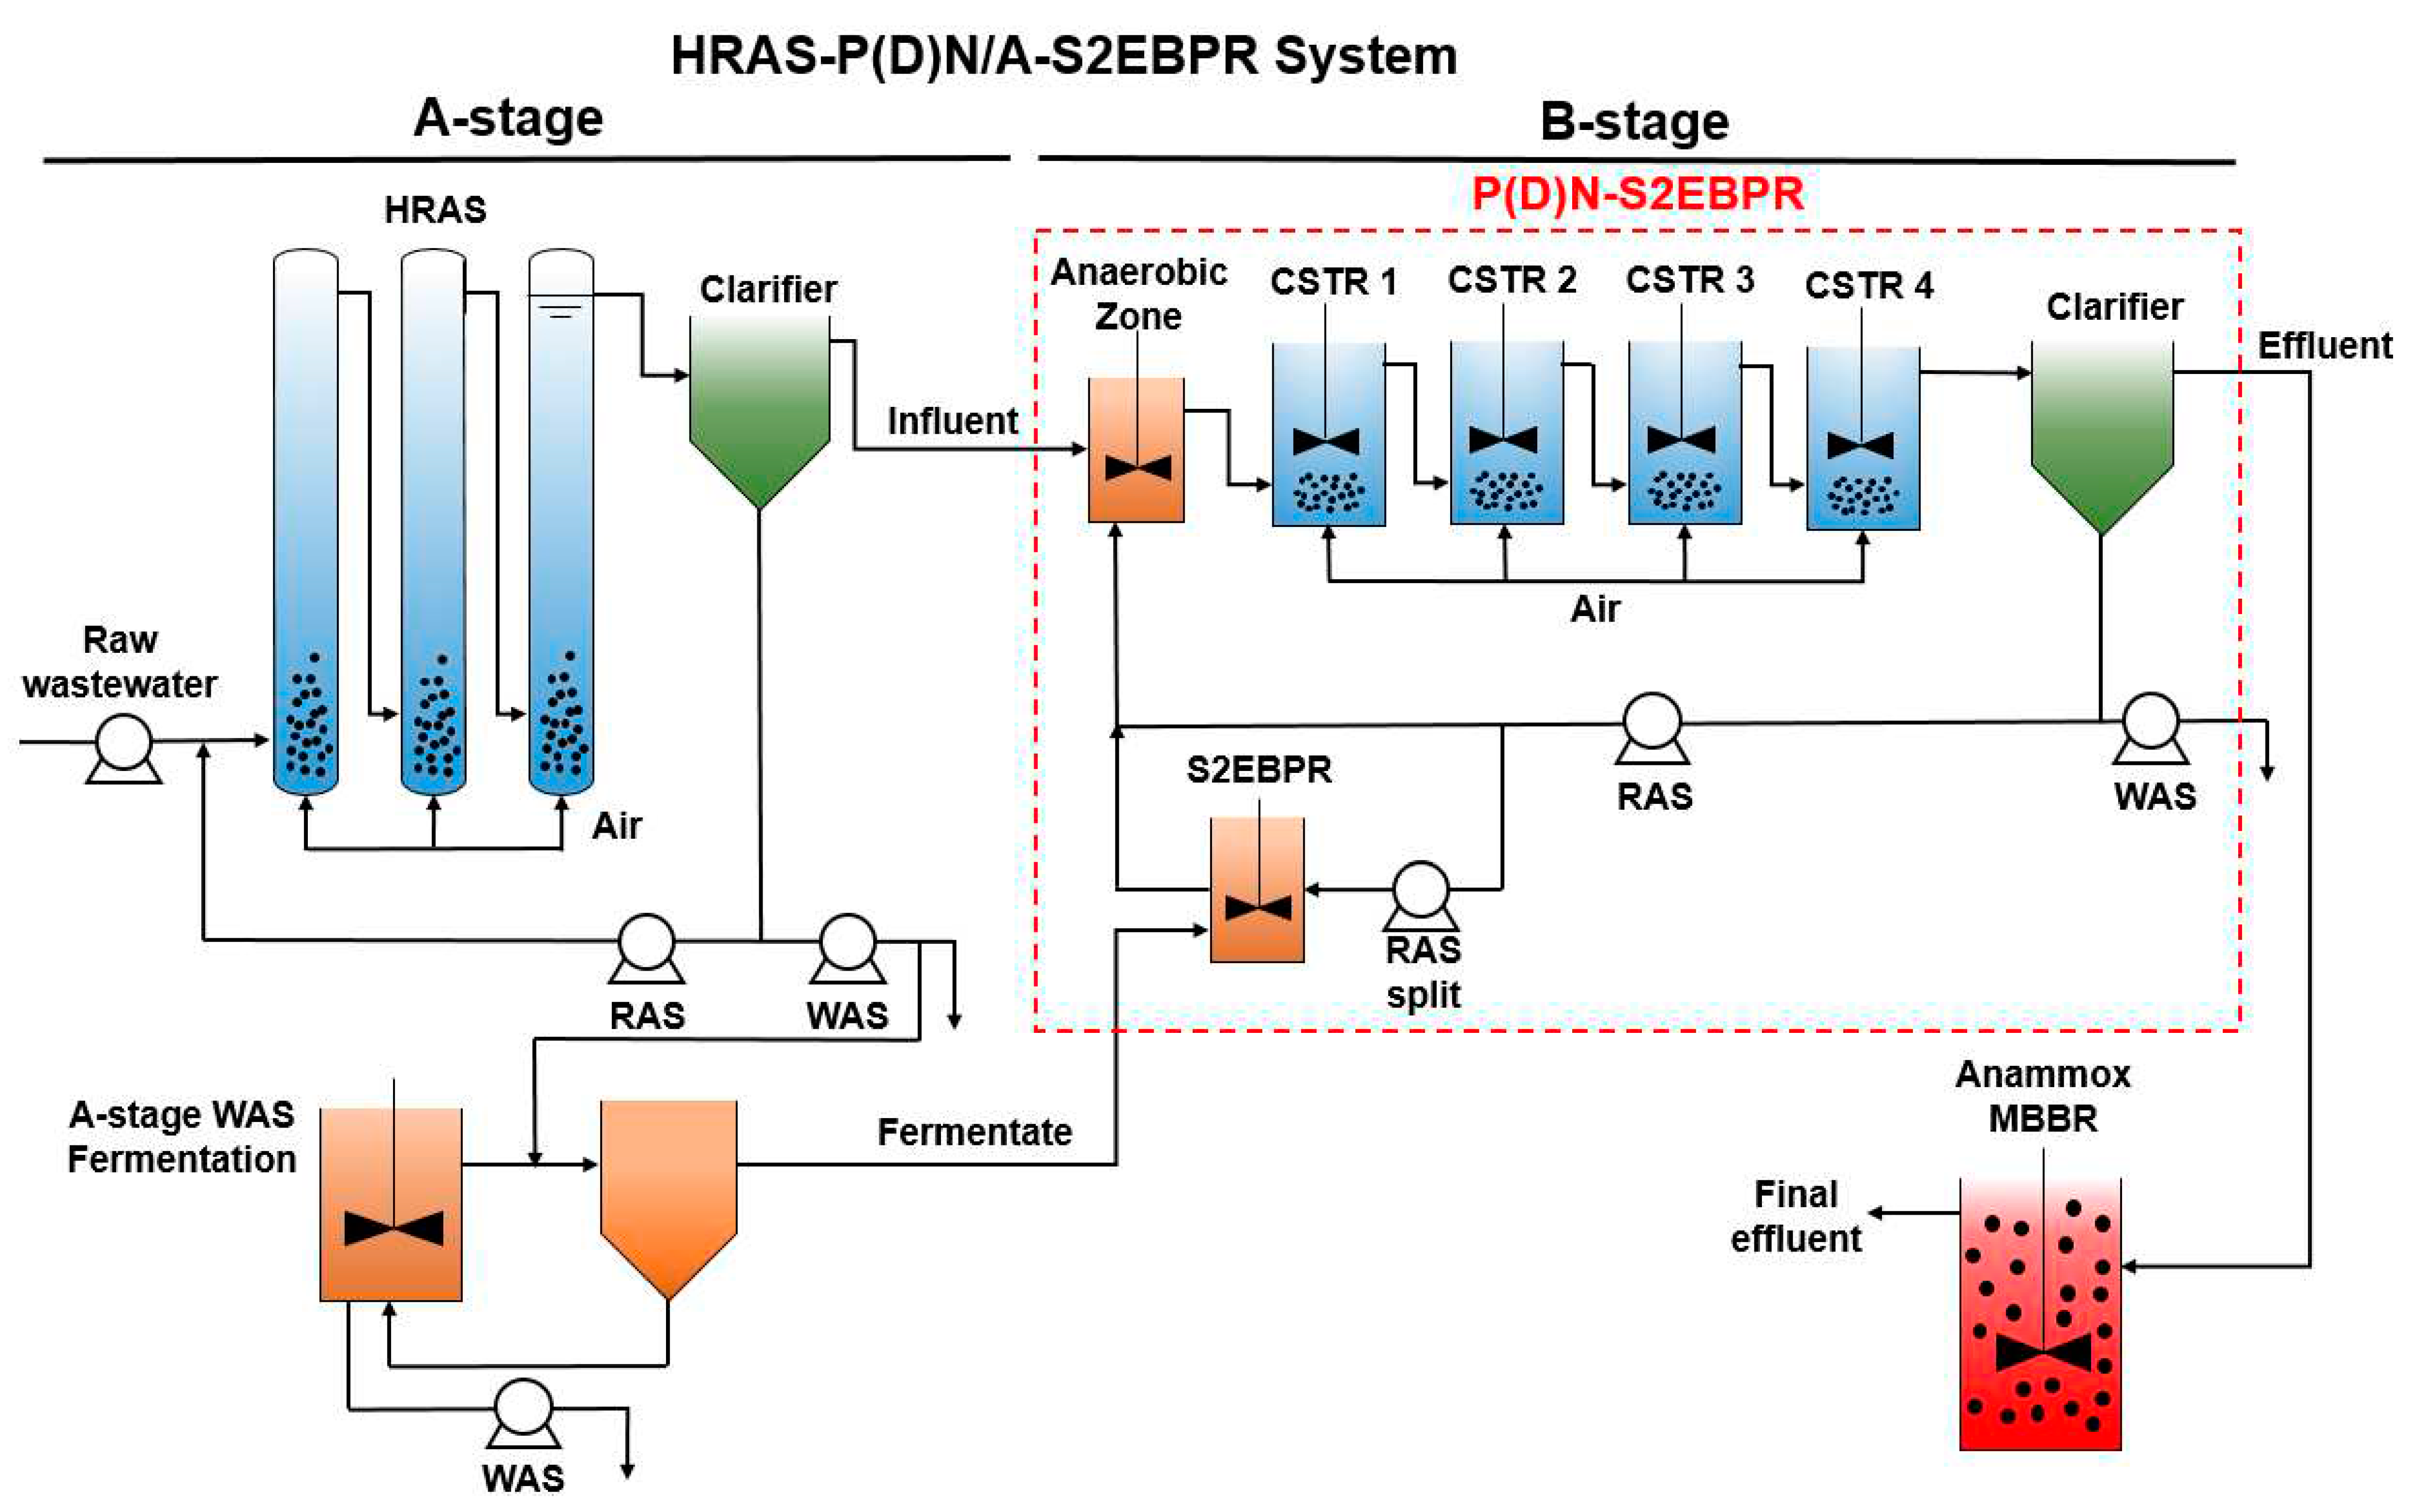
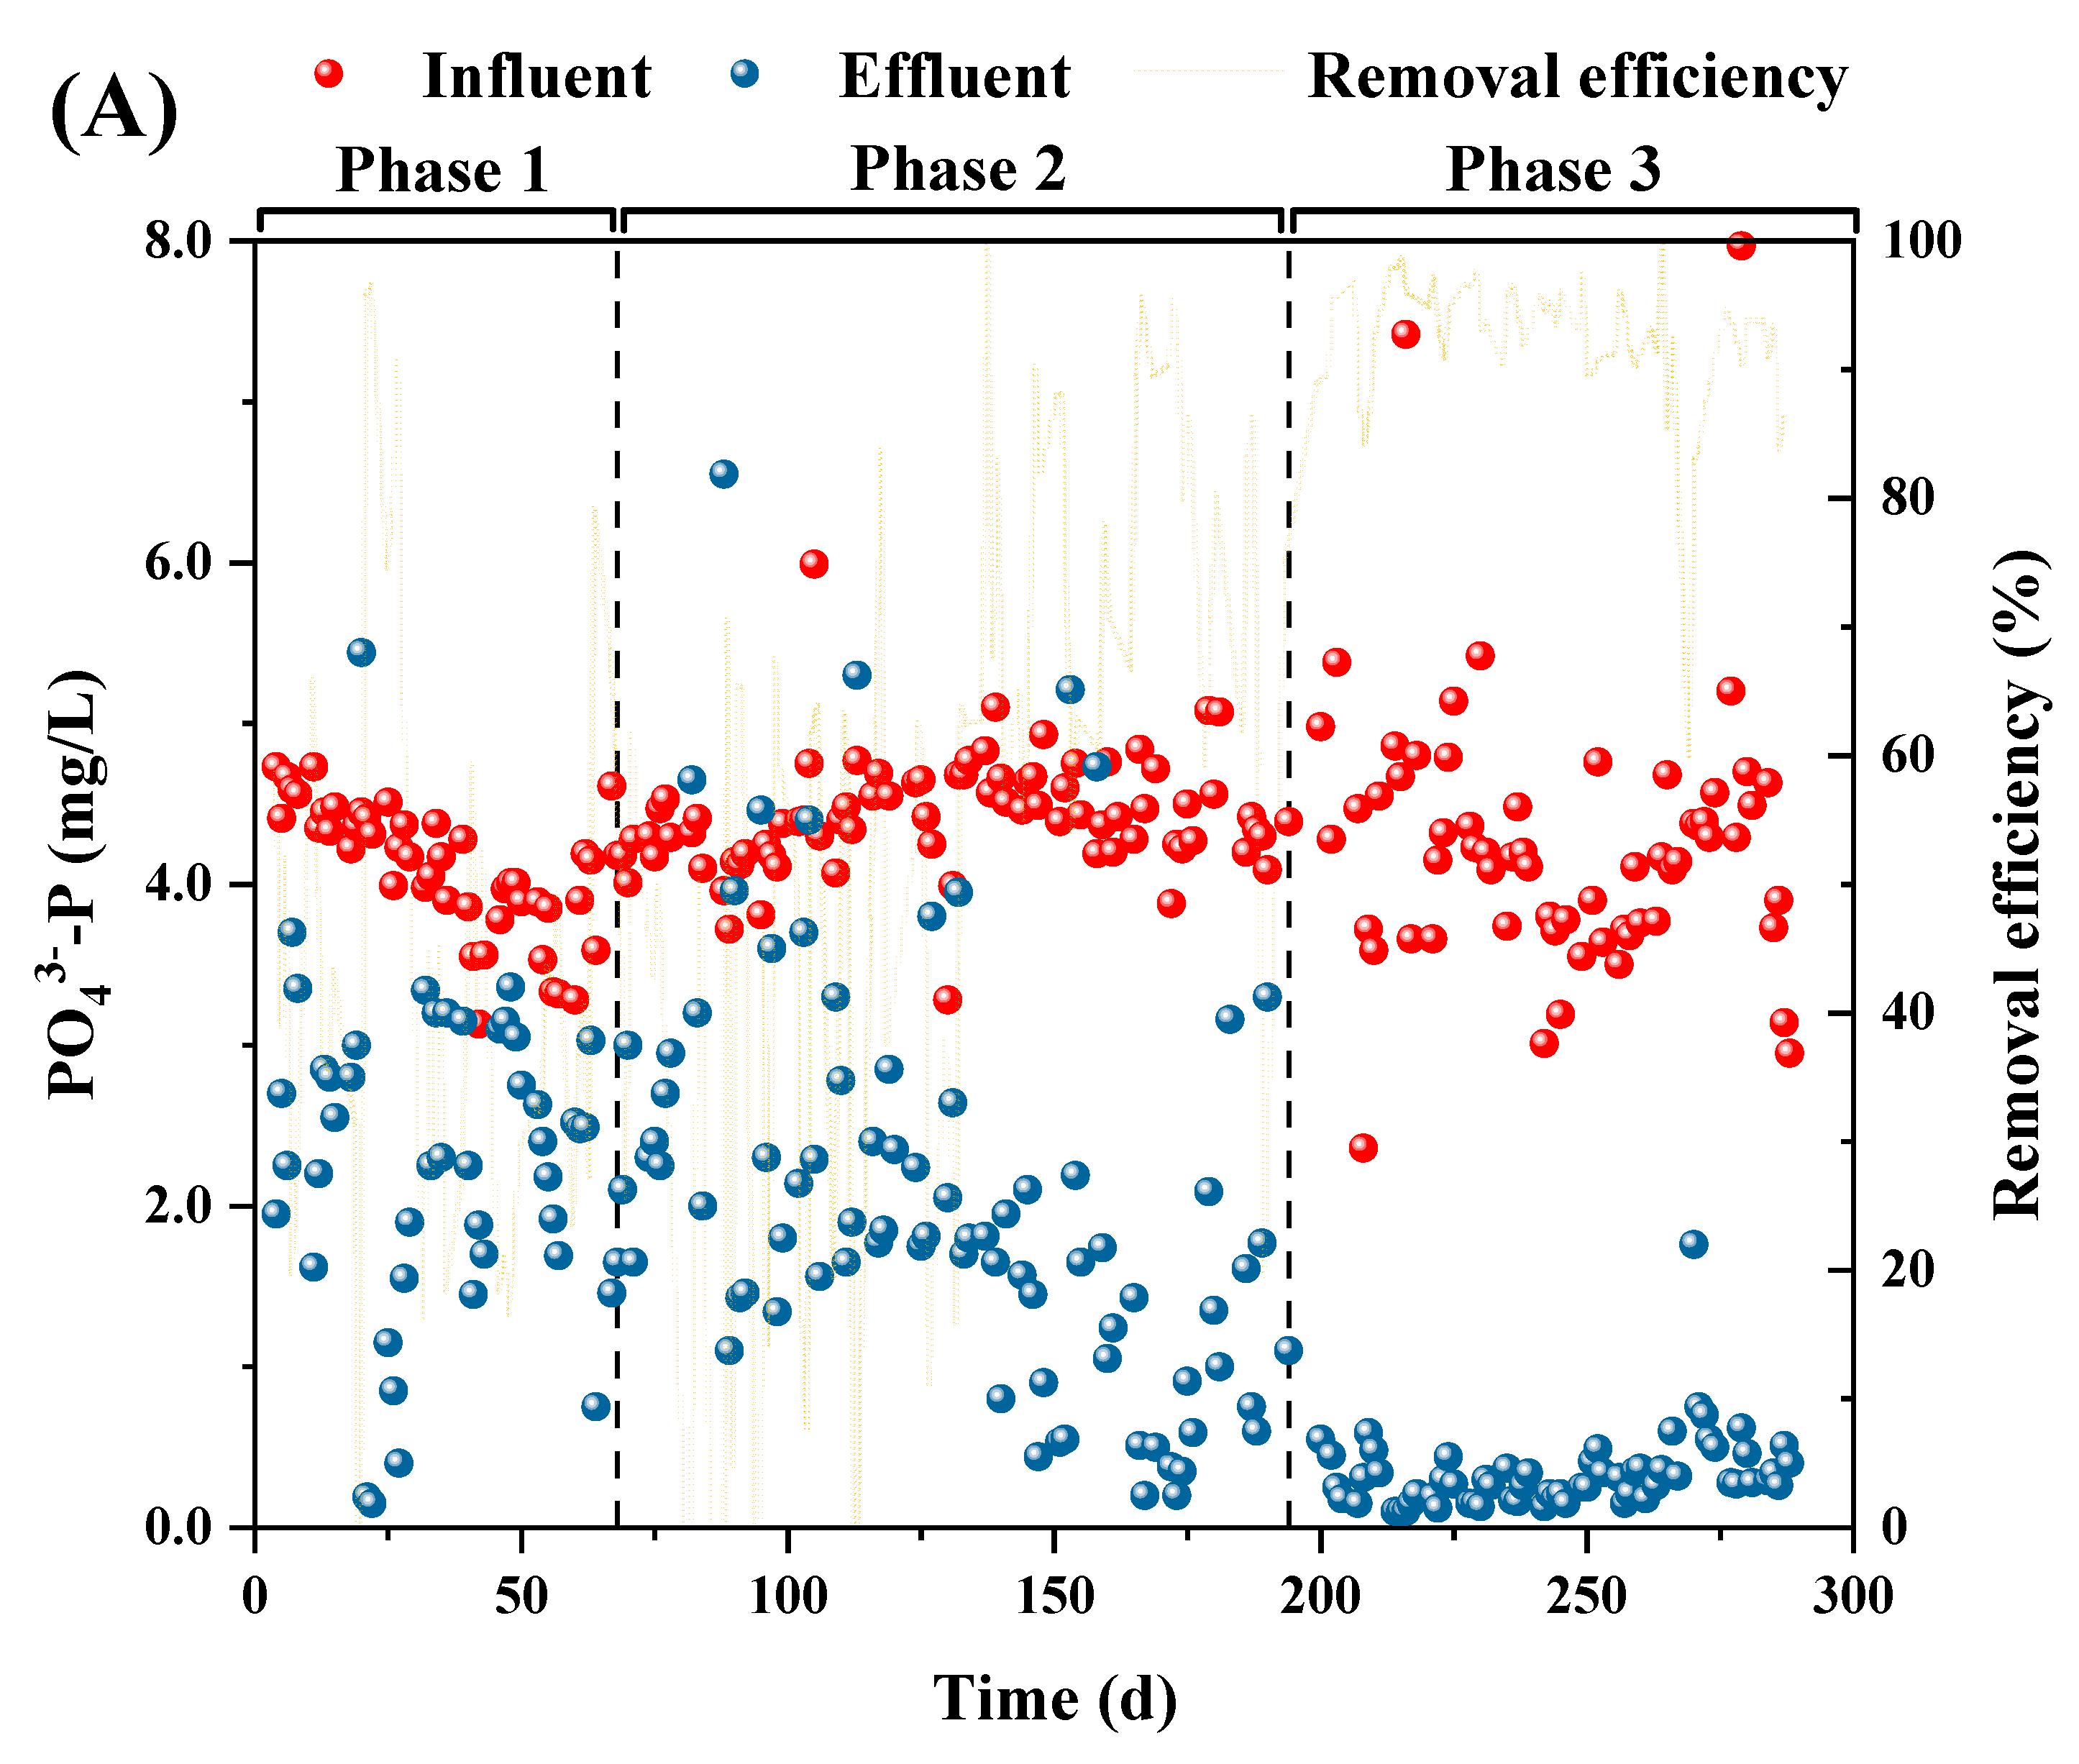
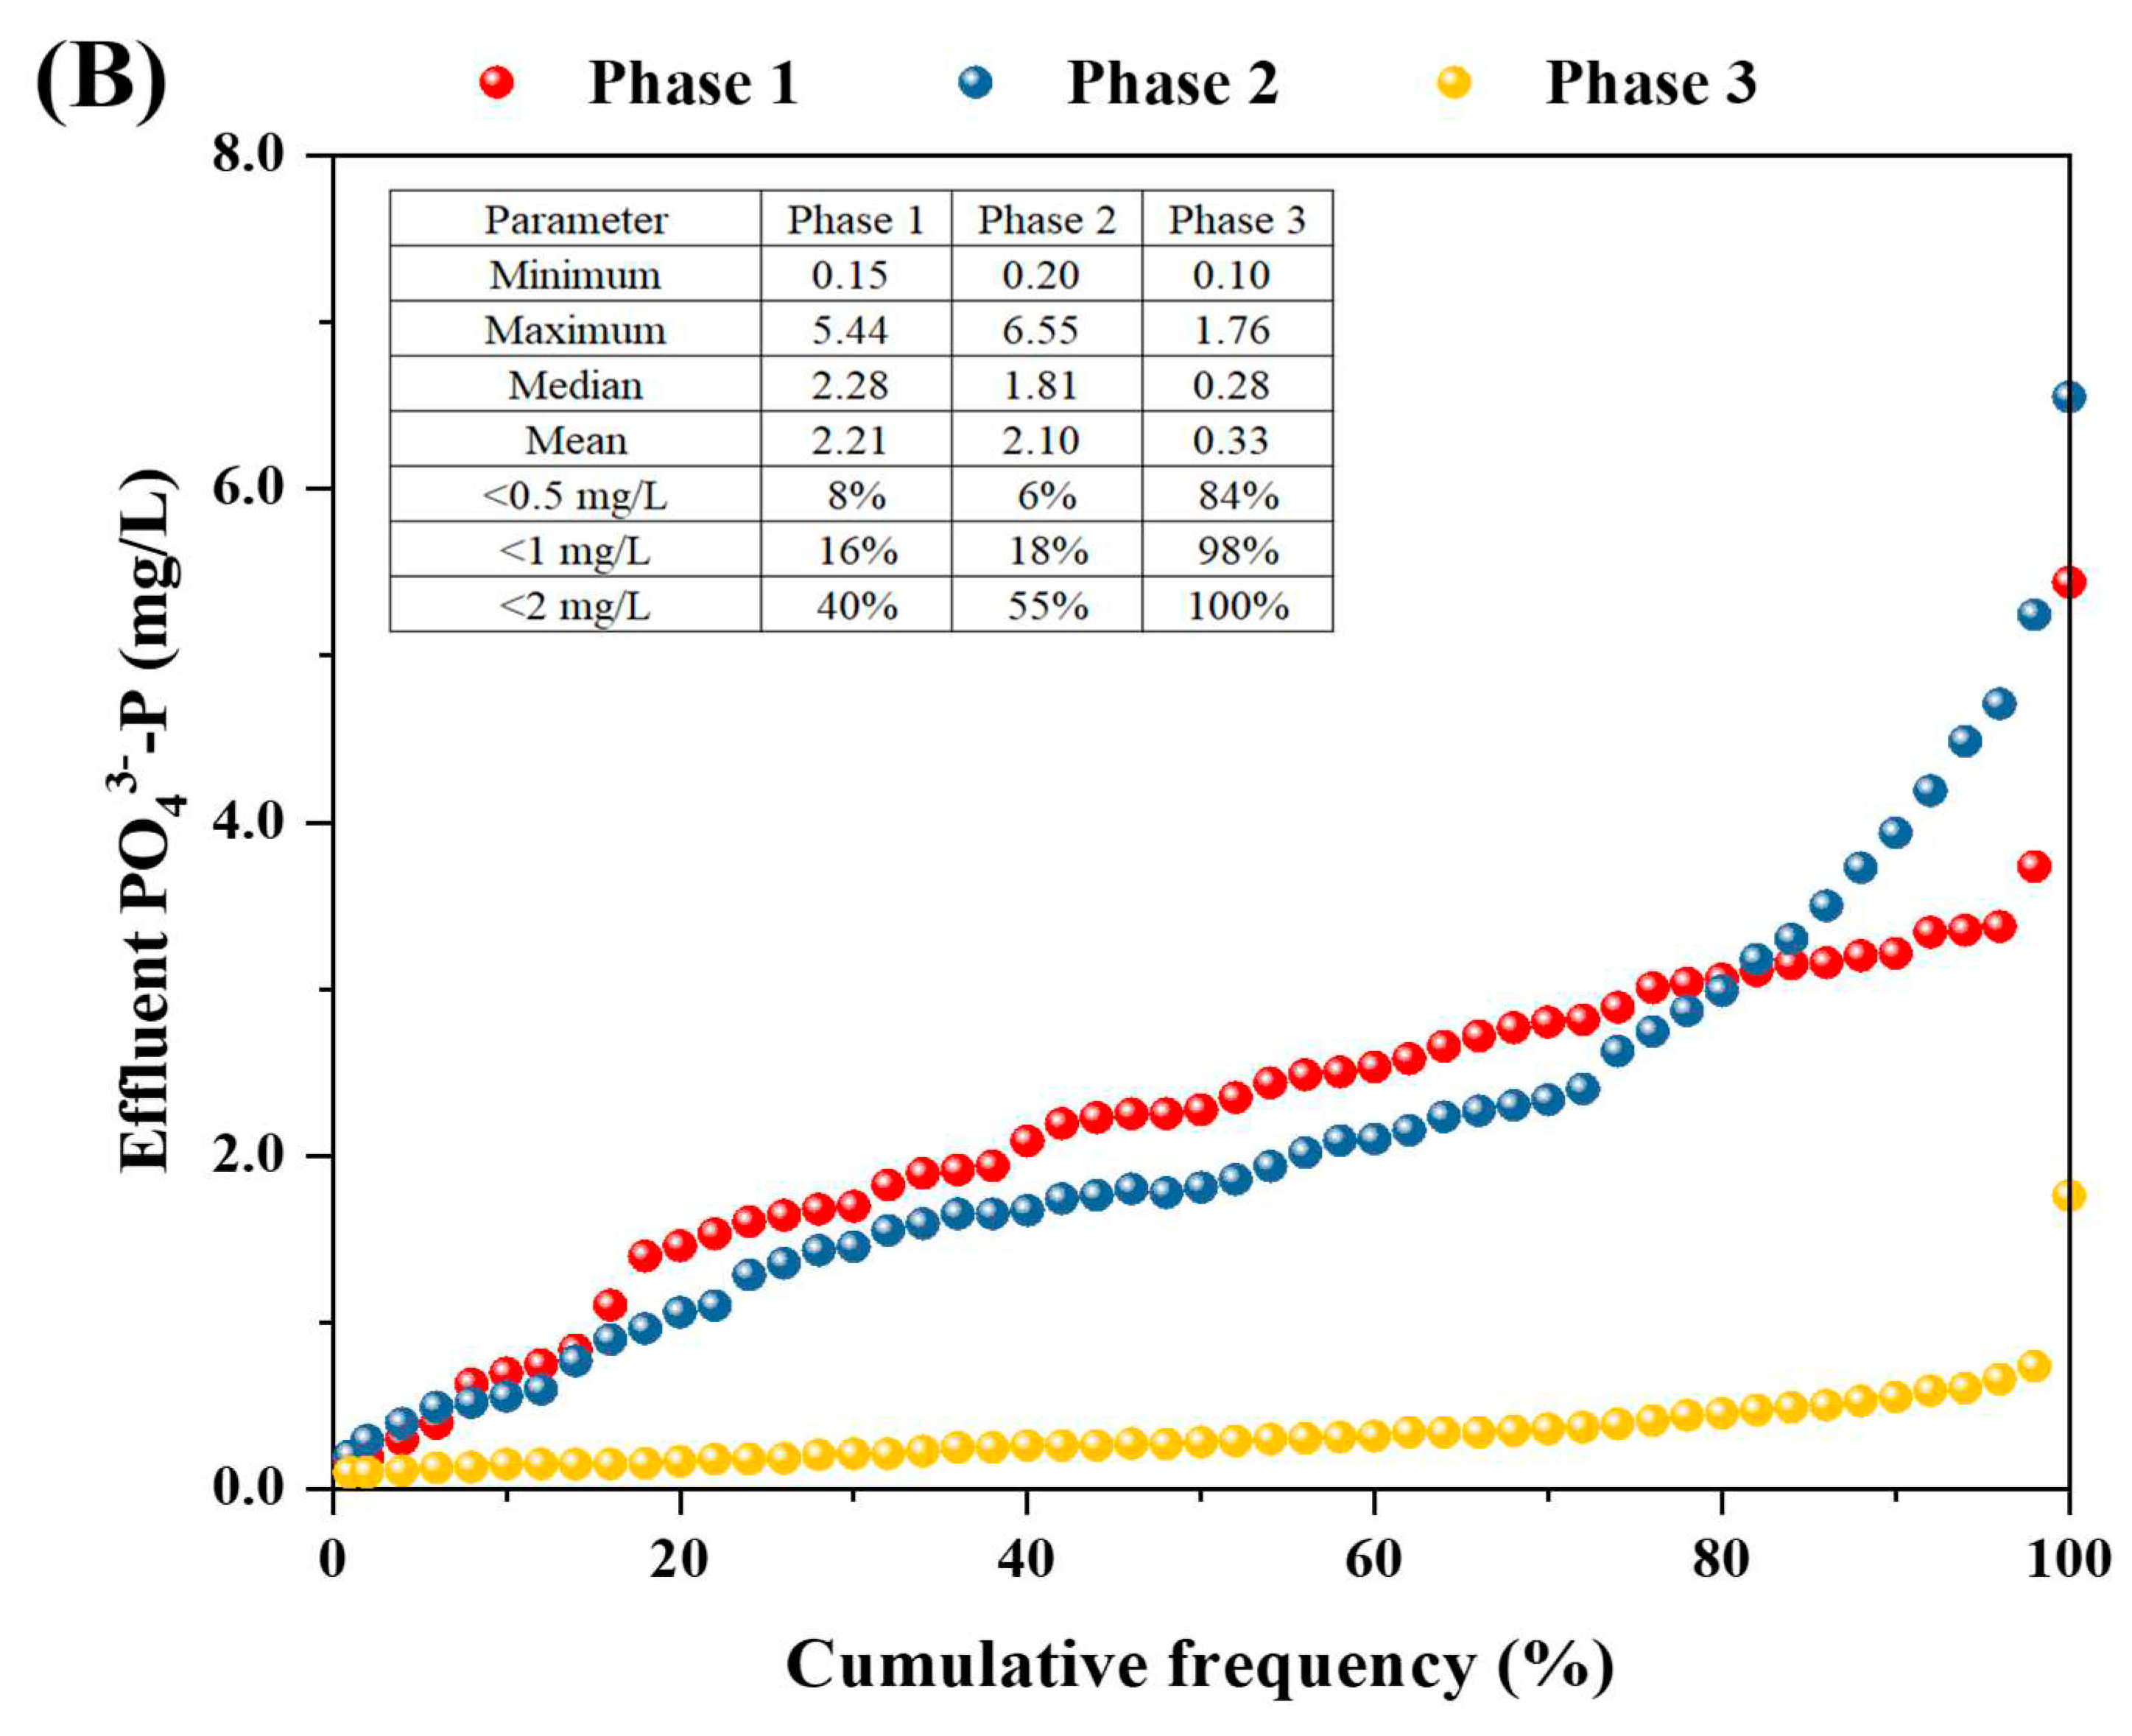
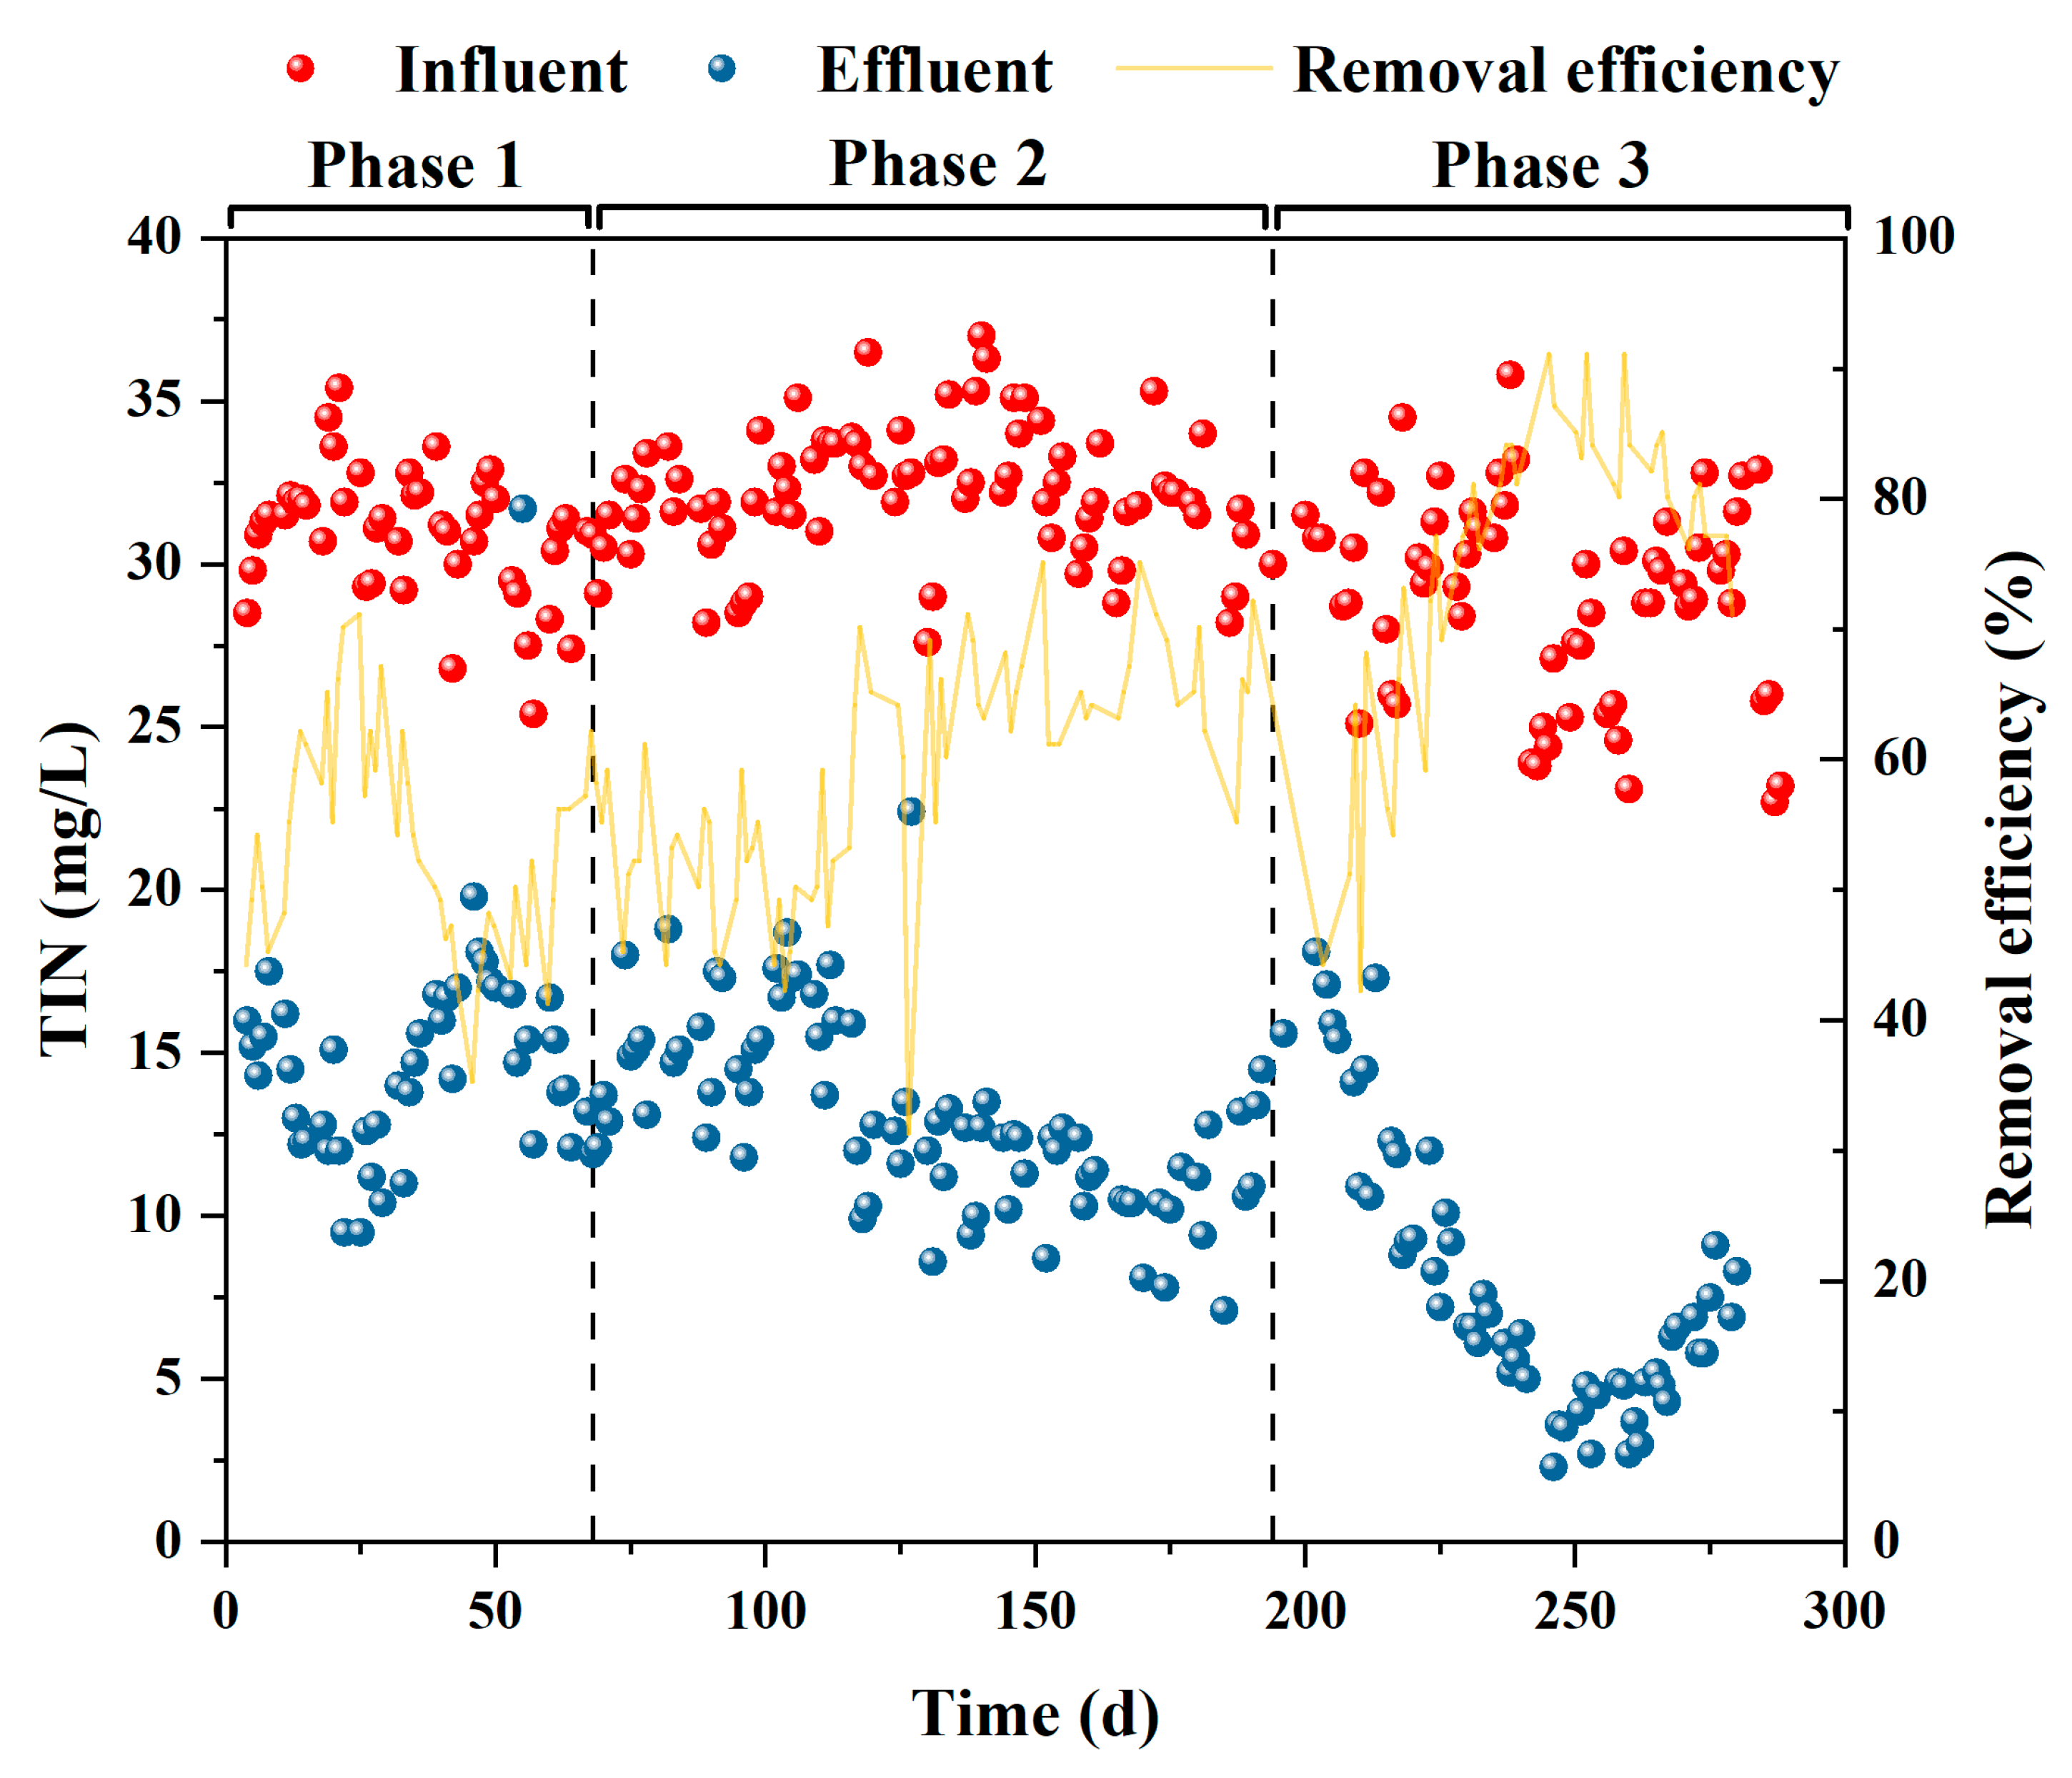
- Integrated and efficient P removal and shortcut N removal were achieved simultaneously in our pilot HRAS-P(D)N/A-S2EBPR system, which consists of influent carbon capture in A-stage and re-direction to S2EBPR for biological P removal, and B-stage shortcut N removal followed by anammox, successfully demonstrating the feasibility and reliability of the system coupling mainstream P(D)N/A with side-stream EBPR to achieve carbon-efficient shortcut N removal and influent carbon-independent P removal.
- EBPR activities and stoichiometric evaluation of a novel HRAS-P(D)N/A-S2EBPR system revealed deviations for P/VFA, PHA/VFA, PHV/PHB, and P/PHA ratios from conventional BEPR systems, suggesting the presence of unique microbial populations, activities, and mechanisms in this system.
- Results of 16S rRNA gene amplicon sequencing showed an increase in total known PAOs and relative PAO-to-GAO abundance ratio with elevated VFA levels, and Accumulibacter is the dominant PAO. Changes in denitrifying populations indicated a potentially higher contribution of DPAOs, DGAOs, or other unknown microorganisms to denitrification.
- SCRS analysis identified specific microorganisms and phenotypes, such as various unidentified PAOs and PHA-producing bacteria, which would play non-negligible roles in the system performance (e.g., enhanced P removal and endogenous denitrification).
Supplementary Materials
Acknowledgments
References
- Acevedo, B., Oehmen, A., Carvalho, G., Seco, A., Borrás, L. and Barat, R. (2012) Metabolic shift of polyphosphate-accumulating organisms with different levels of polyphosphate storage. Water research 46(6), 1889-1900. [CrossRef]
- Ahn, C.H., Park, J.K. and Kim, K.S. (2006) Microbial Adaptability to Organic Loading Changes in an Enhanced Biological Phosphorus Removal Process. Journal of Environmental Engineering 132(8), 909-917. [CrossRef]
- Albertsen, M., Karst, S.M., Ziegler, A.S., Kirkegaard, R.H. and Nielsen, P.H. (2015) Back to Basics – The Influence of DNA Extraction and Primer Choice on Phylogenetic Analysis of Activated Sludge Communities. PLOS ONE 10(7), e0132783. [CrossRef]
- Ali, P., Zalivina, N., Le, T., Riffat, R., Ergas, S., Wett, B., Murthy, S., Al-Omari, A., deBarbadillo, C., Bott, C. and De Clippeleir, H. (2021) Primary sludge fermentate as carbon source for mainstream partial denitrification–anammox (PdNA). 93(7), 1044-1059. [CrossRef]
- APHA. (2012) Standard Methods for the Examination of Water and Wastewater 14ed, APHA American Public Health Association.
- Barnard, J.L., Dunlap, P. and Steichen, M. (2017) Rethinking the Mechanisms of Biological Phosphorus Removal. Water Environment Research 89(11), 2043-2054. [CrossRef]
- Cao, Y., Kwok, B.H., van Loosdrecht, M.C.M., Daigger, G.T., Png, H.Y., Long, W.Y., Chye, C.S. and Ghani, Y.A.B.D. (2016) The occurrence of enhanced biological phosphorus removal in a 200,000 m3/day partial nitration and Anammox activated sludge process at the Changi water reclamation plant, Singapore. Water Science and Technology 75(3), 741-751. [CrossRef]
- Cao, Y., van Loosdrecht, M.C.M. and Daigger, G.T. (2017) Mainstream partial nitritation–anammox in municipal wastewater treatment: status, bottlenecks, and further studies. Applied Microbiology and Biotechnology 101(4), 1365-1383. [CrossRef]
- Chen, G., Zhao, L. and Qi, Y. (2015) Enhancing the productivity of microalgae cultivated in wastewater toward biofuel production: A critical review. Applied Energy 137, 282-291. [CrossRef]
- Daims, H., Lebedeva, E.V., Pjevac, P., Han, P., Herbold, C., Albertsen, M., Jehmlich, N., Palatinszky, M., Vierheilig, J., Bulaev, A., Kirkegaard, R.H., von Bergen, M., Rattei, T., Bendinger, B., Nielsen, P.H. and Wagner, M. (2015) Complete nitrification by Nitrospira bacteria. Nature 528(7583), 504-509. [CrossRef]
- Dueholm, M.K.D., Nierychlo, M., Andersen, K.S., Rudkjøbing, V., Knutsson, S., Arriaga, S., Bakke, R., Boon, N., Bux, F., Christensson, M., Chua, A.S.M., Curtis, T.P., Cytryn, E., Erijman, L., Etchebehere, C., Fatta-Kassinos, D., Frigon, D., Garcia-Chaves, M.C., Gu, A.Z., Horn, H., Jenkins, D., Kreuzinger, N., Kumari, S., Lanham, A., Law, Y., Leiknes, T., Morgenroth, E., Muszyński, A., Petrovski, S., Pijuan, M., Pillai, S.B., Reis, M.A.M., Rong, Q., Rossetti, S., Seviour, R., Tooker, N., Vainio, P., van Loosdrecht, M., Vikraman, R., Wanner, J., Weissbrodt, D., Wen, X., Zhang, T., Nielsen, P.H., Albertsen, M., Nielsen, P.H. and Mi, D.A.S.G.C. (2022) MiDAS 4: A global catalogue of full-length 16S rRNA gene sequences and taxonomy for studies of bacterial communities in wastewater treatment plants. Nature Communications 13(1), 1908. [CrossRef]
- Feng, X., Qian, Y., Xi, P., Cao, R., Qin, L., Zhang, S., Chai, G., Huang, M., Li, K., Xiao, Y., Xie, L., Song, Y. and Wang, D. (2022) Partial Nitrification and Enhanced Biological Phosphorus Removal in a Sequencing Batch Reactor Treating High-Strength Wastewater. International Journal of Environmental Research and Public Health 19(9), 5653. [CrossRef]
- Fernando, E.Y., McIlroy, S.J., Nierychlo, M., Herbst, F.-A., Petriglieri, F., Schmid, M.C., Wagner, M., Nielsen, J.L. and Nielsen, P.H. (2019) Resolving the individual contribution of key microbial populations to enhanced biological phosphorus removal with Raman–FISH. The ISME Journal 13(8), 1933-1946. [CrossRef]
- Ferrentino, R., Langone, M., Villa, R. and Andreottola, G. (2018) Strict anaerobic side-stream reactor: effect of the sludge interchange ratio on sludge reduction in a biological nutrient removal process. Environmental Science and Pollution Research 25(2), 1243-1256. [CrossRef]
- Fra-Vázquez, A., Santorio, S., Palmeiro-Sánchez, T., Val del Río, Á. and Mosquera-Corral, A. (2019) PHA accumulation of a mixed microbial culture co-exists with ammonia partial nitritation. Chemical Engineering Journal 360, 1255-1261. [CrossRef]
- Ge, H., Batstone, D.J. and Keller, J. (2015) Biological phosphorus removal from abattoir wastewater at very short sludge ages mediated by novel PAO clade Comamonadaceae. Water research 69, 173-182. [CrossRef]
- Gu, A.Z., Saunders, A., Neethling, J., Stensel, H. and Blackall, L. (2008) Functionally relevant microorganisms to enhanced biological phosphorus removal performance at full-scale wastewater treatment plants in the United States. Water Environment Research 80(8), 688-698. [CrossRef]
- Gu, A.Z., Tooker, N.B., Onnis-Hayden, A., Wang, D., Srinivasan, V., Li, G., Takács, I. and Vargas, E. (2019) Optimization and design of a side-stream EBPR process as a sustainable approach for achieving stable and efficient phosphorus removal.
- Guthi, R.-S., Tondera, K., Gillot, S., Buffière, P., Boillot, M. and Chazarenc, F. (2022) A-Stage process – Challenges and drawbacks from lab to full scale studies: A review. Water research 226, 119044. [CrossRef]
- Hesselmann, R.P.X., von Rummell, R., Resnick, S.M., Hany, R. and Zehnder, A.J.B. (2000) Anaerobic metabolism of bacteria performing enhanced biological phosphate removal. Water research 34(14), 3487-3494. [CrossRef]
- Hu, J.Y., Ong, S.L., Ng, W.J., Lu, F. and Fan, X.J. (2003) A new method for characterizing denitrifying phosphorus removal bacteria by using three different types of electron acceptors. Water research 37(14), 3463-3471. [CrossRef]
- Jia, Z., Yuan, Q., Roots, P., Sabba, F., Rosenthal, A.F., Kozak, J.A. and Wells, G.F. (2023) Partial Nitritation/Anammox and biological phosphorus removal integration in a single bioreactor under mainstream conditions. Bioresource Technology 373, 128714. [CrossRef]
- Klaus, S., Printz, K., McCullough, K., Srinivasan, V., Wang, D., He, P., De Clippeleir, H., Gu, A. and Bott, C. (2019) Integrating BioP and Shortcut Nitrogen Removal via RAS Fermentation and Partial Denitrification/Anammox, Water Environment Federation. [CrossRef]
- Klaus, S.A. (2019) Intensification of Biological Nutrient Removal Processes, Virginia Tech.
- Kolakovic, S., Freitas, E.B., Reis, M.A.M., Carvalho, G. and Oehmen, A. (2021) Accumulibacter diversity at the sub-clade level impacts enhanced biological phosphorus removal performance. Water research 199, 117210. [CrossRef]
- Kuba, T., Murnleitner, E., van Loosdrecht, M.C.M. and Heijnen, J.J. (1996) A metabolic model for biological phosphorus removal by denitrifying organisms. Biotechnology and Bioengineering 52(6), 685-695. [CrossRef]
- Lackner, S., Gilbert, E.M., Vlaeminck, S.E., Joss, A., Horn, H. and van Loosdrecht, M.C.M. (2014) Full-scale partial nitritation/anammox experiences – An application survey. Water research 55, 292-303. [CrossRef]
- Lanham, A.B., Oehmen, A., Carvalho, G., Saunders, A.M., Nielsen, P.H. and Reis, M.A.M. (2018) Denitrification activity of polyphosphate accumulating organisms (PAOs) in full-scale wastewater treatment plants. Water Science and Technology 78(12), 2449-2458. [CrossRef]
- Lanham, A.B., Oehmen, A., Saunders, A.M., Carvalho, G., Nielsen, P.H. and Reis, M.A.M. (2013) Metabolic versatility in full-scale wastewater treatment plants performing enhanced biological phosphorus removal. Water research 47(19), 7032-7041. [CrossRef]
- Li, G., Tooker, N.B., Wang, D., Srinivasan, V., Barnard, J.L., Russell, A., Takacs, I., Bott, C., Dobrowski, P., Onnis-Hayden, A. and Gu, A.Z. (2020a) Modeling Side-Stream Enhanced Biological Phosphorus Removal (S2EBPR) System Using Agent-based Model with Adaptive Maintenance, Decay and TCA Metabolism. 2020.2011.2018.387589. [CrossRef]
- Li, J., Li, J., Peng, Y., Wang, S., Zhang, L., Yang, S. and Li, S. (2020b) Insight into the impacts of organics on anammox and their potential linking to system performance of sewage partial nitrification-anammox (PN/A): A critical review. Bioresource Technology 300, 122655. [CrossRef]
- Li, Y. (2017) Link Phylogenetic and Phenotypic Characteristics to Reveal Factors Governing Enhanced Biological Phosphorus Removal (EBPR) Process Performance and Stability, Northeastern University.
- Li, Y., Cope, H.A., Rahman, S.M., Li, G., Nielsen, P.H., Elfick, A. and Gu, A.Z. (2018) Toward Better Understanding of EBPR Systems via Linking Raman-Based Phenotypic Profiling with Phylogenetic Diversity. Environmental science & technology 52(15), 8596-8606. [CrossRef]
- Liu, Y., Gu, J. and Zhang, M. (2019) AB processes: Towards energy self-sufficient municipal wastewater treatment, IWA publishing.
- Lücker, S., Wagner, M., Maixner, F., Pelletier, E., Koch, H., Vacherie, B., Rattei, T., Damsté, J.S., Spieck, E., Le Paslier, D. and Daims, H. (2010) A Nitrospira metagenome illuminates the physiology and evolution of globally important nitrite-oxidizing bacteria. Proc Natl Acad Sci U S A 107(30), 13479-13484. [CrossRef]
- Ma, B., Wang, S., Cao, S., Miao, Y., Jia, F., Du, R. and Peng, Y. (2016) Biological nitrogen removal from sewage via anammox: Recent advances. Bioresource Technology 200, 981-990. [CrossRef]
- Majed, N., Chernenko, T., Diem, M. and Gu, A.Z. (2012) Identification of functionally relevant populations in enhanced biological phosphorus removal processes based on intracellular polymers profiles and insights into the metabolic diversity and heterogeneity. Environmental science & technology 46(9), 5010-5017. [CrossRef]
- Majed, N. and Gu, A.Z. (2020) Phenotypic dynamics in polyphosphate and glycogen accumulating organisms in response to varying influent C/P ratios in EBPR systems. Science of The Total Environment 743, 140603. [CrossRef]
- Marang, L., van Loosdrecht, M.C.M. and Kleerebezem, R. (2018) Enrichment of PHA-producing bacteria under continuous substrate supply. New Biotechnology 41, 55-61. [CrossRef]
- Marques, R., Santos, J., Nguyen, H., Carvalho, G., Noronha, J.P., Nielsen, P.H., Reis, M.A.M. and Oehmen, A. (2017) Metabolism and ecological niche of Tetrasphaera and Ca. Accumulibacter in enhanced biological phosphorus removal. Water research 122, 159-171. [CrossRef]
- McIlroy, S.J., Onetto, C.A., McIlroy, B., Herbst, F.-A., Dueholm, M.S., Kirkegaard, R.H., Fernando, E., Karst, S.M., Nierychlo, M., Kristensen, J.M., Eales, K.L., Grbin, P.R., Wimmer, R. and Nielsen, P.H. (2018) Genomic and in Situ Analyses Reveal the Micropruina spp. as Abundant Fermentative Glycogen Accumulating Organisms in Enhanced Biological Phosphorus Removal Systems. Frontiers in microbiology 9. [CrossRef]
- McIlroy, S.J., Saunders, A.M., Albertsen, M., Nierychlo, M., McIlroy, B., Hansen, A.A., Karst, S.M., Nielsen, J.L. and Nielsen, P.H. (2015) MiDAS: the field guide to the microbes of activated sludge. Database 2015. [CrossRef]
- Nielsen, P.H., McIlroy, S.J., Albertsen, M. and Nierychlo, M. (2019) Re-evaluating the microbiology of the enhanced biological phosphorus removal process. Current Opinion in Biotechnology 57, 111-118. [CrossRef]
- Oehmen, A., Lemos, P.C., Carvalho, G., Yuan, Z., Keller, J., Blackall, L.L. and Reis, M.A.M. (2007) Advances in enhanced biological phosphorus removal: From micro to macro scale. Water research 41(11), 2271-2300. [CrossRef]
- Oehmen, A., Saunders, A.M., Vives, M.T., Yuan, Z. and Keller, J. (2006) Competition between polyphosphate and glycogen accumulating organisms in enhanced biological phosphorus removal systems with acetate and propionate as carbon sources. Journal of Biotechnology 123(1), 22-32. [CrossRef]
- Onnis-Hayden, A., Srinivasan, V., Tooker, N.B., Li, G., Wang, D., Barnard, J.L., Bott, C., Dombrowski, P., Schauer, P., Menniti, A., Shaw, A., Stinson, B., Stevens, G., Dunlap, P., Takács, I., McQuarrie, J., Phillips, H., Lambrecht, A., Analla, H., Russell, A. and Gu, A.Z. (2020) Survey of full-scale sidestream enhanced biological phosphorus removal (S2EBPR) systems and comparison with conventional EBPRs in North America: Process stability, kinetics, and microbial populations. Water Environment Research 92(3), 403-417. [CrossRef]
- Petriglieri, F., Singleton, C., Peces, M., Petersen, J.F., Nierychlo, M. and Nielsen, P.H. (2021) “Candidatus Dechloromonas phosphoritropha” and “Ca. D. phosphorivorans”, novel polyphosphate accumulating organisms abundant in wastewater treatment systems. The ISME Journal 15(12), 3605-3614. [CrossRef]
- Printz, K.E. (2019) The Investigation of Nitrite Accumulation and Biological Phosphorus Removal in an Intermittently Aerated Process Combining Shortcut Nitrogen Removal and Sidestream Biological Phosphorus Removal, Virginia Tech.
- Qiu, G., Zuniga-Montanez, R., Law, Y., Thi, S.S., Nguyen, T.Q.N., Eganathan, K., Liu, X., Nielsen, P.H., Williams, R.B.H. and Wuertz, S. (2019) Polyphosphate-accumulating organisms in full-scale tropical wastewater treatment plants use diverse carbon sources. Water research 149, 496-510. [CrossRef]
- Quast, C., Pruesse, E., Yilmaz, P., Gerken, J., Schweer, T., Yarza, P., Peplies, J. and Glöckner, F.O. (2012) The SILVA ribosomal RNA gene database project: improved data processing and web-based tools. Nucleic Acids Research 41(D1), D590-D596. [CrossRef]
- R Core Team (2013) R: A language and environment for statistical computing.
- Regmi, P., Miller, M.W., Holgate, B., Bunce, R., Park, H., Chandran, K., Wett, B., Murthy, S. and Bott, C.B. (2014) Control of aeration, aerobic SRT and COD input for mainstream nitritation/denitritation. Water research 57, 162-171. [CrossRef]
- Regmi, P., Sturm, B., Hiripitiyage, D., Keller, N., Murthy, S. and Jimenez, J. (2022) Combining continuous flow aerobic granulation using an external selector and carbon-efficient nutrient removal with AvN control in a full-scale simultaneous nitrification-denitrification process. Water research 210, 117991. [CrossRef]
- Ren, Z.J. and Pagilla, K. (2022) Pathways to Water Sector Decarbonization, Carbon Capture and Utilization, IWA Publishing.
- Roots, P., Rosenthal, A., Wang, Y., Sabba, F., Jia, Z., Yang, F., Zhang, H., Kozak, J. and Wells, G. (2020) Pushing the limits of solids retention time for enhanced biological phosphorus removal: process characteristics and Accumulibacter population structure. Water Science and Technology 82(8), 1614-1627. [CrossRef]
- Roots, P., Wang, Y., Rosenthal, A.F., Griffin, J.S., Sabba, F., Petrovich, M., Yang, F., Kozak, J.A., Zhang, H. and Wells, G.F. (2019) Comammox Nitrospira are the dominant ammonia oxidizers in a mainstream low dissolved oxygen nitrification reactor. Water research 157, 396-405. [CrossRef]
- Saad, S.A., Welles, L., Abbas, B., Lopez-Vazquez, C.M., van Loosdrecht, M.C.M. and Brdjanovic, D. (2016) Denitrification of nitrate and nitrite by ‘Candidatus Accumulibacter phosphatis’ clade IC. Water research 105, 97-109. [CrossRef]
- Sabba, F., Farmer, M., Jia, Z., Di Capua, F., Dunlap, P., Barnard, J., Qin, C.D., Kozak, J.A., Wells, G. and Downing, L. (2023) Impact of operational strategies on a sidestream enhanced biological phosphorus removal (S2EBPR) reactor in a carbon limited wastewater plant. Science of The Total Environment 857, 159280. [CrossRef]
- Scherson, Y.D., Woo, S.-G. and Criddle, C.S. (2014) Production of Nitrous Oxide From Anaerobic Digester Centrate and Its Use as a Co-oxidant of Biogas to Enhance Energy Recovery. Environmental science & technology 48(10), 5612-5619. [CrossRef]
- Schloss, P.D., Westcott, S.L., Ryabin, T., Hall, J.R., Hartmann, M., Hollister, E.B., Lesniewski, R.A., Oakley, B.B., Parks, D.H., Robinson, C.J., Sahl, J.W., Stres, B., Thallinger, G.G., Horn, D.J.V. and Weber, C.F. (2009) Introducing mothur: Open-Source, Platform-Independent, Community-Supported Software for Describing and Comparing Microbial Communities. Applied and environmental microbiology 75(23), 7537-7541. [CrossRef]
- Schuler, A.J. and Jenkins, D. (2003) Enhanced Biological Phosphorus Removal from Wastewater by Biomass with Different Phosphorus Contents, Part I: Experimental Results and Comparison with Metabolic Models. Water Environment Research 75(6), 485-498. [CrossRef]
- Singleton, C.M., Petriglieri, F., Wasmund, K., Nierychlo, M., Kondrotaite, Z., Petersen, J.F., Peces, M., Dueholm, M.S., Wagner, M. and Nielsen, P.H. (2022) The novel genus, ‘Candidatus Phosphoribacter’, previously identified as Tetrasphaera, is the dominant polyphosphate accumulating lineage in EBPR wastewater treatment plants worldwide. The ISME Journal 16(6), 1605-1616. [CrossRef]
- Smith, A.L., Stadler, L.B., Love, N.G., Skerlos, S.J. and Raskin, L. (2012) Perspectives on anaerobic membrane bioreactor treatment of domestic wastewater: A critical review. Bioresource Technology 122, 149-159. [CrossRef]
- Smolders, G.J.F., van der Meij, J., van Loosdrecht, M.C.M. and Heijnen, J.J. (1994) Model of the anaerobic metabolism of the biological phosphorus removal process: Stoichiometry and pH influence. Biotechnology and Bioengineering 43(6), 461-470. [CrossRef]
- Smolders, G.J.F., van der Meij, J., van Loosdrecht, M.C.M. and Heijnen, J.J. (1995) A structured metabolic model for anaerobic and aerobic stoichiometry and kinetics of the biological phosphorus removal process. Biotechnology and Bioengineering 47(3), 277-287. [CrossRef]
- Srinivasan, V.N., Li, G., Wang, D., Tooker, N.B., Dai, Z., Onnis-Hayden, A., Bott, C., Dombrowski, P., Schauer, P., Pinto, A. and Gu, A.Z. (2021) Oligotyping and metagenomics reveal distinct Candidatus Accumulibacter communities in side-stream versus conventional full-scale enhanced biological phosphorus removal (EBPR) systems. Water research 206, 117725. [CrossRef]
- Stokholm-Bjerregaard, M., McIlroy, S.J., Nierychlo, M., Karst, S.M., Albertsen, M. and Nielsen, P.H. (2017) A Critical Assessment of the Microorganisms Proposed to be Important to Enhanced Biological Phosphorus Removal in Full-Scale Wastewater Treatment Systems. Frontiers in microbiology 8. [CrossRef]
- Sun, Y., Peng, Y., Zhang, J., Li, X., Zhang, Q. and Zhang, L. (2020) Effect of endogenous metabolisms on survival and activities of denitrifying phosphorus removal sludge under various starvation conditions. Bioresource Technology 315, 123839. [CrossRef]
- Wan, J., Gu, J., Zhao, Q. and Liu, Y. (2016) COD capture: a feasible option towards energy self-sufficient domestic wastewater treatment. Scientific Reports 6(1), 25054. [CrossRef]
- Wang, D., He, P., Wang, Z., Li, G., Majed, N. and Gu, A.Z. (2020) Advances in single cell Raman spectroscopy technologies for biological and environmental applications. Current Opinion in Biotechnology 64, 218-229. [CrossRef]
- Wang, D., Li, Y., Cope, H.A., Li, X., He, P., Liu, C., Li, G., Rahman, S.M., Tooker, N.B., Bott, C.B., Onnis-Hayden, A., Singh, J., Elfick, A., Marques, R., Jessen, H.J., Oehmen, A. and Gu, A.Z. (2021) Intracellular polyphosphate length characterization in polyphosphate accumulating microorganisms (PAOs): Implications in PAO phenotypic diversity and enhanced biological phosphorus removal performance. Water research 206, 117726. [CrossRef]
- Wang, D., Tooker, N.B., Srinivasan, V., Li, G., Fernandez, L.A., Schauer, P., Menniti, A., Maher, C., Bott, C.B. and Dombrowski, P. (2019) Side-stream enhanced biological phosphorus removal (S2EBPR) process improves system performance-A full-scale comparative study. Water research 167, 115109. [CrossRef]
- Wang, X., Wang, S., Zhao, J., Dai, X., Li, B. and Peng, Y. (2016) A novel stoichiometries methodology to quantify functional microorganisms in simultaneous (partial) nitrification-endogenous denitrification and phosphorus removal (SNEDPR). Water research 95, 319-329. [CrossRef]
- Welles, L., Tian, W.D., Saad, S., Abbas, B., Lopez-Vazquez, C.M., Hooijmans, C.M., van Loosdrecht, M.C.M. and Brdjanovic, D. (2015) Accumulibacter clades Type I and II performing kinetically different glycogen-accumulating organisms metabolisms for anaerobic substrate uptake. Water research 83, 354-366. [CrossRef]
- Yang, Y., Zhang, L., Shao, H., Zhang, S., Gu, P. and Peng, Y. (2017) Enhanced nutrients removal from municipal wastewater through biological phosphorus removal followed by partial nitritation/anammox. Frontiers of Environmental Science & Engineering 11(2), 8. [CrossRef]
- Yuan, Z., Kang, D., Li, G., Lee, J., Han, I., Wang, D., Zheng, P., Reid, M.C. and Gu, A.Z. (2021) Combined Enhanced Biological Phosphorus Removal (EBPR) and Nitrite Accumulation for Treating High-strength Wastewater. bioRxiv, 2021.2001.2016.426983. [CrossRef]
- Zeng, W., Bai, X., Guo, Y., Li, N. and Peng, Y. (2017) Interaction of “Candidatus Accumulibacter” and nitrifying bacteria to achieve energy-efficient denitrifying phosphorus removal via nitrite pathway from sewage. Enzyme and Microbial Technology 105, 1-8. [CrossRef]
- Zengin, G.E., Artan, N., Orhon, D., Satoh, H. and Mino, T. (2011) Effect of aspartate and glutamate on the fate of enhanced biological phosphorus removal process and microbial community structure. Bioresource Technology 102(2), 894-903. [CrossRef]
- Zhang, M., Wang, S., Ji, B. and Liu, Y. (2019) Towards mainstream deammonification of municipal wastewater: Partial nitrification-anammox versus partial denitrification-anammox. Science of The Total Environment 692, 393-401. [CrossRef]
- Zhao, W., Bi, X., Peng, Y. and Bai, M. (2022) Research advances of the phosphorus-accumulating organisms of Candidatus Accumulibacter, Dechloromonas and Tetrasphaera: Metabolic mechanisms, applications and influencing factors. Chemosphere 307, 135675. [CrossRef]
| Parameter | Phase 1 | Phase 2 | Phase 3 | S2EBPR systemsa | EBPR systemsb |
| Prel [mg P/(g VSS·h)] | 7.7±2.6 | 7.2±2.4 | 18.8±7.4 | 2.9–7.0 | 3.2–31.9 |
| Pup [mg P/(g VSS·h)] | 3.9±1.1 | 3.2±1.3 | 8.3±6.0 | 0.6–2.6 | 0.7–19.2 |
| Pup/Prel | 0.5±0.1 | 0.4±0.1 | 0.4±1.1 | 0.2–0.5 | 0.2–0.7 |
| HAcup [mg HAc/(g VSS·h)] | 14.4±4.1 | 10.3±3.5 | 29.1±11.1 | 7.7–24.9 | 9.0–47.0 |
| P/HAc (P-mol/C-mol) | 0.5±0.1 | 0.7±0.1 | 0.6±0.1 | 0.2–1.3 | 0.1–1.1 |
| Carbon source | This study | Previous EBPR studies | ||
| Fermentate | HAc | Real wastewater | HAc | |
| Anaerobic results | ||||
| P release (mg P/g VSS) | 10.9 | 8.6 | 3.4–16.7a | 5.1–24.3b |
| Prel [mg P/(g VSS·h)] | 6.6 | 7.8 | – | 3.2–31.9c |
| VFAup [mg VFA/(g VSS·h)] | 38.2 | 37.9 | – | 9.0–47.0d,e |
| P/VFA (P-mol/C-mol) | 0.16 | 0.25 | 0.63–1.00a | 0.11–1.30c,f |
| PHA/VFA (C-mol/C-mol) | 0.21 | 0.23 | 1.20–1.39a | 0.63–2.10a,c |
| PHV/PHB (C-mol/C-mol) | 3.16 | 0.11 | 0.63–0.86a | 0.00–0.26g,h |
| Anoxic results | ||||
| P uptake (mg P/g VSS) | 2.5 | – | – | – |
| Pup [mg P/(g VSS·h)] | 1.2 | – | – | 0.0–5.9d |
| NRR [mg N/(g VSS·h)] | 1.3 | – | – | 1.0–10.0i,j |
| P/PHA (P-mol/C-mol) | 0.37 | – | – | 0.46e |
| Aerobic results | ||||
| P uptake (mg P/g VSS) | 8.6 | 7.7 | 3.6–18.2a | 4.1–15.0b |
| Pup [mg P/(g VSS·h)] | 4.4 | 3.8 | – | 0.7–19.2c,d |
| P/PHA (P-mol/C-mol) | 0.75 | 0.82 | 0.71–0.90a | 0.20–3.68c,k |
Disclaimer/Publisher’s Note: The statements, opinions and data contained in all publications are solely those of the individual author(s) and contributor(s) and not of MDPI and/or the editor(s). MDPI and/or the editor(s) disclaim responsibility for any injury to people or property resulting from any ideas, methods, instructions or products referred to in the content. |
© 2023 by the authors. Licensee MDPI, Basel, Switzerland. This article is an open access article distributed under the terms and conditions of the Creative Commons Attribution (CC BY) license (http://creativecommons.org/licenses/by/4.0/).


