Submitted:
04 April 2023
Posted:
04 April 2023
You are already at the latest version
Abstract
Many metrics exist for the evaluation of binary classifiers, all with their particular advantages and shortcomings. Recently an “Efficiency Index” for the evaluation of classifiers has been proposed, based on the consistency, or matching, and contradiction, or mismatching, of outcomes. This metric and its confidence intervals are easy to calculate from base data in a 2x2 contingency table, and values can be qualitatively and semi-quantitatively categorised. For medical tests, in which context the Efficiency Index was originally proposed, it facilitates communication of risk (of correct diagnosis versus misdiagnosis) to both clinicians and patients. Variants of the efficiency index (balanced, unbiased) which take into account disease prevalence and test cut-offs have also been described. The objectives of the current paper were firstly to extend the EI construct to other formulations (balanced level, quality) and secondly to explore the utility of EI and all four of its variants when applied to the dataset of a large prospective test accuracy study of a cognitive screening instrument. This showed that the balanced level, quality, and unbiased formulations of EI are more stringent measures.
Keywords:
binary classification
; efficiency index
1. Introduction
Diagnostic and screening tests used in clinical medicine may be evaluated by many metrics based on the use of test thresholds and tabulated in a 2x2 contingency table comparing the index test to a reference standard (e.g. diagnostic criteria) [1,2]. All of these metrics derived from binary classification have both advantages and shortcomings or limitations. For example, sensitivity (Sens) and specificity (Spec), probably the most commonly used test metrics (e.g. in Cochrane Study systematic evaluations) presuppose a known diagnosis, contrary to the typical clinical situation when such tests are administered, and hence are difficult to apply directly to the particular doctor-patient encounter. Moreover, these values will vary with the chosen test cut-off. Predictive values, positive (PPV) and negative (NPV), which are more patient-oriented measures than Sens and Spec, are dependent on prevalence of the condition in the population under study. To try to address some of these shortcomings, a new metric called the Efficiency Index has been proposed and developed [3,4]. The basic concept is as follows.
The 2x2 contingency table (Figure 1) categorises all outcomes as per standard theory of signal detection [5] as: true positives (TP) or hits; true negatives (TN) or correct rejections; false positives (FP) or false hits; and false negatives (FN) or misses. From these four cells, two conditions or relations between the index test and the reference standard may be distinguished: consistency, or matching, of outcomes (+/+ or True Positive, and -/- or True Negative); and contradiction, or mismatching (+/- or False Positive, and -/+ or False Negative).
From these two conditions, the paired complementary parameters of accuracy (Acc) or fraction correct, and inaccuracy (Inacc) or fraction incorrect or error rate, may be derived, as:
Acc = (TP + TN)/N = (a + d)/N
Inacc = (FP + FN)/N = (b + c)/N
Kraemer previously denoted the sum of (TP + TN) by the term “efficiency” [6]; accordingly, the sum of (FP + FN) may be termed “inefficiency”. Hence the ratio of efficiency to inefficiency may be denoted as the “efficiency index” (EI) [3,4], as:
EI = Acc/Inacc
= (TP + TN)/(FP + FN)
= (a + d)/(b + c)
The boundary values of EI are thus 0 (when Acc = 0; Inacc = 1) and ∞ (Acc = 1, Inacc = 0), denoting respectively a useless classifier and a perfect classifier. EI values have an inflection point at 1, whereby a value >1 indicates correct classification and a value of <1 indicates incorrect classification, such that values >>1 are desirable and a value of ∞ is an optimal classifier [3]. EI is of the form x/(1 – x) and hence is an odds ratio.
Because the “efficiency index” terminology is potentially ambiguous (there is a similarly named physical index of speed achieved in relation to power output, and various other efficiency indexes are described for energy efficiency or in business and finance), one might instead of EI use the term “selectivity” since EI effectively selects true outcomes over false outcomes. Another possible way around any nomenclature issues is to calculate an “inefficiency index” (InI) defined as:
InI = Inacc/Acc
= (FP + FN)/(TP + TN)
= (b + c)/(a + d)
Like EI, values of InI have an inflection point at 1, but in this formulation an InI value <1 indicates correct classification and a value of >1 indicates incorrect classification, such that values InI values <<1 are desirable and a value of 0 is an optimal classifier (Inacc = 0, Acc = 1). InI is of the form (1 – x)/x and hence is an odds against ratio.
The EI metric has a number of potential advantages. One is the simple calculation of confidence (or compatibility) intervals (CI) for EI values by applying the log method [7] to the base data from the four cells of the 2x2 contingency table. For the 95% CI, the formula for EI is [4]:
where:
Loge(EI) +/- [1.96 x SE(logeEI)]
SE(logeEI) = √[1/a – 1/(a + c) + 1/b – 1/(b + d)]
Classification of EI values, both qualitatively and semi-quantitatively is also possible. The boundary values of EI (0, ∞) are the same as those for likelihood ratios (LRs). LR values may be categorised qualitatively, as slight, moderate, large, or very large [8]. It has been shown that this qualitative classification may also be applicable to EI values [3] (Table 1).
EI is a form of odds ratio; its boundary values (0, ∞) are the same as those for another outcome parameter derived from the 2x2 contingency table, the diagnostic odds ratio (DOR) or cross-product ratio [9]. DORs may be categorised qualitatively, as small, medium, large, or very large [10]. The suggested qualitative classification scheme for DORs might therefore also be applicable to EI values (Table 1). Also, just as log(DOR) is sometimes used to compensate for small values in one or more cells of the 2x2 contingency table, one may calculate log(EI) in similar circumstances from Acc and Inacc, specifically from their logit, where:
log(EI) = log(Acc) – log(Inacc)
= log[Acc/(1 – Acc)]
= logit(Acc)
A more quantitative classification of EI values may also be applied, based on the system for LRs derived by McGee [11] which calculates the (approximate) difference in pre- and post-test odds, since post-test odds = pre-test odds x LR. McGee showed that LR values of 2, 5, and 10 increased the probability of diagnosis by approximately 15%, 30%, and 45% respectively, whereas LR values of 0.5, 0.2, and 0.1 decreased the probability of diagnosis by approximately 15%, 30% and 45% respectively. These figures derive from the almost linear relationship of probability and the natural logarithm of odds over the range 0.1 to 0.9. With the appropriate modification, the percentage change in probability of diagnosis may be calculated for EI values independent of pre-test probability [3], as:
Change in probability = 0.19 x loge(EI)
The EI construct may be extended to other formulations. Although Sens and Spec, as strictly columnar ratios in the 2x2 contingency table, are mathematically independent of prevalence, P, Acc and Inacc as diagonal ratios are dependent on P:
Acc = (Sens.P) + (Spec.P’)
Inacc = (1 – Sens).P + (1 – Spec).P’
EI is thus dependent on disease prevalence [4]. Both Sens and Spec, and hence Acc and Inacc, are also dependent on the level of the test, Q [6], or threshold. Balanced and unbiased EI measures (discussed in Methods, Sect. 2.2.1 and 2.2.4 respectively) were previously introduced to try to take into account values of P and Q [4]. In these and other studies, EI values have found application in the assessment of cognitive screening instruments used in the assessment of patients with memory complaints [3,4,12].
The aims of the current paper were twofold: firstly, to extend the EI construct to other formulations, namely “balanced level” and “quality” variants (discussed in Methods, Sect. 2.2.2 and 2.2.3 respectively); and secondly to apply all the described EI variants, both previously described (standard, balanced, unbiased [3,4]) and new (balanced level, quality) to the dataset of a large prospective test accuracy study of a cognitive screening instrument, the Mini-Addenbrooke’s Cognitive Examination.
2. Methods
2.1. Participants
The dataset from a screening test accuracy study of a cognitive screening instrument, the Mini-Addenbrooke’s Cognitive Examination (MACE) [13] was examined. In this study, which observed STARDdem guidelines for reporting diagnostic test accuracy studies in dementia [14], MACE was administered to consecutive new outpatient referrals (N = 755) to a dedicated cognitive disorders clinic, of whom 114 received a final criterial diagnosis of dementia [15]. MACE scores were not used in making the reference diagnosis to avoid review bias.
2.2. Analyses
2.2.1. Balanced EI (BEI)
In the particular case of a balanced dataset, where P = P’ = 0.5, one may calculate balanced accuracy (BAcc) and balanced inaccuracy (BInacc) [16]:
BAcc = (Sens + Spec)/2
BInacc = 1 – BAcc
BInacc = [(1 – Sens) + (1 – Spec)]/2
Balanced Efficiency index (BEI) is thus [4]:
BEI = BAcc/BInacc
= (Sens + Spec)/[(1 – Sens) + (1 – Spec)]
BEI in this formulation is thus independent of P. BEI values “pull back” EI values towards those anticipated with a balanced dataset and may be of particular value when there is marked class imbalance in test datasets.
2.2.2. Balanced Level EI (BLEI)
The Balanced EI formulation is not independent of Q since both Sens and Spec, and hence Acc and Inacc, are dependent on Q. Another formulation of a “balanced” EI may be derived to accommodate this variable, based around positive and negative predictive values (PPV, NPV), since Sens and Spec may be expressed in terms of PPV, NPV, P, and Q, thus:
Sens = PPV.Q/P
Spec = NPV.Q’/P’
Since:
then substituting:
Acc = (Sens.P) + (Spec.P’)
Inacc = (1 – Sens).P + (1 – Spec).P’
Acc = (PPV.Q) + (NPV.Q’)
Inacc = (1 – PPV).Q + (1 – NPV).Q’
In the particular case where Q = Q’ = 0.5, one may calculate another form of “balanced accuracy” and “balanced inaccuracy”. Since these terms have already been used (Sect. 2.2.1) and since balanced accuracy as (Sens + Spec)/2 is familiar, a different terminology is desirable here, so I suggest “balanced level accuracy” (BLAcc) and “balanced level inaccuracy” (BLInacc), where:
BLAcc = (PPV + NPV)/2
BLInacc = 1 – BLAcc
BLInacc = [(1 – PPV) + (1 – NPV)]/2
It follows that Balanced Level Efficiency index (BEI) is given by:
BLEI = BLAcc/BLInacc
= (PPV + NPV)/[(1 – PPV) + (1 – NPV)]
2.2.3. Quality EI (QEI)
As shown in the previous section, Sens and Spec are dependent on the level or bias of the test, Q, determined by the test cut-off. One way to accommodate this dependency is to rescale Sens and Spec according to Q, following the method of Kraemer [6], as QSens and QSpec:
QSens = (Sens – Q)/Q’
QSpec = (Spec – Q’)/Q
This permits the calculation of various other “quality” measures [17]. For example, quality accuracy (QAcc) and quality inaccuracy (QInacc) may be calculated:
QAcc = (QSens.P) + (QSpec.P’)
QInacc = 1 – QAcc
QInacc = (1 – QSens).P + (1 – QSpec).P’
Quality Efficiency index (QEI) is thus:
QEI = QAcc/QInacc
= (QSens + QSpec)/[(1 – QSens) + (1 – QSpec)]
2.2.4. Unbiased EI (UEI)
As Sens and Spec are unscaled measures, so is Acc. As an unscaled measure, Acc gives no direct measure of the degree to which diagnostic uncertainty is reduced. This can be addressed by calculating unbiased accuracy (UAcc) and unbiased inaccuracy (UInacc) which take into account both the values of P and Q, thus removing the biasing effects of random associations between test result and disease prevalence ([18], p.470), such that [16]:
UAcc = (Sens.P + Spec. P’) – (P.Q + P’.Q’)/1 – (P.Q + P’.Q’)
= Acc – (P.Q + P’.Q’)/1 – (P.Q + P’.Q’)
UInacc = 1 – UAcc
3. Results
In the MACE study dataset, at the optimal MACE cut-off of ≤20/30 (calculated from the maximal value for the Youden index [15]), the outcomes were TP = 104, FP = 188, FN = 10, and TN = 453. Hence:
Acc = 0.738 (95% CI = 0.722 – 0.754)
Inac = 0.262 (95% CI = 0.231 – 0.294)
EI = 2.81 (95% CI = 2.46 – 3.21)
InI = 0.355 (95% CI = 0.321 – 0.390)
The dataset was used to calculate values for EI, BEI, BLEI, QEI, and UEI across the range of meaningful MACE cut-offs (Table 2) and these were displayed graphically (Figure 2; extended from [4]).
These data show that those measures which do not take into account the value of Q, specifically EI and BEI, have higher maximal values and may therefore give a more optimistic view of test outcomes [4].
Conversely, measures taking into account Q, specifically BLEI, QEI, and UEI, are more stringent measures which give a more pessimistic view of test outcomes. QEI and UEI give relatively stable values across the range of MACE cut-offs.
4. Discussion
Reanalysis of the dataset from the MACE study has shown the feasibility of calculating the different EI formulations. All these variants are based on different formulations of Acc and its complement Inacc, and the extended forms try to take into account values of base rate or prevalence, P, and/or the level or bias of the test, Q. Like EI, they all have boundary values of 0 and ∞. Of these EI formulations, the quality and unbiased formulations (QEI, UEI) were found in this dataset to be the most stringent measures of test outcome when compared to the standard and balanced formulations (EI, BEI), with the balanced level formulation (BLEI) falling in between.
In what circumstances might EI or its extended formulations prove useful in clinical practice? It has been suggested [3,4] that EI may effectively communicate risk to both clinicians and patients and their families, specifically the risk of correct diagnosis versus misdiagnosis for a particular test, in a way that is more transparent than for sensitivity, specificity, predictive values, and likelihood ratios. EI values have been calculated for various cognitive screening instruments [3,4,12]. This measure may be of particular value when the administration of invasive tests or tests associated with morbidity and even mortality is being proposed.
5. Limitations
EI as a measure for the evaluation of classifiers has hitherto been applied only to medical classifiers. More widespread application will therefore be required to assess the utility of EI and its various extensions.
Comparison with other frequently used measures of classifier evaluation, such as area under the receiver operating characteristic (ROC) curve [19] or the F measure [20], as well as other odds ratios and logit transform, might also help to define the place of EI in the catalogue of measures available for these purposes [1,2].
Further refinements of EI and its variants may also be explored, for example to address its application to imbalanced datasets [21] (although in the current examples there was class imbalance in the dataset, with prevalence of dementia P = 0.15 [15]).
For example, high EI values could result from very high numbers of TN alone even if numbers of TP were modest as long as numbers of FP and FN were few, a situation which may be encountered for example when handling administrative health datasets [22] and polygenic hazard scores [23]. Addressing the class imbalance problem using methods which oversample the minority class (in the current example TP cases), such as variants of the synthetic majority oversampling technique, SMOTE [21], or which undersample the majority class (in the current example TN) might be applicable. Comparisons of EI with measures such as the F measure [2,20] or the critical success index [2,24] which eschew TN values might be particularly pertinent in this class imbalance situation.
As well as statistical tests, data semantics may be crucial in applied research, such that a new semantics may need to be identified to improve the classifier [25]. In the particular case of cognitive screening instruments, as examined here, it is known that test performance may be influenced by factors other than cognitive ability alone, such as level of fatigue, mood disorder, and primary visual or hearing difficulty. Restriction of the dataset to take into account such confounding factors might be one strategy when further examining EI and its variants. Another might be to introduce a time element, with repeat testing or sequential testing to ensure intra-test reliability as a criterion for data semantics.
6. Conclusions
EI has been characterised as the ratio of Accuracy to Inaccuracy, and hence the ratio of consistency or matching of outcomes in the 2x2 contingency table to contradiction or mismatching. Extensions of the EI concept, as BEI, BLEI, QEI, and UEI, are new metrics for the evaluation of binary classifiers which may be easily calculated from the base data cells of a 2x2 contingency table. All are based on different formulations of Accuracy and its complement Inaccuracy and aim to take into account values of prevalence and/or the level of the test. EI values may be classified qualitatively and semi-quantitatively. In the clinical context, these metrics may prove of particular use in the communication of risk to both clinicians and patients. Their application in other fields of binary classification is awaited.
Funding
The author received no specific funding for this work.
Institutional Review Board Statement
The study was conducted according to the guidelines of the Declaration of Helsinki and approved by the Institutional Committee on Human Research of the Walton Centre for Neurology and Neurosurgery (Approval: N 310)
Informed Consent Statement
Informed consent was obtained from all subjects involved in the study.
Data Availability Statement
The datasets generated during and/or analysed during the current study are available from the corresponding author upon reasonable request.
Conflicts of Interest
The author declares no conflict of interest.
References
- Bolboacă, S.D. Medical diagnostic tests: a review of test anatomy, phases, and statistical treatment of data. Comput. Math. Methods Med. 2019, 2019, 1891569. [Google Scholar] [CrossRef] [PubMed]
- Larner, A.J. The 2x2 matrix. Contingency, confusion and the metrics of binary classification; Springer: London, 2021. [Google Scholar]
- Larner, A.J. Communicating risk: developing an “Efficiency Index” for dementia screening tests. Brain Sci. 2021, 11, 1473. [Google Scholar] [CrossRef] [PubMed]
- Larner, A.J. Evaluating binary classifiers: extending the Efficiency Index. Neurodegener. Dis. Manag. 2022, 12, 185–194. [Google Scholar] [CrossRef] [PubMed]
- McNicol, D. A primer of signal detection theory; Lawrence Erlbaum Associates: Mahwah, New Jersey and London, 2005. [Google Scholar]
- Kraemer, H.C. Evaluating medical tests. Objective and quantitative guidelines; Sage: Newbery Park, California, 1992. [Google Scholar]
- Katz, D.; Baptista, J.; Azen, S.P.; Pike, M.C. Obtaining confidence intervals for the risk ratio in cohort studies. Biometrics 1978, 34, 469–474. [Google Scholar] [CrossRef]
- Jaeschke, R.; Guyatt, G.; Sackett, D.L. Users’ guide to the medical literature. III. How to use an article about a diagnostic test. B. What are the results and will they help me in caring for my patients? JAMA 1994, 271, 703–707. [Google Scholar] [CrossRef] [PubMed]
- Glas, A.S.; Lijmer, J.G.; Prins, M.H.; Bonsel, G.J.; Bossuyt, P.M. The diagnostic odds ratio: a single indicator of test performance. J. Clin. Epidemiol. 2003, 56, 1129–1135. [Google Scholar] [CrossRef] [PubMed]
- Rosenthal, J.A. Qualitative descriptors of strength of association and effect size. J. Soc. Serv. Res. 1996, 21, 37–59. [Google Scholar] [CrossRef]
- McGee, S. Simplifying likelihood ratios. J. Gen. Intern Med. 2002, 17, 647–650. [Google Scholar] [CrossRef]
- Larner, A.J. Cognitive screening in older people using Free-Cog and Mini-Addenbrooke’s Cognitive Examination (MACE). Submitted 2023. [Google Scholar]
- Hsieh, S.; McGrory, S.; Leslie, F.; Dawson, K.; Ahmed, S.; Butler, C.R.; Rowe, J.B.; Mioshi, E.; Hodges, J.R. The Mini-Addenbrooke’s Cognitive Examination: a new assessment tool for dementia. Dement. Geriatr. Cogn. Disord. 2015, 39, 1–11. [Google Scholar] [CrossRef]
- Noel-Storr, A.H.; McCleery, J.M.; Richard, E.; Ritchie, C.W.; Flicker, L.; Cullum, S.J.; Davis, D.; Quinn, T.J.; Hyde, C.; Rutjes, A.W.S.; Smailagic, N.; Marcus, S.; Black, S.; Blennow, K.; Brayne, C.; Fiorivanti, M.; Johnson, J.K.; Köpke, S.; Schneider, L.S.; Simmons, A.; Mattsson, N.; Zetterberg, H.; Bossuyt, P.M.M.; Wilcock, G.; McShane, R. Reporting standards for studies of diagnostic test accuracy in dementia: the STARDdem Initiative. Neurology 2014, 83, 364–373. [Google Scholar] [CrossRef] [PubMed]
- Larner, A.J. MACE for diagnosis of dementia and MCI: examining cut-offs and predictive values. Diagnostics (Basel) 2019, 9, E51. [Google Scholar] [CrossRef] [PubMed]
- Larner, A.J. Accuracy of cognitive screening instruments reconsidered: overall, balanced, or unbiased accuracy? Neurodegener. Dis. Manag. 2022, 12, 67–76. [Google Scholar] [CrossRef]
- Larner, A.J. Applying Kraemer’s Q (positive sign rate): some implications for diagnostic test accuracy study results. Dement. Geriatr. Cogn. Dis. Extra 2019, 9, 389–396. [Google Scholar] [CrossRef] [PubMed]
- Garrett, C.T.; Sell, S. Summary and perspective: Assessing test effectiveness – the identification of good tumour markers. In Cellular cancer markers; Garrett, C.T., Sell, S., Eds.; Springer, 1995; pp. 455–477. [Google Scholar]
- Carter, J.V.; Pan, J.; Rai, S.N.; Galandiuk, S. ROC-ing along: evaluation and interpretation of receiver operating characteristic curves. Surgery 2016, 159, 1638–1645. [Google Scholar] [CrossRef] [PubMed]
- Hand, D.J.; Christen, P.; Kirielle, N. F*: an interpretable transformation of the F measure. Mach. Learn. 2021, 110, 451–456. [Google Scholar] [CrossRef] [PubMed]
- Sowjanya, A.M.; Mrudula, O. Effective treatment of imbalanced datasets in health care using modified SMOTE coupled with stacked deep learning algorithms. Appl. Nanosci. 2022, Feb 3, 1–12. [Google Scholar] [CrossRef]
- Mbizvo, G.K.; Bennett, K.H.; Simpson, C.R.; Duncan, S.E.; Chin, R.F.M.; Larner, A.J. Using Critical Success Index or Gilbert Skill Score as composite measures of positive predictive value and sensitivity in diagnostic accuracy studies: weather forecasting informing epilepsy research. Epilepsia Online ahead of print. 2023. [Google Scholar] [CrossRef]
- Sud, A.; Turnbull, C.; Houlston, R.S.; Horton, R.H.; Hingorani, A.D.; Tzoulaki, I.; Lucassen, A. Realistic expectations are key to realising the benefits of polygenic scores. BMJ 2023, 380, e073149. [Google Scholar] [CrossRef]
- Larner, A.J. Assessing cognitive screening instruments with the critical success index. Prog. Neurol. Psychiatry 2021, 25(3), 33–37. [Google Scholar] [CrossRef]
- Roccetti, M.; Delnevo, G.; Casini, L.; Cappiello, G. Is bigger always better? A controversial journey to the center of machine learning design, with uses and misuses of big data for predicting water meter failures. J. Big Data 2019, 6, 70. [Google Scholar] [CrossRef]
Figure 1.
2x2 contingency table.
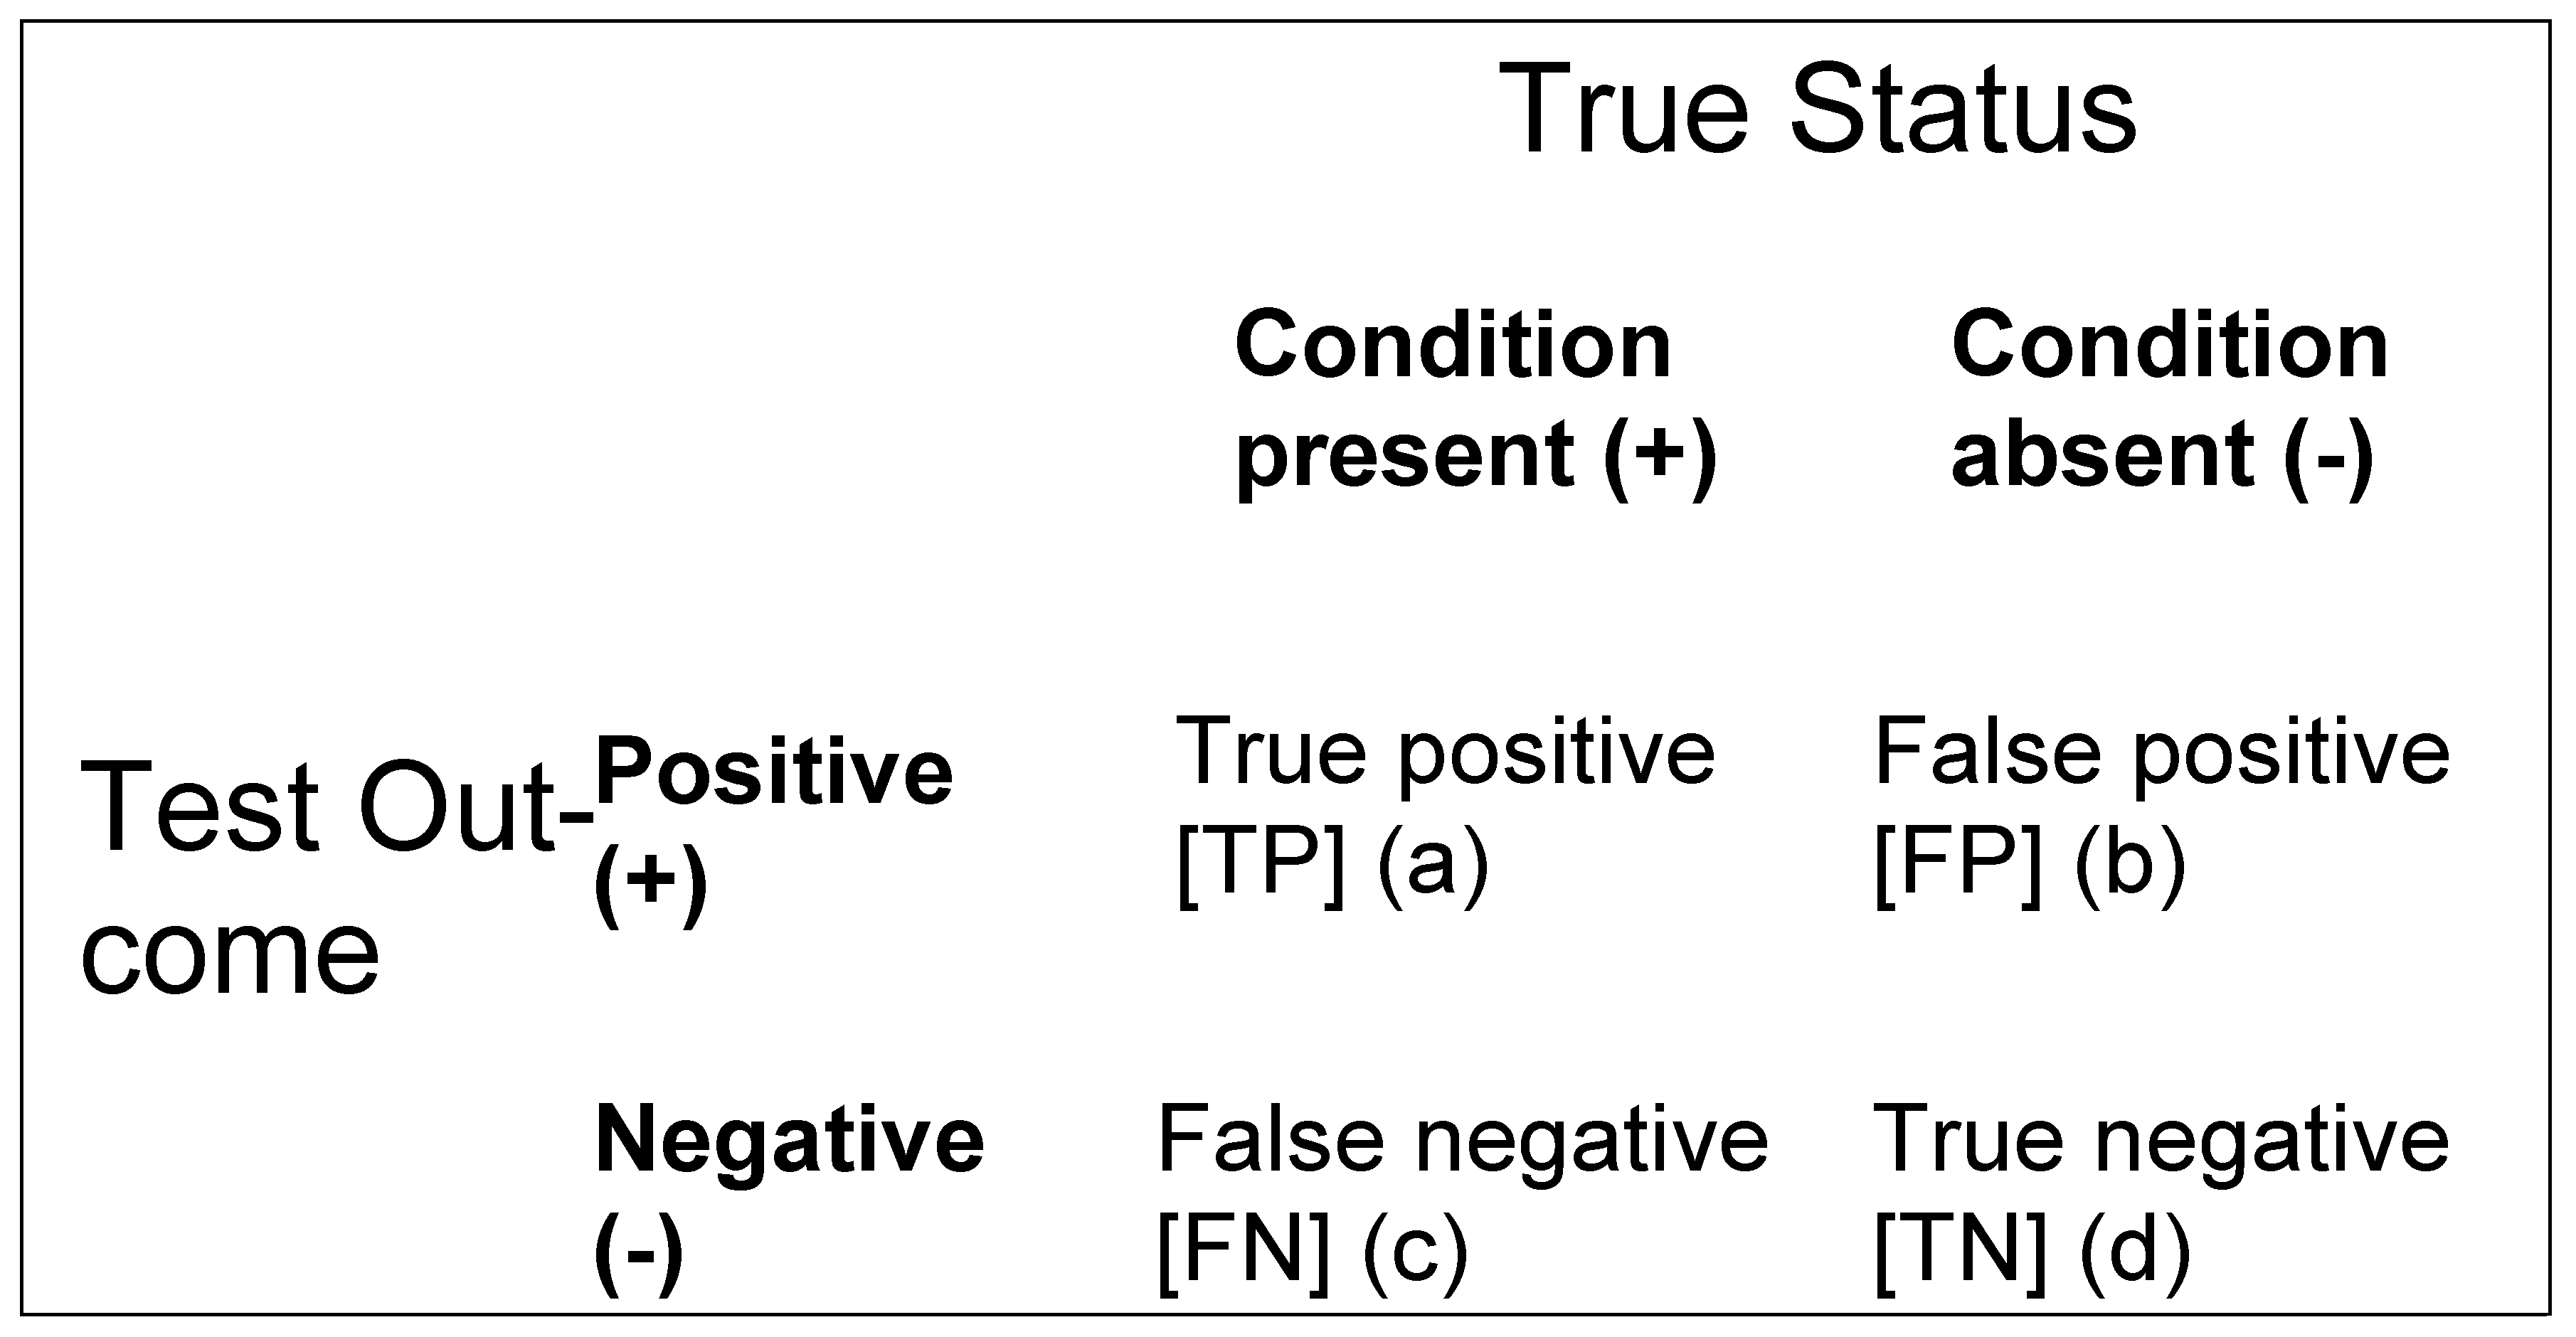
Figure 2.
Plot of EI (♦), BEI (▲), BLEI (×), QEI (⁎), and UEI (•) values (y axis) vs MACE cut-off score (x-axis).
Figure 2.
Plot of EI (♦), BEI (▲), BLEI (×), QEI (⁎), and UEI (•) values (y axis) vs MACE cut-off score (x-axis).
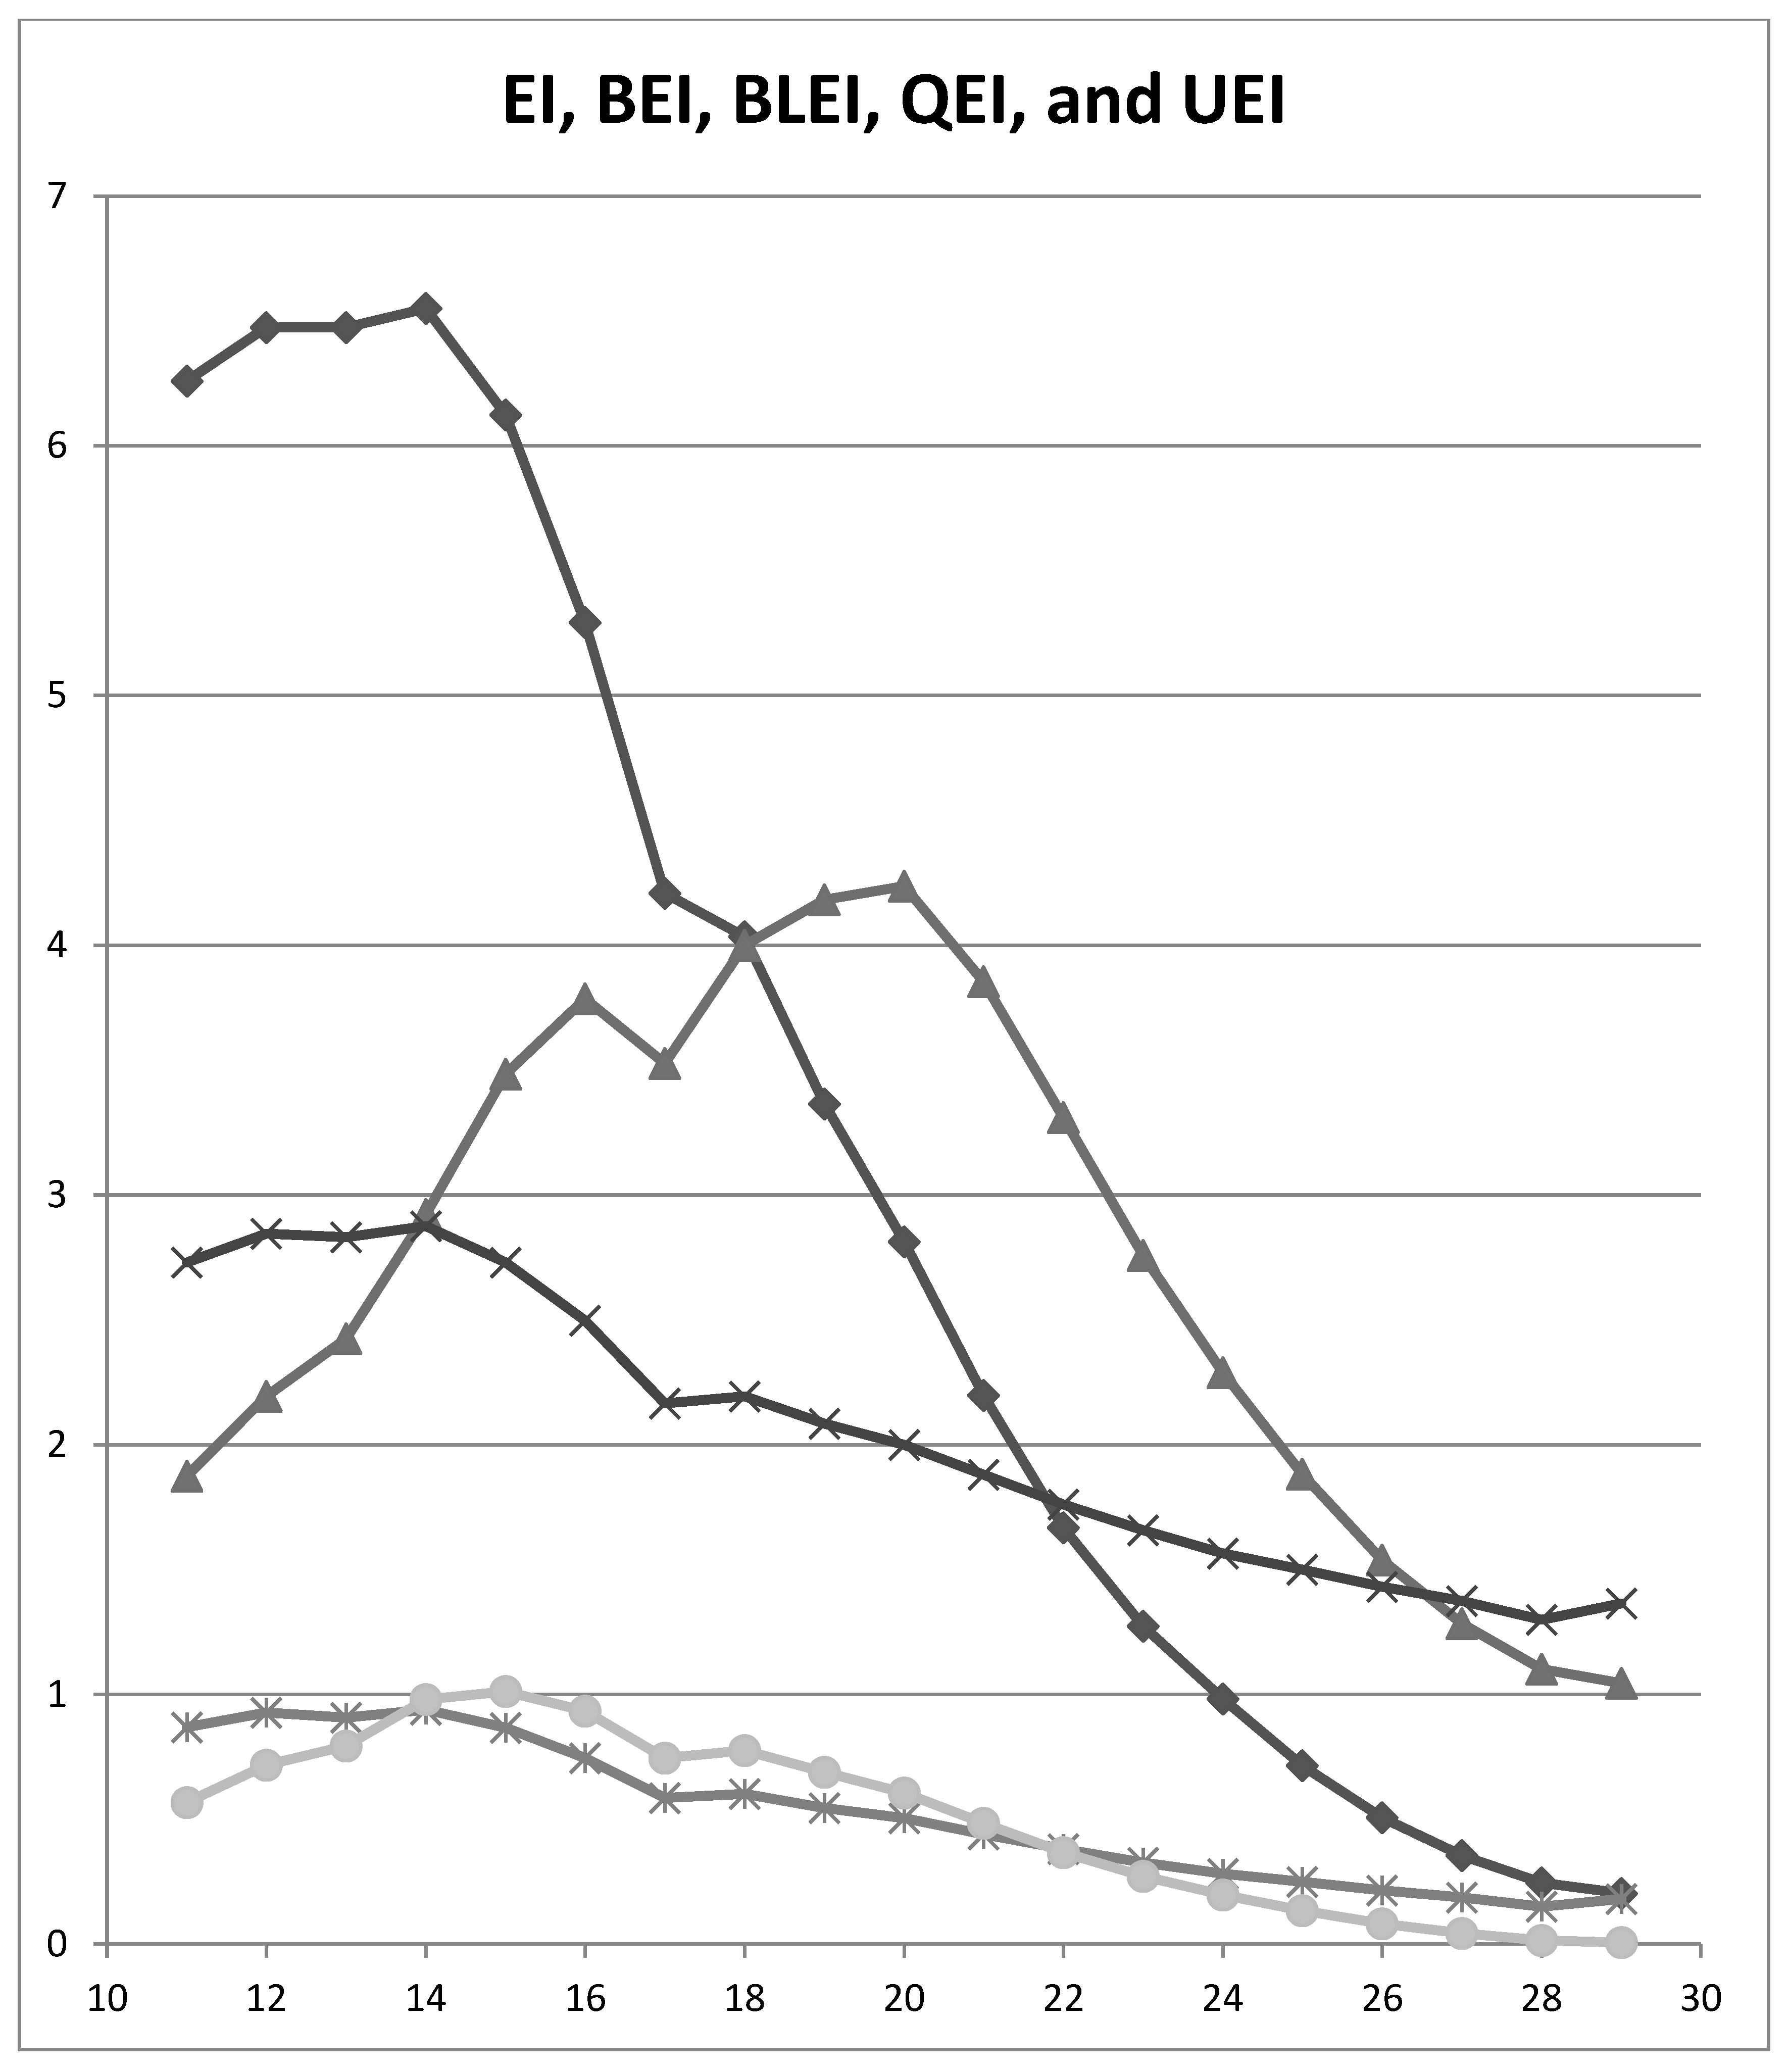

Table 1.
Suggested classifications of EI values (extended from [3]).
Table 1.
Suggested classifications of EI values (extended from [3]).
| EI value | Qualitative classification: change in probability of diagnosis (after Jaeschke et al. [8]) | Qualitative classification:“effect size”(after Rosenthal [10]) | Semi-quantitative classification: approximate % change in probability of diagnosis (after McGee [11]) |
|---|---|---|---|
| ≤ 0.1 | Very large decrease | - | - |
| 0.1 | Large decrease | - | –45 |
| 0.2 | Large decrease | - | –30 |
| 0.5 | Moderate decrease | - | –15 |
| 1.0 | 0 | ||
| ~1.5 | - | Small | - |
| 2.0 | Moderate increase | - | +15 |
| ~2.5 | - | Medium | - |
| ~4 | - | Large | - |
| 5.0 | Moderate increase | - | +30 |
| 10.0 | Large increase | - | +45 |
| ≥ 10.0 | Very large increase | Very large | - |
Table 2.
Diagnosis of dementia: comparing EI, BEI, BLEI, QEI, and UEI metrics at various MACE cut-offs (fixed value of P = 0.151).
Table 2.
Diagnosis of dementia: comparing EI, BEI, BLEI, QEI, and UEI metrics at various MACE cut-offs (fixed value of P = 0.151).
| MACE Cut-off | EI | BEI | BLEI | QEI | UEI |
|---|---|---|---|---|---|
| ≤29/30 | 0.204 | 1.045 | 1.364 | 0.181 | 0.006 |
| ≤28/30 | 0.246 | 1.101 | 1.299 | 0.150 | 0.015 |
| ≤27/30 | 0.355 | 1.283 | 1.374 | 0.186 | 0.043 |
| ≤26/30 | 0.507 | 1.538 | 1.432 | 0.215 | 0.081 |
| ≤25/30 | 0.716 | 1.882 | 1.500 | 0.249 | 0.135 |
| ≤24/30 | 0.982 | 2.289 | 1.564 | 0.282 | 0.198 |
| ≤23/30 | 1.274 | 2.759 | 1.658 | 0.327 | 0.272 |
| ≤22/30 | 1.668 | 3.310 | 1.762 | 0.381 | 0.368 |
| ≤21/30 | 2.199 | 3.854 | 1.880 | 0.440 | 0.484 |
| ≤20/30 | 2.813 | 4.236 | 2.000 | 0.504 | 0.605 |
| ≤19/30 | 3.364 | 4.181 | 2.086 | 0.546 | 0.689 |
| ≤18/30 | 4.033 | 4.000 | 2.194 | 0.602 | 0.776 |
| ≤17/30 | 4.207 | 3.525 | 2.165 | 0.586 | 0.745 |
| ≤16/30 | 5.292 | 3.785 | 2.497 | 0.746 | 0.934 |
| ≤15/30 | 6.123 | 3.484 | 2.731 | 0.866 | 1.012 |
| ≤14/30 | 6.550 | 2.922 | 2.876 | 0.939 | 0.980 |
| ≤13/30 | 6.475 | 2.425 | 2.831 | 0.908 | 0.795 |
| ≤12/30 | 6.475 | 2.195 | 2.846 | 0.927 | 0.718 |
| ≤11/30 | 6.260 | 1.874 | 2.731 | 0.868 | 0.567 |
Abbreviations: EI = efficiency index, BEI = balanced efficiency index, BLEI = balanced level efficiency index, MACE = Mini-Addenbrooke’s Cognitive Examination, QEI = quality efficiency index, UEI = unbiased efficiency index.
Disclaimer/Publisher’s Note: The statements, opinions and data contained in all publications are solely those of the individual author(s) and contributor(s) and not of MDPI and/or the editor(s). MDPI and/or the editor(s) disclaim responsibility for any injury to people or property resulting from any ideas, methods, instructions or products referred to in the content. |
© 2023 by the author. Licensee MDPI, Basel, Switzerland. This article is an open access article distributed under the terms and conditions of the Creative Commons Attribution (CC BY) license (https://creativecommons.org/licenses/by/4.0/).
Copyright: This open access article is published under a Creative Commons CC BY 4.0 license, which permit the free download, distribution, and reuse, provided that the author and preprint are cited in any reuse.


