Submitted:
10 April 2023
Posted:
11 April 2023
You are already at the latest version
Abstract
Keywords:
1. Introduction
2. Materials and Methods
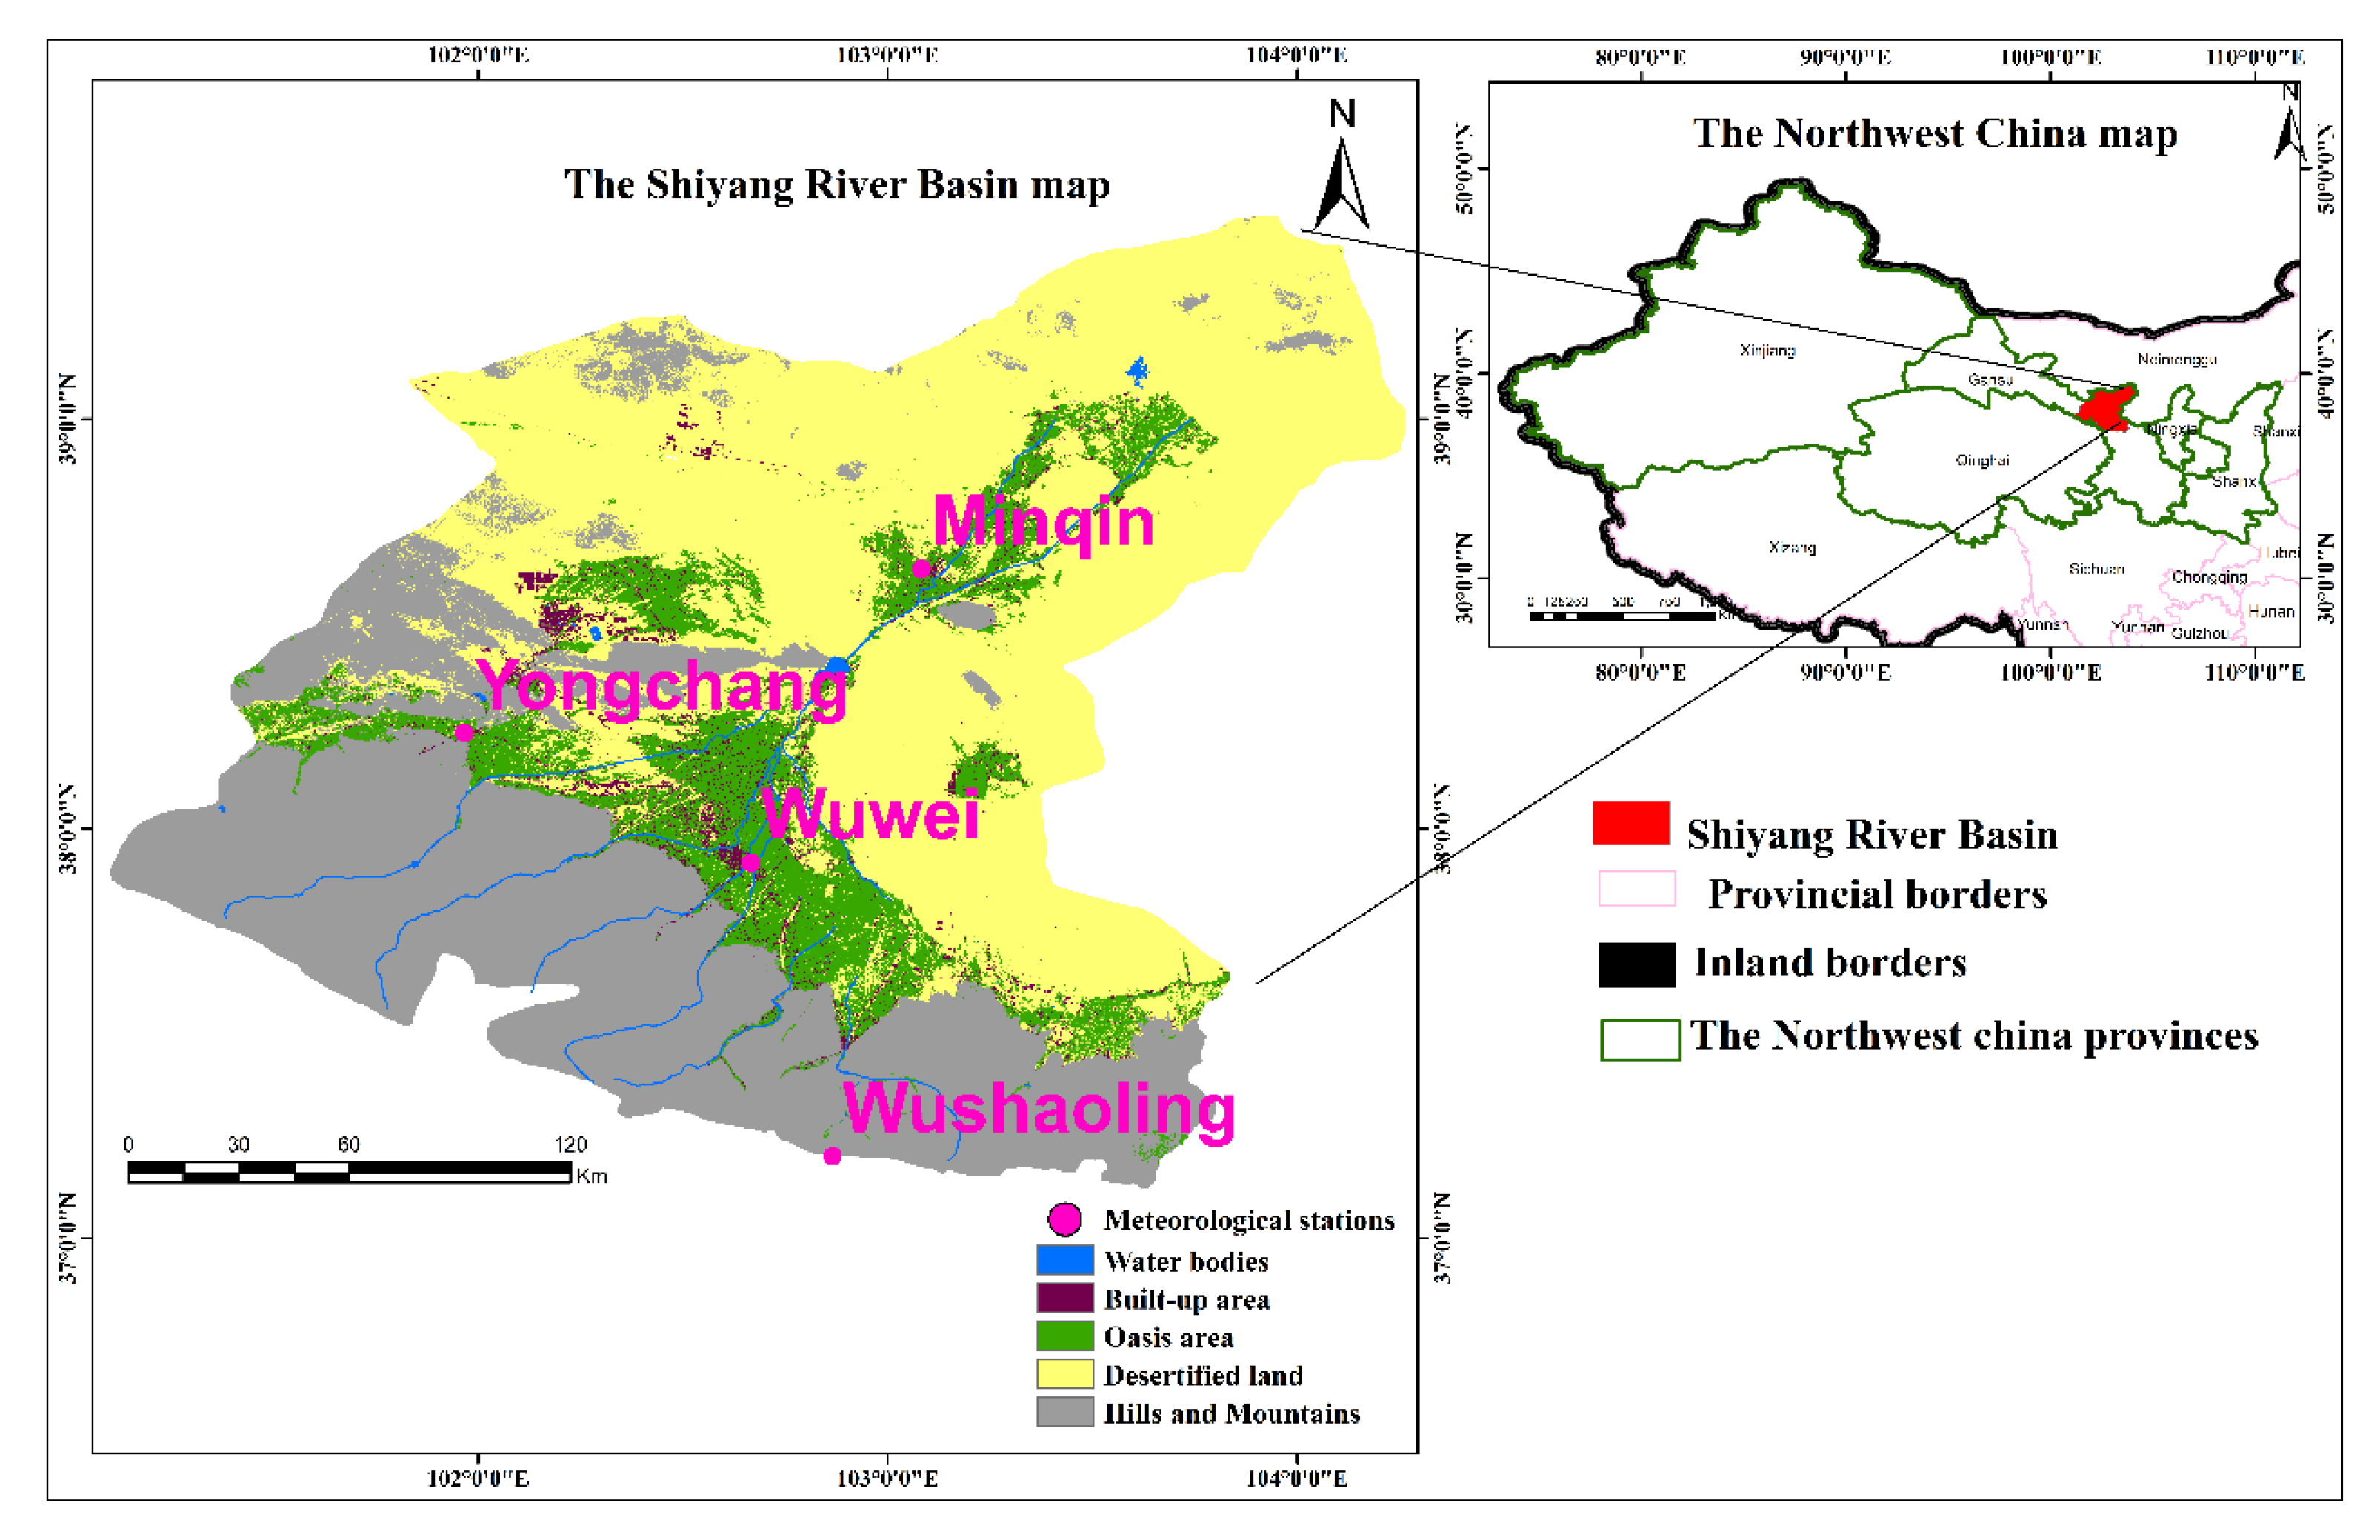
2.1. Study area description
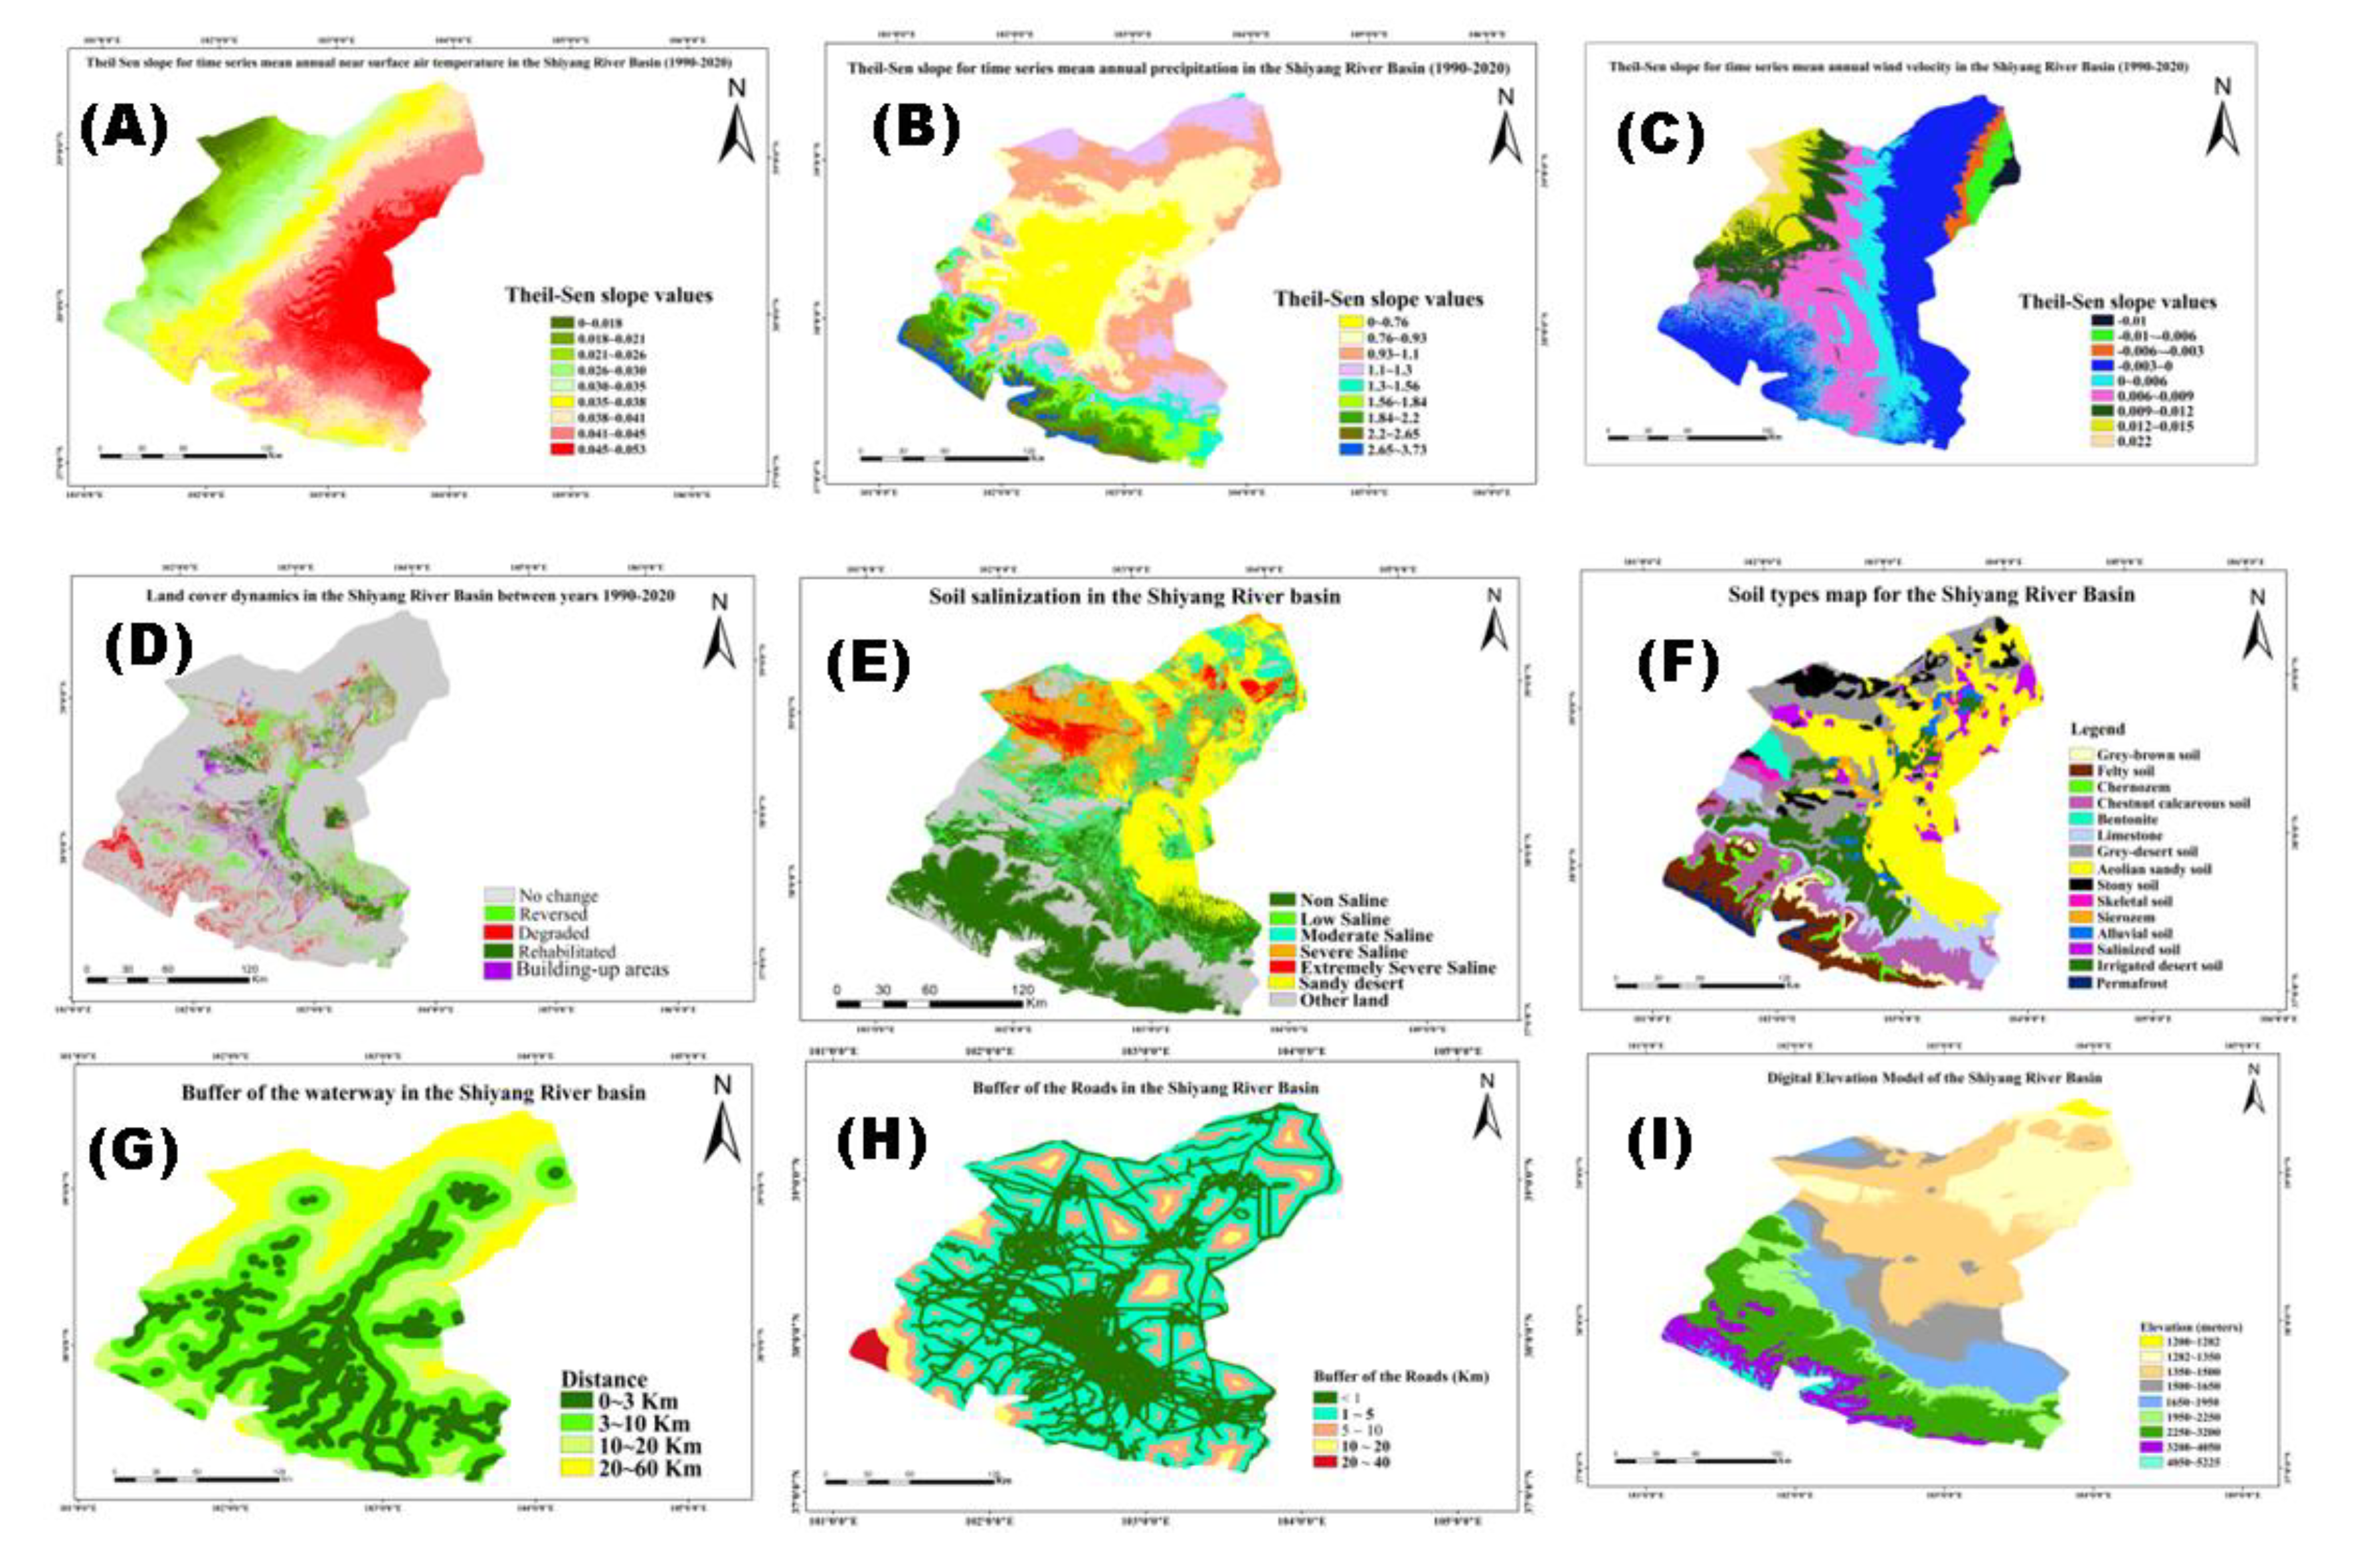
2.2. Model inputs parameters
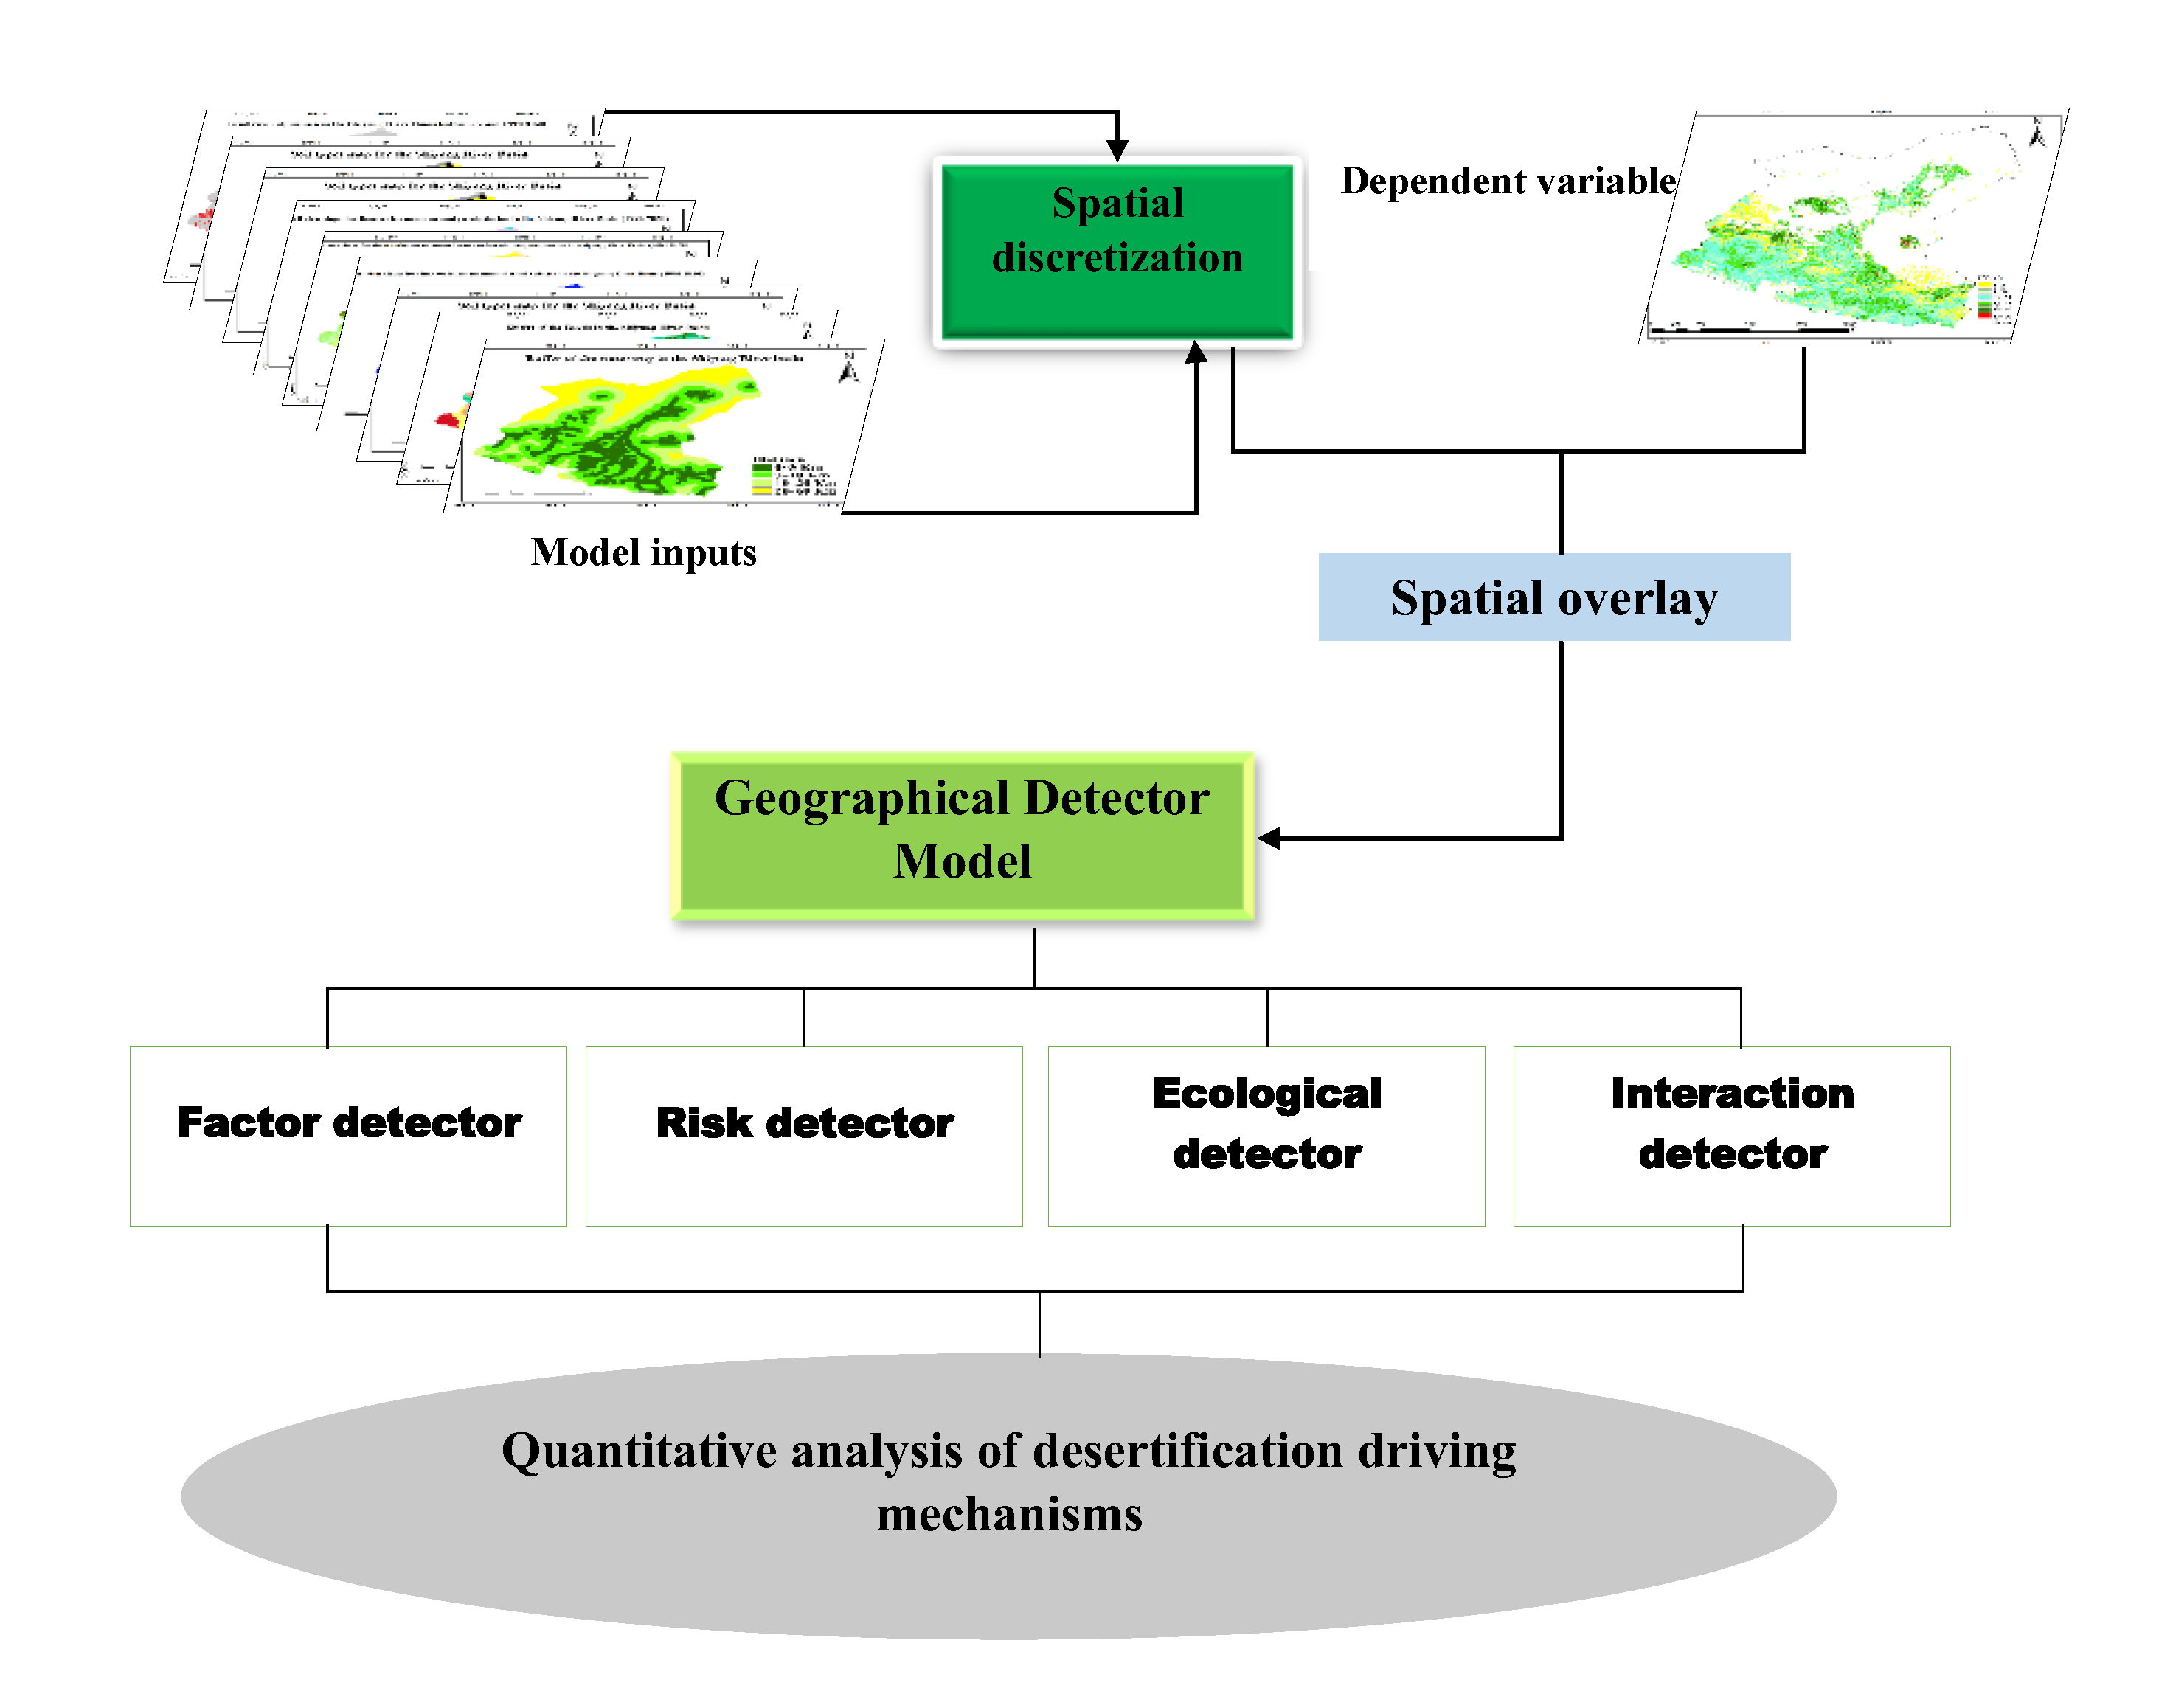
2.3. Geographic detector model
2.3.1. Factor detector
2.3.2. Risk detector

2.3.3. Ecological detector
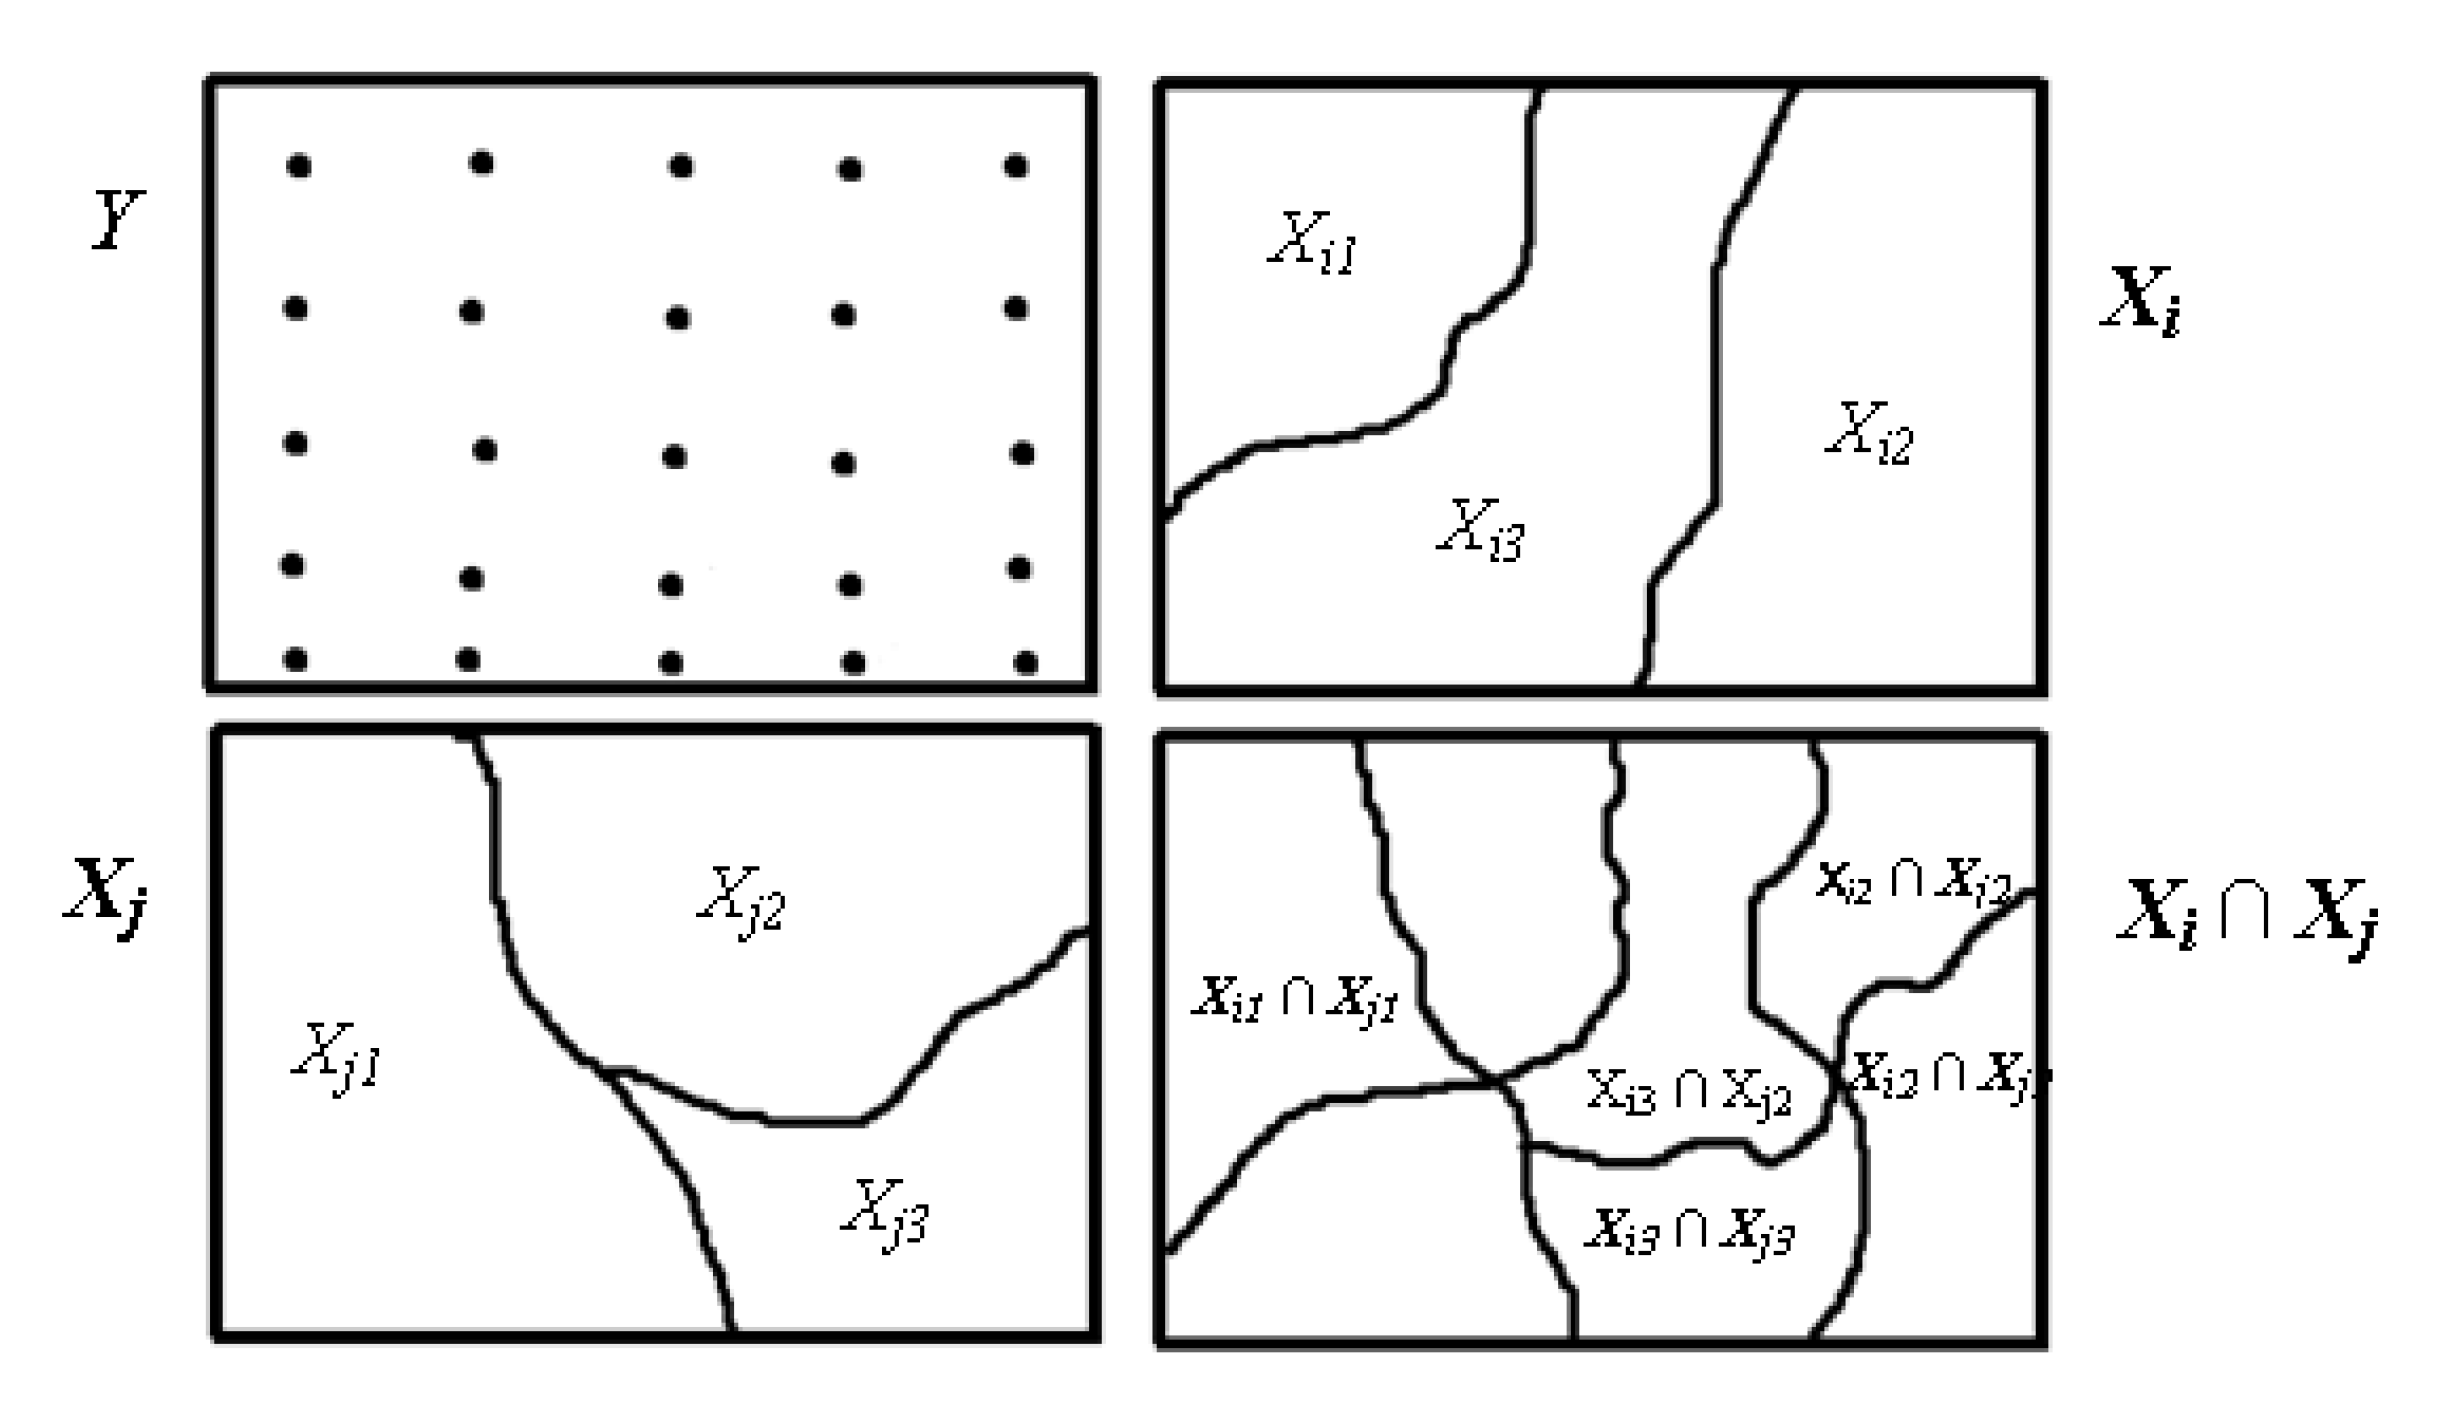
2.3.4. Interactive factor
| Demonstration of interaction relationship | Factor interaction type |
|---|---|
| PD (Xi ∩ Xj) < Min (PD (Xi), PD (Xj)) | The factors weakened & non-linear |
| Min (PD (Xi), PD (Xj)) < PD (Xi ∩ Xj) < Max (PD (Xi)), PD (Xj)) | The factors weakened & univariate |
| PD (Xi ∩ Xj) > Max (PD(Xi), PD (Xj)) | The factors enhanced & bivariate |
| PD (Xi ∩ Xj) = PD (Xi) + PD (Xj) | The factors are independent |
| PD (XiXj) > PD (Xi) + PD (Xj) | The factors are enhanced & non-linear |
| Type of Detector | Conceptual explanation |
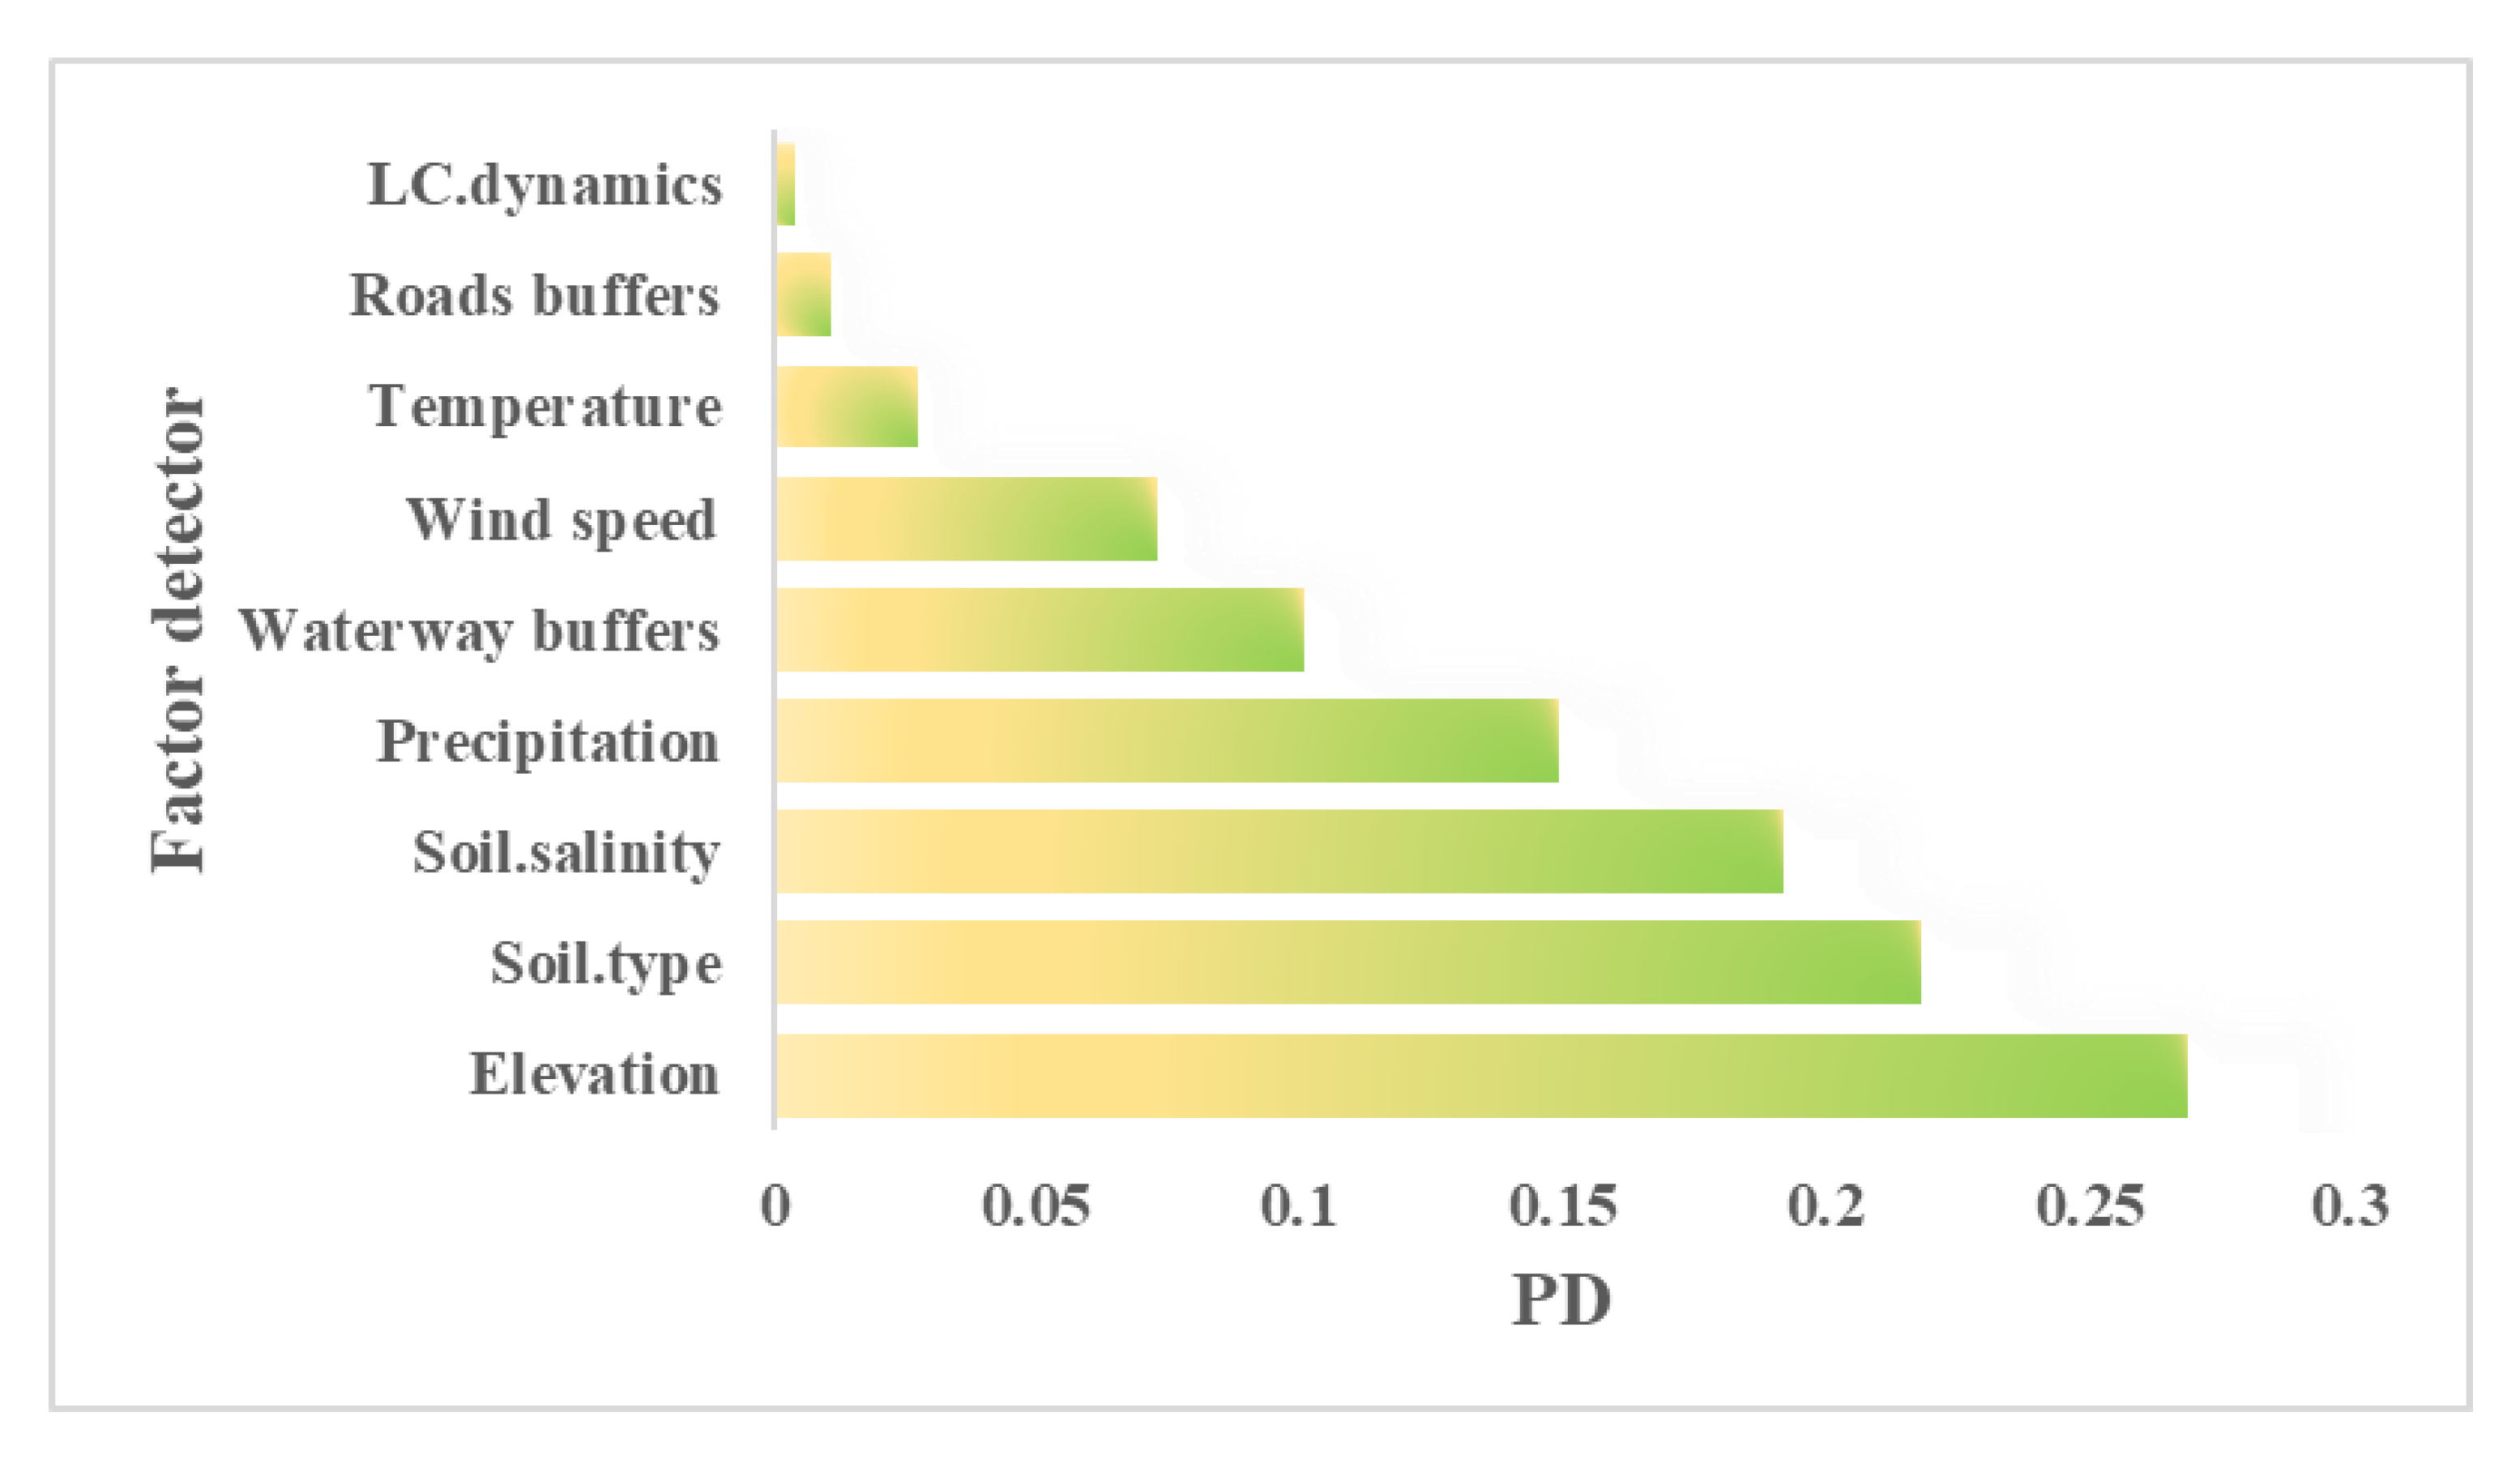
| Factor detector | This method used the Power Determinant (PD) to evaluate the Impact of Land-cover, DEM, Soil salinization, Land surface temperature, water buffer, and road buffer on the spatial distribution of FVC. In addition, F-test was performed to determine whether each subregion's accumulated variance differed significantly from the variance of the whole region. |
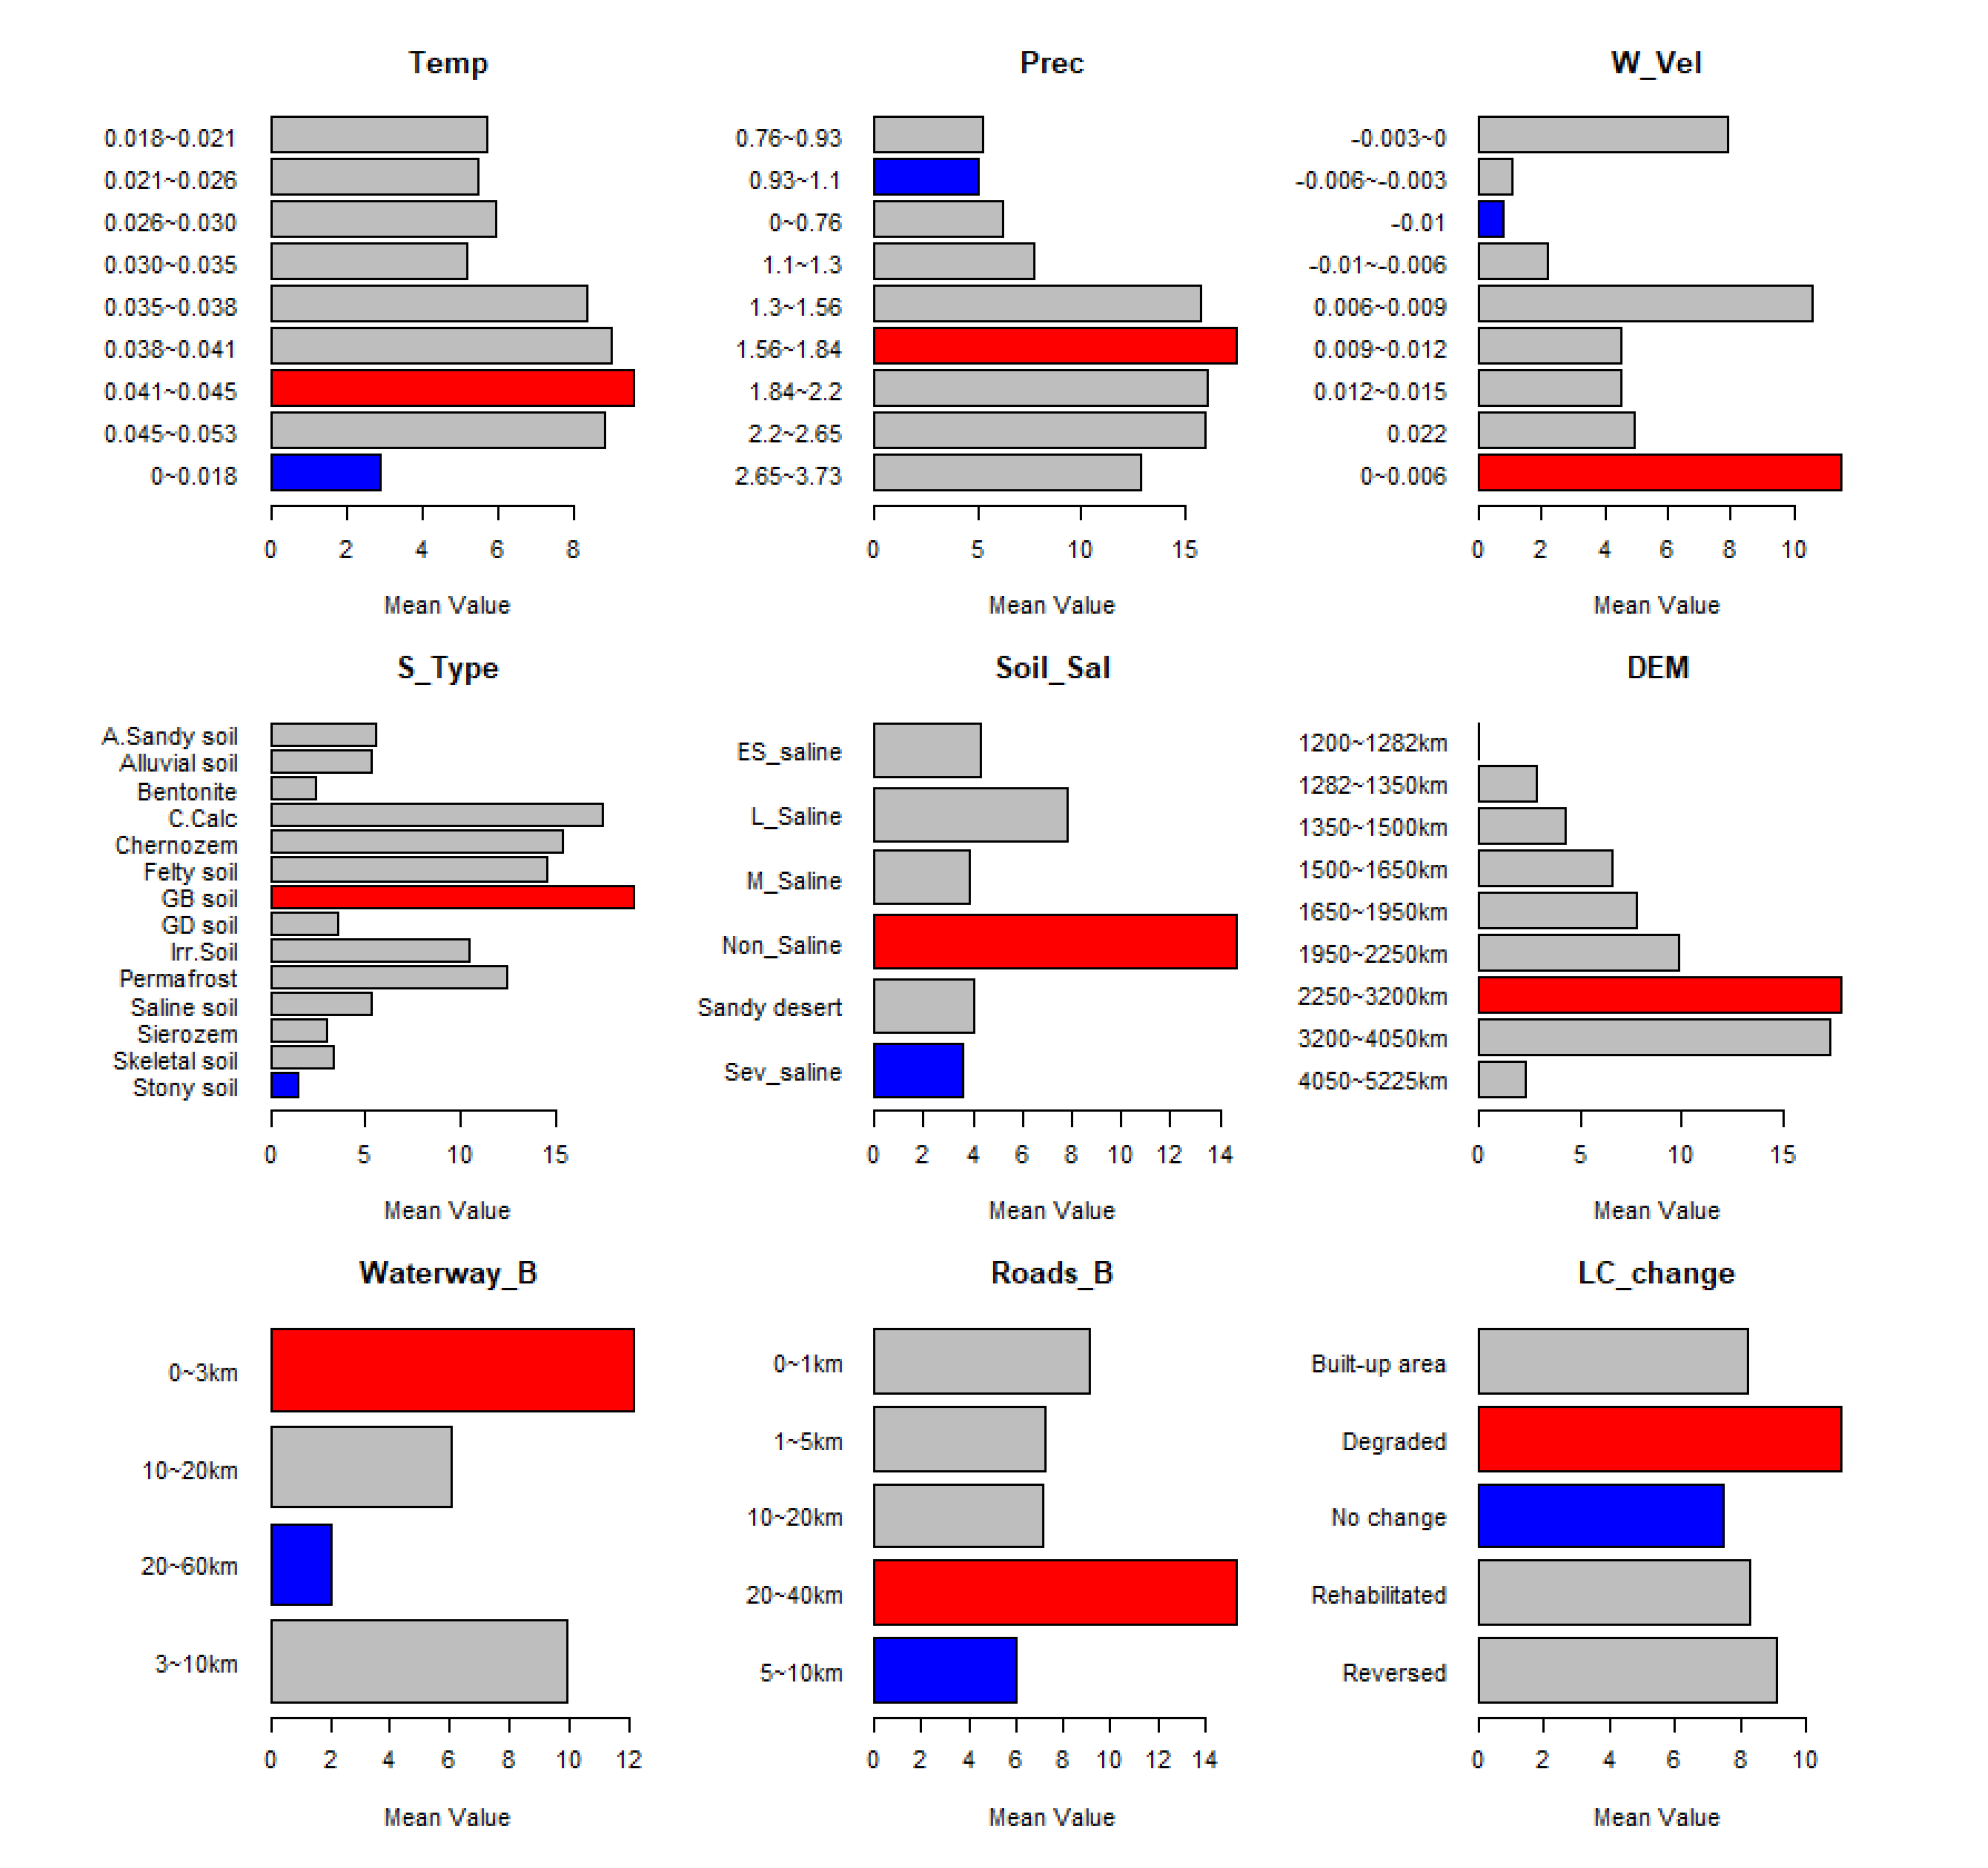
| Risk detector | It compares the difference in average FVC between subregions strata.The t-tests were used to identify whether the FVC among different sub-regions is significantly different. |
| Ecological detector | It evaluates whether the impact of environmental and human factors on FVC is significantly different. The F-test was applied to compare the variance calculated in the subregion attributed to one triggering factor with the variance attributed to another. |
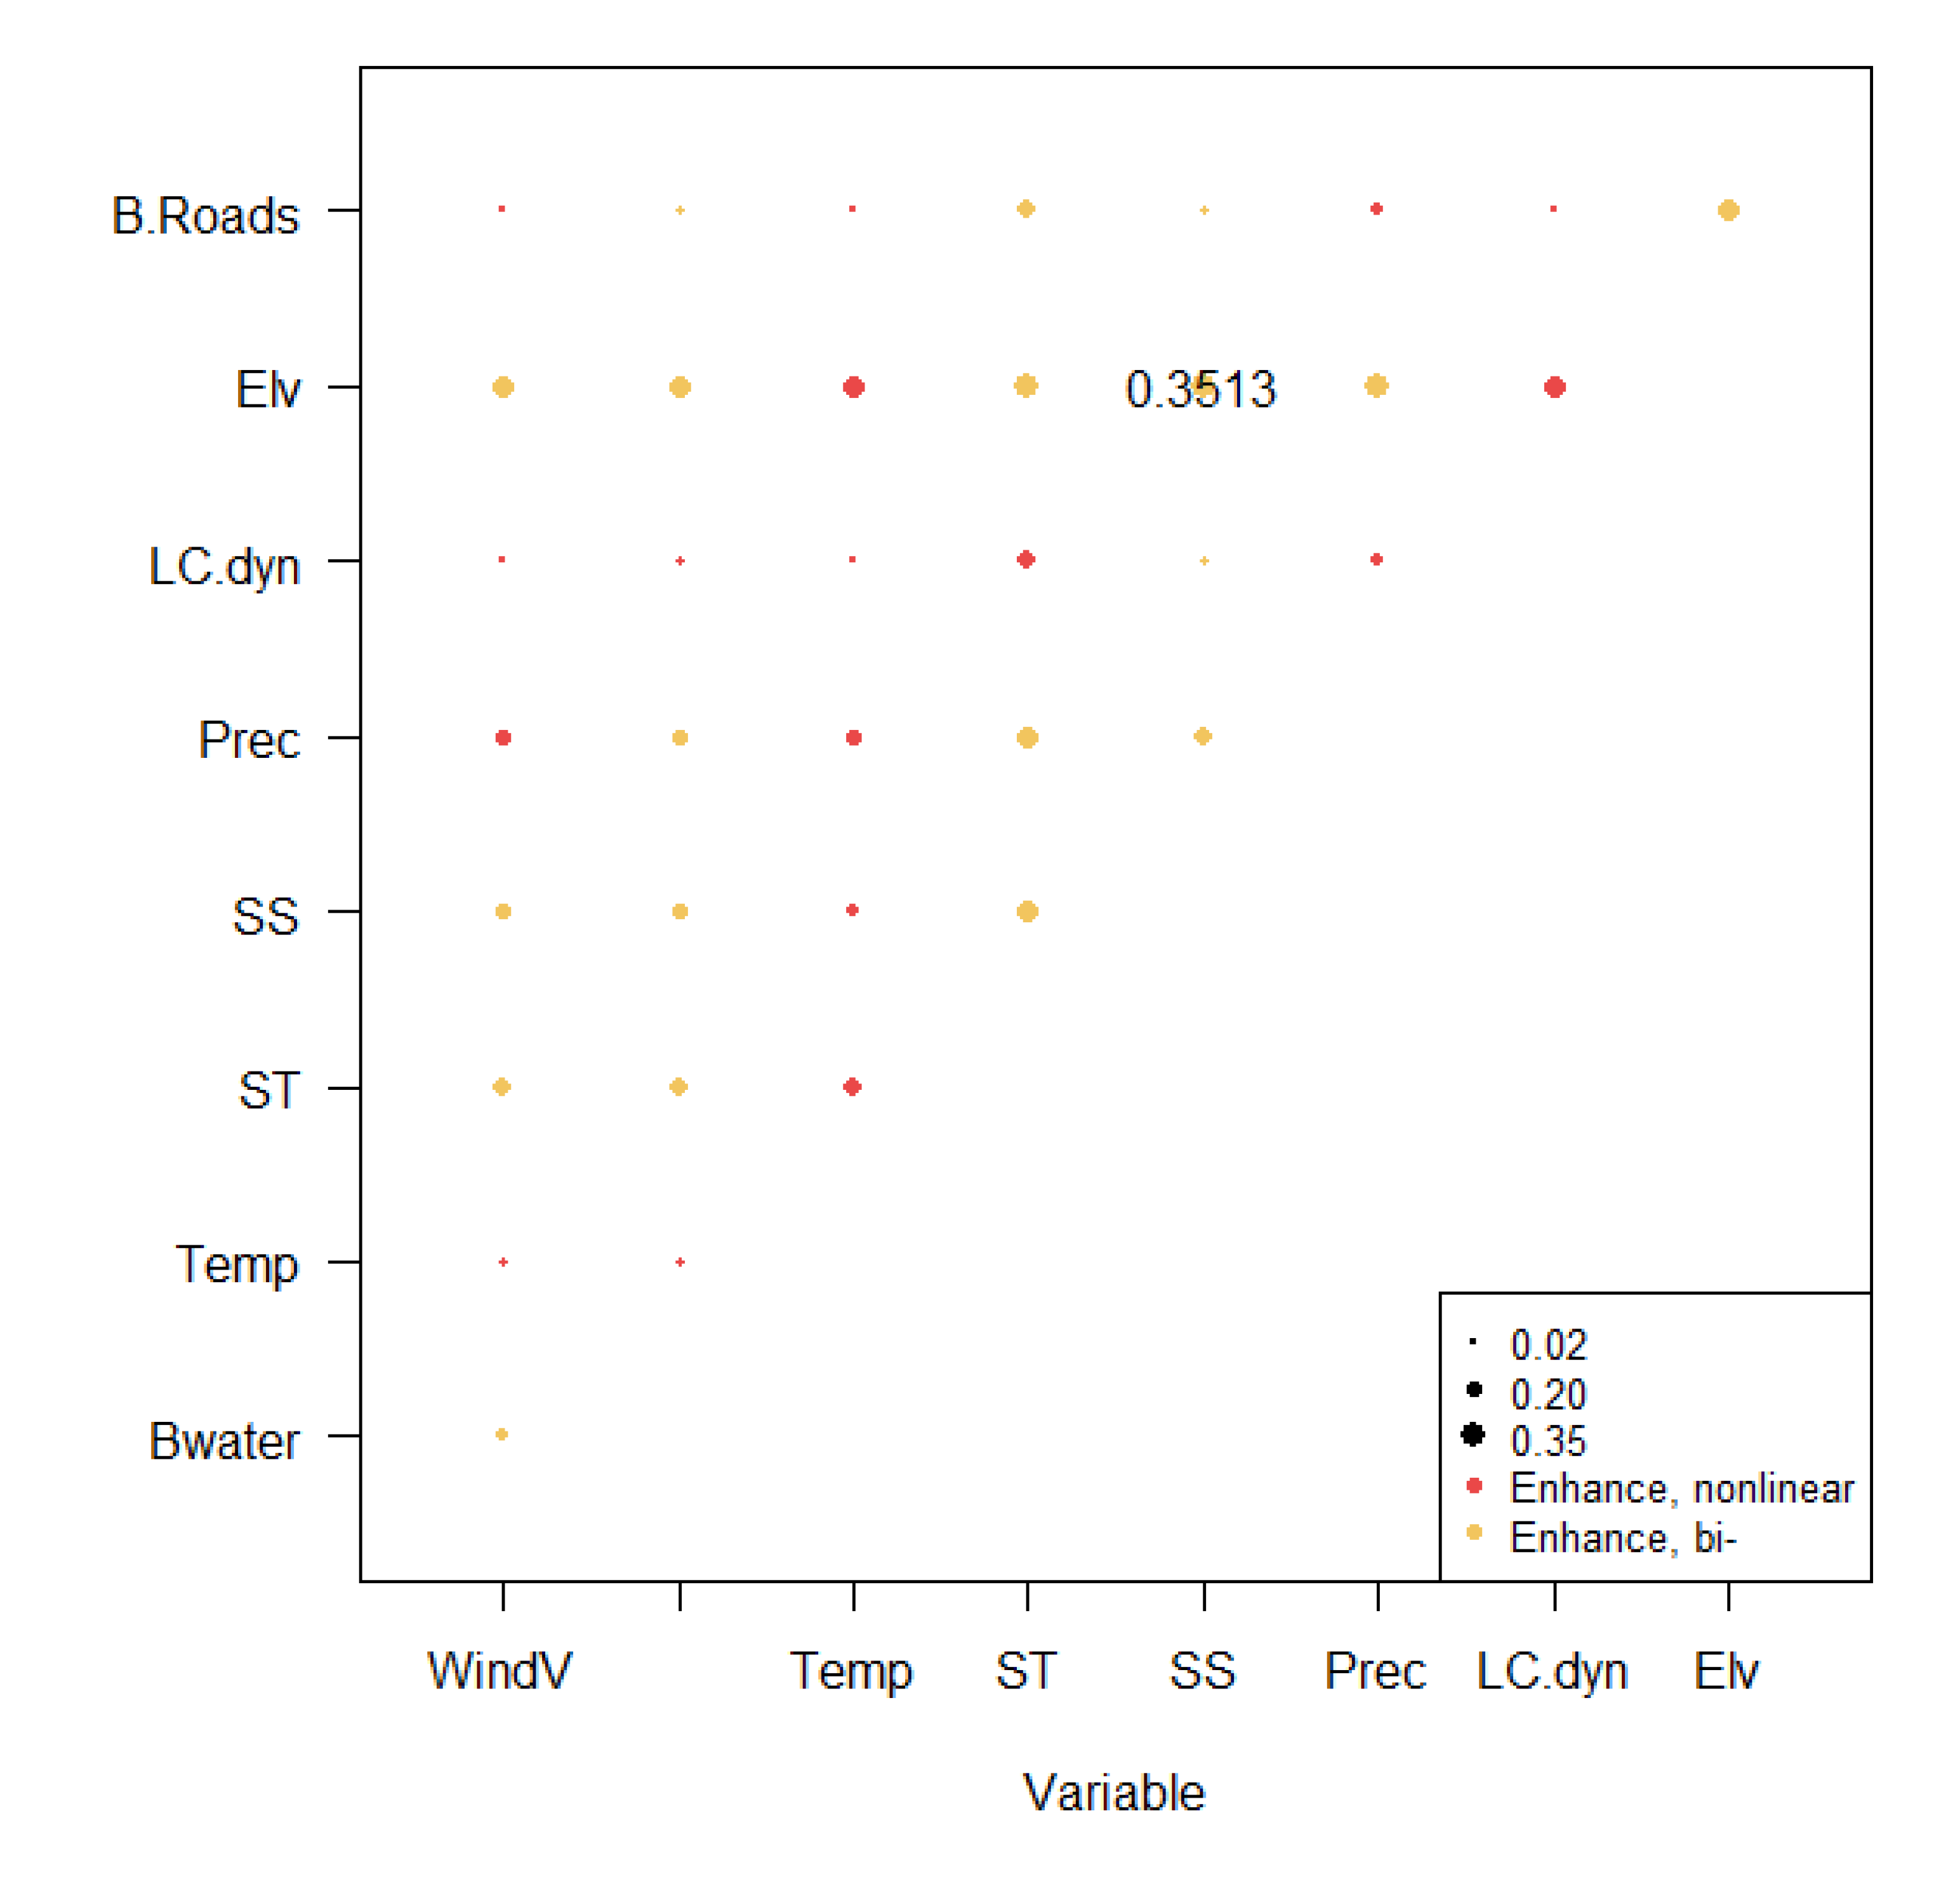
| Interaction detector | It evaluates the combined impact of two factors on desertification and their respective independent contribution. In addition, it assesses whether the combined factors weaken or enhance each other or independently influence desertification magnitude.The process comprises seven parts: Enhance, Enhance-bi, Enhance-nonlinear, Weaken, Weaken-uni, Weaken-nonlinear, and Independent. |
2.4. Grading standards for desertification
3. Results
3.1. Spatial distribution of desertification and land cover dynamics in the Shiyang River Basin
3.2. Quantitative analysis of factors governing the ecological status and dynamics in the Shiyang River Basin
3.3. Environmental risk detection of desertification in the Shiyang River Basin
3.4. Interaction between ecosystem's driving factors in the Shiyang River basin
4. Discussion: Understanding factors' interaction effect on desertification in the Shiyang River Basin
5. Conclusions and Prospects
Authors contribution
Data availability
Conflicts of Interests
Acknowledgments
References
- Kassas, M. , Desertification: a general review. J. Arid Environ. 1995, 30, 115–128. [Google Scholar] [CrossRef]
- Chen, Y. and Tang, H. , Desertification in North China: Background, Anthropogenic impact and Failures in combating it. Land Degrad. Develop. 2005, 16, 367–376. [Google Scholar] [CrossRef]
- Feng, Q. , Ma, H. , and Jiang, X., What Has Caused Desertification in China? Sci. Rep. 2015, 5, 15998. [Google Scholar] [CrossRef]
- Pacheco, F. A. L. , Fernandes, L. F. S., Junior, R. F. V., Valera, C. A., and Pissarra, T. C. T., Land degradation: Multiple environmental consequences and routes to neutrality. Curr Opin Environ Sci Health 2018, 5, 79–86. [Google Scholar] [CrossRef]
- Barbut, M. and Alexander, S., Land Degradation as a Security Threat Amplifier: The New Global Frontline, in Land Restoration: Reclaiming Landscapes for a Sustainable Future. 2016, Academic Press. p. 3-12.
- Geist, H. J. and Lambin, E. F., Dynamic Causal Patterns of Desertification. BioScience 2004, 54, 817–829. [Google Scholar] [CrossRef]
- Wang, F. , Pan, X. , Wang, D., Shen, C., and Lu, Q., Combating desertification in China: Past, present and future. Land Use Policy 2013, 31, 331–313. [Google Scholar] [CrossRef]
- Yue, Y. , Geng, L. , and Li, M., The impact of climate change on aeolian desertification: A case of the agro-pastoral ecotone in northern China. Sci Total Environ 2013, 859, 160126. [Google Scholar] [CrossRef]
- Huang, J. , Zhang, G. , Zhang, Y., Guan, X., and Yun, W., Global desertification vulnerability to climate change and human activities. Land Degrad Dev 2020, 31, 1380–1391. [Google Scholar] [CrossRef]
- Rafferty, J. P. and Pimm, S. L., desertification, in Encyclopedia Britannica. 2020.
- Neary, D. G. , Wildfire contribution to desertification at local, regional, and global scale, in Desertification, V.R. Squires and A. Ariapour, Editors. 2018, Nova Science Publishers, Inc. p. 200-222.
- Reynolds, J. F. , Smith, D. M. S., Lambin, E. F., Turnel, B. L., Mortimore, M., and Batterbury, S. P. J., Global Desertification: Building a Science for Dryland Development. Science 2007, 316, 5826. [Google Scholar] [CrossRef]
- Nickayin, S. S. , Coluzzi, R. , Marucci, A., Bianchini, L., Salvati, L., Cudlin, P., and Imbreda, V., Desertification risk fuels spatial polarization in ‘affected’ and 'unaffected’ landscapes in Italy. Sci Rep 2022, 12, 747. [Google Scholar] [CrossRef]
- Ziadat, F. M. , Zdruli, P. , Christensen, S., Caon, L., Monem, A., and Fetsi, T., An Overview of Land Degradation and Sustainable Land Management in the Near East and North Africa. Sustain. Agric. Res. 2022, 11, 11–24. [Google Scholar] [CrossRef]
- Wang, X. , Chen, F. , Hasi, E., and Li, J., Desertification in China: An assessment. Earth-Sci. Rev 2008, 88, 188–206. [Google Scholar] [CrossRef]
- Wang, X. , Ge, Q. , Geng, X., Wang, Z., Gao, L., Bryan, B. A., Chen, S., Su, Y., Cai, D., Ye, J., and Sun, J., Unintended consequences of combating desertification in China. Nat Commun 2023, 14, 1139. [Google Scholar] [CrossRef]
- Qi, L. , Lei, J., Li, X., Yang, Y., and Feng, W., China's Combating Desertification: National Solutions and Global Paradigm. Chin. Sci. Bull. 2020, 35(6). [CrossRef]
- Hong, J. , Desertification in China: Problems with Policies and Perceptions, in China’s Environmental Crisis J.J. Kassiola and S. Guo, Editors. 2010: Palgrave Macmillan, New York. p. 13–40.
- Kong, Z. , Stringer, L. , Paavola, J., and Lu, Q., Situating China in the Global Effort to Combat Desertification. Land 2021, 10, 702. [Google Scholar] [CrossRef]
- Bao, Y. , Cheng, L. , Yanfeng, B., Yang, L., Jiang, L., Long, C., Kong, G., Peng, P., Xiao, J., and Lu, Q., Desertification: China provides a solution to a global challenge. Front. Agr. Sci. Eng. 2017, 4, 402–413. [Google Scholar] [CrossRef]
- Fang, Y. , Wang, X. , Cheng, Y., and Wang, Z., Oasis Change Characteristics and Influencing Factors in the Shiyang River Basin, China. Sustainability 2022, 14, 14354. [Google Scholar] [CrossRef]
- Zhang, Y. , Zhu, G. , Ma, H., Yang, J., Pan, H., Guo, H., Wan, Q., and Yong, L., Effects of Ecological Water Conveyance on the Hydrochemistry of a Terminal Lake in an Inland River: A Case Study of Qingtu Lake in the Shiyang River Basin. Water 2019, 11, 1673. [Google Scholar] [CrossRef]
- Jun, Z. , Ming, L. , Qiang, C., Min, W., and Xin, P., Impacts of changing conditions on the ecological environment of the Shiyang River Basin, China. Water Supply 2022, 22, 5689–5697. [Google Scholar] [CrossRef]
- Wang, Q. , Shi, J. , Chen, G., and Xue, L., Environmental effects induced by human activities in arid Shiyang River basin, Gansu province, northwest China. Environ. Geol. 2002, 43, 219–227. [Google Scholar] [CrossRef]
- Kang, S. , Su, X. , Tong, L., Shi, P., Yang, X., and Yukuo, A., The impacts of human activities on the water–land environment of the Shiyang River basin, an arid region in northwest China. Hydrol Sci J 2004, 49, 427. [Google Scholar] [CrossRef]
- Schwilch, G. , Bestelmeyer, B. , Bunning, S., Critchley, W., Herrick, J., Kellner, K., Liniger, H. P., Nachtergaele, F., Ritsema, C. J., Schuster, B., et al., Experience in monitoring and assessment of sustainable land management. Land Degrad. Develop. 2011, 22, 214–225. [Google Scholar] [CrossRef]
- Vu, Q. M. , Le, Q. B., Frossard, E., and Vlek, P. L. G., Socio-economic and biophysical determinants of land degradation in Vietnam: An integrated causal analysis at the national level. 2014. 36, 605-617. [CrossRef]
- Marin, A. M. P. , Vendruscolo, J. , Salazar, J. R. Z., Queiroz, H. A. A., Magalhães, D. L., Menezes, R. S. C., and Fernandez, I. M., Monitoring Desertification Using a Small Set of Biophysical Indicators in the Brazilian Semiarid Region. Sustainability 2022, 14, 9735. [Google Scholar] [CrossRef]
- XCerretelli, S. , Poggio, L., Gimona, A., Yakob, G., SBoke, S., Habte, M., Coull, M., Peressotti, A., and Black, H., Spatial assessment of land degradation through key ecosystem services: The role of globally available data. Sci. Total Environ. 2018, 628-629, 539-555. [CrossRef]
- Ramsy, M. , Gad, A. , Abdelsalam, H., and Siwailam, M., A dynamic simulation model of desertification in Egypt. Egypt. J. Remote. Sens. Space Sci. 2010, 13, 101–111. [Google Scholar] [CrossRef]
- Pulleman, M. , Creamer, R. , Hamer, U., Helder, J., Pelosi, C., Peres, G., and Rutgers, M., Soil biodiversity, biological indicators and soil ecosystem services—an overview of European approaches. COSUST 2012, 4, 529–538. [Google Scholar] [CrossRef]
- Kader, F. H. A. , Assessment and monitoring of land degradation in the northwest coast region, Egypt using Earth observations data. Egypt. J. Remote. Sens. Space Sci. 2019, 22. [Google Scholar] [CrossRef]
- Rayegani, B. , Barati, S. , Sohrabi, T. A., and Sonboli, B., Remotely sensed data capacities to assess soil degradation. Egypt. J. Remote. Sens. Space Sci. 2016, 19, 207–222. [Google Scholar] [CrossRef]
- Dubovyk, O. , The role of Remote Sensing in land degradation assessments: opportunities and challenges. Eur. J. Remote Sens 2017, 50, 601–613. [Google Scholar] [CrossRef]
- Lanfredi, M. , Coppola, R. , Simoniello, T., Coluzzi, R., Emilio, M., Imbrenda, V., and Macchiato, M., Early Identification of Land Degradation Hotspots in Complex Bio-Geographic Regions. Remote Sens. 2015, 7, 8154–8179. [Google Scholar] [CrossRef]
- Ibrahim, Y. , Baltzer, H. , Haduk, J., and Tucker, C. J., Land Degradation Assessment Using Residual Trend Analysis of GIMMS NDVI3g, Soil Moisture and Rainfall in Sub-Saharan West Africa from 1982 to 2012. Remote Sens. 2015, 7, 5471–5494. [Google Scholar] [CrossRef]
- Serrano, S. M. V. , Cabello, D. , Burguerra, M. T., Hernandez, N. M., Begueria, S., and Molina, C. A., Drought Variability and Land Degradation in Semiarid Regions: Assessment Using Remote Sensing Data and Drought Indices (1982–2011). Remote Sens. 2015, 7, 4391–4423. [Google Scholar] [CrossRef]
- Lynden, G. W. J. and Mantel, S. , The role of GIS and remote sensing in land degradation assessment and conservation mapping: some user experiences and expectations. Int J Appl Earth Obs Geoinf 2001, 3, 61–68. [Google Scholar] [CrossRef]
- Yu, T. , Jiapaer, G. , Bao, A., Zheng, G., Jiang, L., Yuan, Y., and Huang, X., Using Synthetic Remote Sensing Indicators to Monitor the Land Degradation in a Salinized Area. Remote Sens. 2021, 13, 2851. [Google Scholar] [CrossRef]
- Lu, L. , Kuenzer, C. , Wang, C., Guo, H., and Li, Q., Evaluation of Three MODIS-Derived Vegetation Index Time Series for Dryland Vegetation Dynamics Monitoring. Remote Sens. 2015, 7, 7597–7614. [Google Scholar] [CrossRef]
- Dubdovik, O. , Menz, G. , Lee, A., Schellberg, J., Thonfeld, F., and Khamzina, A., SPOT-Based Sub-Field Level Monitoring of Vegetation Cover Dynamics: A Case of Irrigated Croplands. Remote Sens. 2015, 7, 6763–6783. [Google Scholar] [CrossRef]
- Smith, W. K. , Dannenberg, M. P., Yan, D., Hermann, S., Barnes, M. L., Gafford, G. A. B., Biedermn, J. A., Ferrenberg, S., Fox, A. M., and Hudson, A., Remote sensing of dryland ecosystem structure and function: Progress, challenges, and opportunities. Remote Sens. Environ. 2019, 233, 111401. [Google Scholar] [CrossRef]
- Allen, R. A. W. , Ramsey, R. D., West, N. E., and Norton, B. E., Quantification of the Ecological Resilience of Drylands Using Digital Remote Sensing. Ecol. Soc. 2008, 13, 33. [Google Scholar]
- Marzolff, I. , Kirchhoff, M. , Stephan, R., Seeger, M., Hassaine, A. A., and Ries, J. B., Monitoring Dryland Trees With Remote Sensing. Part A: Beyond CORONA—Historical HEXAGON Satellite Imagery as a New Data Source for Mapping Open-Canopy Woodlands on the Tree Level. Front. Environ. Sci. 2022, 10, 896702. [Google Scholar] [CrossRef]
- Safaei, M. , Bashari, H., Kleinebecker, T., Fakheran, S., Jafari, R., and Stoltenberg, A. G., Mapping terrestrial ecosystem health in drylands: comparison of field-based information with remotely sensed data at watershed level. Landsc. Ecol. 2022. [Google Scholar] [CrossRef]
- Shang, H. , Fan, J. , Fan, B., and Su, F., Economic Effects of Ecological Compensation Policy in Shiyang River Basin: Empirical Research Based on DID and RDD Models. Sustainability 2022, 14, 2999. [Google Scholar] [CrossRef]
- Hu, X. , Jin, Y., Ji, L., Zeng, J., Cui, Y., Song, Z., Sun, D., and Cheng, G., Land use/cover change and its eco-environment effects in Shiyang River Basin, in The 4th International Conference on Water Resource and Environment (WRE 2018). 2018, IOP Publishing.
- Wang, Y. , Feng, Q. , Chen, L., and Yu, T., Significance and Effect of Ecological Rehabilitation Project in Inland River Basins in Northwest China. Environ Manage. 2013, 52, 209–220. [Google Scholar] [CrossRef]
- Liu, M. , Nie Z. , Cao, L., Wang, L., Lu, H., Wang, Z., and Zhu, P., Comprehensive evaluation on the ecological function of groundwater in the Shiyang River watershed. J. Groundw. Sci. Eng. 2021, 9, 326–340. [Google Scholar] [CrossRef]
- Li, S. , Li, X., Gong, J., Dang, D., Dou, H., and Lyu, X., Quantitative Analysis of Natural and Anthropogenic Factors Influencing Vegetation NDVI Changes in Temperate Drylands from a Spatial Stratified Heterogeneity Perspective: A Case Study of Inner Mongolia Grasslands, China. Remote Sens. 2022, 14(3320). [CrossRef]
- Han, X. , Jia, G., Yang, G., Wang, N., Liu, F., Chen, H., and Guo, X., Spatiotemporal dynamic evolution and driving factors of desertification in the Mu Us Sandy Land in 30 years. Sci Rep 2020, 10(21734). [CrossRef]
- Burrell, A. L. , Evans, J. P., and De Kauwe, M. G., Anthropogenic climate change has driven over 5 million km2 of drylands towards desertification. Nat.Commun. 2020, 11, 3853. [Google Scholar] [CrossRef]
- Fan, Z. , Li, S. , and Fang, H., Explicitly Identifying the Desertification Change in CMREC Area Based on Multisource Remote Data. Remote Sens. 2020, 12, 3170. [Google Scholar] [CrossRef]
- Hien, L. T. T. , Gobin, A. , and Huong, P. T. T., Spatial indicators for desertification in southeast Vietnam. Earth Syst. Sci. 2019, 19, 2325–2337. [Google Scholar] [CrossRef]
- Guo, Q. , Fu, B. , Shi, P., Thomas, C., Zhang, J., and Xu, H., Satellite Monitoring the Spatial-Temporal Dynamics of Desertification in Response to Climate Change and Human Activities across the Ordos Plateau, China. Remote Sens. 2017, 9, 525. [Google Scholar] [CrossRef]
- Zhang, J. , Guan, Q. , Du, Q., Ni, F., Mi, J., Luo, H., and Shao, W., Spatial and temporal dynamics of desertification and its driving mechanism in Hexi region. Land Degrad Dev 2022, 33, 3539–3556. [Google Scholar] [CrossRef]
- Zhou, W. , Sun, Z. J. Arid Land 2013, 465–479. [Google Scholar] [CrossRef]
- Meng, X. , Gao, X. , Li, S., Li, S., and Lei, J., Monitoring desertification in Mongolia based on Landsat images and Google Earth Engine from 1990 to 2020. Ecol. Indic. 2021, 129, 107908. [Google Scholar] [CrossRef]
- Wang, J. and Xu, C. , Geodetector: Principle and prospective. Acta Geogr. Sin. 2017, 72, 116–134. [Google Scholar] [CrossRef]
- Zhang, S. , Zhou, Y. , Yu, Y., Li, F., Zhang, R., and Li, W., Using the Geodetector Method to Characterize the Spatiotemporal Dynamics of Vegetation and Its Interaction with Environmental Factors in the Qinba Mountains, China. Remote Sens. 2022, 14, 5794. [Google Scholar] [CrossRef]
- Ren, D. and Caio, A. , Analysis of the heterogeneity of landscape risk evolution and driving factors based on a combined GeoDa and Geodetector model. Ecol. Indic. 2022, 144, 109568. [Google Scholar] [CrossRef]
- Wang, B. and Gao, X. , Temporal and spatial variations of water resources constraint intensity on urbanization in the Shiyang River Basin, China. Environ Dev Sustain 2021, 23, 10038–10055. [Google Scholar] [CrossRef]
- Zhu, G. , Wan, Q. , TYong, L., Zhang, Z., Guo, H., Zhang, Y., Sun, Z., Zhang, Z., and Ma, H., Dissolved organic carbon transport in the Qilian mountainous areas of China. Hydrol. Process. 2020, 34, 4985–4995. [Google Scholar] [CrossRef]
- Hu, L. , Wang, Z. , Tian, W., and Zhao, J., Coupled surface water-groundwater model and its application in the arid Shiyang River basin, China. Hydrol. Process. Int. J. 2009, 23, 2033–2044. [Google Scholar] [CrossRef]
- Wang, Z. , Shi, P., Zhang, X., Tong, H., Zhang, W., and Liu, Y., Research on Landscape Pattern Construction and Ecological Restoration of Jiuquan City Based on Ecological Security Evaluation. sustainability 2021, 13(10). [CrossRef]
- Wang, H. , Zhang, M. , Zhu, H., Dang, X., Ynang, Z., and Yin, L., Hydro-climatic trends in the last 50 years in the lower reach of the Shiyang RiverBasin, NW China. catena 2012, 95, 33–41. [Google Scholar]
- Su, X. , Singh, V. Stoch Environ Res Risk Assess 2015. 29, 1571–1582. [CrossRef]
- Wang, Z. , Ficklin, D. L., Zhang, Y., and Zhang, M., Impact of climate change on streamflow in the arid Shiyang River Basin of northwest China. Hydrol. Process. 2011, 26, 2733–2744. [Google Scholar] [CrossRef]
- Zhang, Y. , Jiang, J., Shen, B., Shen, Q., Yang, D., Tian, F., Tang, L., and Liu, Z. Study on countermeasures for water resources shortage and changes of ecological environment in Shiyang River basin. 2008.
- Bao, C. and Fang, C. , Water resources constraint force on urbanization in water deficient regions: A case study of the Hexi Corridor, arid area of NW China. Ecol Econ 2007, 62, 508–517. [Google Scholar] [CrossRef]
- Chen, M. , Wang, P. , and Chen, L., Population Distribution Evolution Characteristics and Shift Growth Analysis in Shiyang River Basin. J.Geosci 2014, 5, 1395–1403. [Google Scholar] [CrossRef]
- Deng, X. , Wilson, J. P., and Gallant, J. C., Terrain Analysis, in The Handbook of Geographic Information Science, J.P. Wilson and A.S. Fotheringham, Editors. 2007.
- Guan, Q., Yang. , Pan, N. , Lin, J., Xu, C., Wang, F., and Liu, Z., Greening and Browning of the Hexi Corridor in Northwest China: Spatial Patterns and Responses to Climatic Variability and Anthropogenic Drivers. Remote Sens. 2018, 10, 1270. [Google Scholar] [CrossRef]
- Jiang, Y., Du, W., Chen, J., Wang, C., Wang, J., Sun, W., Chai, X., Ma, L., and Xu, Z., Climatic and Topographical Effects on the Spatiotemporal Variations of Vegetation in Hexi Corridor, Northwestern China. Diversity 2022. 14, 370. [CrossRef]
- Safanelli, J. L. , Poppiel, R. R., Ruiz, L. F. C., Bonfatti, B. R., Mello, F. A. M., Rizzo, R., and Demattê, J. A. M., Terrain Analysis in Google Earth Engine: A Method Adapted for High-Performance Global-Scale Analysis. ISPRS Int. J. Geo-Inf. 2020, 9, 400. [Google Scholar] [CrossRef]
- Zhang, L. , Wu, B. , Xi, X., and Xing, Q., Classification system of China land cover for carbon budget. Acta Ecol. Sin 2014, 34, 7158–7166. [Google Scholar] [CrossRef]
- Stavi, I. , Thevs, N. , and Priori, S., Soil Salinity and Sodicity in Drylands: A Review of Causes, Effects, Monitoring, and Restoration Measures. Front. environ. sci 2021, 9, 712831. [Google Scholar] [CrossRef]
- Hassani, A. , Azapagic, A. , and Shokri, N., Global predictions of primary soil salinization under changing climate in the 21st century. Nat Commun 2021, 12, 6663. [Google Scholar] [CrossRef] [PubMed]
- Ngabire, M. , Wang, T. , Xue, X., Liao, J., Ghada, S., Huang, C., Duan, H., and Song, X., Soil salinization mapping across different sandy land-cover types in the Shiyang River Basin: A remote sensing and multiple linear regression approach. RSASE 2022, 28, 100847. [Google Scholar] [CrossRef]
- Zhang, X. and Zhao, Y. , Identification of the driving factors’ influences on regional energy-related carbon emissions in China based on geographical detector method. Environ Sci Pollut Res 2018, 25, 9626–9635. [Google Scholar] [CrossRef]
- Escobedo, F. J. and Nowak, D. J., Spatial heterogeneity and air pollution removal by an urban forest. Landsc Urban Plan 2009, 90, 102–110. [Google Scholar] [CrossRef]
- Xu, Y. , Li, P. , Pan, J., Zhang, Y., Dang, X., Cao, X., Cui, J., and Yang, Z., Eco-Environmental Effects and Spatial Heterogeneity of “Production-Ecology-Living” Land Use Transformation: A Case Study for Ningxia, China. Sustainability 2022, 14, 9659. [Google Scholar] [CrossRef]
- Yin, H., Chen, C., Dong, Q., Zhang, P., Chen, Q., and Zhu, L., Analysis of Spatial Heterogeneity and Influencing Factors of Ecological Environment Quality in China’s North-South Transitional Zone. Int. J. Environ. Res. Public Health 2022. 19, 2236. [CrossRef]
- Wang, H. , Qin, F. , Xu, C., Li, B., Guo, L., and Wang, Z., Evaluating the suitability of urban development land with a Geodetector. Ecol. Indic. 2021, 123, 107339. [Google Scholar] [CrossRef]
- Liang, X. , Li, P. , Wang, J., Chan, F. K., Togtokh, C., Ochir, A., and Davaasuren, D., Research Progress of Desertification and Its Prevention in Mongolia. Sustainability 2021, 13, 6861. [Google Scholar] [CrossRef]
- Zhang, Z. , Song, Y. Int J Appl Earth Obs Geoinf 2022. 109(10 2782. [CrossRef]
- Song, Y. , Wang, J. , Ge, Y., and Xu, C., An optimal parameters-based geographical detector model enhances geographic characteristics of explanatory variables for spatial heterogeneity analysis: cases with different types of spatial data. GIsci Remote Sens 2020, 57, 593–610. [Google Scholar] [CrossRef]
- Wang, F. , Li, X. , Christakos, G., Liao, Y., Zhang, T., and Gu, X., Geographical Detectors-Based Health Risk Assessment and its Application in the Neural Tube Defects Study of the Heshun Region, China. Int J Geogr Inf Sci 2010, 24, 107–127. [Google Scholar] [CrossRef]
- Wang, T. and Watson, J. , Scenario analysis of China’s emissions pathways in the 21st century for low carbon transition. Energy Policy 2010, 38, 3537–3546. [Google Scholar] [CrossRef]
- Ding, Y. , Zhang, M. , Qian, X., Li, C., Chen, S., and Wang, W., Using the geographical detector technique to explore the impact of socioeconomic factors on PM2.5 concentrations in China. J. Clean. Prod. 2019, 211, 1480–1490. [Google Scholar] [CrossRef]
- Cao, F. , Ge, Y., and Wang, J., Optimal discretization for geographical detectors-based risk assessment. GIsci Remote Sens 2013, 50(1). [CrossRef]
- Wu, R. , Zhang, J. , Bao, Y., and Zhang, F., Geographical Detector Model for Influencing Factors of Industrial Sector Carbon Dioxide Emissions in Inner Mongolia, China. Sustainability 2016, 8, 149. [Google Scholar] [CrossRef]
- Jia, W. , Wang, M. , Zhou, C., and Yang, Q., Analysis of the spatial association of geographical detector-based landslides and environmental factors in the southeastern Tibetan Plateau, China. PLoS One 2021, 16, e0251776. [Google Scholar] [CrossRef]
- Wang, J. and Hu, Y. , Environmental health risk detection with GeogDetector. Environ Model Softw 2012, 33, 114–115. [Google Scholar] [CrossRef]
- Han, J. , Wang, J. , Chen, L., Xiang, J., Ling, Z., Li, Q., and Wang, E., Driving factors of desertification in Qaidam Basin, China: An 18-year analysis using the geographic detector model. Ecol. Indic. 2021, 124, 107404. [Google Scholar] [CrossRef]
- Alvarez, L. J. , Epstein, H. E., Li, J., and Okin, G. S., Aeolian process effects on vegetation communities in an arid grassland ecosystem. Ecol Evol 2012, 2, 809–821. [Google Scholar] [CrossRef]
- Glenn, E. P. , Huete, A. R., Nagler, P. L., and Nelson, S. G., Relationship Between Remotely-sensed Vegetation Indices, Canopy Attributes and Plant Physiological Processes: What Vegetation Indices Can and Cannot Tell Us About the Landscape. Sensors 2008, 8, 2136–2160. [Google Scholar] [CrossRef]
- Gao, L. , Wang, X. , Johnson, B. A., Tian, Q., Wang, Y., Verrelst, J., Mu, X., and Gu, X., Remote sensing algorithms for estimation of fractional vegetation cover using pure vegetation index values: A review. ISPRS Int. J. Geo-Inf 2020, 159, 364–377. [Google Scholar] [CrossRef]
- Choi, S. K. , Jung, S. H., and Choi, D. Y., Estimation of Fractional Vegetation Cover in Sand Dunes Using Multi-spectral Images from Fixed-wing UAV. J. Korean Soc. Surv. Geod. Photogramm. Cartogr. 2016, 34, 431–441. [Google Scholar] [CrossRef]
- Ding, Y. , Zhang, H. , Li, Z., Xin, X., Zheng, X., and Zhao, K., Comparison of fractional vegetation cover estimations using dimidiate pixel models and look-up table inversions of the PROSAIL model from Landsat 8 OLI data. J. Appl. Remote Sens. 2016, 10, 036022. [Google Scholar] [CrossRef]
- Zeng, X. , Doickson, R. E., Alison, W., Muhammad, S., Ruth, D. S., and Qi, J., Derivation and Evaluation of Global 1-km Fractional Vegetation Cover Data for Land Modeling. J. Appl. Meteorol. 2000, 39, 826–839. [Google Scholar] [CrossRef]
- Liu, Y. , Li, Y. , Cui, C., and Ruan, H., Evaluation of MODIS MOD13Q1 data in desertification in the north area of Xinjiang. Acta Prataculturae Sin. 2010, 19, 14–21. [Google Scholar]
- Reynolds, J. F. , Maestre, F. T., Kemp, P. R., Smith, D. M. S., and Lambin, E., Natural and Human Dimensions of Land Degradation in Drylands: Causes and Consequences, in Terrestrial Ecosystems in a Changing World. Global Change, J.G. Canadell, D.E. Pataki, and L.F. Pitelka, Editors. 2007. p. 247-257.
- Ngabire, M. , Wang, T. , Xue, X., Liao, J., Sahbeni, G., Huang, C., Xiang, S., and Duan, H., Synergic effects of land-use management systems towards the reclamation of Aeolian Desertified Land in the Shiyang River Basin. Ecol. Indic. 2022, 139, 108882. [Google Scholar] [CrossRef]
- Liao, J. , Wang, T., and Ma, S., Mapping the dynamic degree of aeolian desertification in the Shiyang River Basin from 1975 to 2010. Sci. Cold Arid. Reg 2020, 12(3). [CrossRef]
- Shao, Y. , Dong, Z. , Meng, J., Wu, S., Zhu, S., Zhang, Q., and Zheng, Z., Analysis of Runoff Variation and Future Trends in a Changing Environment: Case Study for Shiyanghe River Basin, Northwest China. sustainability 2023, 15, 2173. [Google Scholar] [CrossRef]
- Xu, C. D. , Wang, R. R., Ding, L. Y., and Wen, Q. Y., Study on the Climate Change of Shiyang River Basin in Chinese Arid Inland Area. CEt 2015, 46(2015). [CrossRef]
- Zhang, C. and Li, Y. , Verification of watershed vegetation restoration policies, arid China. Sci Rep 2016, 6, 30740. [Google Scholar] [CrossRef]
- Zhu, Q. and Li, Y. , Environmental Restoration in the Shiyang River Basin, China: Conservation, Reallocation and More Efficient Use of Water. Aquat. Procedia 2014, 2, 24–34. [Google Scholar] [CrossRef]
- Tang, Z., Ma, J., Peng, H., Wang, S., and Wei, J., Spatiotemporal changes of vegetation and their responsesto temperature and precipitation in upper Shiyang river basin. Adv. Space Res. 2017, 60 , 969-979. [CrossRef]
- Ma, Q. , Wang, X. , Chen, F., Wei, L., Zhang, D., and Jin, H., Carbon sequestration of sand-fixing plantation of Haloxylon ammodendron in Shiyang River Basin: Storage, rate and potential. Glob. Ecol 2021, 28, 2021. [Google Scholar] [CrossRef]
- Lancaster, N. , Response of Aeolian Processes and Landforms to Climate Change and Variability, in Treatise on Geomorphology (Second Edition). 2022; p. 318-339.
- Zhang, F. , Wang, C. , and Wang, Z., Response of Natural Vegetation to Climate in Dryland Ecosystems: A Comparative Study between Xinjiang and Arizona. Remote Sens. 2020, 12, 3567. [Google Scholar] [CrossRef]
- Mayaud, J. R. and Webb, N. P., Vegetation in Drylands: Effects on Wind Flow and Aeolian Sediment Transport. land 2017, 6, 64. [Google Scholar] [CrossRef]
- Lancaster, N. , Response of eolian geomorphic systems to minor climate change: examples from the southern Californian deserts. Geomorphology 1997, 19, 333–347. [Google Scholar] [CrossRef]
- Heindel, R. C. , Culler, L. E., and Virginia, R. A., Rates and processes of aeolian soil erosion in West Greenland. The Holocene 2017, 27. [CrossRef]
- Catto, N. R. and Bachhuber, F. W., Aeolian Geomorphic Response to Climate Change: An Example from the Estancia Valley, Central New Mexico, USA, in Linking Climate Change to Land Surface Change, S.J. McLaren and D.R. Kniveton, Editors. 2000, Springer: Dordrecht.
- Dousari, A. A. , Ramadan, A. , Qattan, A. A., Arteeqi, S. A., Dashti, H., Ahmed, M., Dousari, N. A., Hashash, N. A., and Othman, A., Cost and effect of native vegetation change on aeolian sand, dust, microclimate and sustainable energy in Kuwait. J. Taibah Univ. Sci. 2020, 14, 628–639. [Google Scholar] [CrossRef]
- Edwards, B. L. , Webb, N. P., Brown, D. P., Elias, E., Peck, D. E., Pierson, F. B., Williams, C. J., and Herrick, J. E., Climate change impacts on wind and water erosion on US rangelands. J Soil Water Conserv 2019, 74(4). [CrossRef]
- Zhao, C. , Li, X. , Zhou, X., Zhao, K., and yang, Q., Holocene Vegetation Succession and Response to Climate Change on the South Bank of the Heilongjiang-Amur River, Mohe County, Northeast China. Adv. Meteorol. 2016, 2450697, 1–11. [Google Scholar] [CrossRef]
- Singh, G. , Tomar, U. K., Singh, B., and Sharma, S., A Manual for Dryland Afforestation and Management. 2017: Scientific Publishers - AFARI.
- Wu, J. , Kurosaki, Y., and Du, C., Evaluation of Climatic and Anthropogenic Impacts on Dust Erodibility: A Case Study in Xilingol Grassland, China. Sustainability 2020, 12(629). [CrossRef]
- Ishizuka, M. , Mikami, M. , and Yamada, Y., Zeng,F.,, Threshold Friction Velocities of Saltation Sand Particles for Different Soil Moisture Conditions in the Taklimakan Desert. SOLA 2009, 5, 184–187. [Google Scholar] [CrossRef]
- Dregne, H. E. , Physics of desertification in Desertification of Arid Lands, F. El-Baz and M.H.A. Hassan, Editors. 1986, Springer: Dordrecht.
- Lin, N. F. and Tang, J. , Geological environment and causes for desertification in arid-semiarid regions in China. Env Geol 2002, 41, 806–815. [Google Scholar] [CrossRef]
- Chen, N. , Guo, C. , Li, Z., and Liu, L., The grassland degradation problems of the Minqin oasis, in the lower reaches of the Shiyang River Basin. Acta Prataculturae Sinica 2010, 19, 62–71. [Google Scholar]
- Li, B. , Soil Salinization, in Desertification and Its Control in China. 2010, Springer: Berlin, Heidelberg.
- Wang, Y. and Qin, D. , Influence of climate change and human activity on water resources in arid region of Northwest China: An overview. Adv. Clim. Chang. Res. 2017, 8, 268–278. [Google Scholar] [CrossRef]
- Yang, J. , Zhao, J. , Zhu, G., Wang, Y., Ma, X., Wang, J., Guo, H., and Zhang, Y., Soil salinization in the oasis areas of downstream inland rivers —Case Study: Minqin oasis. Math. Probl. Eng. 2020, 537, 69–78. [Google Scholar] [CrossRef]
- Li, F. , Zhu, G. , and Guo, C., Shiyang River ecosystem problems and countermeasures Int. J. Agric. Sci. 2013, 4, 72–78. [Google Scholar] [CrossRef]
- Castellini, M. , Di Prima, S. , Stewart, R., Biddocu, M., Rahmati, M., and Alagna, V., Advances in Ecohydrology for Water Resources Optimization in Arid and Semi-Arid Areas. Water 2022, 14, 1830. [Google Scholar] [CrossRef]
- Wei, W. , Shi, P., Zhao, J., Wang, X., and Wang, X., Environmental Suitability Evaluation for Human Settlements in Arid Inland River Basin-A Case Study on the Shiyang River Basin. Adv Mat Res 2012, 518-523, 4874-4884. [CrossRef]
- Kang, S. , Su, X. , Tong, L., Zhang, J., and Zhang, L., A warning from an ancient oasis: intensive human activities are leading to potential ecological and social catastrophe. Int. J. Sustain. Dev 2010, 15, 440–447. [Google Scholar] [CrossRef]
- Jun, Z. , Ming, L. , Qiang, C., Min, W., and Xin, P., Impacts of changing conditions on the ecological environment of the Shiyang River Basin, China. Water Supply 2022, 22, 5689. [Google Scholar] [CrossRef]
- Du, Z. , Xu, X. , Zhang, H., Wu, Z., and Liu, Y., Geographical Detector-Based Identification of the Impact of Major Determinants on Aeolian Desertification Risk. PLoS One 2016, 11, e0151331. [Google Scholar] [CrossRef]
- Xu, C. , Li, Y. , Wang, J., and Xiao, G., Spatial-temporal detection of risk factors for bacillary dysentery in Beijing, Tianjin and Hebei, China. BMC Public Health. 2017, 17, 743. [Google Scholar] [CrossRef]
- Yue, H. and Hu, T. , Geographical Detector-Based Spatial Modeling of the COVID-19 Mortality Rate in the Continental United States. Int J Environ Res Public Health 2021, 18, 6832. [Google Scholar] [CrossRef]

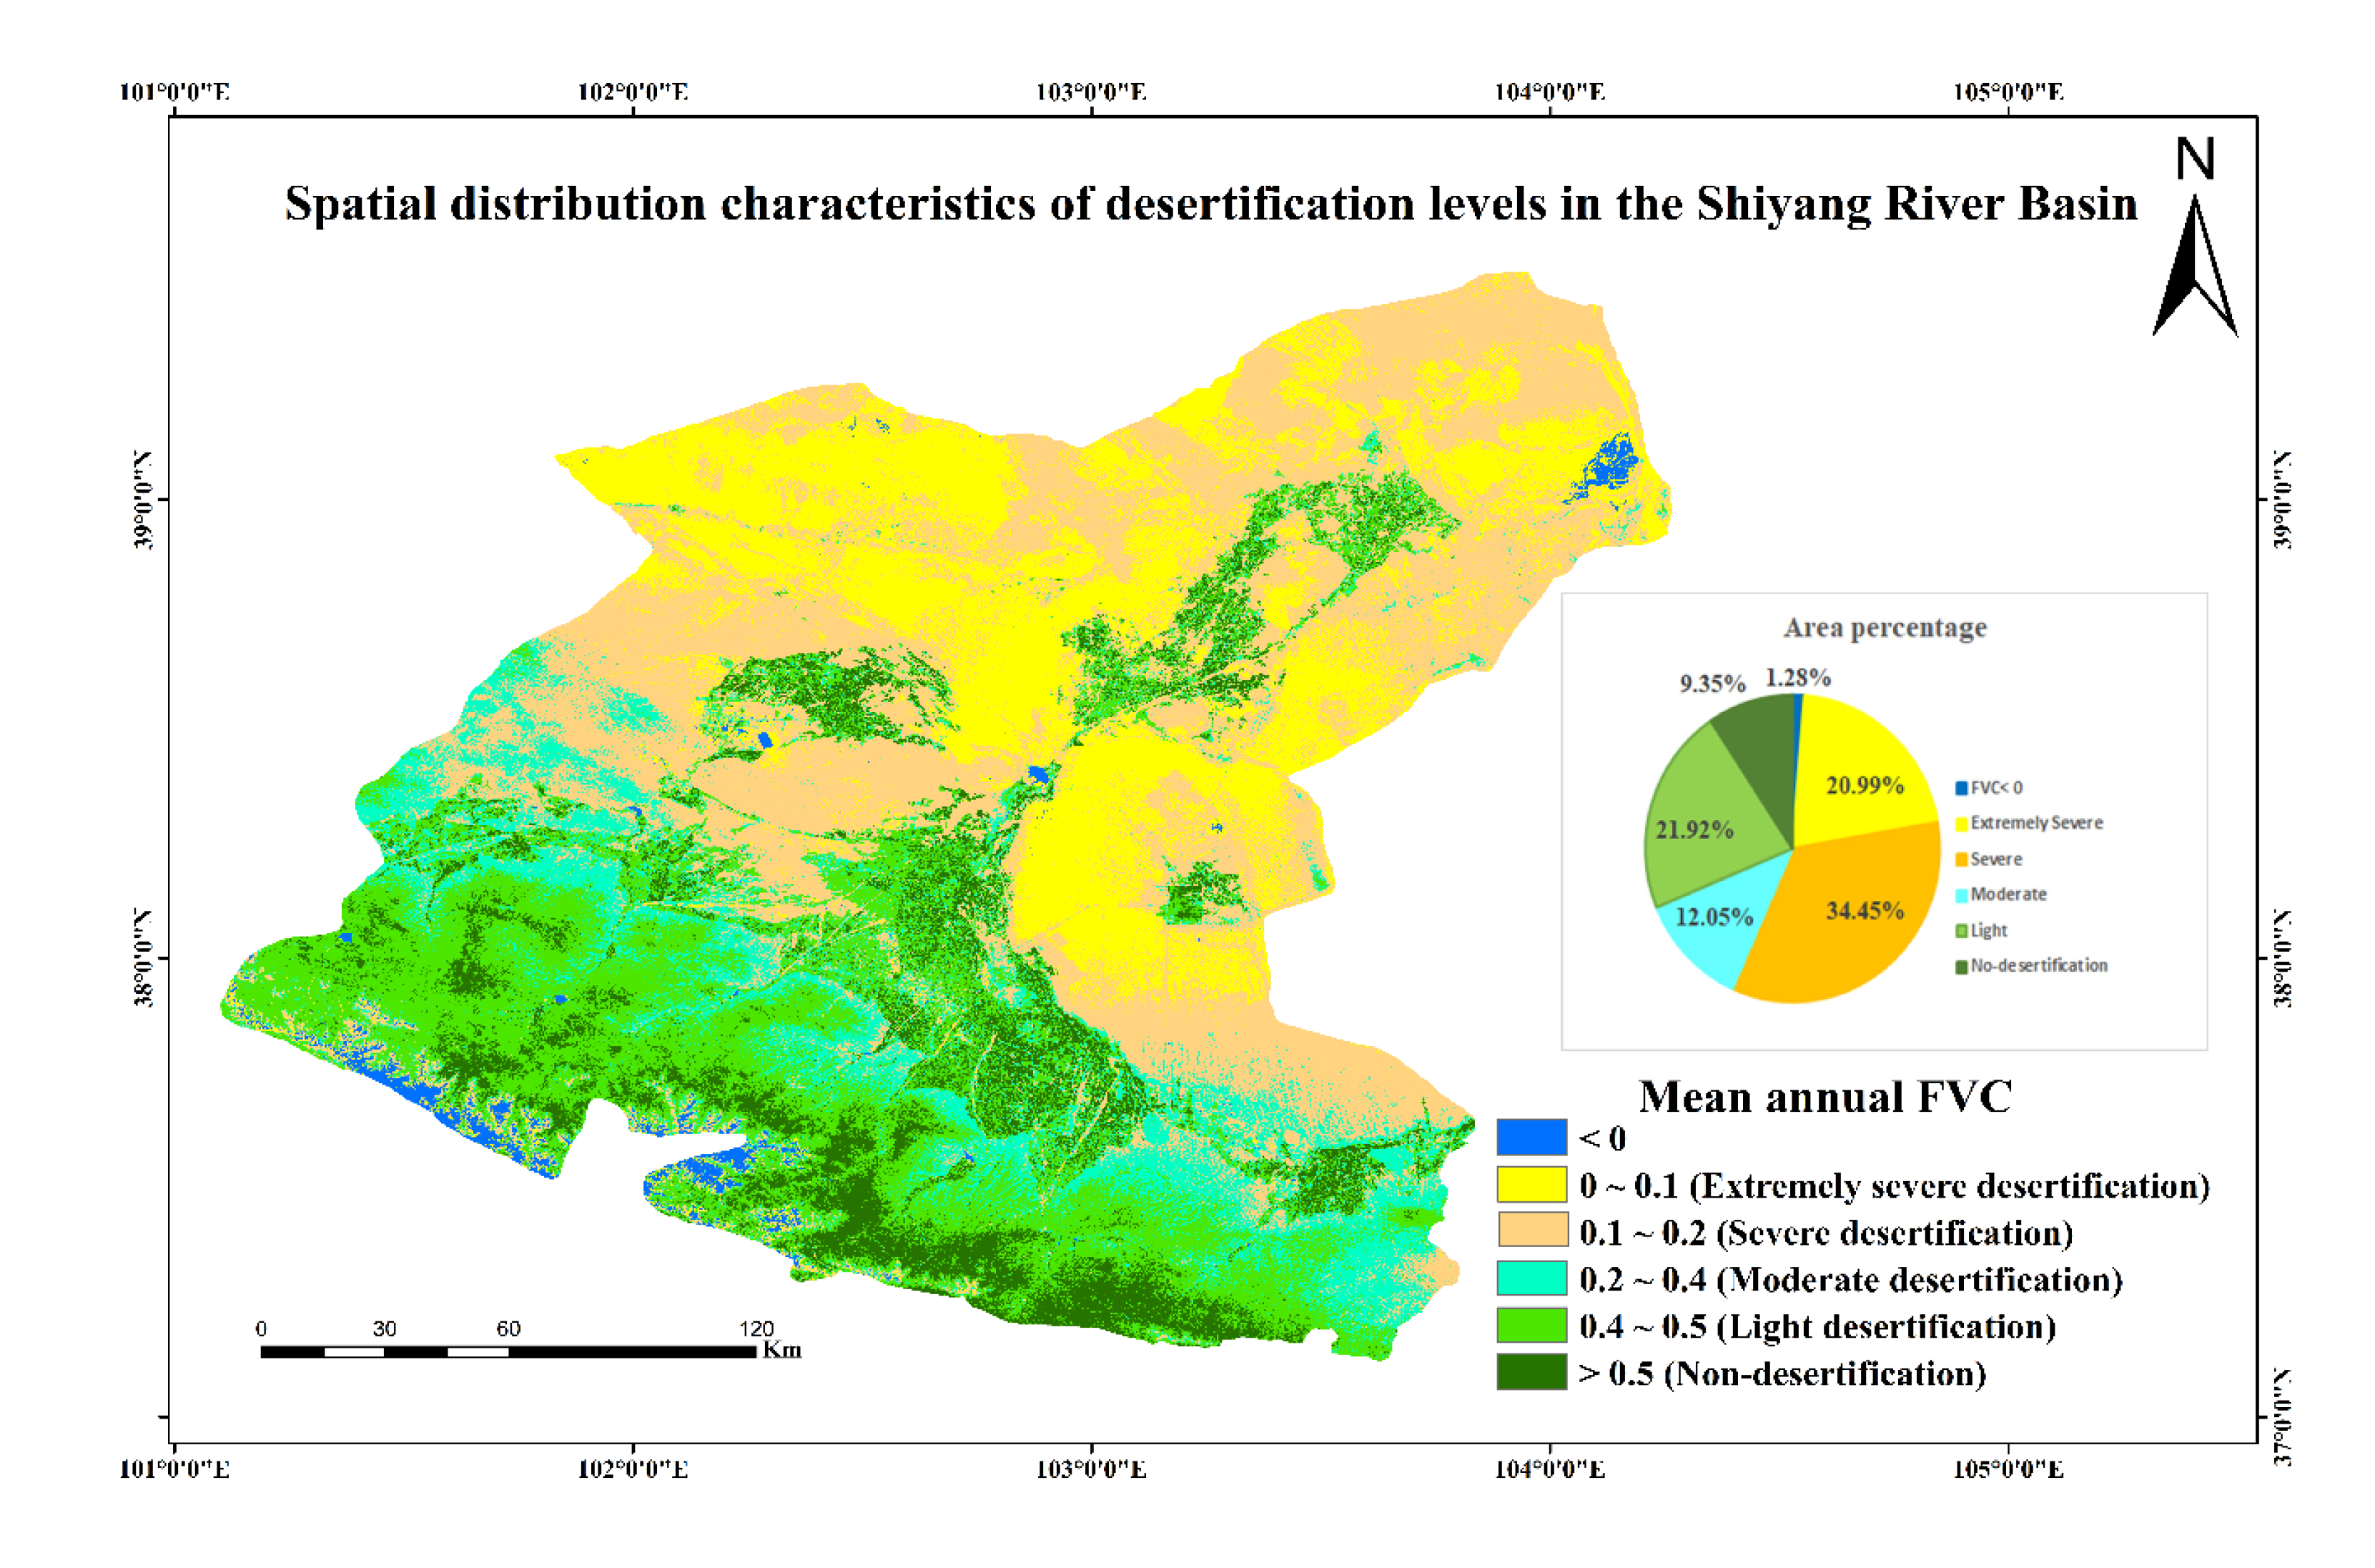
| Intensity | FVC Range | Surface feature characteristics |
| No desertification | > 0.5 | Grassland, farmland, forest. |
| Slight desertification | 0.4−0.5 | Meadow, grassland, farmland |
| Moderate desertification | 02−0.4 | Less dense vegetation |
| Severe desertification | 0.1−0.2 | Patches of vegetation across sandy and saline lands |
| Very severe degraded | < 0.1 | Shifting sand, sandy gravy land, salt scald, and bare lands |
| Wind.V | B.water | Temp | ST | SS | Prec | LC.dyn | Elv | |
|---|---|---|---|---|---|---|---|---|
| B.water | 0.1517 | |||||||
| Temp | 0.1143 | 0.1455 | ||||||
| ST | 0.265 | 0.2513 | 0.2687 | |||||
| SS | 0.1881 | 0.1924 | 0.1586 | 0.2962 | ||||
| Prec | 0.223 | 0.2113 | 0.2248 | 0.2748 | 0.2431 | |||
| LC.dyn | 0.0776 | 0.1126 | 0.038 | 0.234 | 0.1208 | 0.1544 | ||
| Elv | 0.2981 | 0.2889 | 0.3116 | 0.3204 | 0.3513 | 0.3232 | 0.2759 | |
| B.Roads | 0.0859 | 0.1115 | 0.0484 | 0.235 | 0.1254 | 0.1654 | 0.0186 | 0.2762 |
Disclaimer/Publisher’s Note: The statements, opinions and data contained in all publications are solely those of the individual author(s) and contributor(s) and not of MDPI and/or the editor(s). MDPI and/or the editor(s) disclaim responsibility for any injury to people or property resulting from any ideas, methods, instructions or products referred to in the content. |
© 2023 by the authors. Licensee MDPI, Basel, Switzerland. This article is an open access article distributed under the terms and conditions of the Creative Commons Attribution (CC BY) license (http://creativecommons.org/licenses/by/4.0/).


