1. Introduction
Over the past 50 years, obesity has become an international public health problem [
1], which is associated with increased morbidity and mortality of several diseases, especially cardiovascular diseases and diabetes [2-3]. Therefore, plenty of studies are focused on investigating safe and effective treatments to prevent obesity, and the existing anti-obese interventions mainly targeted the induction of browning of adipocytes to enhance metabolism [4-7] and the repolarization of macrophages in adipose tissue to alleviate chronic inflammation [
8].
Succinate, an intermediate of the tricarboxylic acid (TCA) cycle, was reported to participate in the polarization of the pro-inflammatory M1 macrophages [
9], which is involved in the obese physiology [
10]. Meanwhile, succinate was found to improve obese or diabetic physiology in animal studies [
11] by inducing adipocyte browning [
12]. However, the direct evidence for the anti-obesity activity of succinate was very few, and the exiting weight-losing activity of succinate were based on a short-time of high-fat diet (HFD) feeding (4 weeks) [
12]. Furthermore, when established the correlation of succinate levels with metabolic syndrome, some studies reported an elevated circulating level of succinate both in obese and/or diabetic human [13-14] and rodents [15-17], and the improvements in glucose control and inflammatory profile in obese mice are related to the depletion of circulating succinate [
18]. Meanwhile, there were also studies reported an unchanged level of succinate in human with metabolic dysfunction [19-20], leading to the uncertainty in the application of succinate in anti-obesity therapies.
Here in this study, we evaluated the effect of succinate on adipose tissue deposition and obesity-related metabolic dysfunction in obese mice. As a food additive and dietary supplement, mice were fed with HFD during the whole experiment to exclude the effect of decreased calorie intake due to diet change. Succinate levels in serum and adipose tissue were also measured by metabolomics. This study would provide a direct evidence for the efficiency of succinate supplementation in anti-obesity therapy.
2. Materials and Methods
2.1. Animals and Experimental Design
All animal protocols were reviewed and approved by the Institutional Animal Care and Ethics Committee of the China Agricultural University (AW61212202-5-1). Three-week-old male C57BL/6 J mice were purchased from SPF (Beijing) Biotechnology Co. Ltd and allowed 1 week for acclimatization. From four weeks old, mice were fed with a HFD (60% energy from fat, D12492, Research Diets, Beijing, China) for 21 weeks. Then mice were divided into two groups: fed with HFD only (HFD group, n=6), HFD combined with sodium succinate (224731-500G, Sigma-Aldrich, Beijing, China) (HFD-SA group, n=7) for 11 weeks. Succinate was added in drinking water at the final concentration of 1.5% (m/v) and succinate-containing drinking water was freshly prepared and replaced every two days. All the mice were housed in a temperature-controlled (23 °C) room on a 12-h light-dark cycle. Weight gain, food intake and water intake were monitored weekly. At the end of treatment, mice were euthanized by carbon dioxide inhalation and cervical dislocation. Blood samples, epididymal white adipose tissue (eWAT), perirenal white adipose tissue (pWAT), inguinal white adipose tissue (ingWAT), axilla white adipose tissue (aWAT), brown adipose tissue (BAT), and liver were rapidly collected from individual mice.
2.2. Intraperitoneal Glucose Tolerance Test (IPGTT)
Mice were fasted for 14 hours and then injected intrateritoneally with 1 g/kg glucose solution. Blood glucose at time points of 0, 15, 30, 60, 90, 120 and 180 min were measured from one drop of tail blood using a glucometer (Roche, ACCU-CHEK Active, Germany). The correct way to assess the area of a GTT curve is to measure the area under the curve (AUC) and subtract the area under the baseline [
21].
2.3. Body Temperature and Cold Exposure
Mice were individually housed in precooled cages and exposed to cold temperature (4°C) for 6 hours with free access to food and water. Body surface temperature at room temperature and after cold exposure were taken individually by Infrared camera (FLIR T420, FLIR Systems AB, Sweden).
2.4. Metabolic Phenotyping
Whole-body energy metabolism of mice were analyzed using the metabolic chamber (Panlab, Oxylet Pro, Panlab, Spain). Each mouse was housed individually and acclimated in the metabolic chambers and acclimated for 48 hours with mock injection procedures to minimize contribution of stress to the metabolic phenotype. Data were collected continuously for 48 hours with 12-hours light and 12-hours dark. Measurements were taken every 5 min. The following parameters were monitored continuously oxygen consumption (VO
2), carbon dioxide production (VCO
2), respiratory quotient (RQ), and energy expenditure (EE) by the monitoring system [
22].
2.5. Histological Analysis
Tissues were fixed at room temperature in 4% paraformaldehyde and then embedded in paraffin, sectioned and mounted on glass slides. Tissue sections (3 μm) were deparaffinized, rehydrated, and used for hematoxylin and eosin (Eosin Y Stain Solution, Solarbio, G1100, Beijing, China; Mayer’s Hematoxylin Stain Solution, G1080, Beijing, China) staining. At least three images per section, two sections from each individual mouse and three mice in each group were analyzed. Digital images were collected with the upright microscopes Leica DM6 B equipped with a 10× or 20× objective lens. The quantitative analysis of adipocyte diameters were quantitated using Image-Pro Plus software 6.0 (Media Cybernetics, USA).
2.6. Oil Red O Staining
Lipid accumulation in the liver tissues was analyzed by Oil Red O staining. Frozen sections (10 μm) of liver tissues were fixed in 4% paraformaldehyde and washed in water. Then the slides were immersed in 60% isopropanol and incubated in Oil Red O solution (saturated Oil Red O solution diluted 3:2 into distilled water, Solarbio, G1260, Beijing, China) at room temperature for 10 mins. The slides were washed in 60% isopropanol twice and counterstained with Mayer’s hematoxylin stain solution (Solarbio, G1080, Beijing, China) for 30 seconds.
2.7. Western Blotting
Samples were lysed with RIPA (Beyotime Biotechnology, P0013B, Shanghai, China) supplemented with a cocktail of protease inhibitors (Solarbio, A8260, Beijing, China). Homogenates were centrifuged at 16,000g for 10 min at 4 °C, and the supernatants were used for subsequent analyses. Protein concentration was determined using the bicinchoninic acid assay (Pierce). Protein lysates were subjected to SDS–PAGE and then transferred to PVDF membranes (Millipore, Bedford, MA, USA). Membranes were incubated overnight with primary antibodies at 4 °C. For secondary antibody incubation, anti rabbit HRP (Promega) was diluted in TBS-T containing 5% milk. Results were visualized with enhanced chemiluminescence (ECL) western blotting substrates (Pierce). The intensities of the target proteins were normalized according to the β–tubulin (Immunoway, #YM3030, 1:10000) content. The primary antibodies are anti-perilipin-1 (Plin1, Cell Signaling Technology, #9349, 1:2000), hormone sensitive lipase (HSL, Cell Signaling Technology, #4107, 1:4000), phosphor-HSL (Ser660) (Cell Signaling Technology, #45804, 1:2000), Akt (Cell Signaling Technology, #9272, 1:4000), phosphor-Akt (Ser473) (Cell Signaling Technology, #4060, 1:2000) and PPARγ (Cell Signaling Technology, #2443, 1:1000).
2.8. Gene Expression Analysis
Total RNA was extracted from eWAT, ingWAT, BAT and liver using TRIzol reagent (Invitrogen) according to the manufacturer's instructions. Total RNA (1500) ng was reverse-transcribed to cDNA using an All-In-One 5X RT Mastermix (Abm, G492, Beijing, China). Gene expression was analyzed by quantitative real-time PCR (qPCR) using SYBR Green (Takara, RR82LR, Beijing, China) and normalized to GADPH. The primer pair sequences were as follows. GADPH: forward, 5′-TGTGTCCGTCGTGGATCTGA-3′; reverse, 5′-CCTGCTTCACCACCTTCTTGA-3′; Adrb3: forward, 5′-GGCCCTCTCTAGTTCCCAG-3′; reverse, 5′-TAGCCATCAAACCTGTTGAGC-3′; Atgl: forward, 5′-CTGAGAATCACCATTCCCACATC-3′; reverse, 5′-CACAGCATGTAAGGGGGAGA-3′; Hsl: forward, 5′-TCCTCAGAGACCTCCGACTG-3′; reverse, 5′-ACACACTCCTGCGCATAGAC-3′; Plin1: forward, 5′-CAAGCACCTCTGACAAGGTTC-3′; reverse, 5′-GTTGGCGGCATATTCTGCTG-3′; Pparγ: forward, 5′-GGAAGACCACTCGCATTCCTT-3′; reverse, 5′-TCGCACTTTGGTATTCTTGGAG-3′; Cebpa: forward, 5′-CAAGAACAGCAACGAGTACCG-3′; reverse, 5′-GTCACTGGTCAACTCCAGCAC-3′; Dgat2: forward, 5′-GCGCTACTTCCGAGACTACTT-3′; reverse, 5′-GGGCCTTATGCCAGGAAACT-3′.
2.9. Biochemical Analysis for Liver Samples
Triglyceride and non-esterified fatty acid (NEFA) contents in eWAT, ingWAT and liver were determined using commercially available colorimetric kits (Nanjing Jiancheng Bioengineering Institute, A110-1-1, Beijing, China; Boxbio, AKFA008M, Beijing, China), respectively.
2.10. Targeted Energy Metabolomics
Standards of substances related to energy metabolism was weighed, dissolved in 50% methanol solution, mixed and then diluted to different gradients using methanol-acetonitrile-water (4: 4: 2). 50 mg ingWAT samples or 100 μL serum were grinded at -10 ℃, then ultrasonicated at 4 ℃ for 30 min after adding the extraction solution (400 μL methanol: acetonitrile: water = 4: 4: 2 for ingWAT and 200 μL 80% methanol for serum sample). Then the solutions were centrifugated for 15 min at 13000×g at 4℃. 100 μL of the supernatant were added with 10 μL isotope mixing solution (Succinic acid-D4 and Tryptophan-D5, 10 μg/mL) and injected into a liquid chromatography tandem mass spectrometry (LC-MS/MS) system for further analysis. LC-MS/MS analyses were performed using the ExionLC™ AD system (SCIEX, Framingham, MA, USA) coupled with the QTRAP® 6500+ mass spectrometer (SCIEX). Samples were injected onto the Acquity UPLC BEH Amide column (2.1×100 mm, 1.7 µm) under 20 min linear gradient at a flow rate of 0.4 mL·min−1 for the negative polarity mode. The injection volume was 3 μL. The mobile phases were eluent A (85% acetonitrile-20 mM ammonium acetate, pH=9) and eluent B (water-20 mM ammonium acetate, pH=9). The solvent gradient was set as follows: 5% B-30%B, 4 min; 30% B-47% B, 4 min; 47% B, 2 min; 47% B-5% B, 10.1 min; 5% B, 5 min. The SCIEX QTRAP® 6500+ mass spectrometer was operated in negative mode with a curtain gas of 35 PSI, medium-collision gas, an ion spray voltage of -4500 V, temperature of 550 °C, and both of ion source gas1 and ion source gas2 at 50 PSI.
In Sciex quantitative software OS, default parameters were used to automatically identify and integrate each ion fragment, and manual inspection was assisted. The ratio of mass spectrum peak area to internal standard peak area of analyte was taken as the ordinate and the concentration of analyte as the abscissa to draw the linear regression standard curve. Calculation of sample concentration: the ratio of mass spectrum peak area to internal standard peak area of sample analyte was substituted into linear equation to calculate the concentration result [23, 24].
2.11. Statistical Analysis
All data are expressed as the mean ± s.e.m. P values were calculated using Student’s t-test for pairwise comparison of variables and One-way ANOVA for multiple comparison of variables followed by Tukey’s multiple comparisons test. Significance was defined as a p-value < 0.05 (labeled with *) or 0.01 (labeled with **). For all experiments, all stated replicates are biological replicates. For in vivo studies, mice were randomly assigned to treatment groups.
4. Discussion
Adipose tissue was a dynamic organ distributed throughout the body with an almost unlimited capacity to expand during obesity [
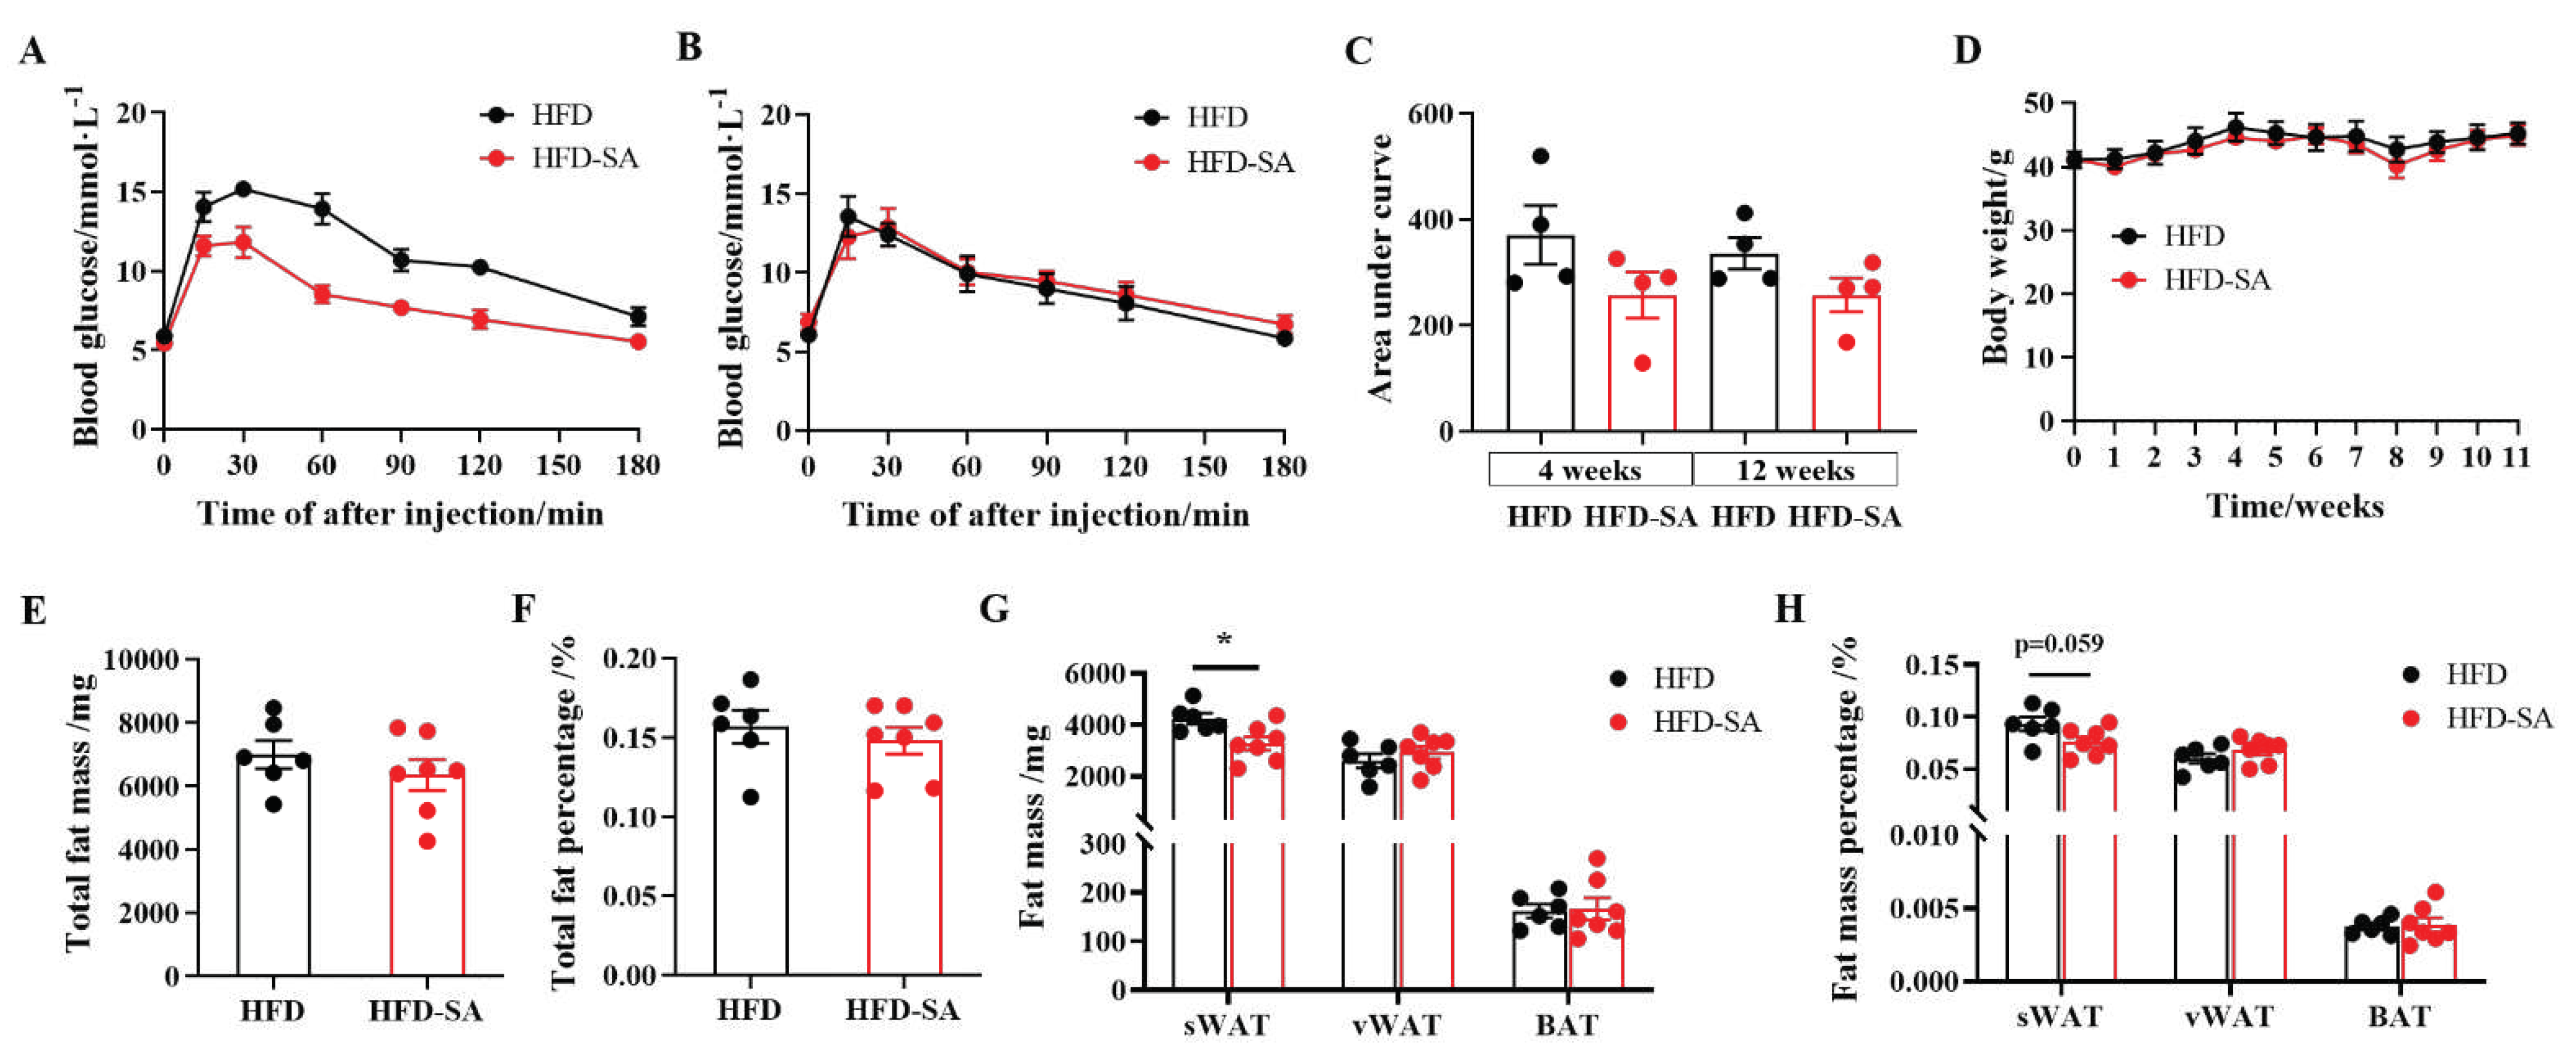
25]. Our findings suggested that succinate intervention slowed the expansion of adipose tissue in HFD-induced obesity. After an 11-week succinate drinking intervention, the total adipose tissue weight of obese mice decreased (
Figure 1E and 1F, p>0.05), especially the sWAT mass (
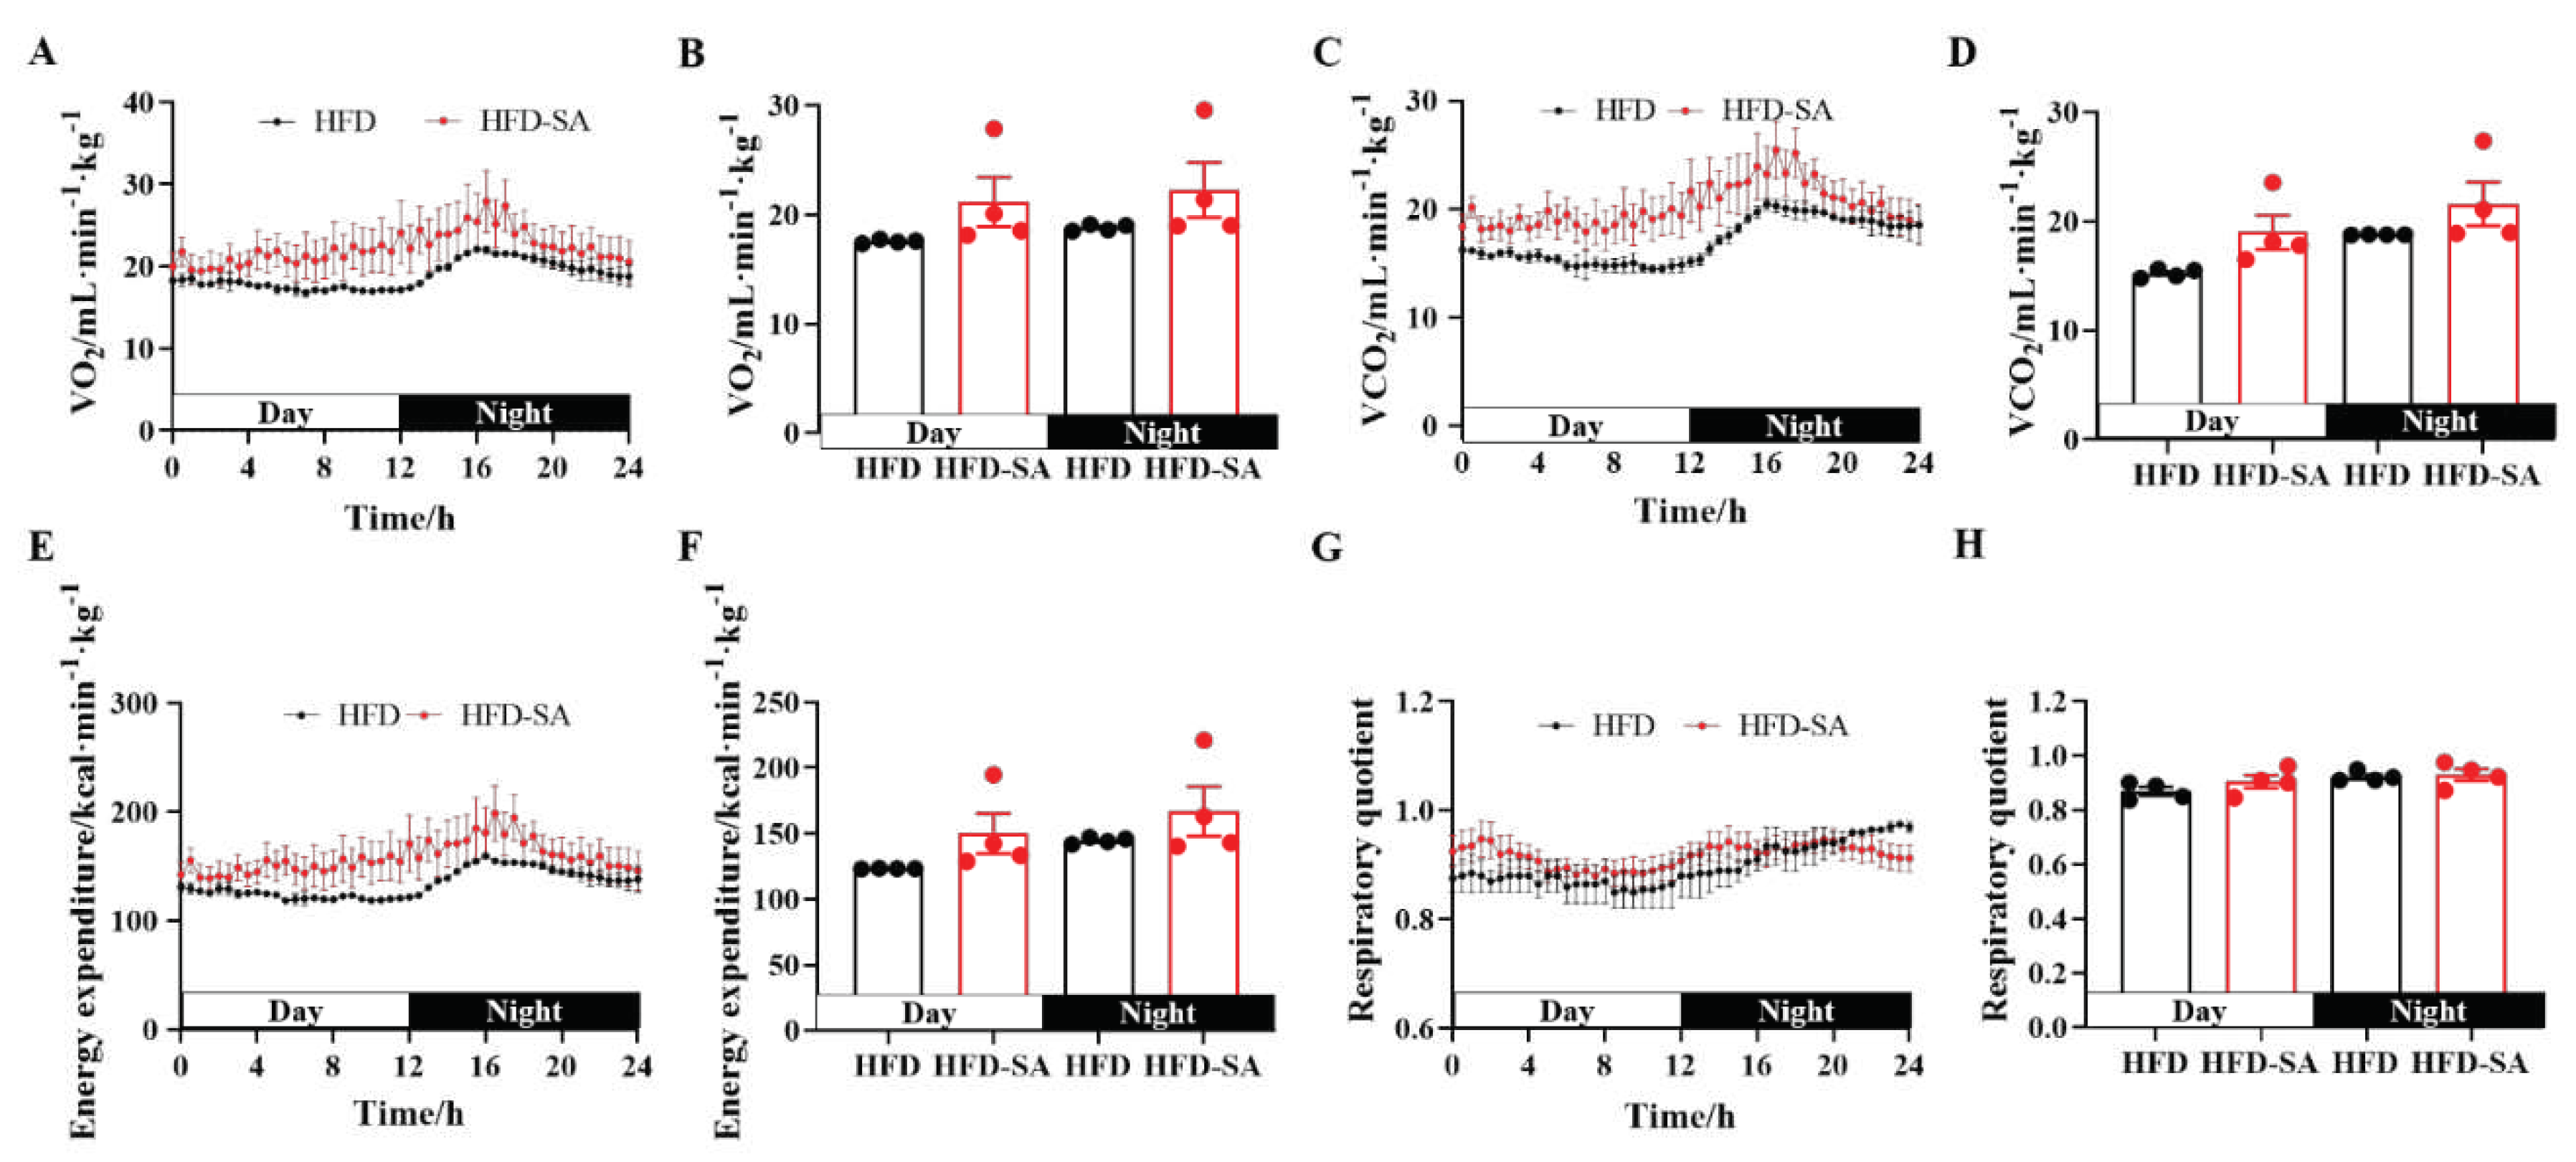
Figure 1G, p<0.05). This effect was due to an increase in energy consumption (
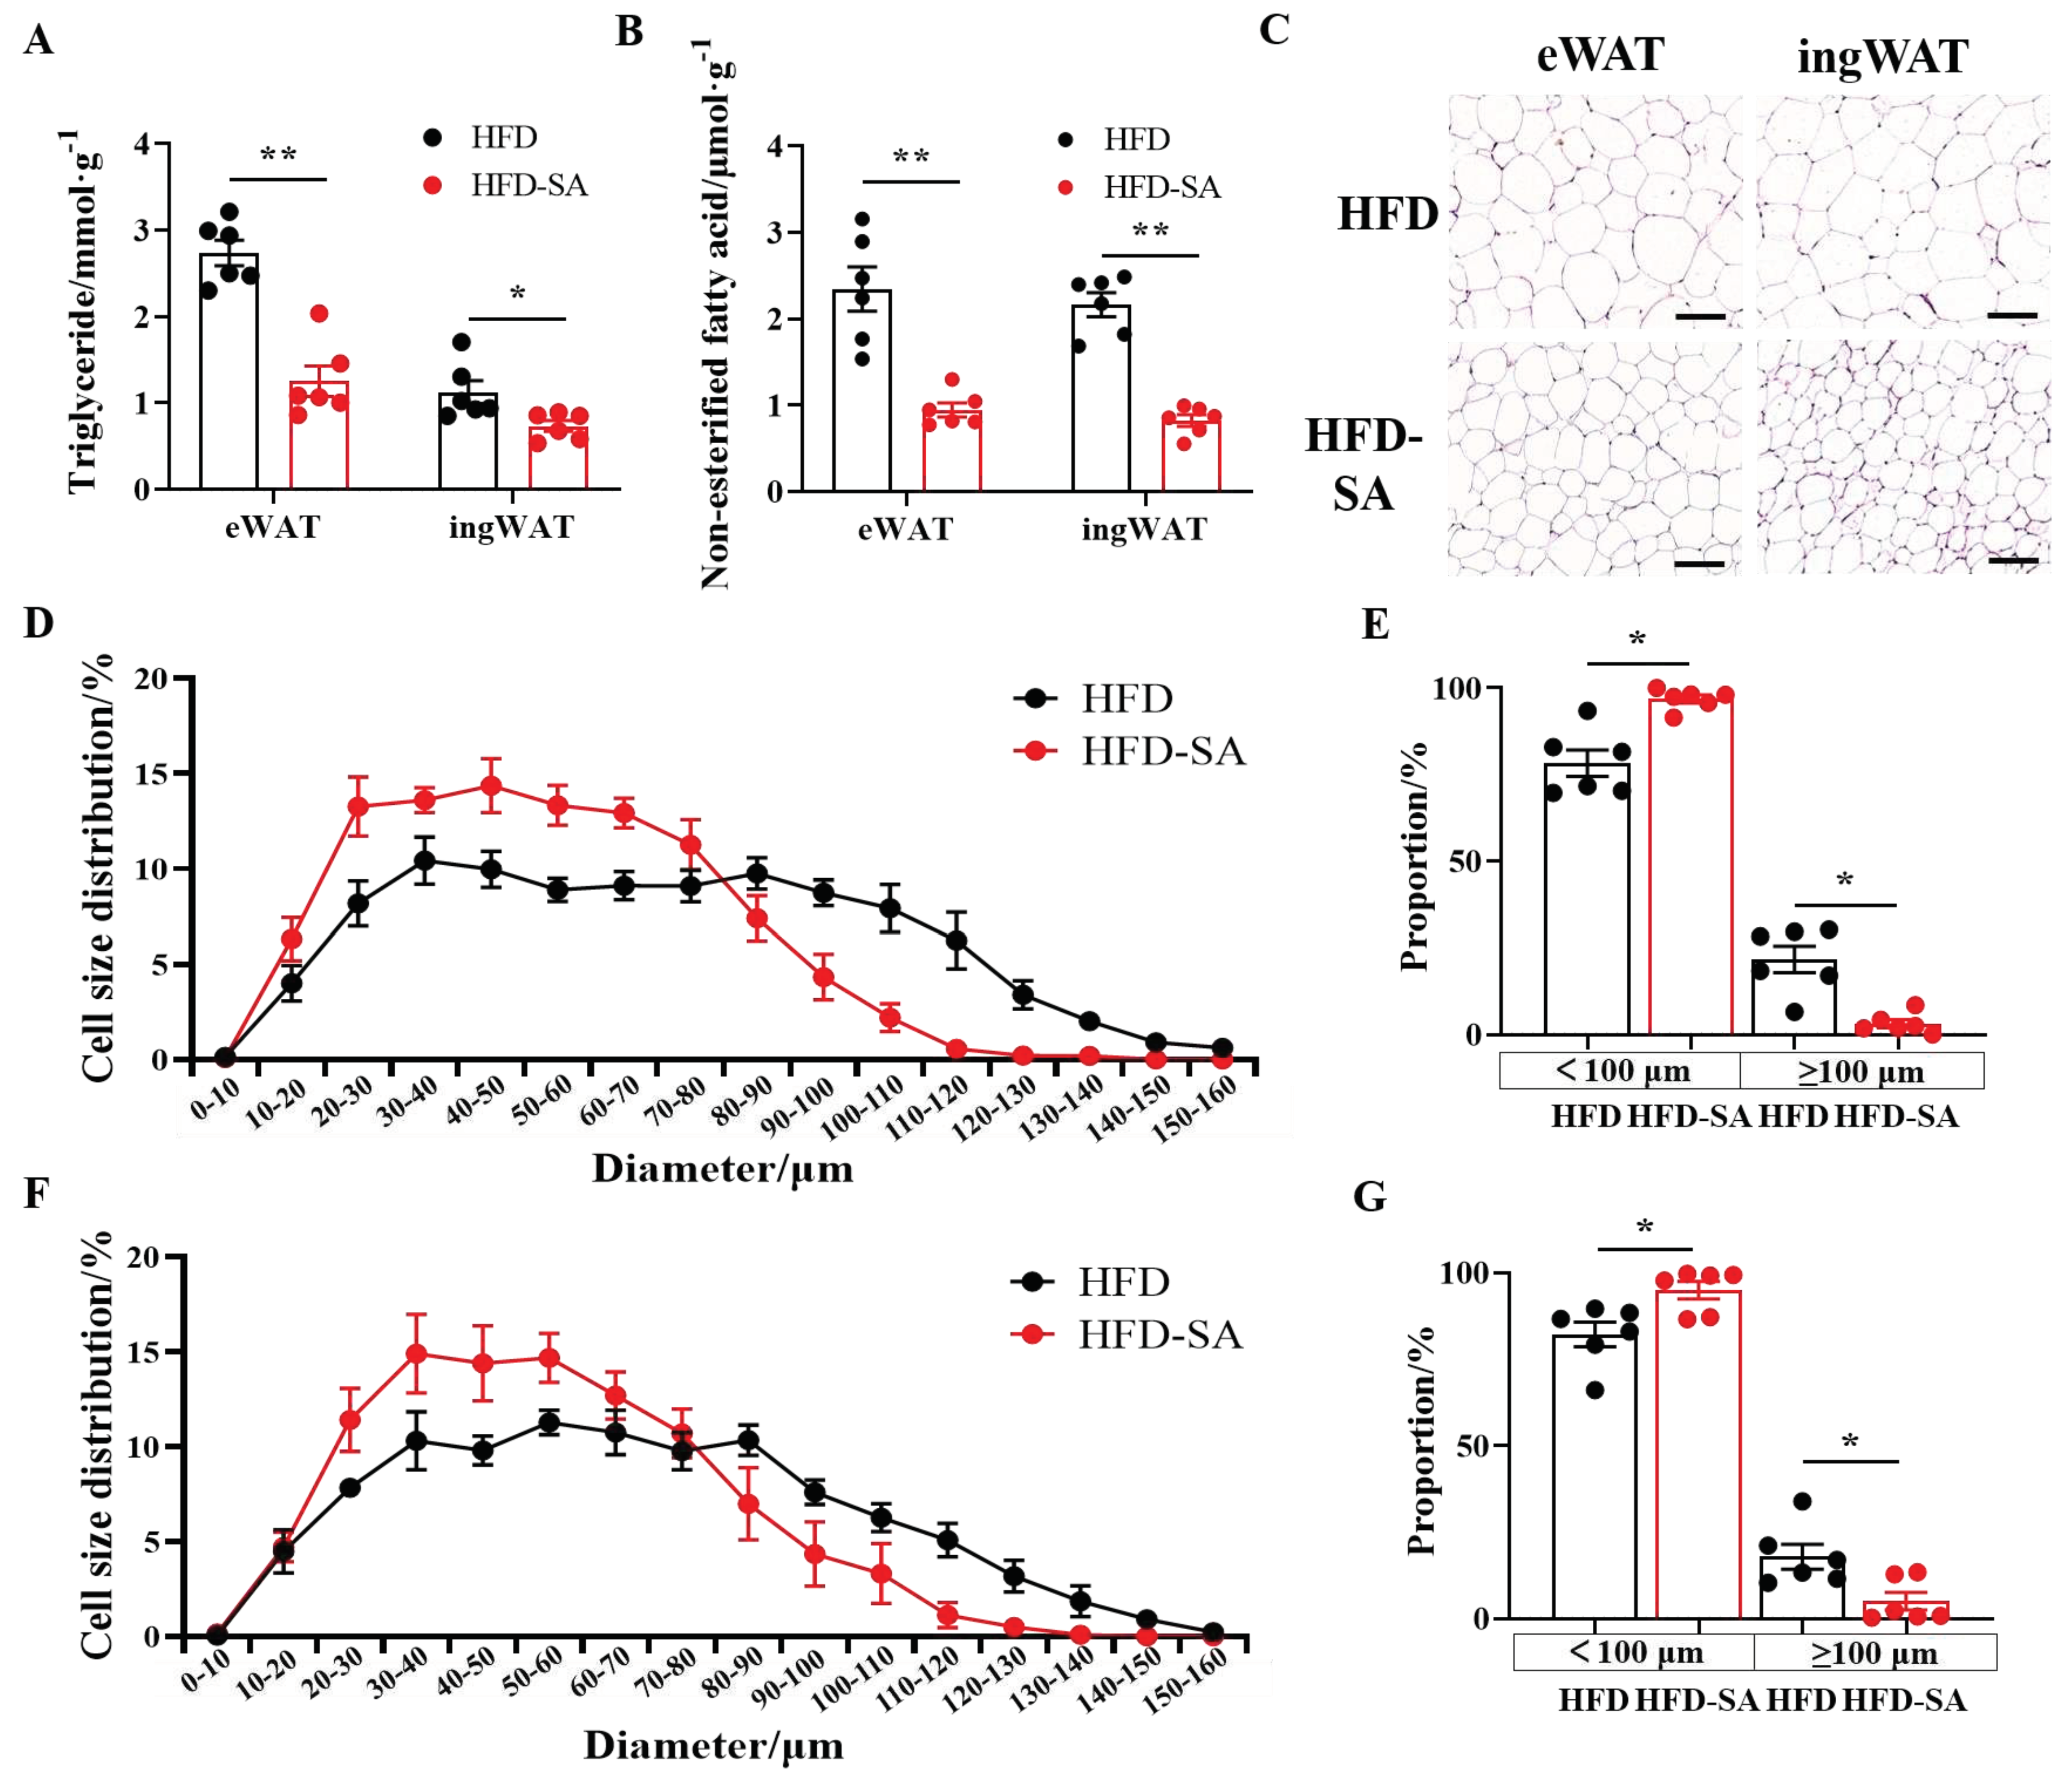
Figure 2F) and the decreased triglycerides contents in adipocytes in eWAT and ingWAT (
Figure 3A). Triglycerides are predominantly stored in adipocytes in the form of lipid droplets, which continue to grow up to 100 μm in diameter and would induce chronic inflammation for further growth [
26], therefore, the decreased size may be the reason for the improved glucose tolerance. It was found that the sizes of adipocytes decreased significantly (
Figure 3C, 3D, 3F) and the proportion of adipocytes with diameters over100 μm in eWAT and ingWAT decreased significantly after succinate supplementation (
Figure 3E, 3F). Additionally, glucose tolerance in mice supplemented with succinate was improved (
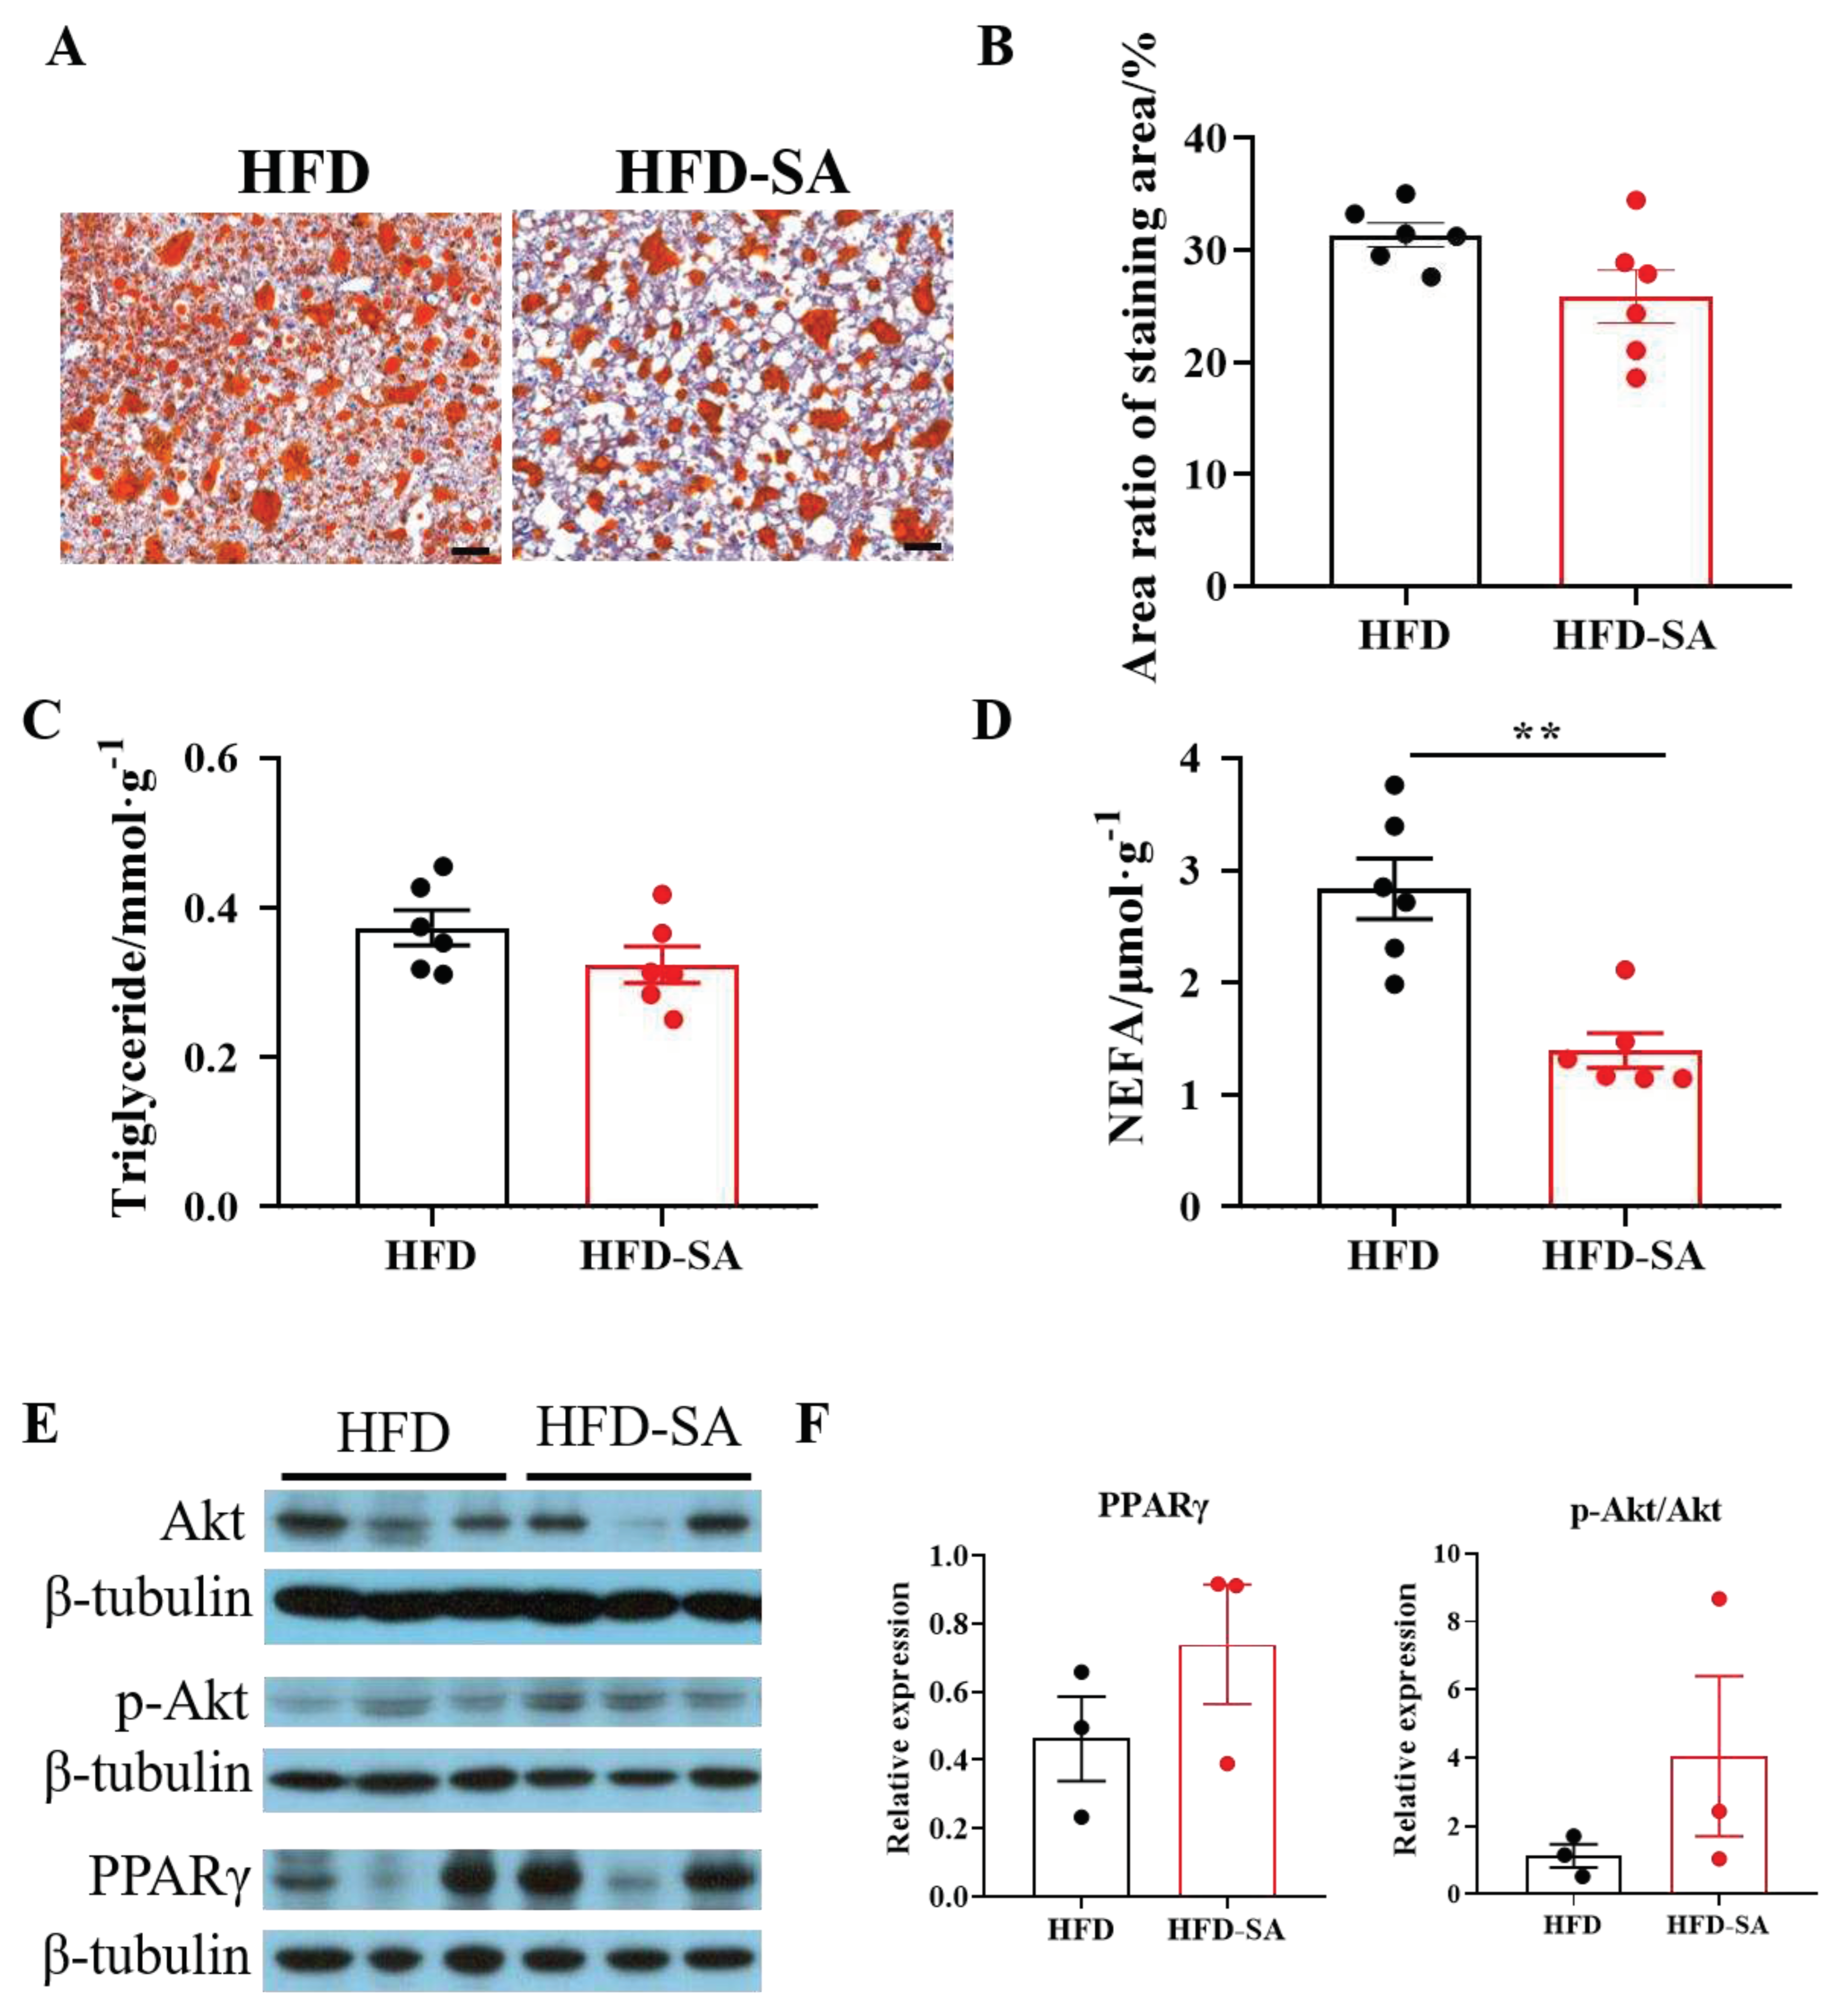
Figure 1A-C), and contents of lipid deposition in the livers were reduced (
Figure 5). This is consistent with the results by Mills et al [
12].
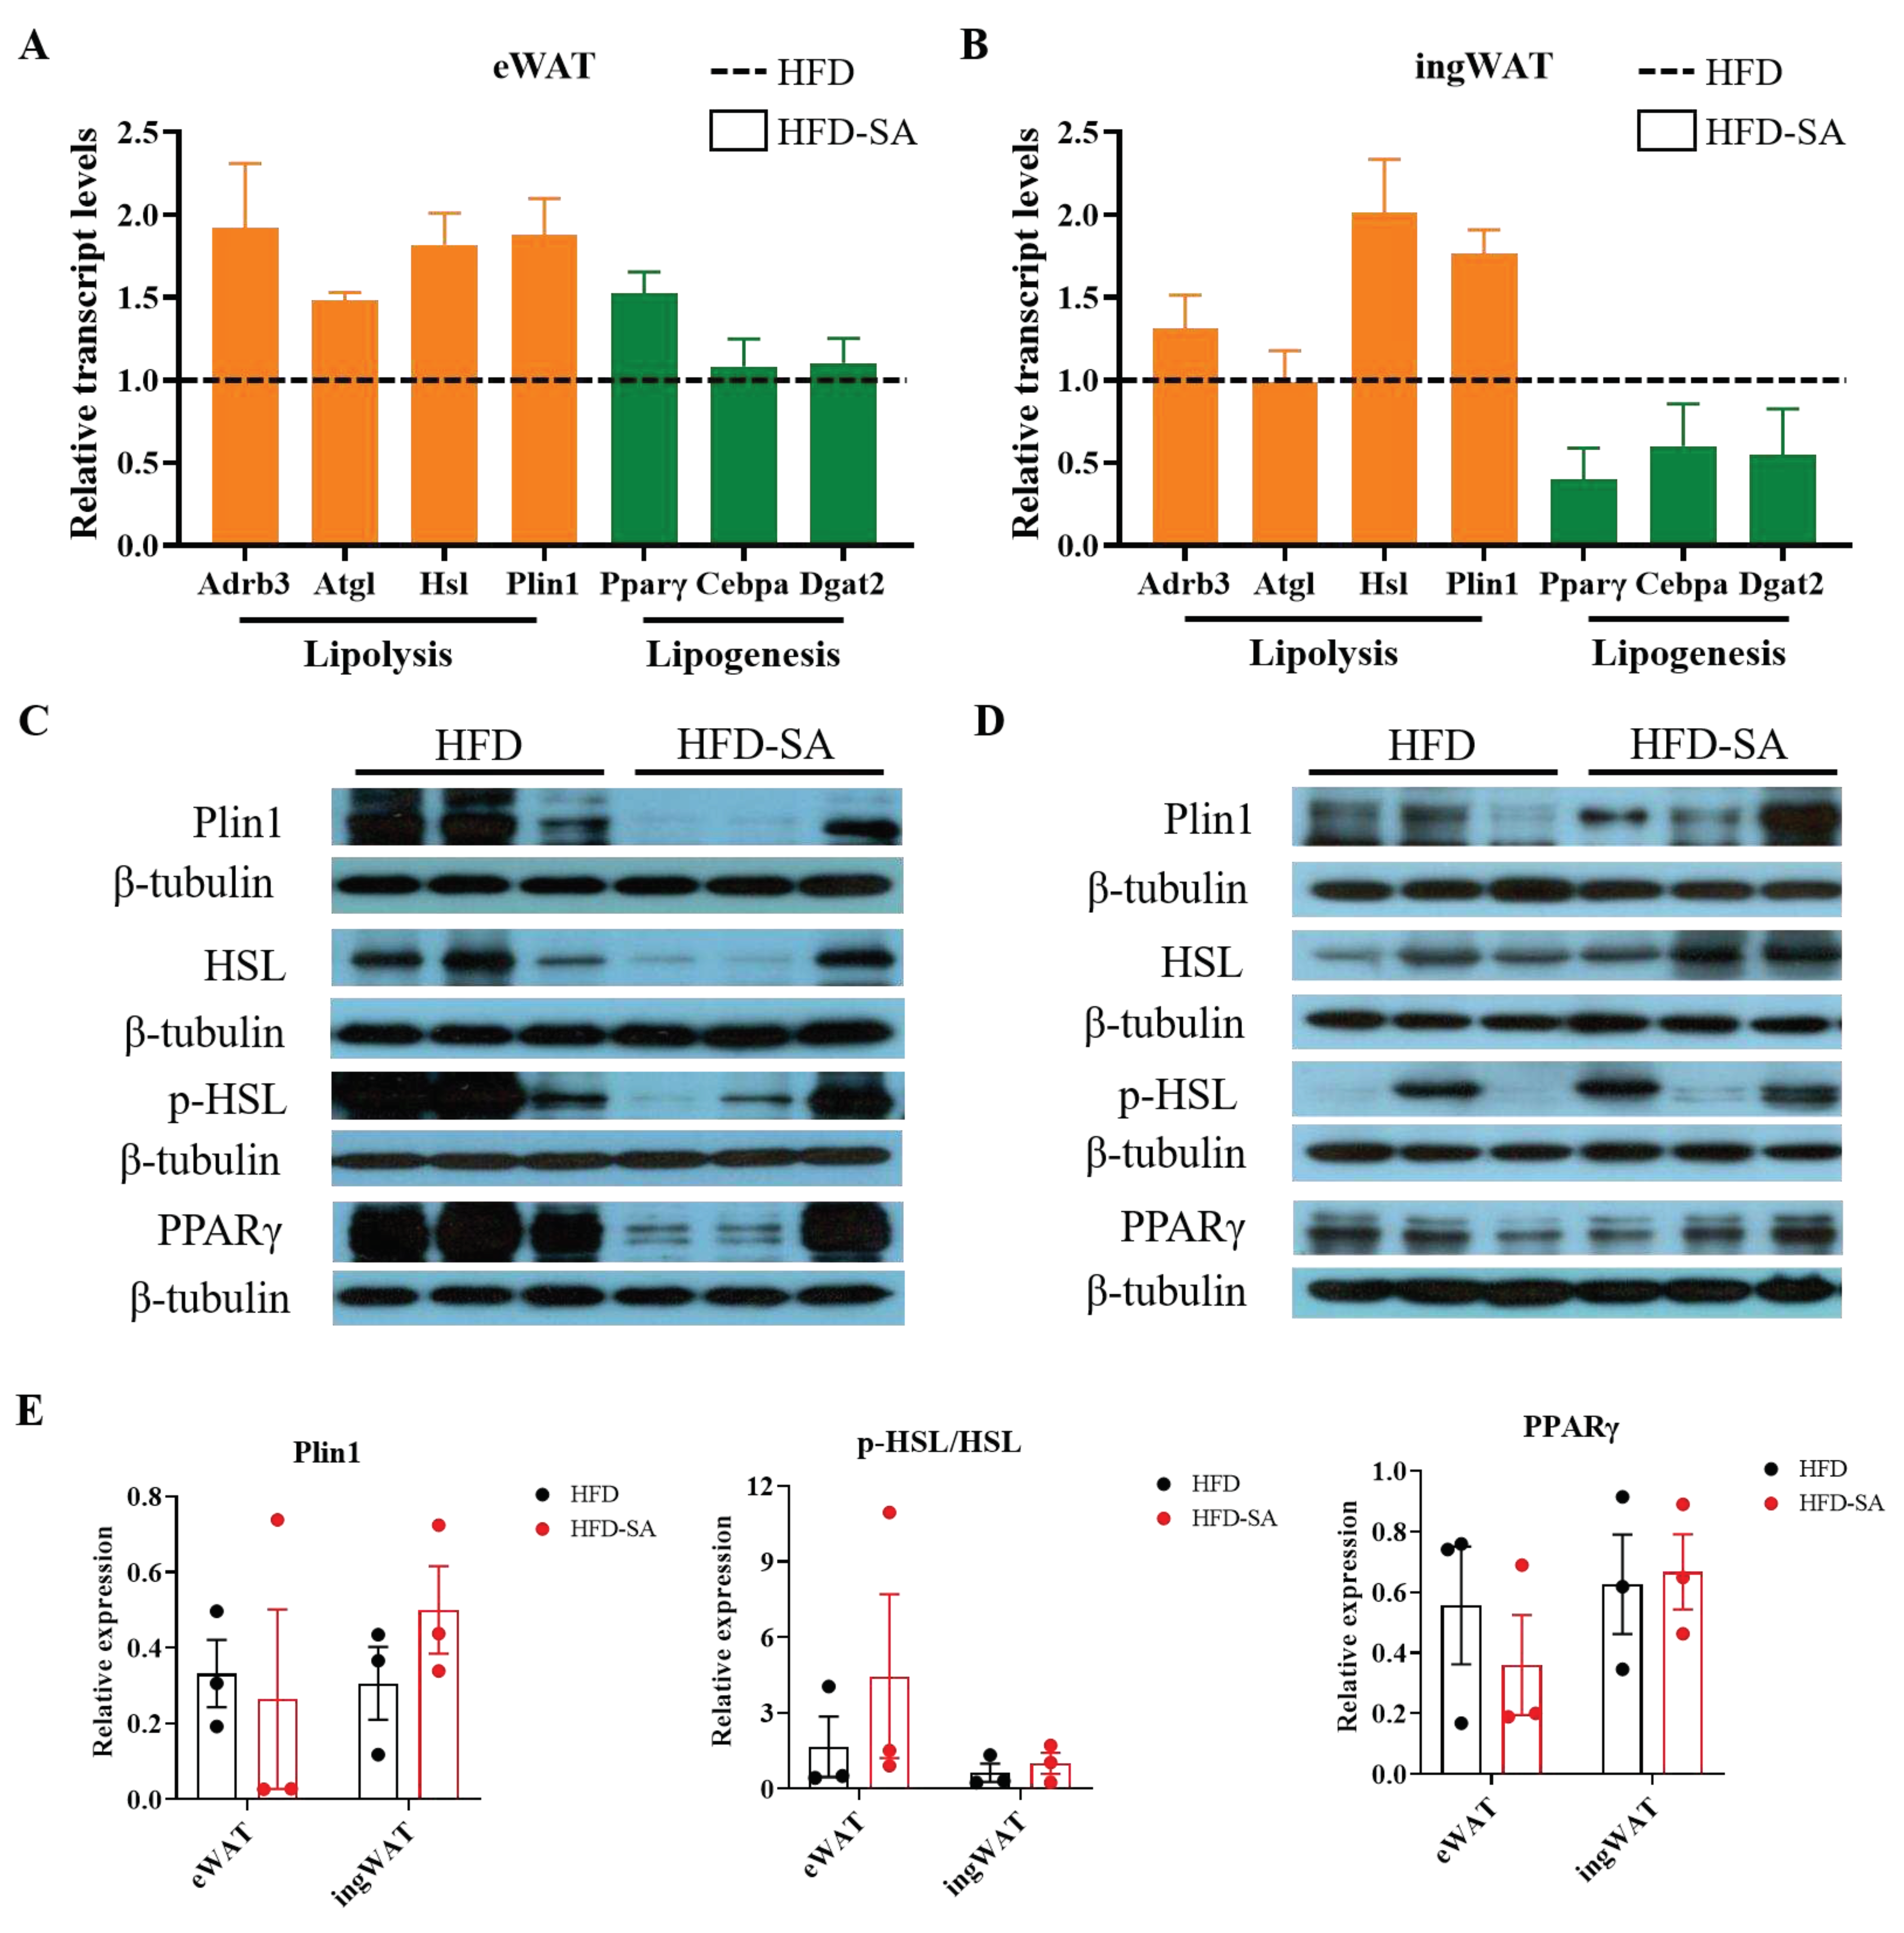
The size of adipocytes is regulated by lipolysis and lipogenesis. Among them, the lipolysis process is mainly affected by the enzymes, including adipose triglyceride lipase (ATGL) and hormone-sensitive lipase (HSL). Lipid droplet proteins also play a key role in lipolysis [
27]. Notably, qPCR results showed that both eWAT and ingWAT showed increased transcription of ATGL, HSL and Plin1 genes involved in lipolysis. In addition, the lipogenesis process is mainly affected by the peroxisome proliferators-activated receptors γ (PPARγ), CCAAT enhancer binding protein alpha (Cebpa) and diacylglycerol-O-acyltransferase 2 (DGAT2). These genes were all decreased in ingWAT (
Figure 4). This was consistent with our fat pad mass, in which sWAT showed a more significant weight loss than vWAT. Meanwhile, the results of Serena et al [
13] showed that the subcutaneous fat pool is more sensitive to succinate than visceral fat, which is also consistent with our findings. Overall, the current evidence suggested that succinate can influence lipolysis, lipogenesis and thus reduce lipid deposition through a range of modulations of different enzymes.
In recent years, researchers have also begun to focus on circulating succinate level and its relationship to body health, and current studies have shown that a number of metabolic diseases affect circulating succinate level. There were some data showing elevated circulating levels of serum succinate in obese mice, followed by a population-based experiment that found no difference in serum succinate in diabetic patients compared to controls [
19]. But in a cohort of 91 subjects stratified, plasma succinate levels were significantly higher in obese patients than in lean individuals [
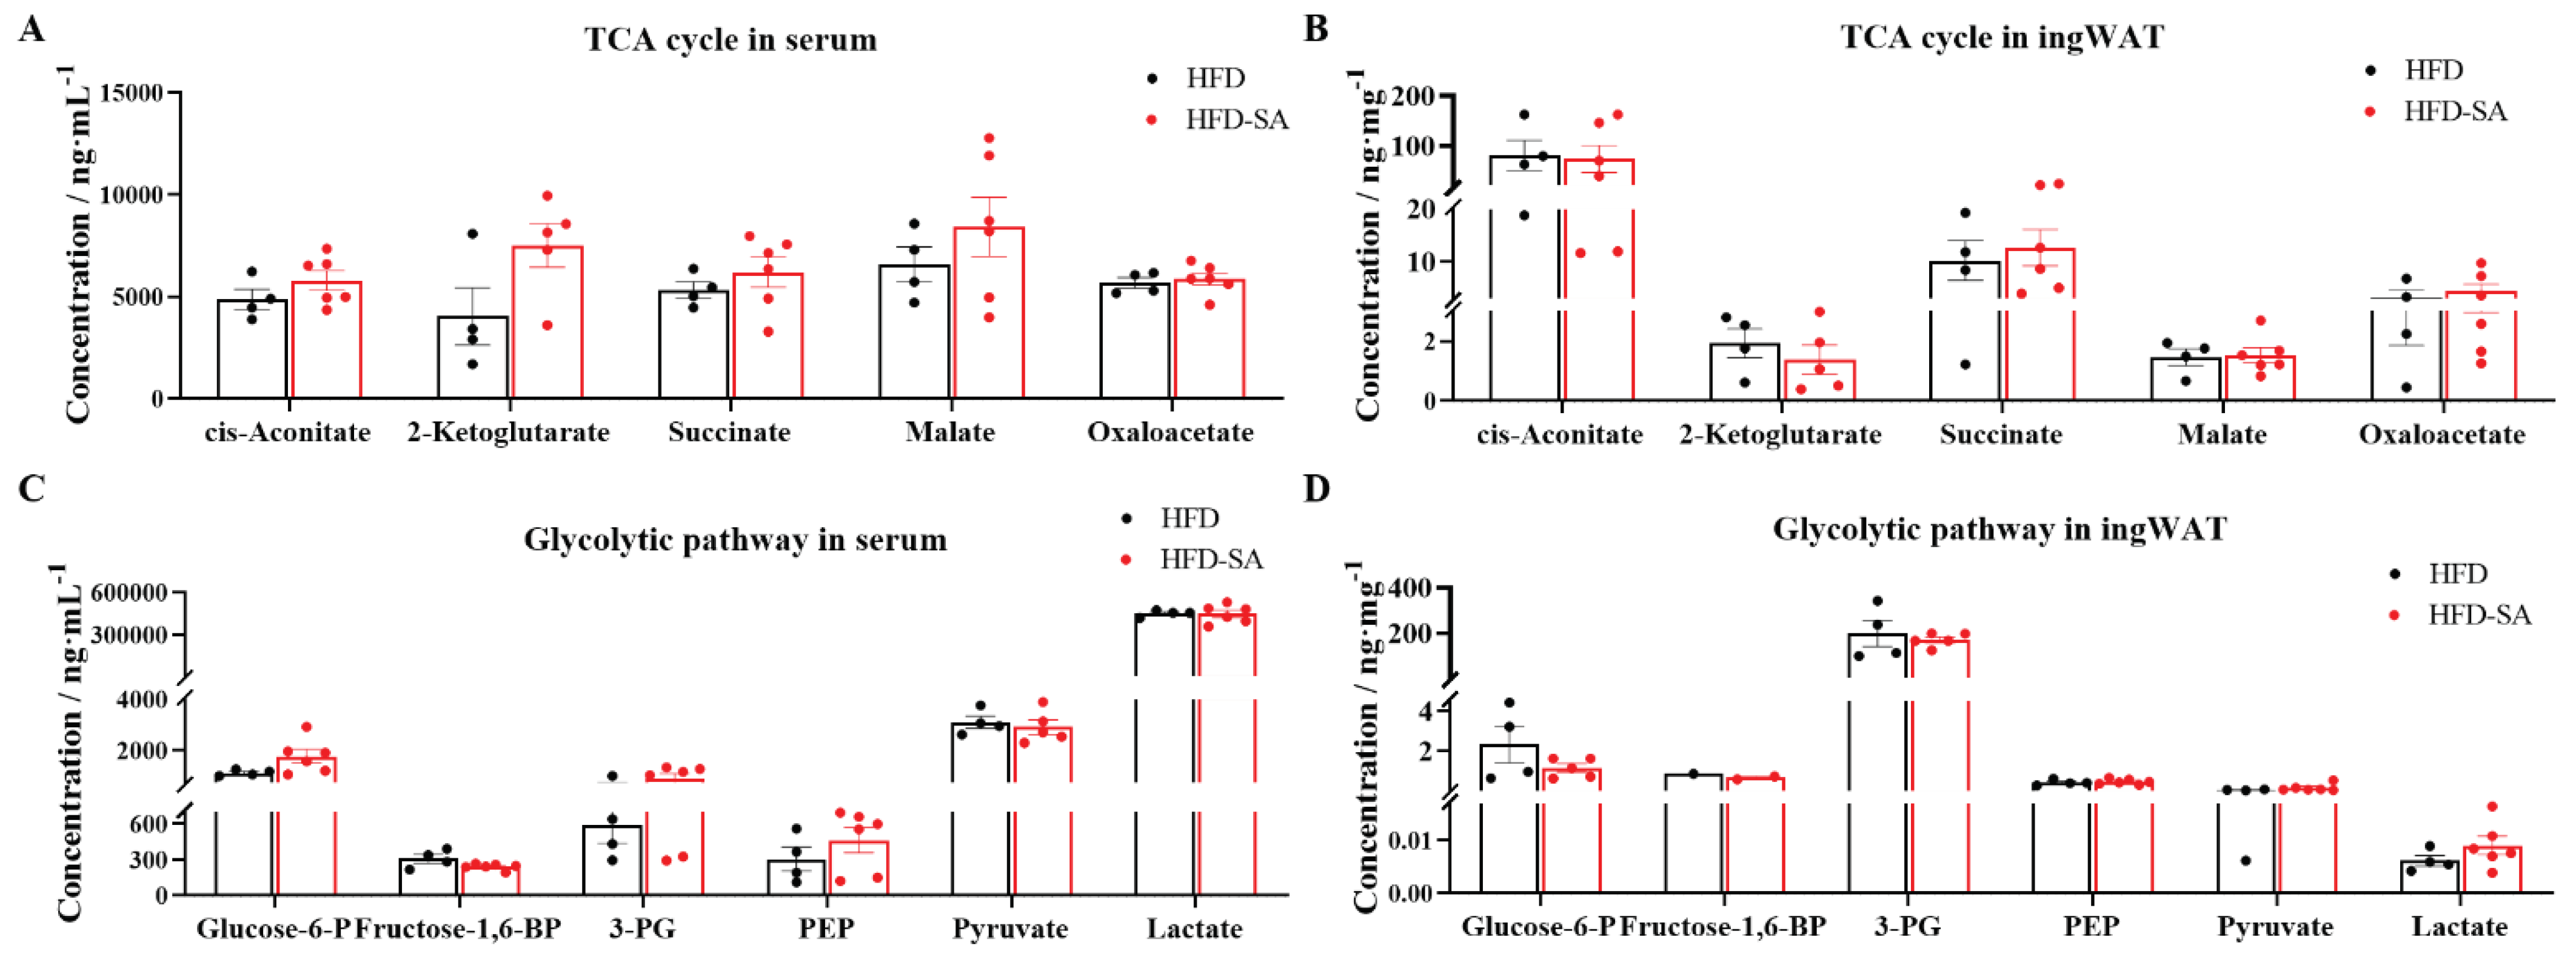
13]. Given the uncertainty in the trend of succinate levels in the organism, we performed further monitoring and analysis of its metabolomics. We found that dietary supplementation with succinate increased the content of succinate in ingWAT and serum. In a cohort of 2248 healthy middle-aged adults from the United Kingdom, circulating succinate was inversely associated with total adipose tissue [
28]. In addition, increased glycolysis is also proposed to be associated with cell differentiation and lipid synthesis in adipocytes. Glucose-6-P is converted into 6-phosphoglucono-δ-lactone by glucose-6-phosphate dehydrogenase, which is required in lipogenesis, and its increase is tightly associated with dysregulation of lipid metabolism and insulin resistance in obesity [
29]. In this study, we found that the levels of Glucose-6P, 3-PG and Pyruvate decreased after dietary supplementation of succinate. Additionally, cis-Aconitate is the key metabolites in TCA cycle and the intracellular critical node of carbon-nitrogen metabolism, and the important anti-inflammatory signals. This study found that the content of cis-Aconitate in ingWAT showed a decreasing trend after dietary supplementation with succinate [
30]. These results further indicated that supplementation of succinate can maintain normal glycolysis and TCA cycle levels and can improve inflammations stimulated by obesity with supplement of succinate.
Figure 1.
Succinate improved glucose intolerance and decreased subcutaneous adipose tissue (sWAT) deposition. Thirteen-week-old high-fat feeding induced obese C57BL/6J mice were supplemented with 0 or 1.5% (m/v) sodium succinate for 11 weeks (HFD: n = 6; HFD-SA: n = 7). (A-C) IPGTTs graph after 4 weeks (A) and 11 weeks (B) of intervention with succinate, (C) area under the baseline curve in the IPGTT graphs; (D) body weight (E) total fat mass, total fat percentage (F), weight (G) and percentage (H) of sWAT, vWAT and BAT in mice of HFD and HFD-SA group. Values are expressed as mean ± s.e.m. of biologically independent samples. p-Values were determined by unpaired t-test. *p < 0.05, **p < 0.01.
Figure 2.
Succinate improved HFD-induced energy expenditure. (A) Oxygen consumption (VO2) during 24 hours (A) and the quantitative mean value during the day and night times (B); carbon dioxide production (VCO2) during 24 hours (C) and the quantitative mean value during the day and night times (D); whole-body energy expenditure during 24 hours (E) and the quantitative mean value during the day and night times (F); respiratory quotient during 24 hours (G) and the quantitative mean value during the day and night times (H), which is defined as the ratio of carbon dioxide production and oxygen consumption at the same time. Values are expressed as mean ± s.e.m. of biologically independent samples (n=4). p-Values were determined by unpaired t-test. *p < 0.05.
Figure 3.
Succinate inhibites HFD-induced lipid accumulation. (A) Triglyceride contents in eWAT and ingWAT (n=6). (B) Non-esterified fatty acid (NEFA) contents in eWAT and ingWAT (n=6). (C) Representative images of haematoxylin and eosin (H&E) staining of eWAT and ingWAT (20 × magnification; scale bars, 0.1 mm). (D) The distribution of adipocytes diameters in eWAT. Adipocyte size was measured using Image-Pro Plus software and we chose 6 vision for each mice and calculated 50-80 cells for each vision. (E) Proportion of adipocytes with diameters exceeded 100 μm in eWAT. (F) The distribution of adipocytes diameters in ingWAT. Adipocyte size was measured using Image-Pro Plus software and we chose 6 vision for each mice and calculated 50-80 cells for each vision. (G) Proportion of adipocytes with diameters exceeded 100 μm in ingWAT. Values are expressed as mean ± s.e.m. of biologically independent samples. p-Values were determined by unpaired t-test. *p < 0.05.
Figure 4.
Succinate enhances lipolysis and lipogenesis in adipose tissue. (A-B) Relative mRNA expression of genes invovled in lipolysis (orange) and lipogenensis (green) in eWAT (A) and ingWAT (B) measured by quantitative real-time PCR. (C-D) Immunoblots of Plin1, HSL, p-HSL, and PPARγ in eWAT (C) and ingWAT (D); (E) the quantitative results in eWAT and ingWAT. Data are expressed as mean ± s.e.m. of biologically independent samples (n=3). p-Values were determined by unpaired t-test.
Figure 5.
Succinate decreases hepatic lipid deposition by activating Akt and PPARγ. (A) Representative images of Oil Red O stained liver sections (10 × magnification; scale bars, 0.1 mm, n=6). (B) Area ratio of Oil Red O staining area was measured using Image-Pro Plus software. Liver tissue was analyzed for (C) triglyceride and (D) non-esterified fatty acid (NEFA) content (n=6). (E) Immunoblots of the Akt signaling (Akt and p-Akt) and PPARγ in liver and (F) the corresponding quantitative results (n=3). Data are expresssed as mean ± s.e.m. of biologically independent samples. p-Values were determined by unpaired t-test. *p < 0.05, **p < 0.01.
Figure 6.
Succinate did not affect metabolites involved in glycolysis and TCA cycle. (A-B) Concentrations of TCA cycle metabolites in serum (A) and ingWAT (B) after succinate supplementation, including cis-Aconitate, 2-ketoglutarate, succinate, malate, oxaloacetate. (C-D) Concentrations of glycolytic pathway metabolites in serum (C) and ingWAT (D) after succinate supplementation, including glucose-6-phosphate (Glucose-6-P), fructose-1,6-bisphosphate (Fructose-1,6-BP), 3-phosphoglycerate (3-PG), phosphoenolpyruvate (PEP), pyruvate, lactate. Quantitative data are mean ± s.e.m. of biologically independent samples. p-Values were determined by unpaired t-test.
