Submitted:
11 April 2023
Posted:
12 April 2023
You are already at the latest version
Abstract
Keywords:
1. Introduction
2. Methods and Materials
2.1. Catalyst Preparation
2.2. Catalyst Preparation
2.3. Catalyst Tests
3. Results and Discussion
3.1. Catalytic Performances of Co/Al2O3 Catalysts
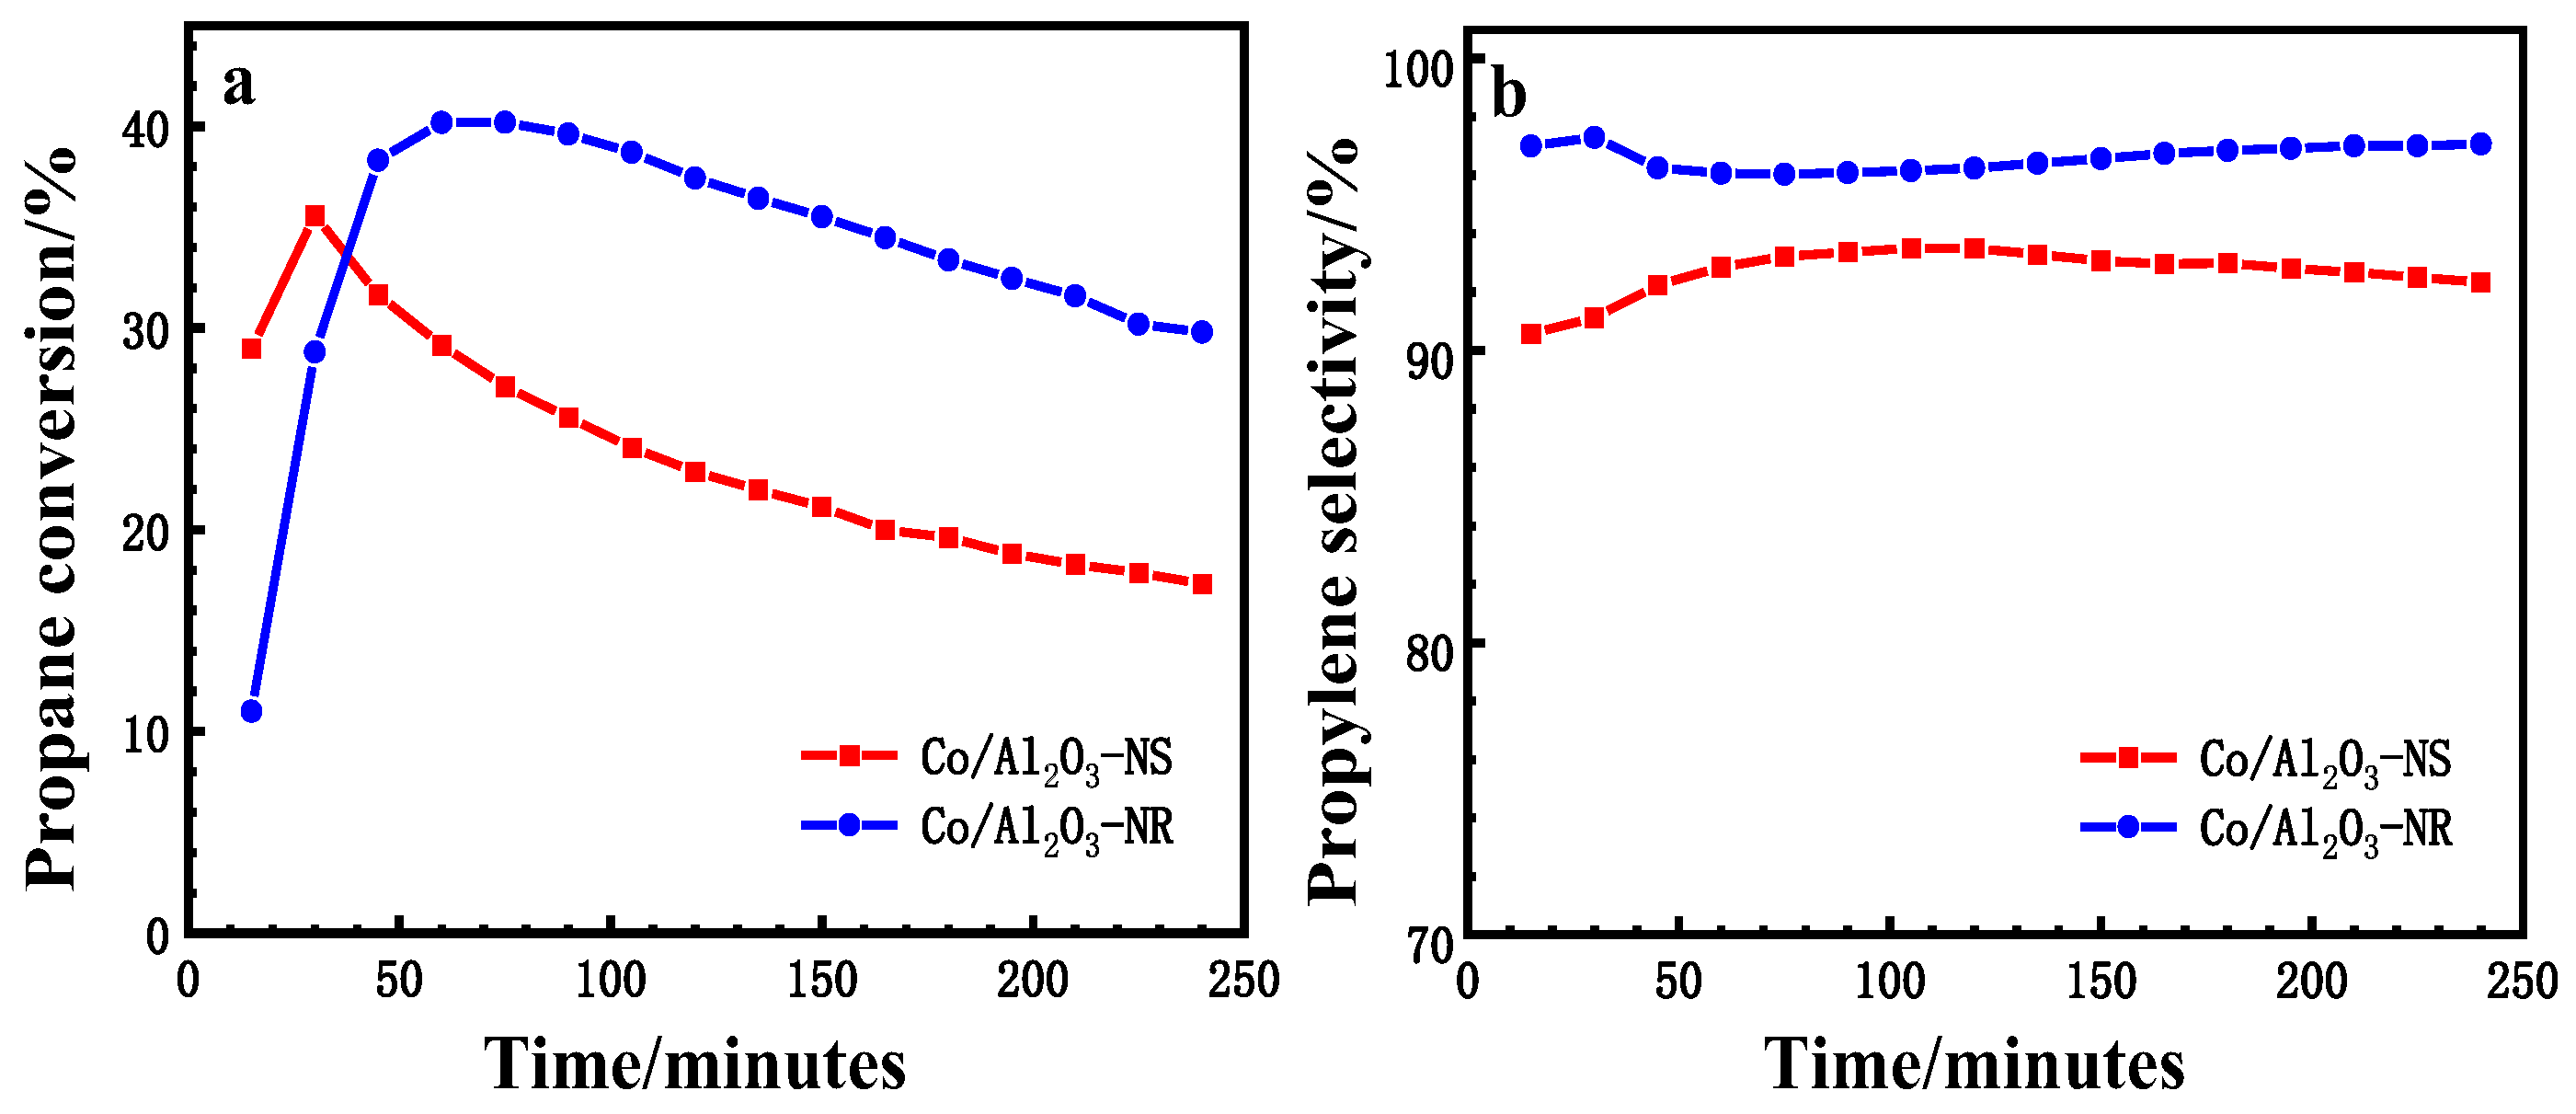
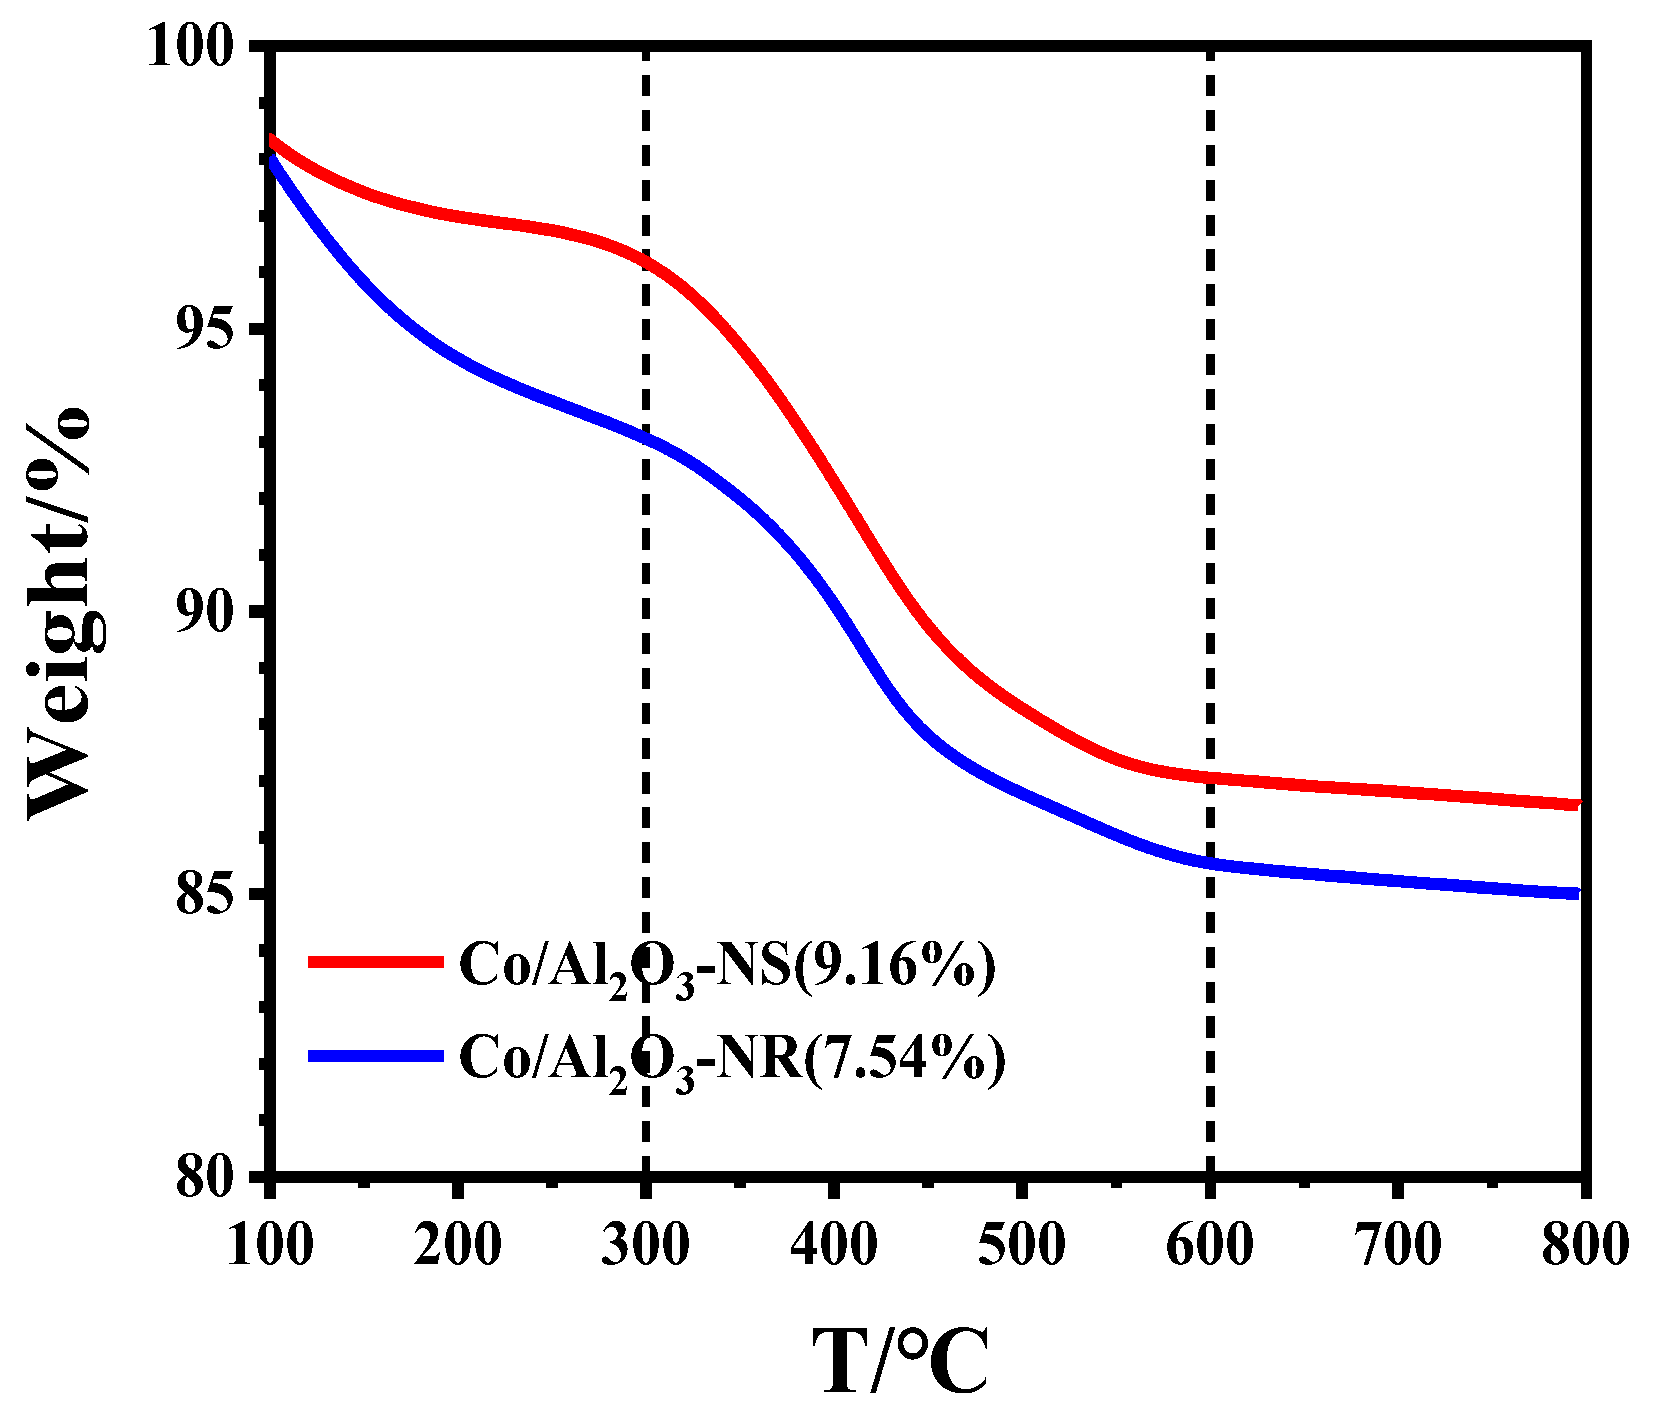
| Catalyst | Ypropene, %[a] | kd, h-1[b] | Carbon Deposition, wt%[c] |
|---|---|---|---|
| Co/Al2O3-NS | 32.4 | 0.34 | 9.16 |
| Co/Al2O3-NR | 38.6 | 0.15 | 7.54 |
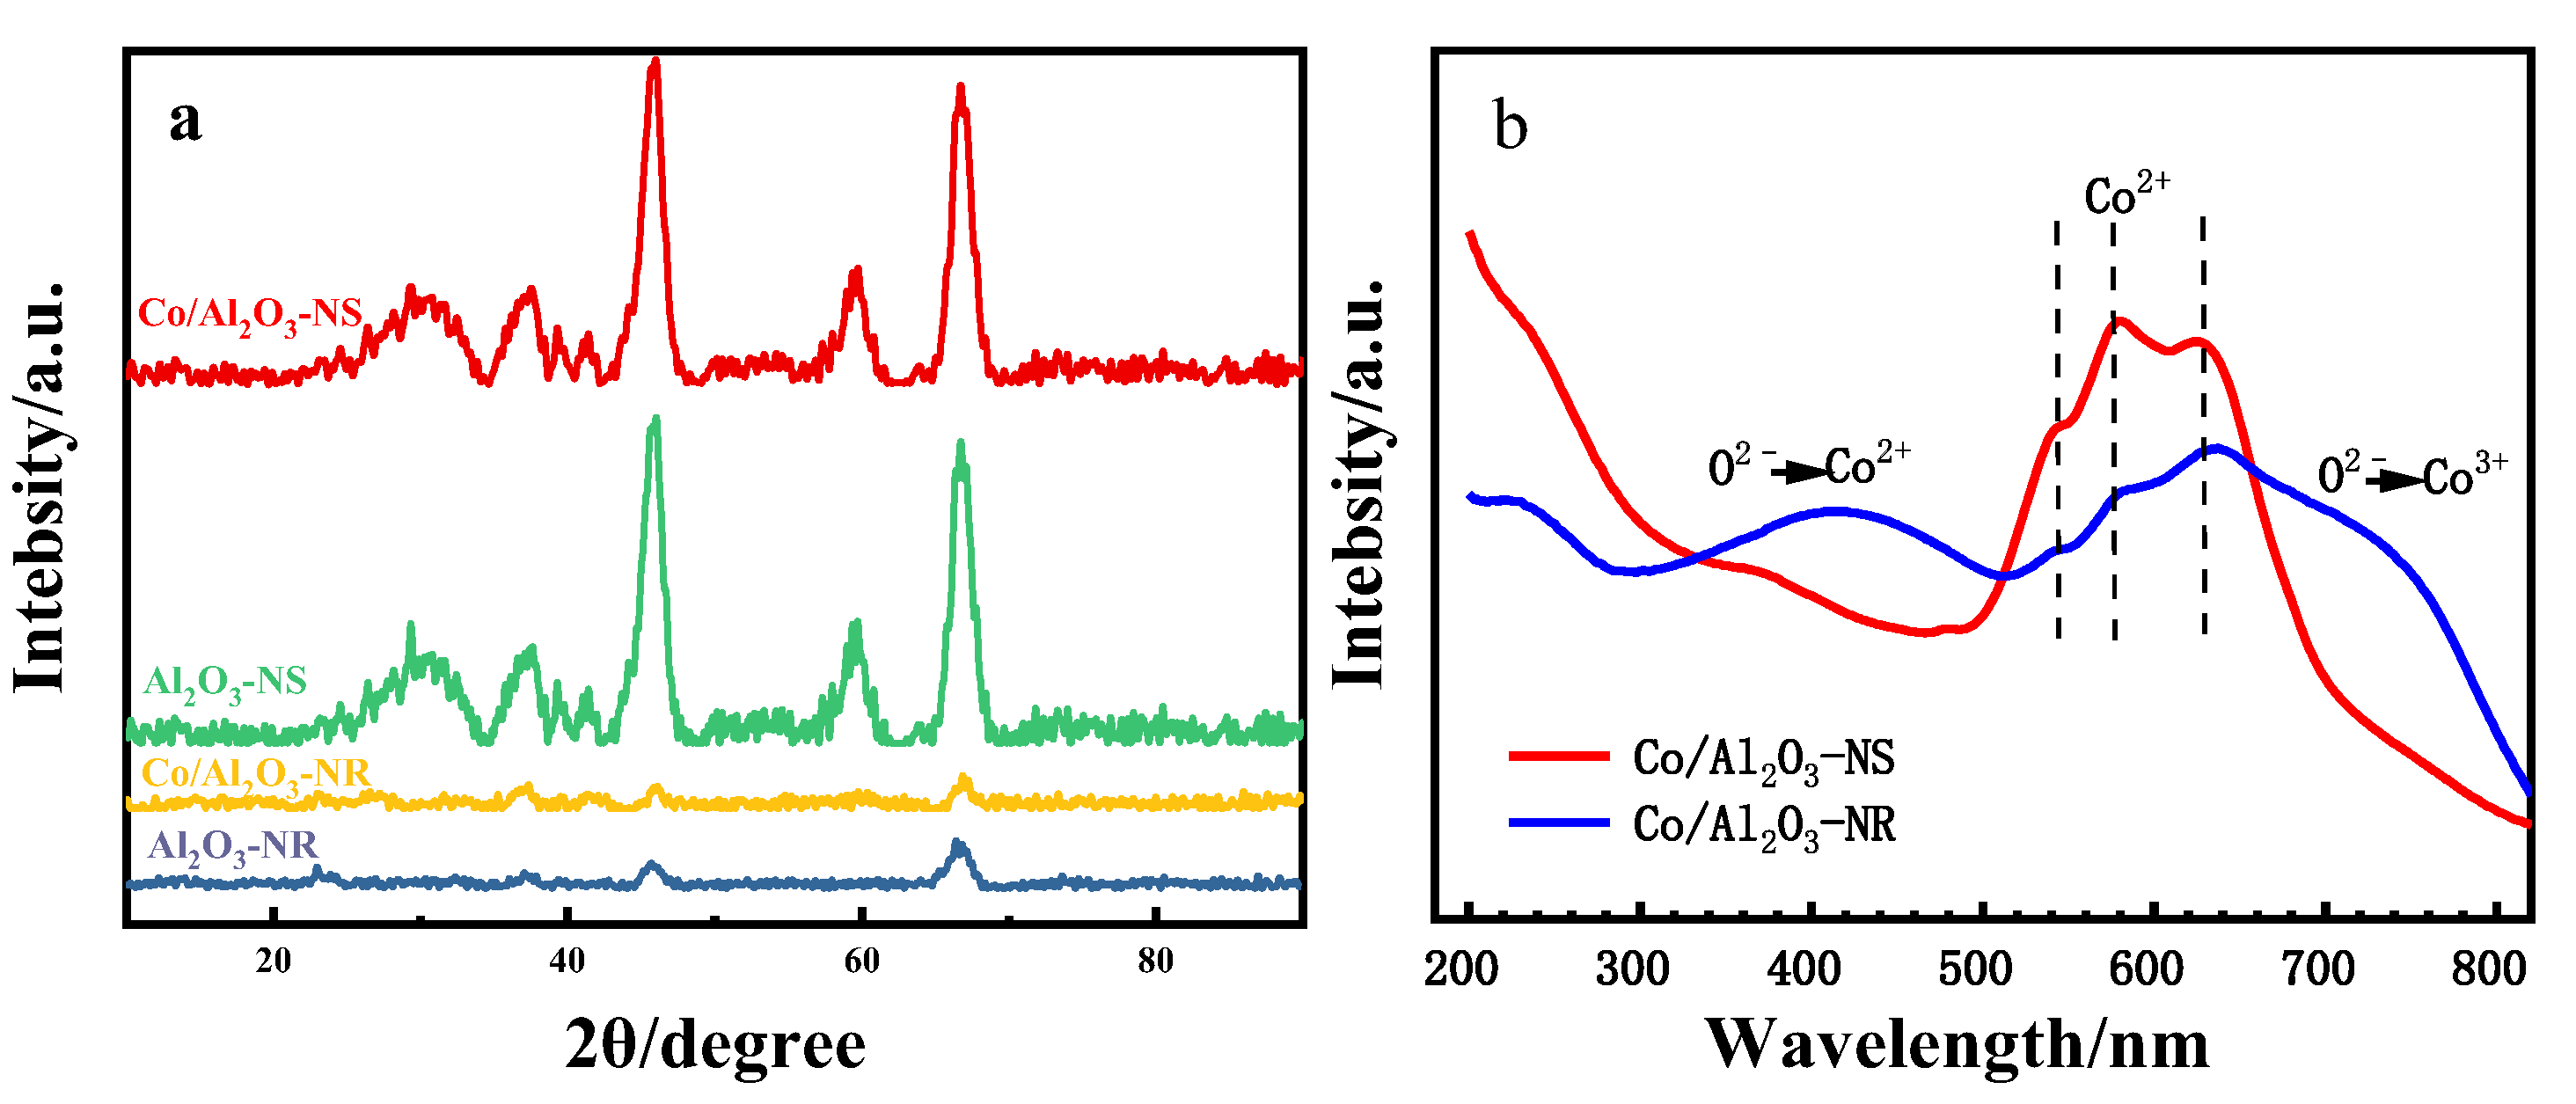
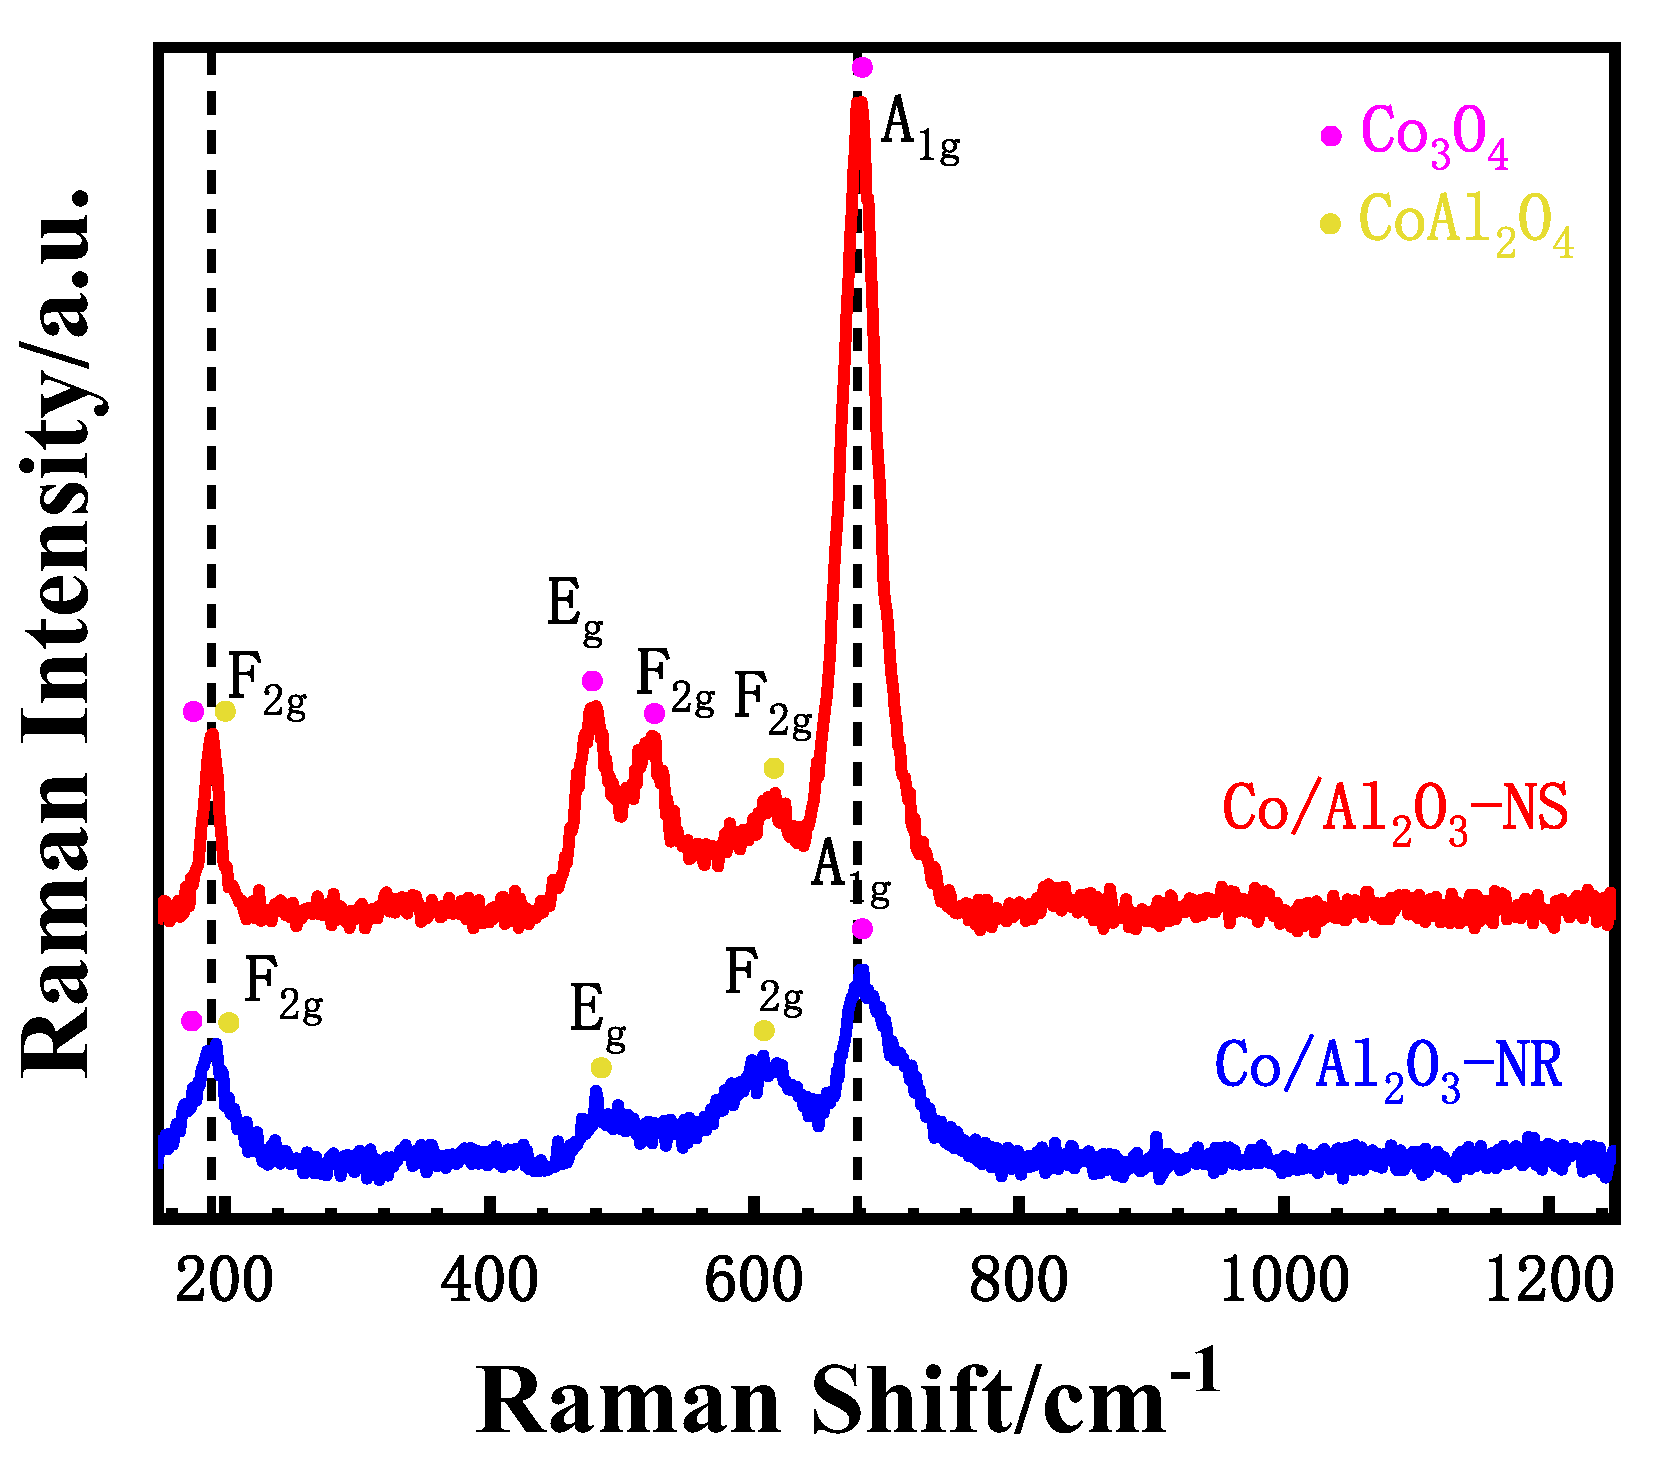
3.2. Bulk and Surface Characterization
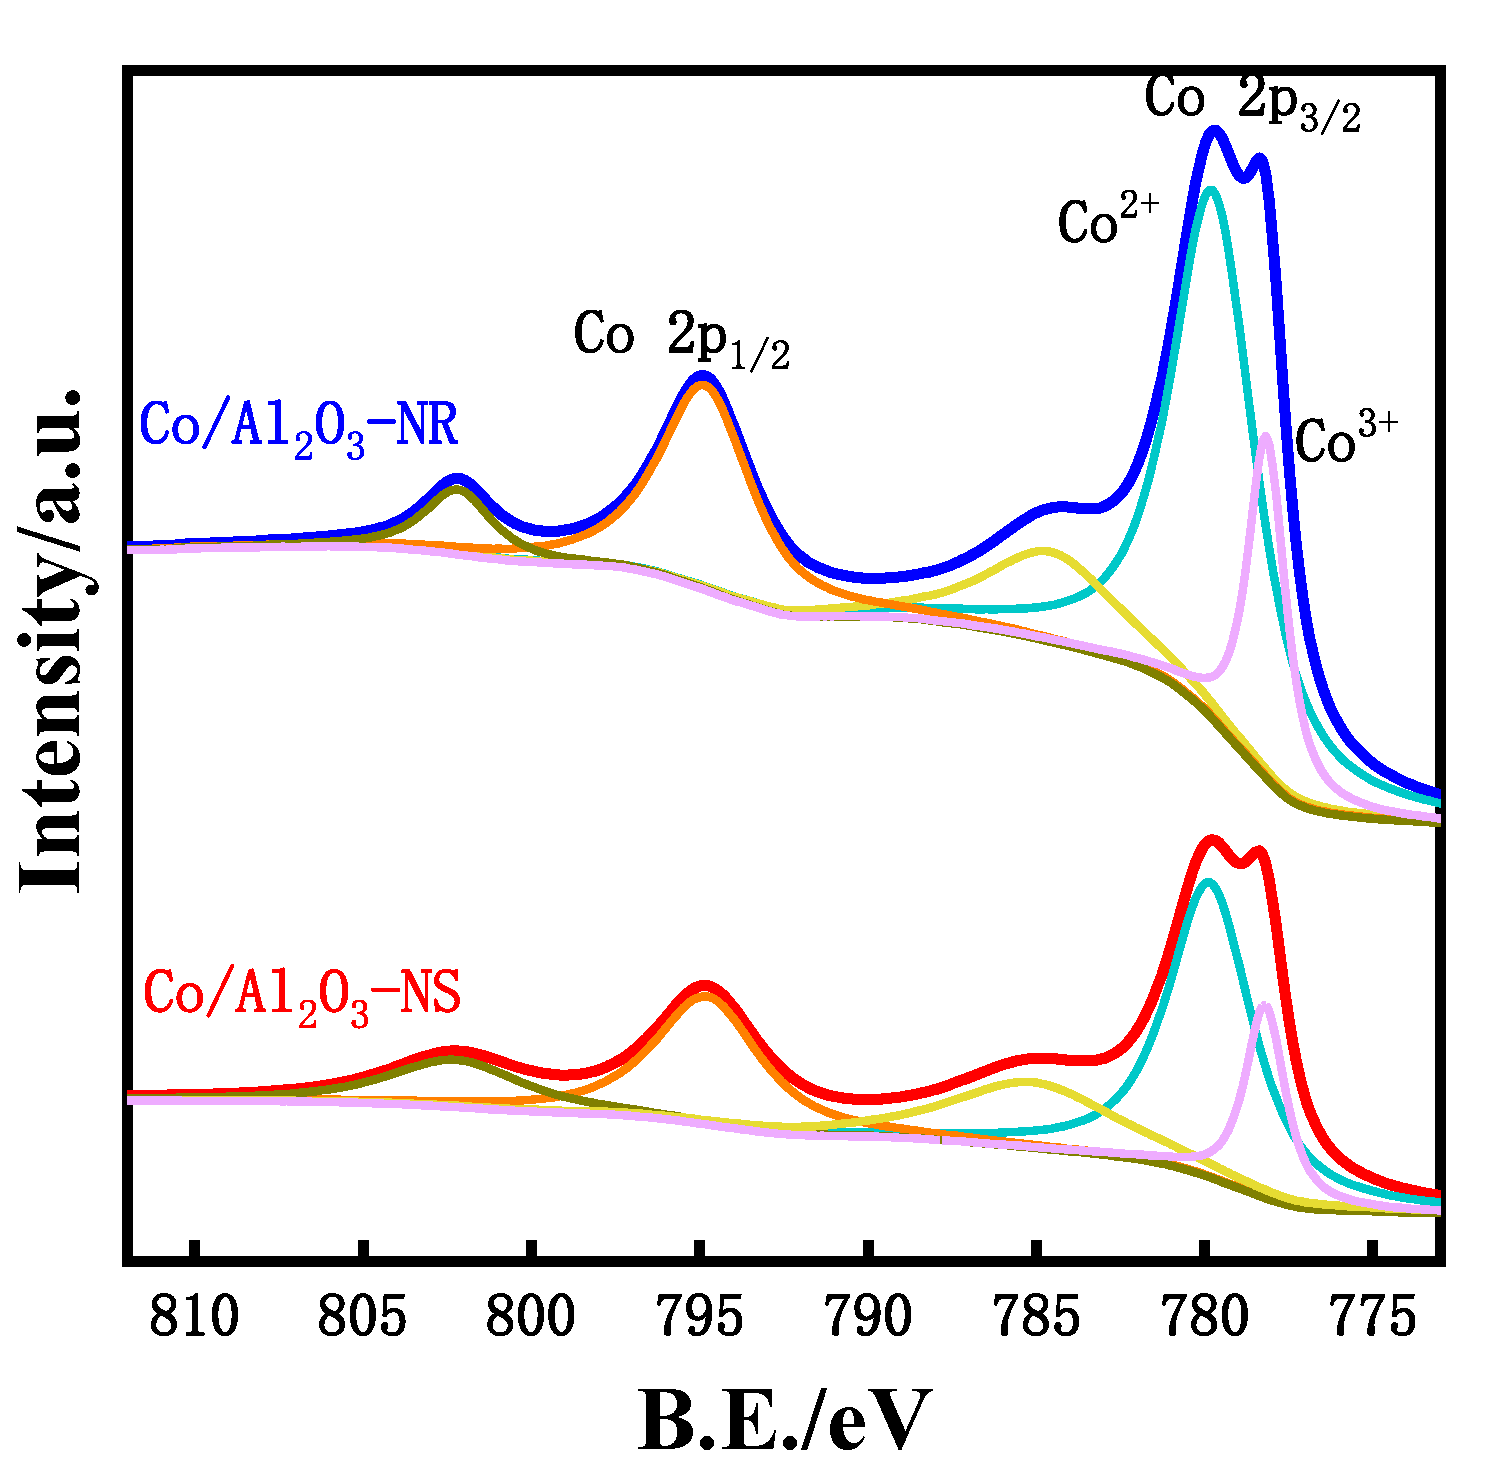
| Catalyst | Surface Concentration | Co2+/Co3+ Molar Ratio | Binding Energy (eV) | |
|---|---|---|---|---|
| Co, mol % | Co, wt% | |||
| Co/Al2O3-NS | 1.89 | 5.90 | 3.03 | 779.5 |
| Co/Al2O3-NR | 3.29 | 11.31 | 3.56 | 779.4 |
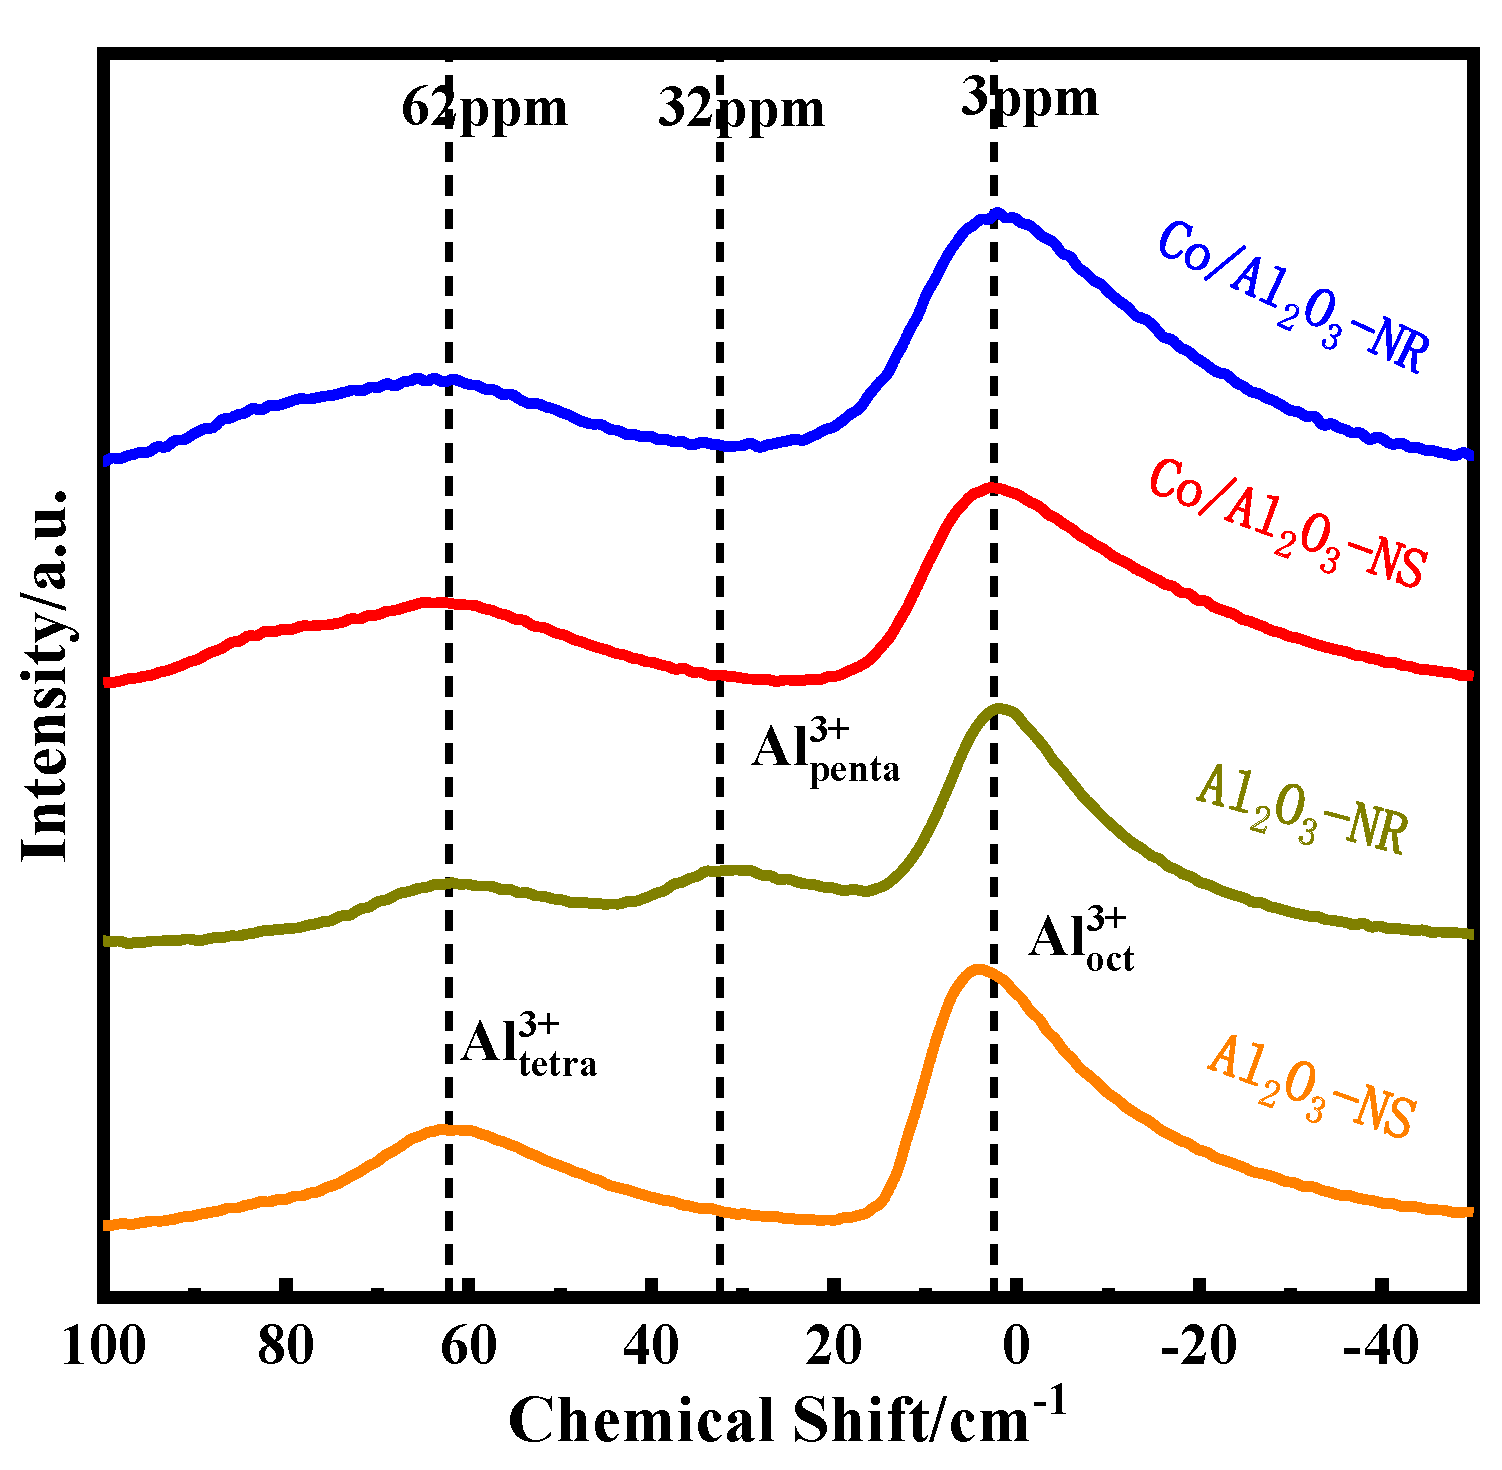
| Catalysts | Al3+ Coordination/% | ||
|---|---|---|---|
| Tetrahedral Al | Pentacoordinate Al | Octahedral Al | |
| Al2O3-NS | 31.5 | - | 68.4 |
| Al2O3-NR | 17.2 | 18.5 | 64.3 |
| Co/Al2O3-NS | 33.8 | - | 66.1 |
| Co/Al2O3-NR | 29.4 | - | 70.6 |
3.3. Reducing Ability and Acidity of the Catalysts
3.4. Discussion
4. Conclusions
Author Contributions
Funding
Data Availability Statement
Acknowledgments
Conflicts of Interest
References
- Jesper J. H. B. Sattler, Javier Ruiz-Martinez, Eduardo Santillan-Jimenez, Bert M. Weckhuysen. Catalytic Dehydrogenation of Light Alkanes on Metals and Metal Oxides. Chem. Rev., 2014, 114, 10613-10653. [CrossRef]
- Eric McFarland. Unconventional Chemistry for Unconventional Natural Gas. Science, 2012, 338, 340-342. [CrossRef]
- C. A. Carrero, R. Schloegl, I. E. Wachs, R. Schomaecker. Critical Literature Review of the Kinetics for the Oxidative Dehydrogenation of Propane over Well-Defined Supported Vanadium Oxide Catalysts. ACS Catal., 2014, 4, 3357-3380. [CrossRef]
- Bipin V. Vora. Development of Dehydrogenation Catalysts and Processes. Top Catal., 2012, 55, 1297-1308. [CrossRef]
- Odd A. Barias, Anders Holmen, Edd A. Blekkan. Propane Dehydrogenation over Supported Pt and Pt-Sn Catalysts: Catalyst Preparation, Characterization, and Activity Measurements. J. Catal., 1996, 158, 1-12.
- Derossi S., Ferraris G., Fremiotti S., Garrone E., Ghiotti G., Campa M. C., Indovina V. Propane Dehydrogenation on Chromia/Silica and Chromia/Alumina Catalysts. J. Catal., 1993, 148, 36-46. [CrossRef]
- Marc Moselage, Jie Li, Lutz Ackermann. Cobalt-Catalyzed C-H Activation. ACS Catal., 2016, 6, 498-525. [CrossRef]
- Bo Hu, Wun-Gwi Kim, Taylor P. Sulmonetti, Michele L. Sarazen, Shuai Tan, Jungseob So, Yujun Liu, Ravindra S. Dixit, Sankar Nair, Christopher W. Jones. Mesoporous CoAl2O4 Spinel Catalyst for Non-Oxidative Propane Dehydrogenation. ChemCatChem, 2017, 9(17), 3330-3337.
- Xiuyi Li, Pengzhao Wang, Haoren Wang, Chunyi Li. Effects of the state of Co species in Co/Al2O3 catalysts on the catalytic performance of propane dehydrogenation. Appl. Surf. Sci., 2018, 441, 688-693. [CrossRef]
- N. Dewangan, J. Ashok, M. Sethia, S.Das, S.Pati, K. Hidajat, S.Kawi. Cobalt-based catalyst supported on different morphologies of alumina for non-oxidative propane dehydrogenation: Effect of metal support interaction and Lewis acidic sites. ChemCatChem, 2019, 11(19), 4923-4934. [CrossRef]
- Yihu Dai, Jingjing Gu, Suyang Tian, Yue Wu, Junchao Chen, Fanxing Li, Yonghua Du, Luming Peng, Weiping Ding, Yanhui Yang. γ-Al2O3 sheet-stabilized isolate Co2+ for catalytic propane dehydrogenation. Journal of Catalysis, 2020, 381, 482-492. [CrossRef]
- Yanan Sun, Yimin Wu, Honghong Shan, Chunyi Li. Studies on the Nature of Active Cobalt Species for the Production of Methane and Propylene in Catalytic Dehydrogenation of Propane. Catal. Lett., 2019, 145, 1413-1419. [CrossRef]
- Pengzhao Wang, Zhikang Xu, Tinghai Wang, Yuanyuan Yue, Xiaojun Bao, Haibo Zhu. Unmodified bulk alumina as an efficient catalyst for propane dehydrogenation. Catal. Sci. Technol., 2020,10, 3537-3541. [CrossRef]
- Zean Xie, Zhi Li, Peng Tang, Yangyang Song, Zhen Zhao, Lian Kong, Xiaoqiang Fan, Xia Xiao. The effect of oxygen vacancies on the coordinatively unsaturated Al-O acid-base pairs for propane dehydrogenation. J. Catal., 2021, 397, 172-182. [CrossRef]
- Xinwei Yang, Qing Li, Erjun Lu, Zhiqiang Wang, Xueqing Gong, Zhiyang Yu, Yun Guo, Li Wang, Yanglong Guo, Wangcheng Zhan, Jinshui Zhang, Sheng Da. Taming the stability of Pd active phases through a compartmentalizing strategy toward nanostructured catalyst supports. Nat. Commun., 2019, 10, 1611. [CrossRef]
- Huimei Duan, Rui You, Shutao Xu, Zhaorui Li, Kun Qian, Tian Cao, Weixin Huang, Xinhe Bao. Pentacoordinated Al3+-Stabilized Active Pd Structures on Al2O3-Coated Palladium Catalysts for Methane Combustion. Angew. Chem. Int. Ed., 2019, 58, 12043-12048.
- Ja Hun Kwak, Jianzhi Hu,1Donghai Mei, Cheol-Woo Yi, Do Heui Kim, Charles H. F. Peden, Lawrence F. Allard, Janos Szanyi. Coordinatively Unsaturated Al3+ Centers as Binding Sites for Active Catalyst Phases of Platinum on γ-Al2O3. Science, 2009, 325, 1670-1673.
- Lei Shi, Gaoming Deng, Wencui Li, Shumiao, Qingnan Wang, Weiping Zhang, Anhui Lu. Al2O3 Nanosheets Rich in Pentacoordinate Al3+ Ions Stabilize Pt-Sn Clusters for Propane Dehydrogenation. Angew. Chem. Int. Ed., 2015, 54, 13994-13998.
- Wenming Liu, Shenyou Yang, Qiuli Zhang, Tianyao He, Yiwei Luo, Jinxiong Tao, Daishe Wu, Honggen Peng. Insights into flower-like Al2O3 spheres with rich unsaturated pentacoordinate Al3+ sites stabilizing Ru-CeOx for propane total oxidation. Appl. Catal. B, 2021, 292, 120171.
- Namgi Jeon, Okkyun Seo, Jungmok Oh, Jisu Park, Iljun Chung, Jaemyung Kim, Osami Sakata, Akhil Tayal, Yongju Yun. Non-oxidative propane dehydrogenation over alumina-supported Co-V oxide catalysts. Appl. Catal. A, 2021, 614, 118036. [CrossRef]
- Yihu Dai, Yue Wu, Hua Dai, Xing Gao, Suyang Tian, Jingjing Gu, Xianfeng Yi, Anmin Zheng, Yanhui Yang. Effect of coking and propylene adsorption on enhanced stability for Co2+-catalyzed propane dehydrogenation. J. Catal., 2021, 395, 105-116. [CrossRef]
- Marcos Zayat, David Levy. Blue CoAl2O4 Particles Prepared by the Sol-Gel and Citrate-Gel Methods. Chem. Mater., 2000, 12, 2763-2769.
- V. G. Hadjiev, M. N. Iliev, I. V. Vergilov. The Raman spectra of Co3O4. J. Phys. C, 1988, 21, L199-L201.
- Beatriz Rivas-Murias, Verónica Salgueiriño. Thermodynamic CoO-Co3O4 crossover using Raman spectroscopy in magnetic octahedron-shaped nanocrystals. J. Raman Spectrosc., 2017, 48, 837-841.
- C. M. Alvarez-Docio, J. J. Reinosa, A. Del Campo, J. F. Fernandez. Investigation of thermal stability of 2D and 3D CoAl2O4 particles in core-shell nanostructures by Raman spectroscopy. J. Alloys Compd., 2019, 779, 244-254. [CrossRef]
- F. R. Chen, J. G. Davis, J. J. Fripiat. Aluminum Coordination and Lewis Acidity in Transition Aluminas. J. Catal., 1992, 133, 263-278. [CrossRef]
- John J. Fitzgerald, Gilberto Piedra, Steven F. Dec, Mark Seger, Gary E. Maciel. Dehydration Studies of a High-Surface-Area Alumina (Pseudo-boehmite) Using Solid-State 1H and 27Al NMR. J. Am. Chem. Soc., 1997, 119, 7832-7842. [CrossRef]
- Ja Hun Kwak, Jian Zhi Hu, Do Heui Kim, Janos Szanyi, Charles H.F. Peden. Penta-coordinated Al3+ ions as preferential nucleation sites for BaO on γ-Al2O3: An ultra-high-magnetic field 27Al MAS NMR study. J. Catal., 2007, 251, 189-194. [CrossRef]
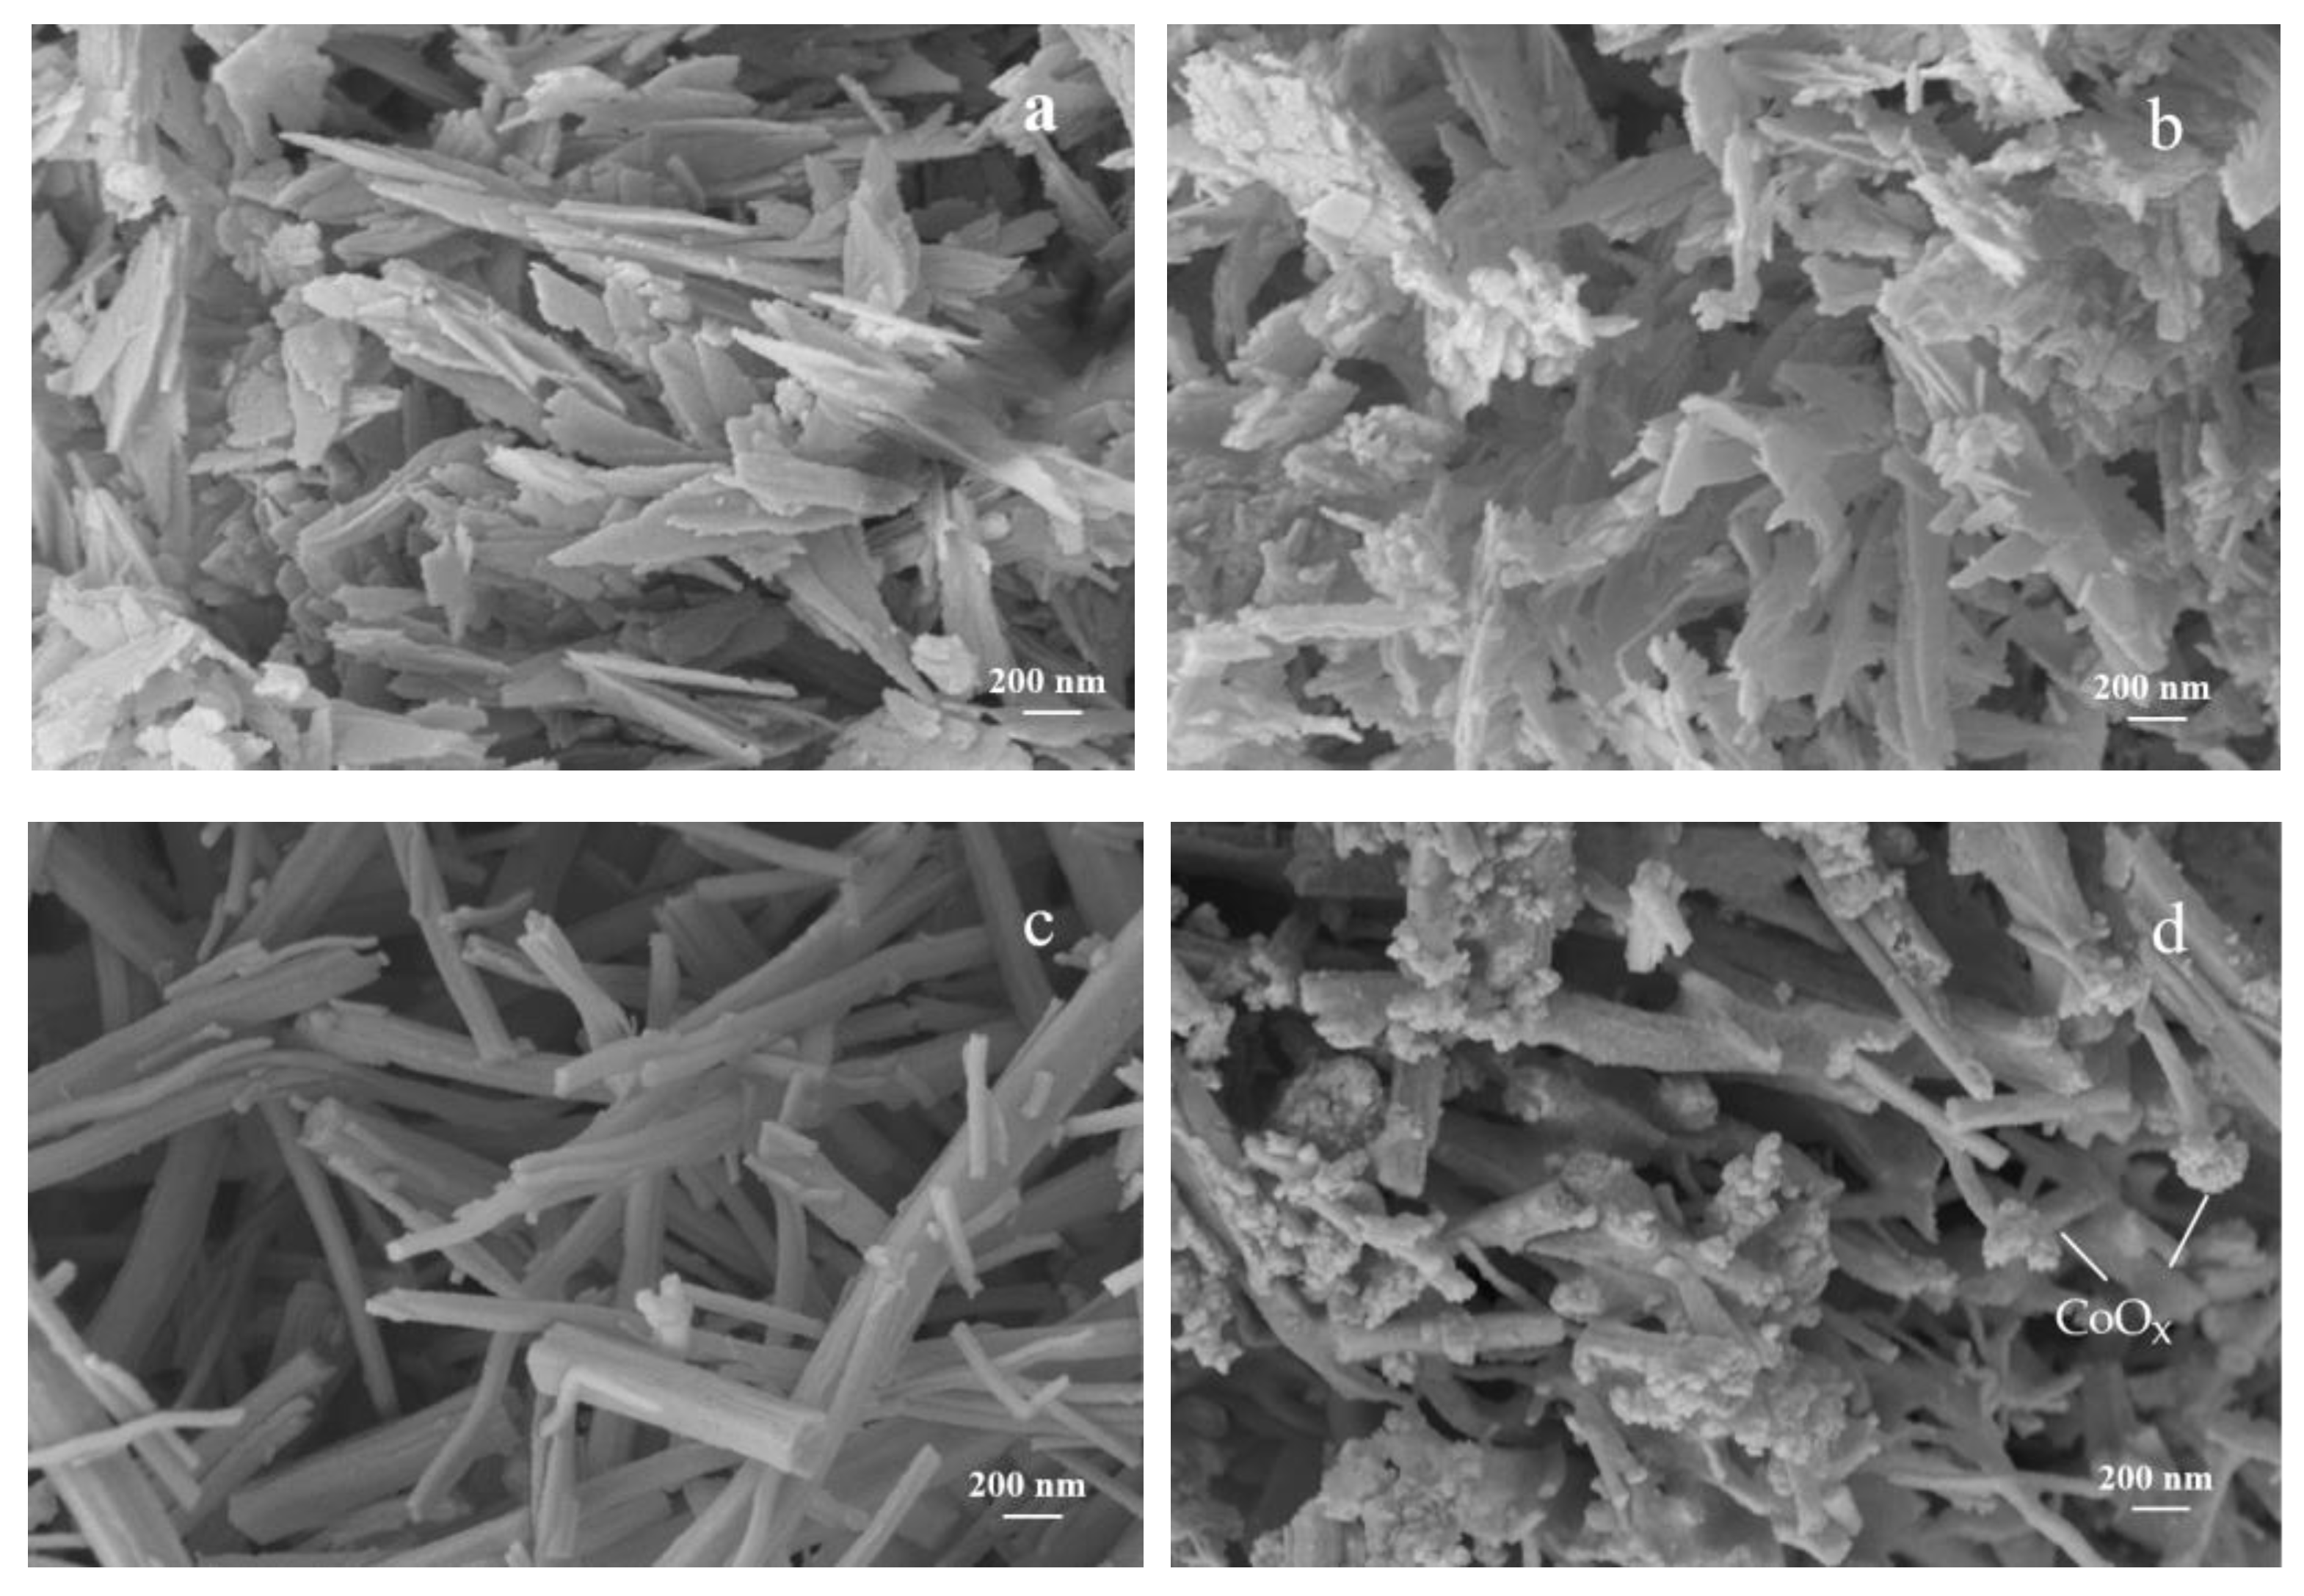
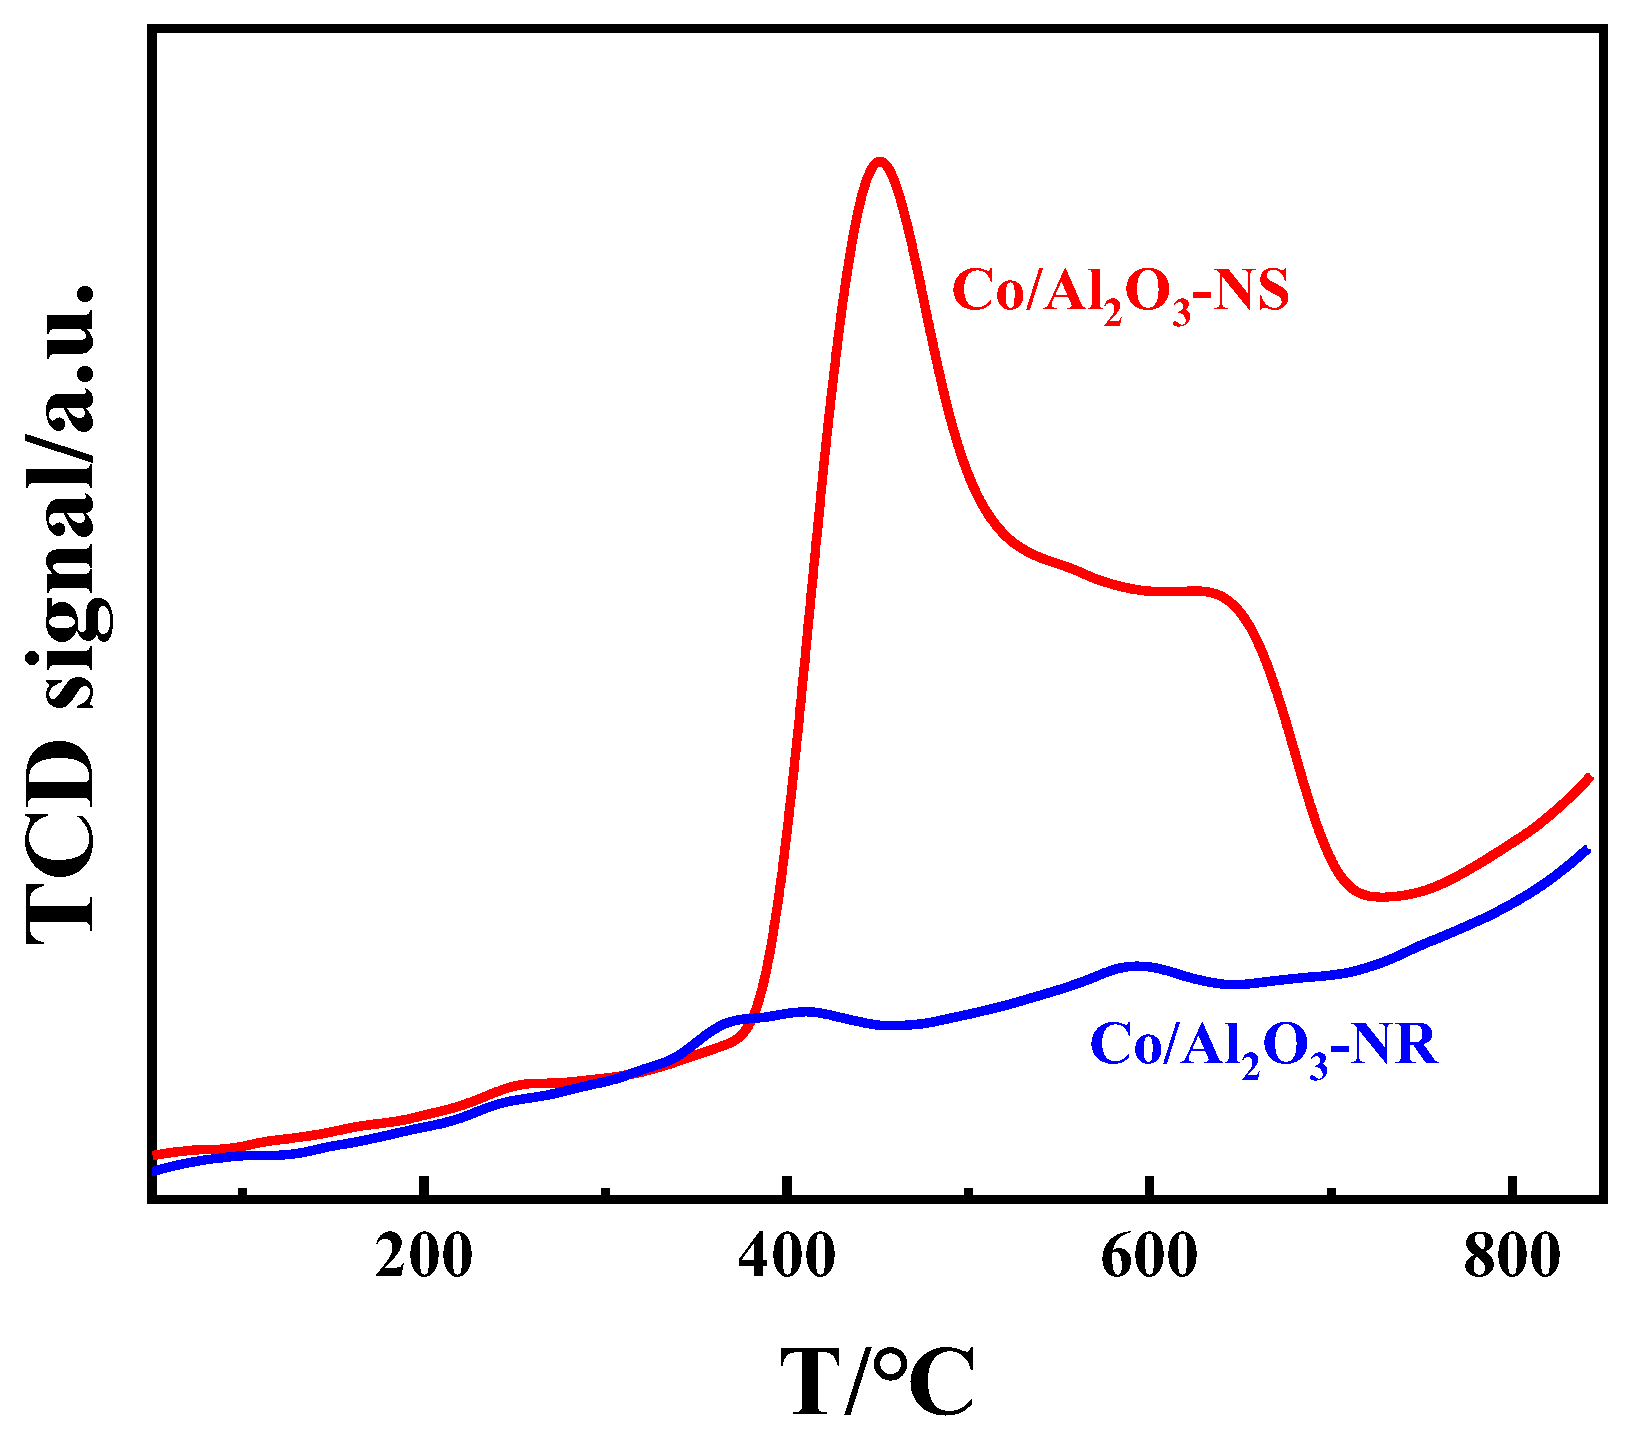
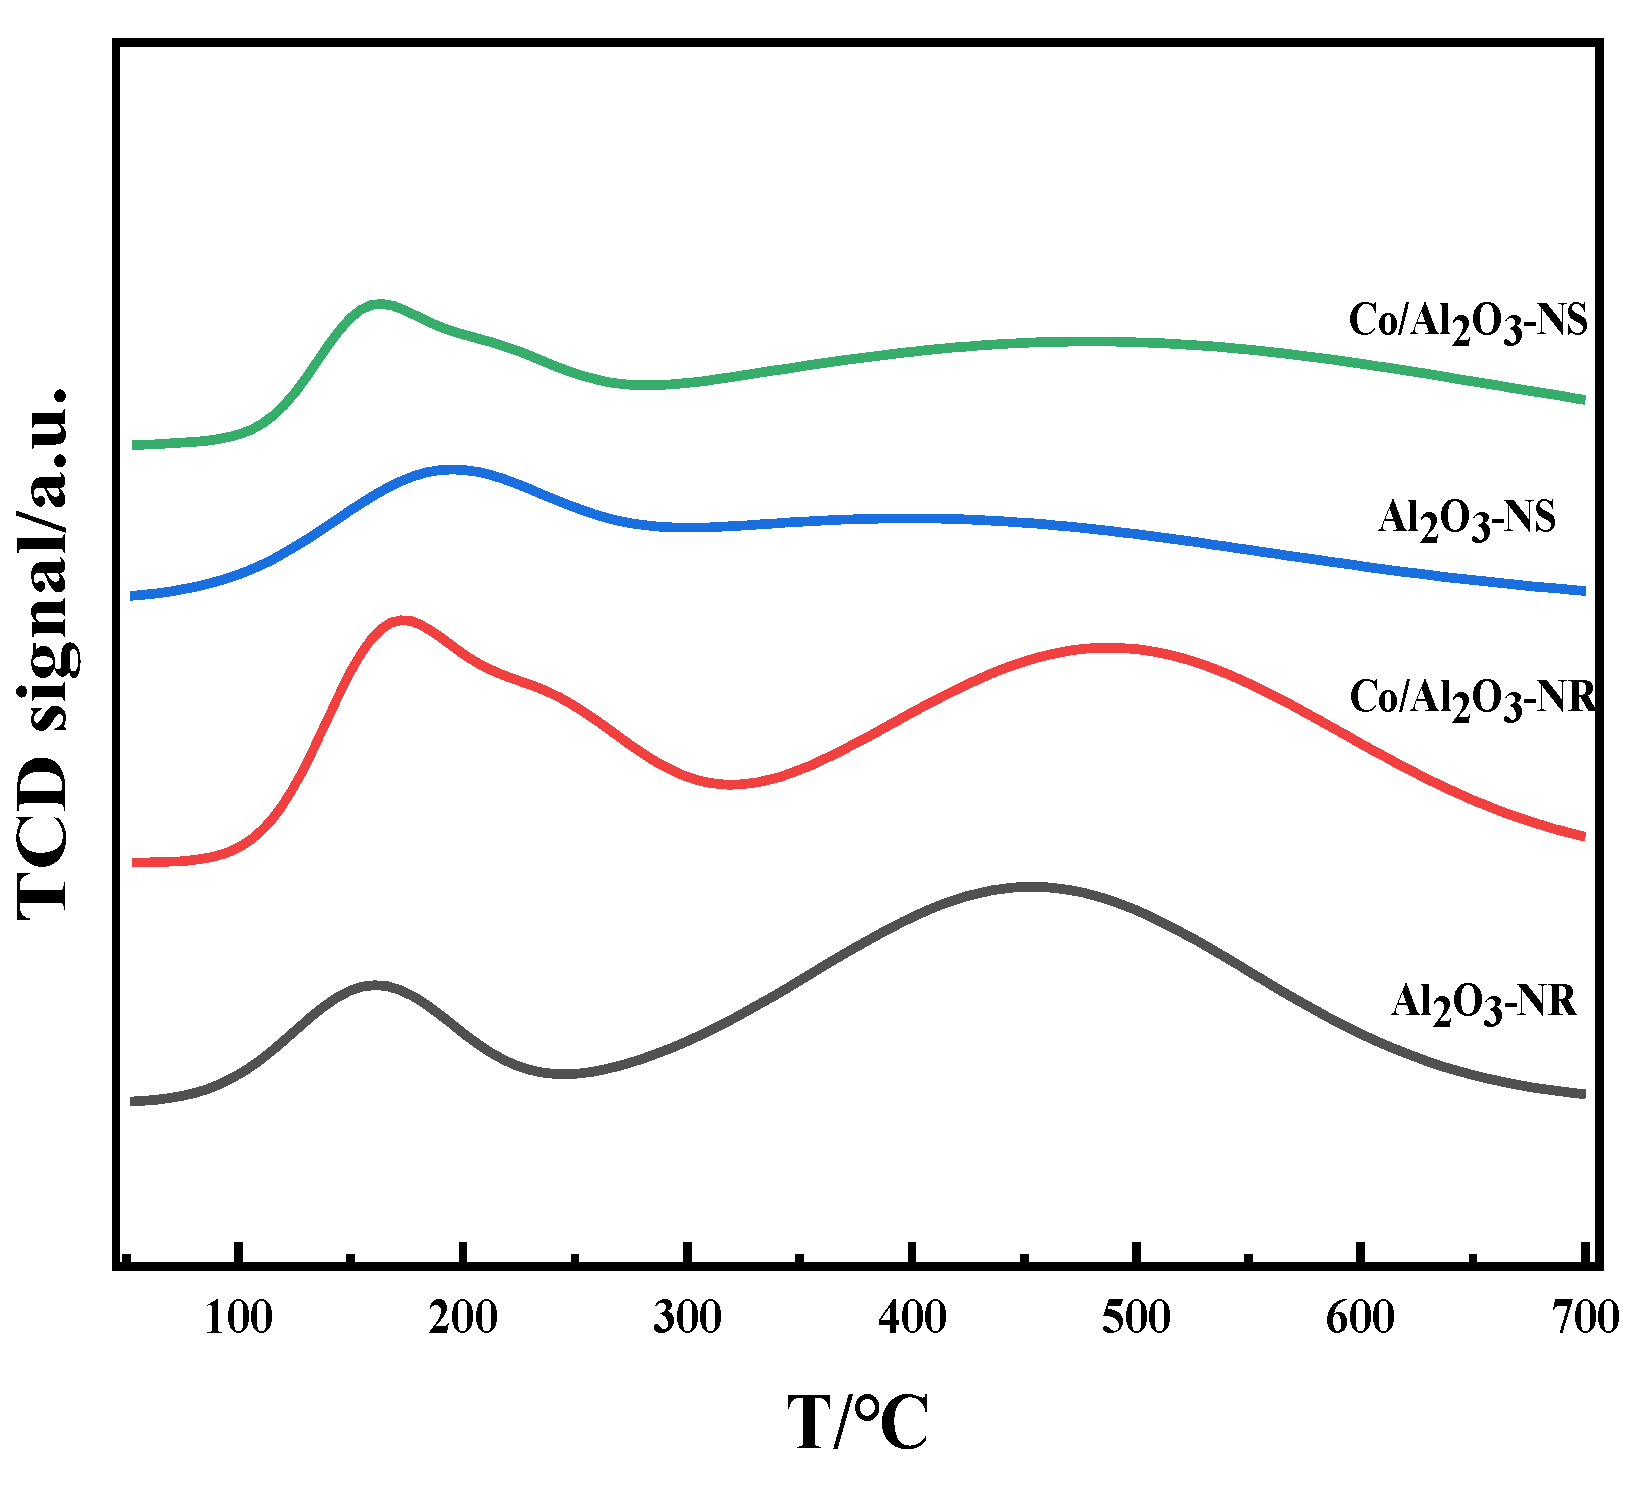
| Catalysts | Acid Sites/% | ||
|---|---|---|---|
| Strong Acid Sites | Medium Strong Acid Sites | Weak Acid Sites | |
| Al2O3-NS | 74.8 | - | 25.2 |
| Al2O3-NR | 83.4 | - | 16.6 |
| Co/Al2O3-NS | 79.2 | 12.4 | 8.4 |
| Co/Al2O3-NR | 64.5 | 22.4 | 13.1 |
Disclaimer/Publisher’s Note: The statements, opinions and data contained in all publications are solely those of the individual author(s) and contributor(s) and not of MDPI and/or the editor(s). MDPI and/or the editor(s) disclaim responsibility for any injury to people or property resulting from any ideas, methods, instructions or products referred to in the content. |
© 2023 by the authors. Licensee MDPI, Basel, Switzerland. This article is an open access article distributed under the terms and conditions of the Creative Commons Attribution (CC BY) license (http://creativecommons.org/licenses/by/4.0/).


