Submitted:
12 April 2023
Posted:
13 April 2023
You are already at the latest version
Abstract
Keywords:
1. Introduction
2. Materials and Methods
2.1. Production of Cellulose Nanofibrils (CNF)
2.2. Mechanical-Enzymatic Pretreatment
2.3. Synthesis of Graphene Oxide (GO)
2.4. Pinus radiata Bark Extract Production
2.5. Synthesis of Reduced Graphene Oxide/Nanocellulose (rGO/CNF) and Reduced Graphene Oxide/Nanocellulose/Tannin (rGO/CNF/TA) Composites
2.6. Physicochemical Characterization of rGO/CNF and rGO/CNF/TA Composites
2.7. Conductivity Measurements
2.8. Swelling Behavior of rGO/CNF and rGO/CNF/TA Composites
2.9. Mechanical Properties
2.10. Cytotoxicity Assay
2.11. In Vitro Wound Healing Assay (Scratch Test)
2.12. Statistical Analysis
3. Results and Discussion
3.1. Morphological Characterization of rGO/CNF and rGO/CNF/TA Composites

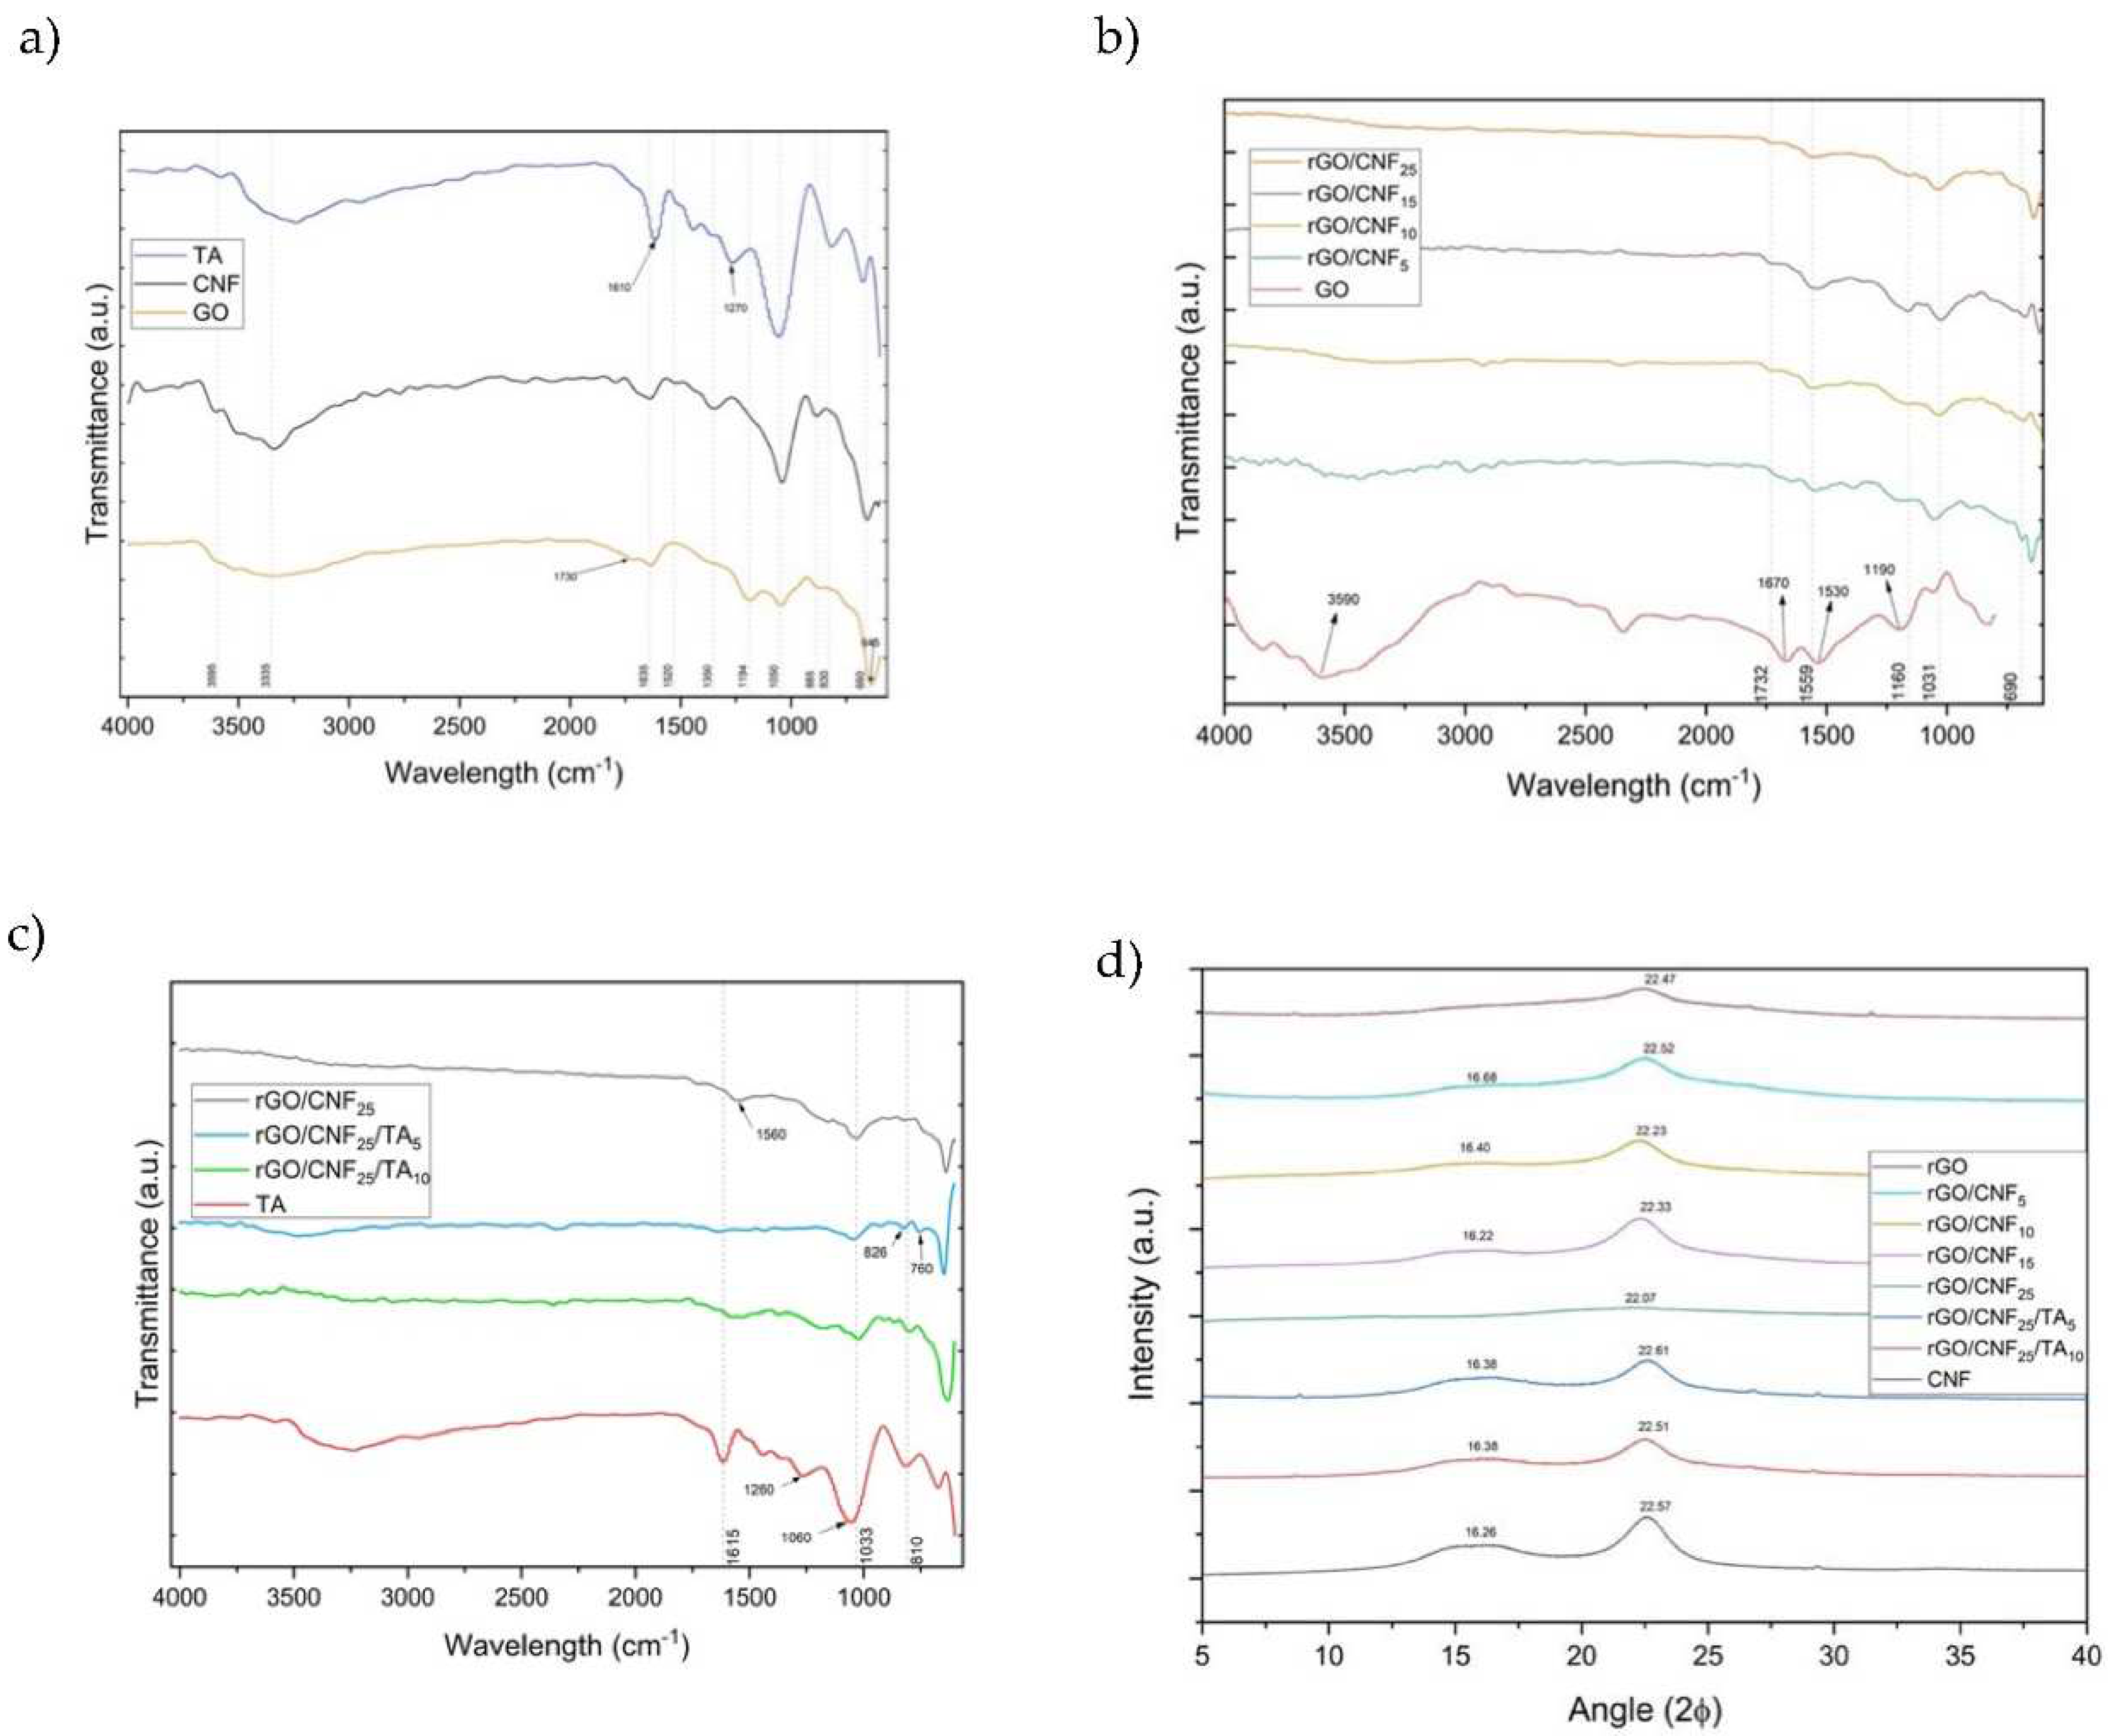
3.2. Spectroscopical Characterization of rGO/CNF and rGO/CNF/TA Composites
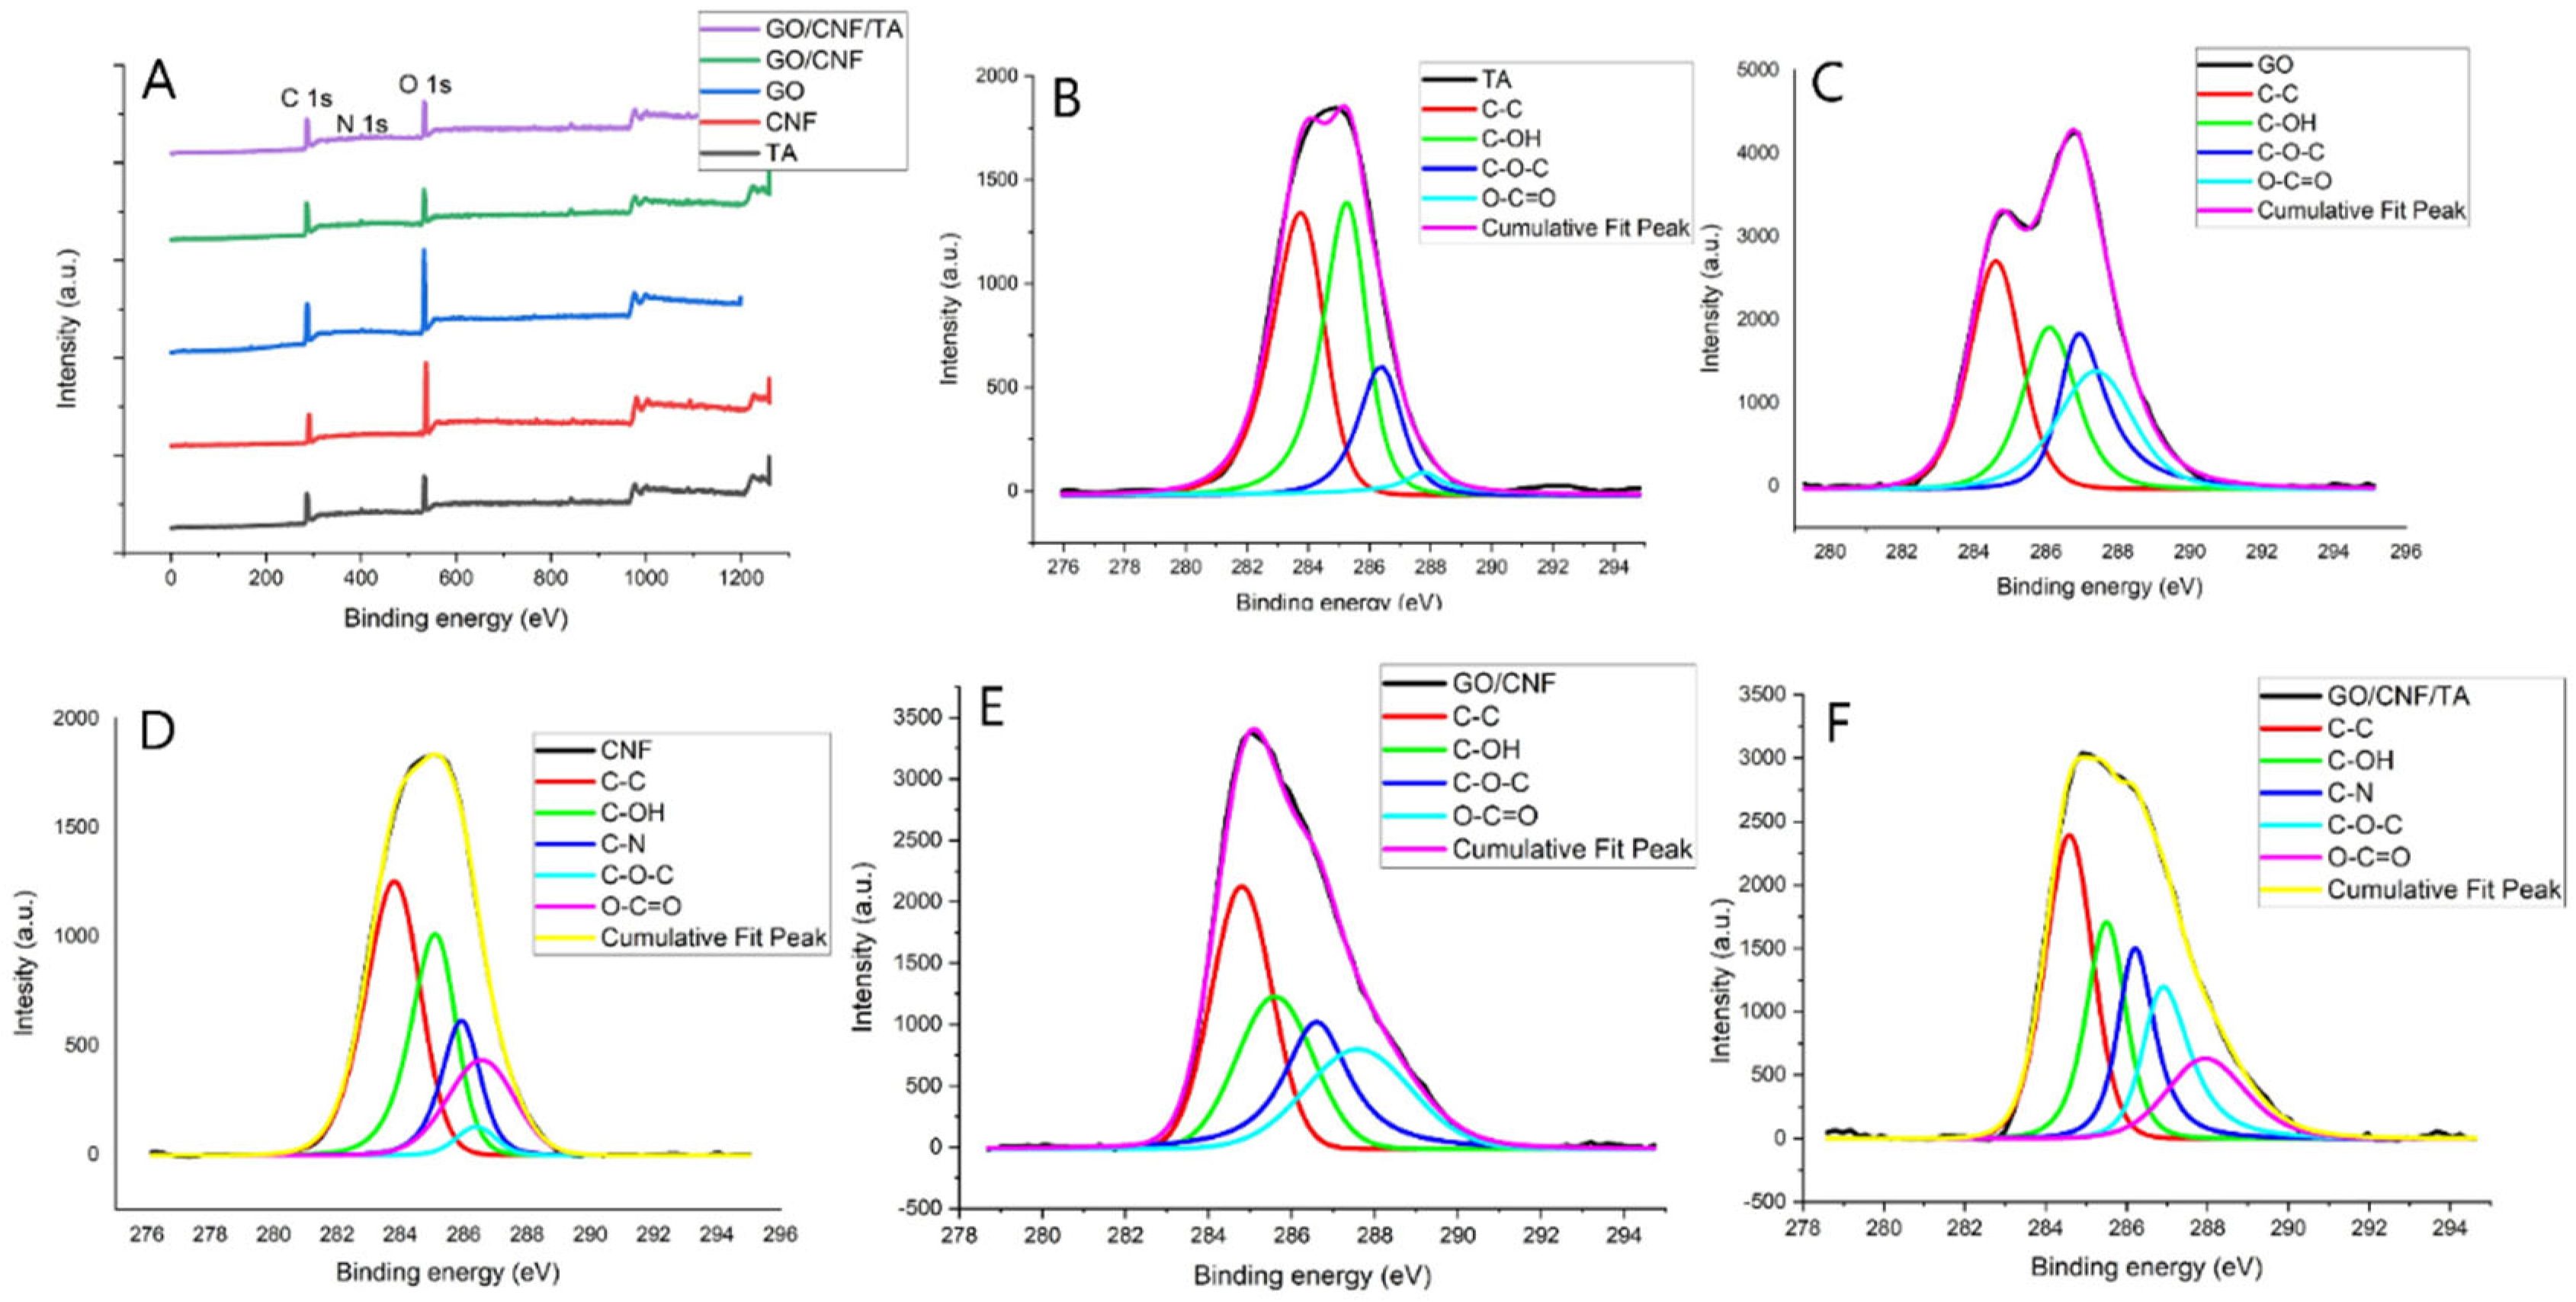
| Sample | C-C% | C-OH% | C-O-C% | O-C=O% | C-N% |
|---|---|---|---|---|---|
| TA | 47 | 33 | 16 | 3 | N.D. |
| CNF | 46 | 32 | 17 | 3 | 19 |
| GO | 30 | 23 | 22 | 23 | N.D. |
| rGO/CNF25 | 38 | 2 | 37 | 21 | 13 |
| GO/CNF25/TA10 | 46 | 28 | 25 | 25 | 20 |
3.3. Thermal Stability of the Composite Materials
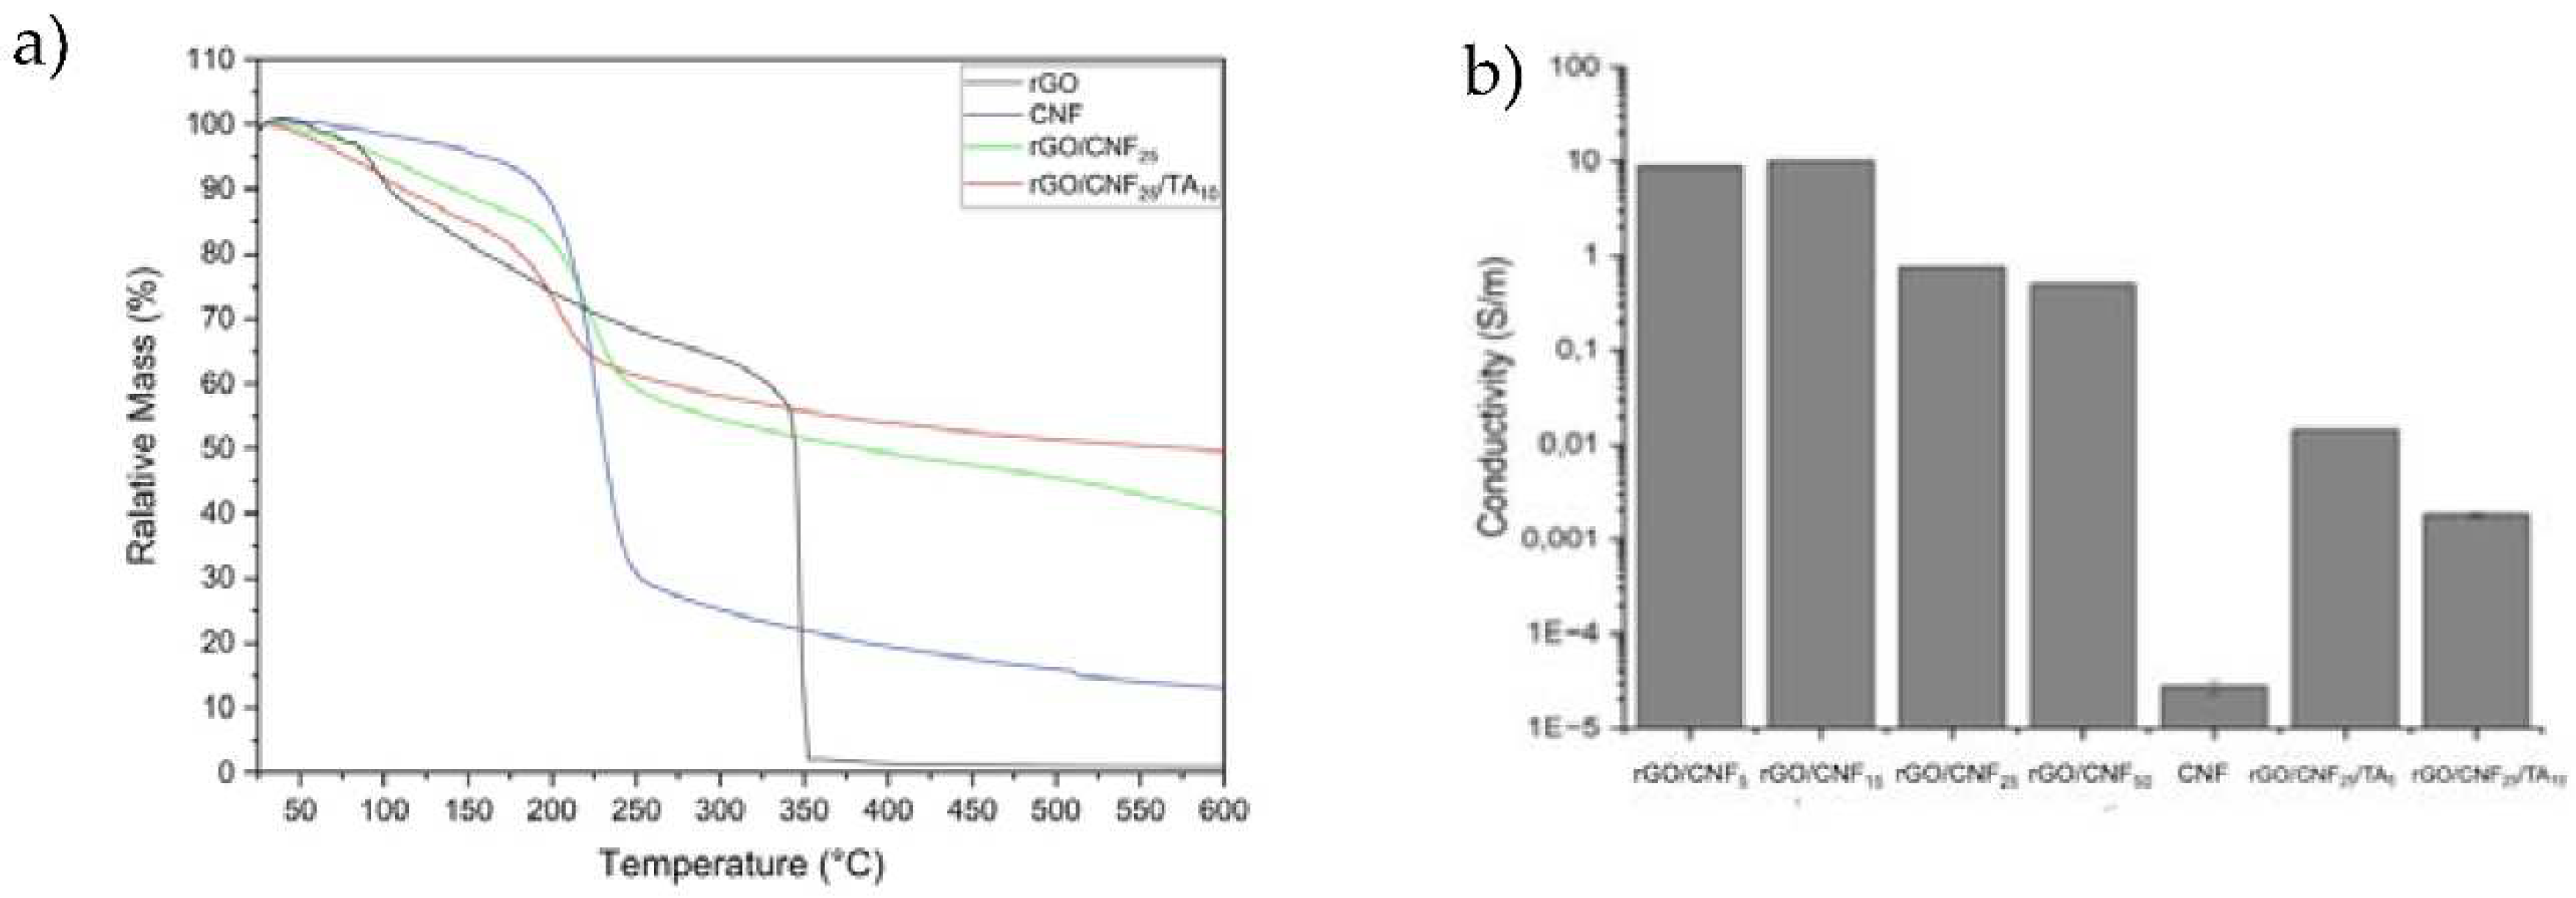
3.4. Conductivity and Surface Charge of the Composite Materials
3.5. Swelling Behavior of Composite Materials
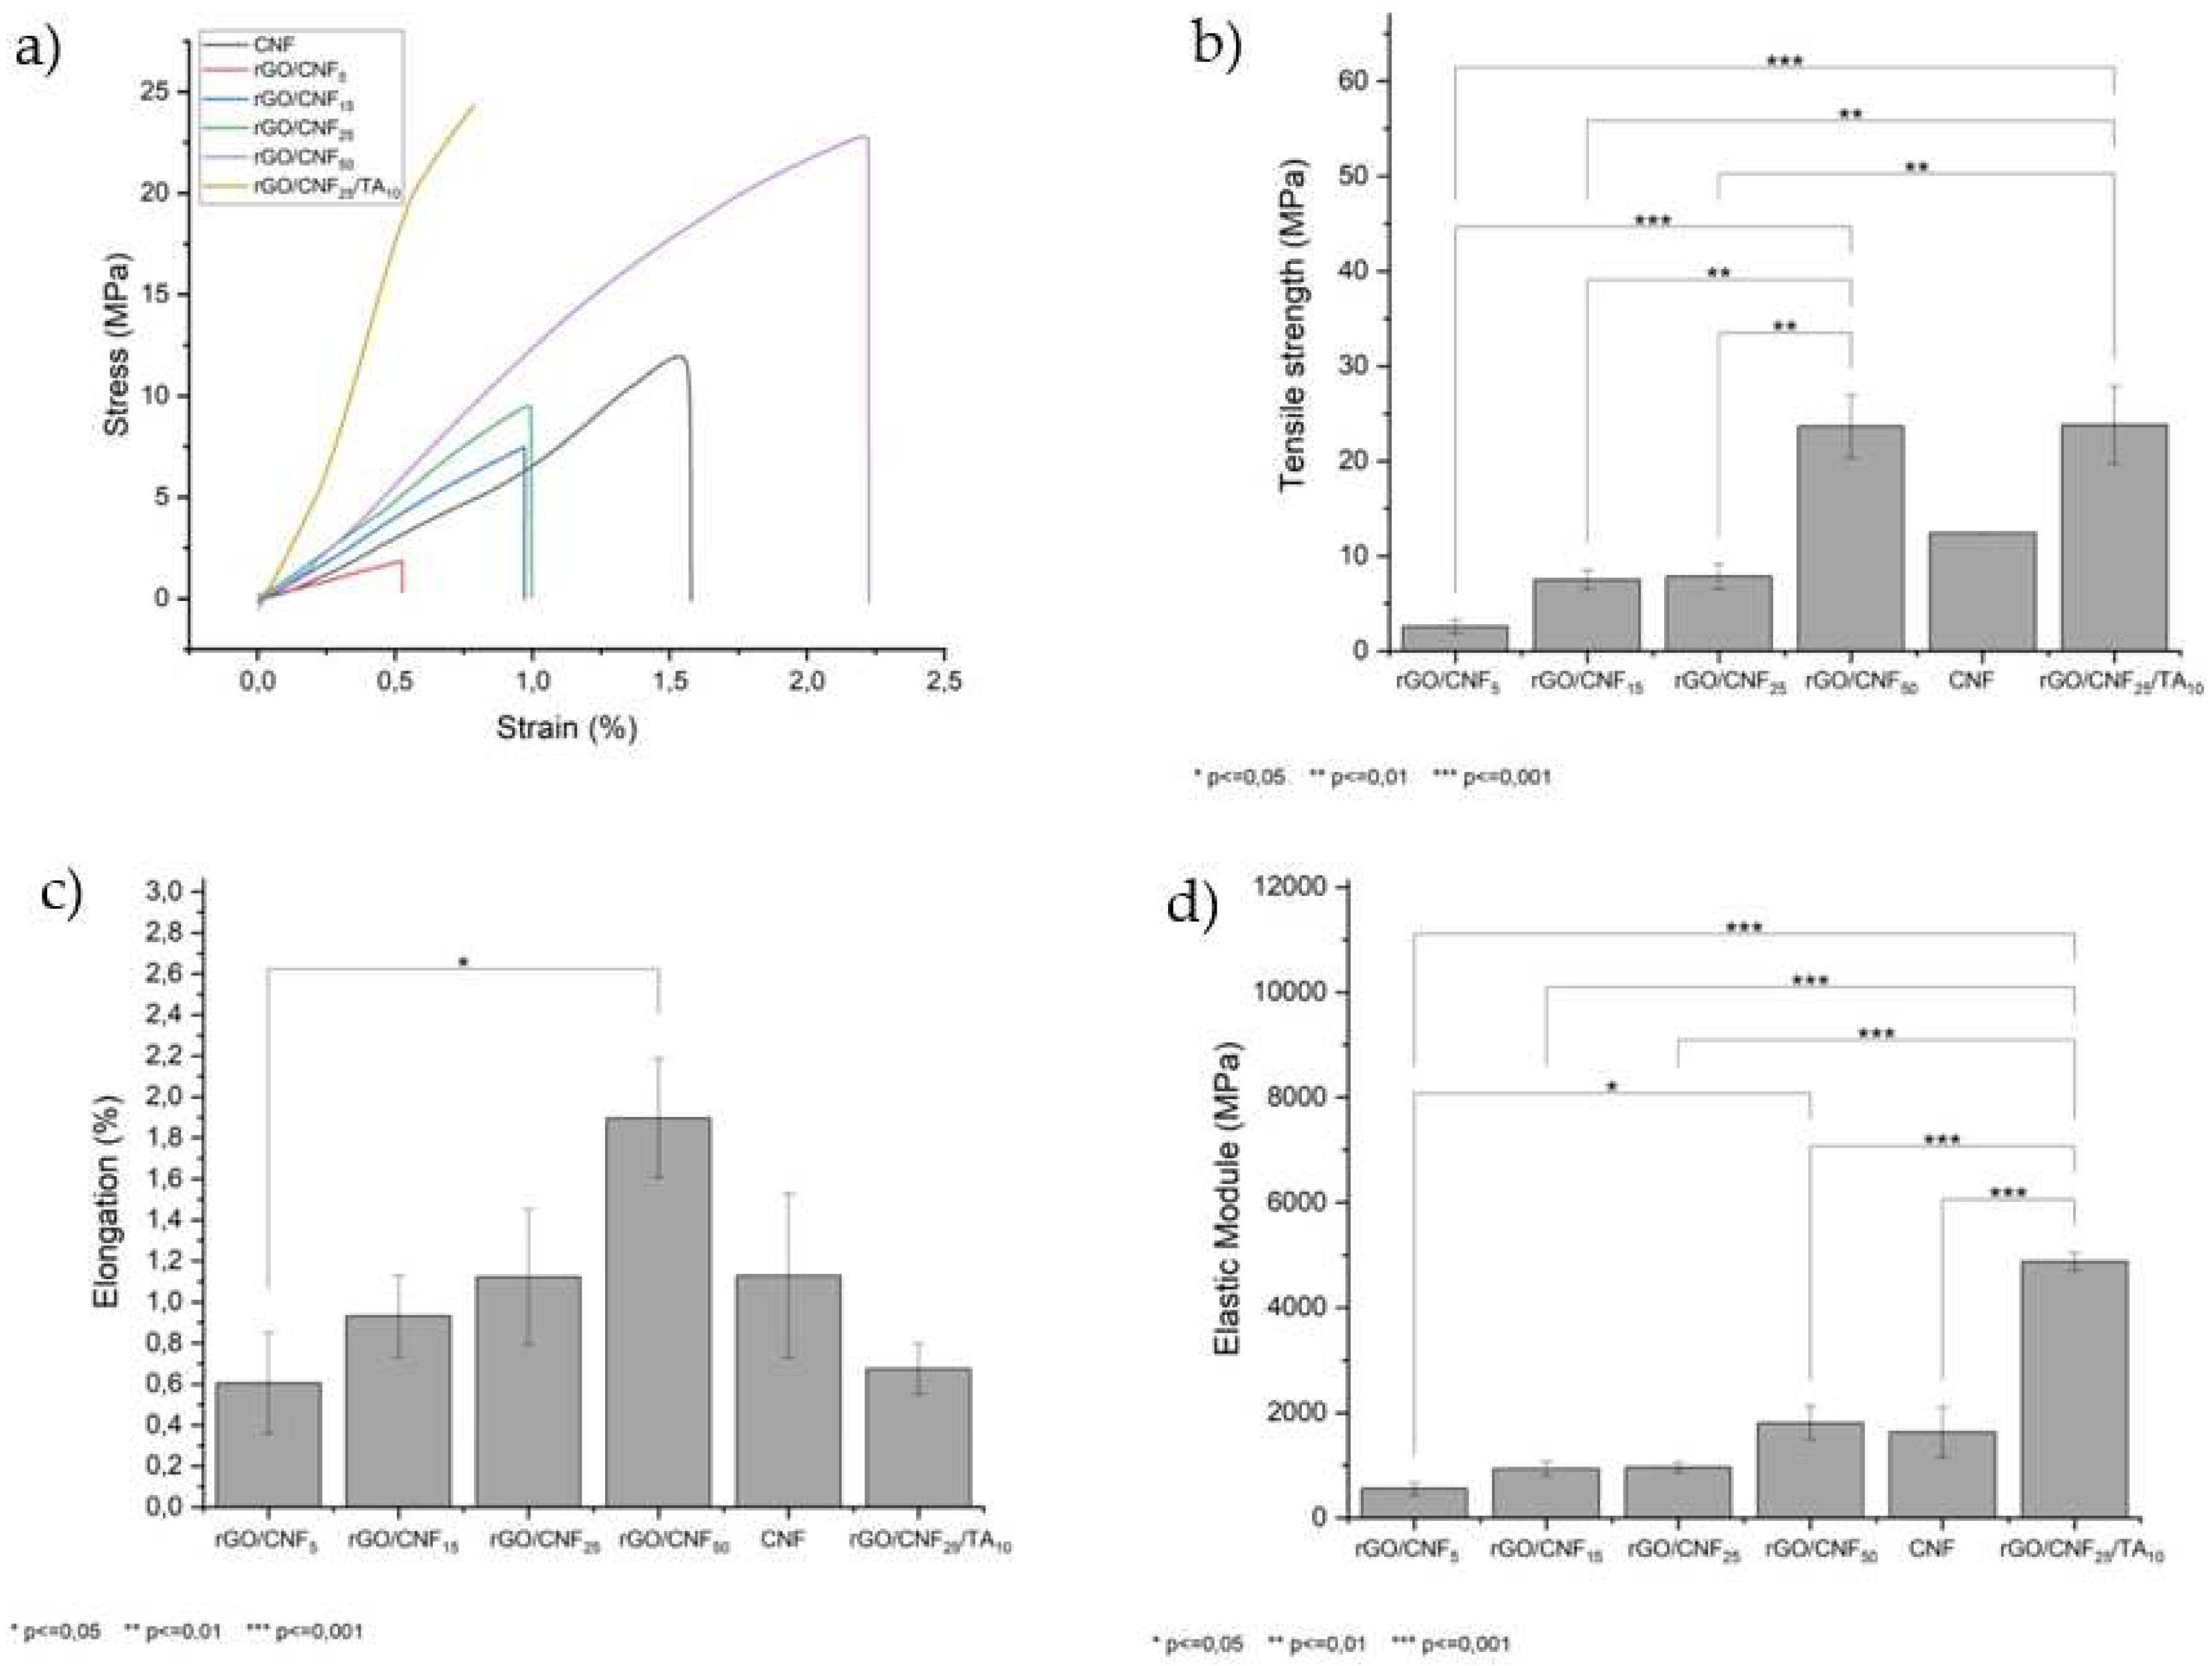
3.6. Tension and Deformation of Composite Materials
3.7. Cytotoxicity Assays
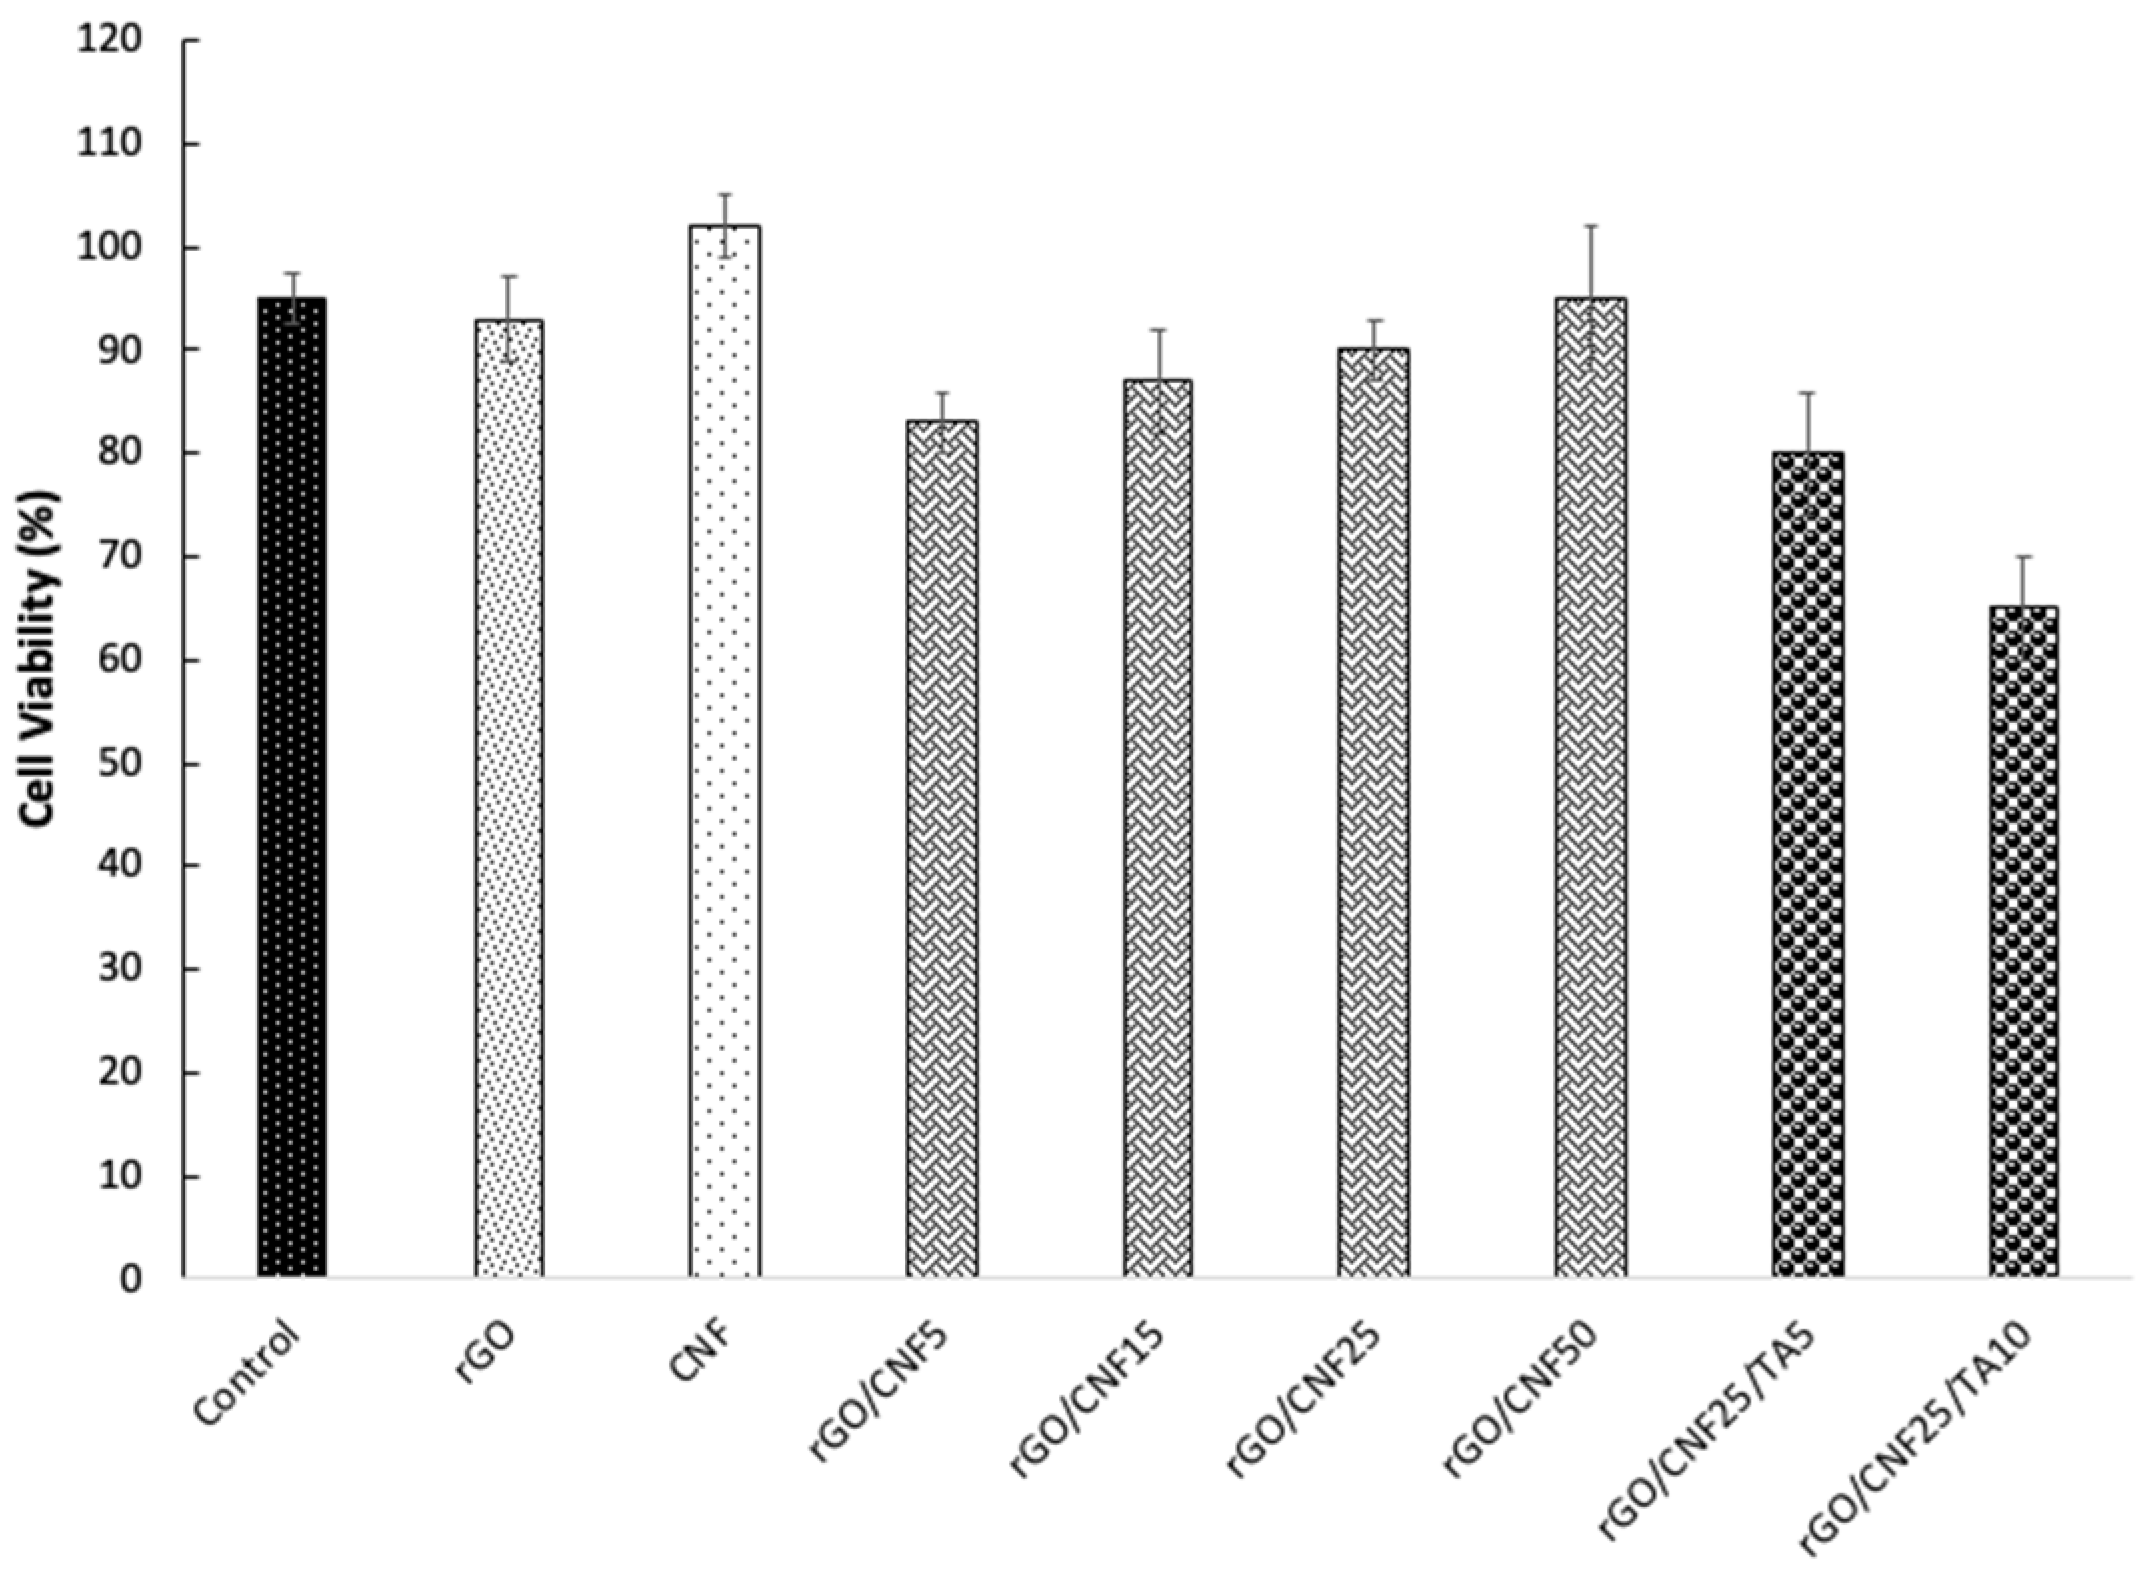
3.8. In Vitro Wound Healing Assay (Scratch Test)
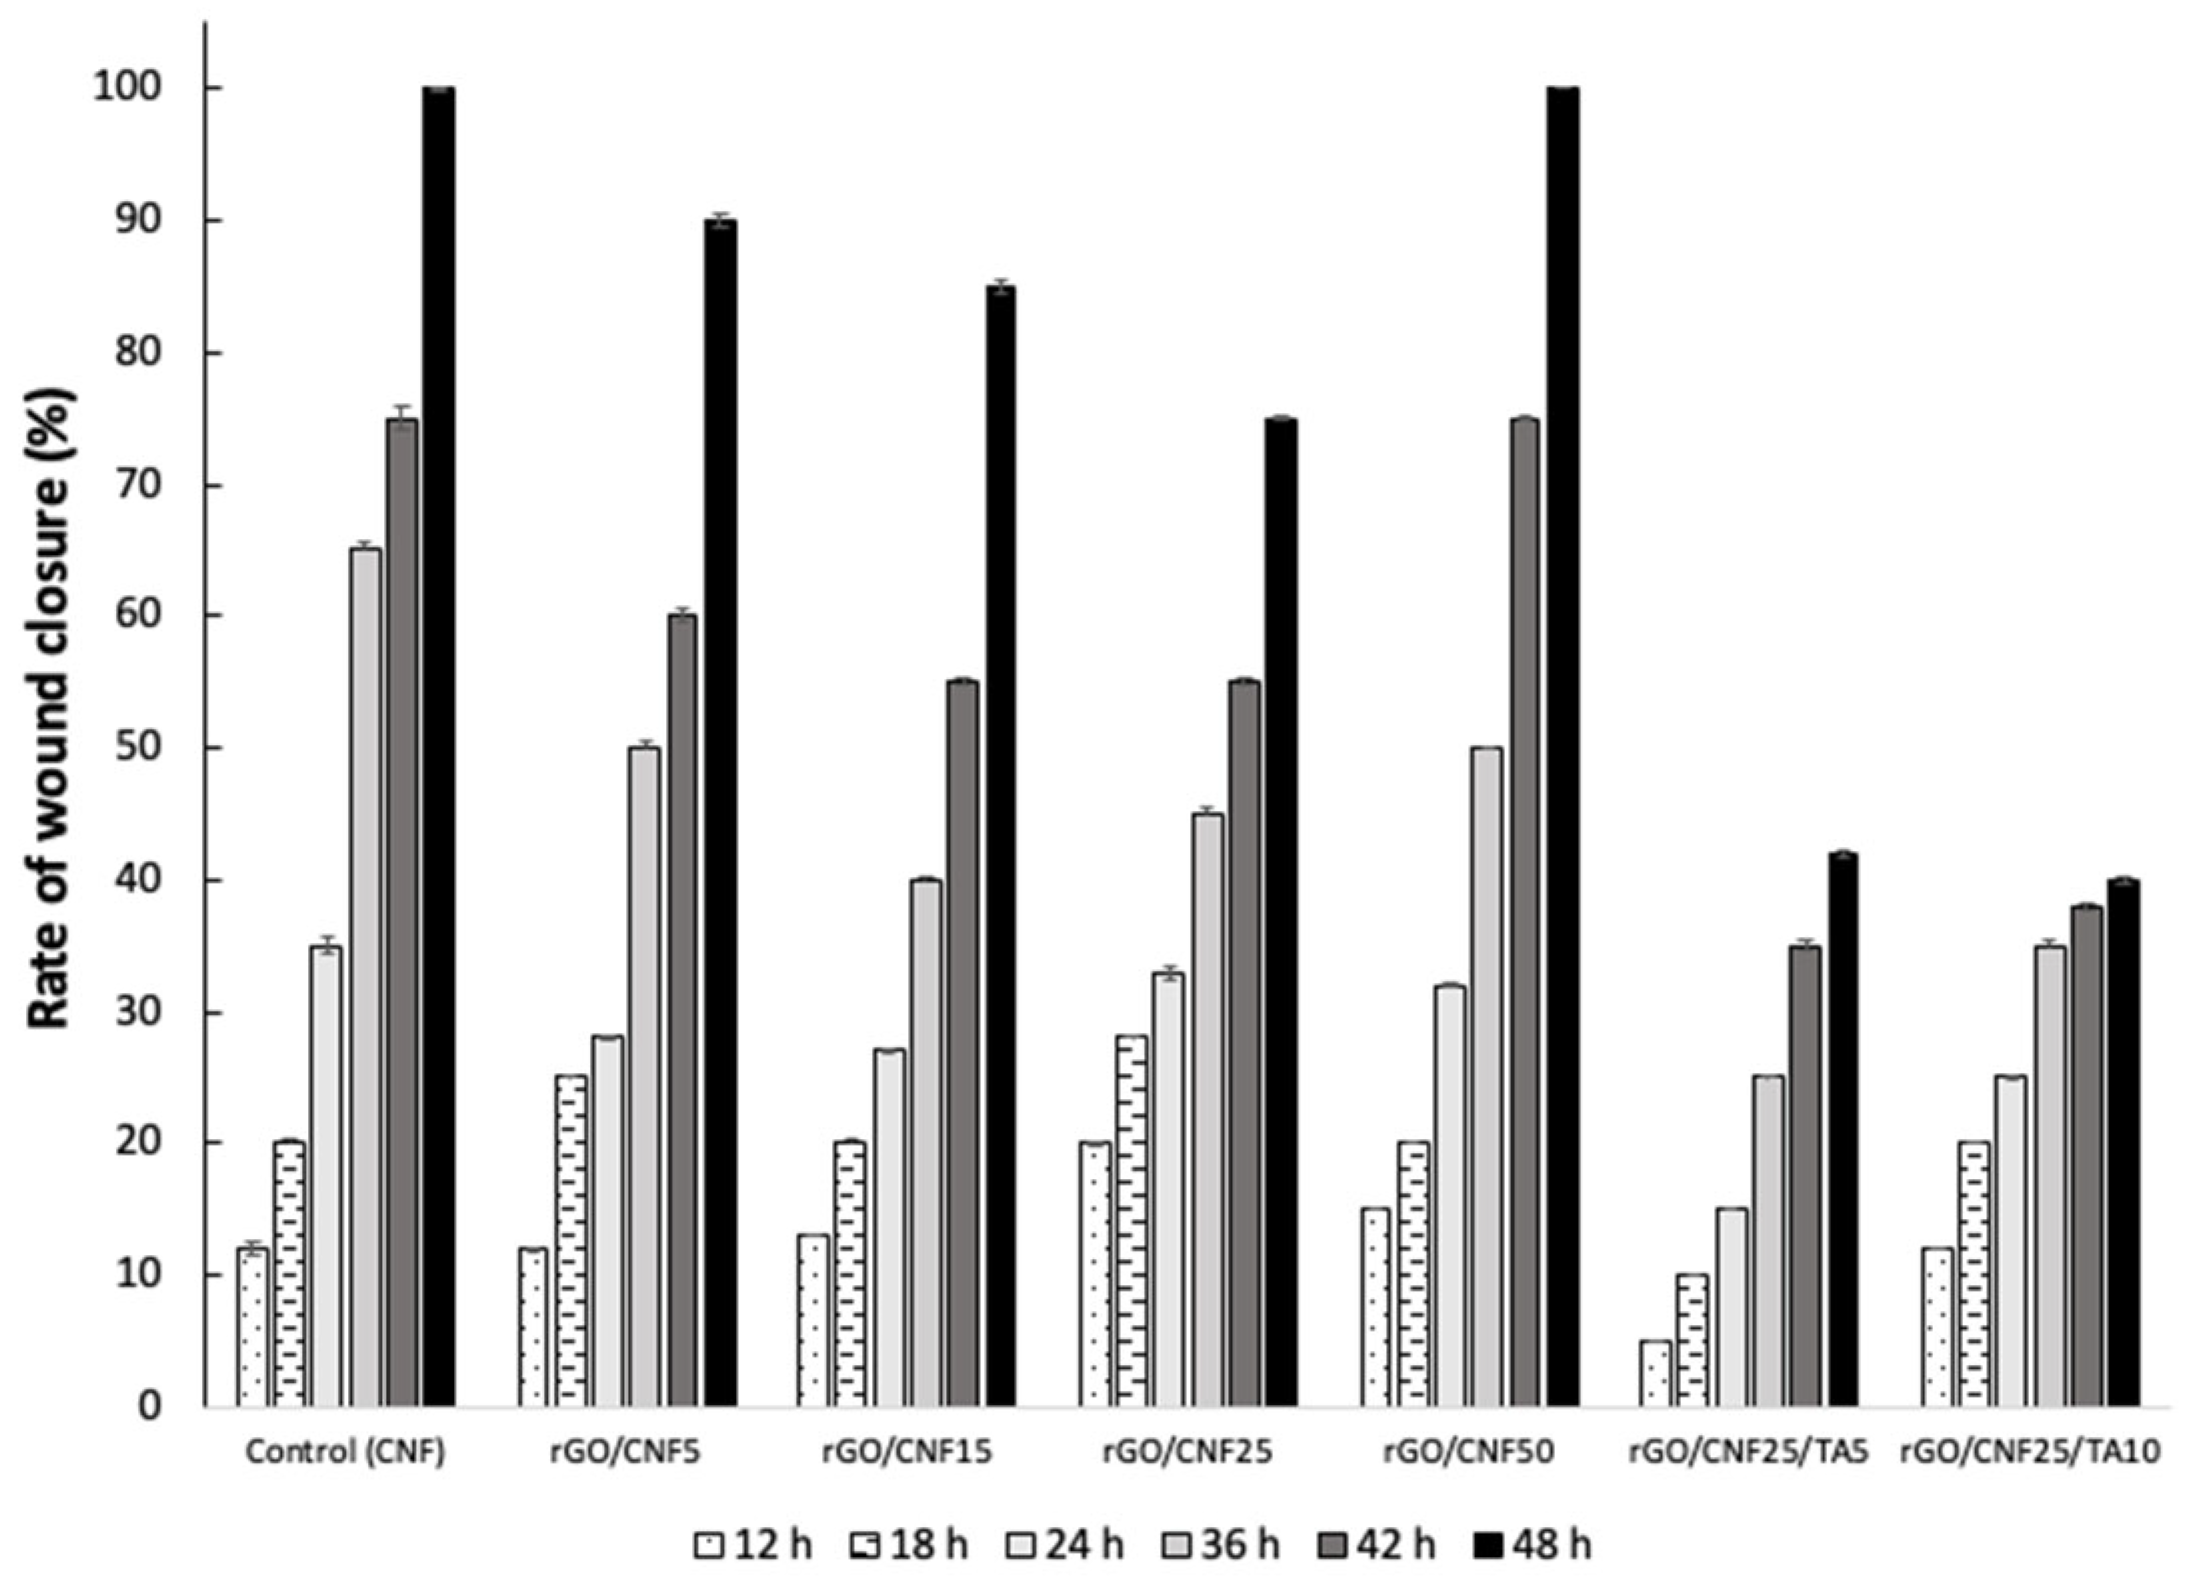
4. Conclusions
Supplementary Materials
Author Contributions
Funding
Institutional Review Board Statement
Data Availability Statement
Acknowledgments
Conflicts of Interest
References
- Payne, P.A., Measurement of properties and function of skin. Clinical Physics and Physiological Measurement, 1991. 12(2): p. 105-129. [CrossRef]
- Chua, A.W., et al., Skin tissue engineering advances in severe burns: review and therapeutic applications. Burns Trauma, 2016. 4: p. 3. [CrossRef]
- Zhong, S.P., Y.Z. Zhang, and C.T. Lim, Tissue scaffolds for skin wound healing and dermal reconstruction. Wiley Interdiscip Rev Nanomed Nanobiotechnol, 2010. 2(5): p. 510-25. [CrossRef]
- Balasubramani, M., T.R. Kumar, and M. Babu, Skin substitutes: a review. Burns, 2001. 27(5): p. 534-44. [CrossRef]
- Boateng, J. and O. Catanzano, Advanced Therapeutic Dressings for Effective Wound HealingA Review. Journal of Pharmaceutical Sciences, 2015. 104(11): p. 3653-3680. [CrossRef]
- Agrawal, P., et al., Role of polymeric biomaterials as wound healing agents. Int J Low Extrem Wounds, 2014. 13(3): p. 180-90. [CrossRef]
- Farber, P.L., F.C. Isoldi, and L.M. Ferreira, Electric Factors in Wound Healing. Advances in Wound Care, 2021. 10(8): p. 461-476. [CrossRef]
- Zhao, M., et al., Electrical signals control wound healing through phosphatidylinositol-3-OH kinase-gamma and PTEN. Nature, 2006. 442(7101): p. 457-60.
- Fan, Z., et al., A Novel Wound Dressing Based on Ag/Graphene Polymer Hydrogel: Effectively Kill Bacteria and Accelerate Wound Healing. Advanced Functional Materials, 2014. 24(25): p. 3933-3943. [CrossRef]
- Tang, P., et al., Mussel-Inspired Electroactive and Antioxidative Scaffolds with Incorporation of Polydopamine-Reduced Graphene Oxide for Enhancing Skin Wound Healing. ACS Applied Materials & Interfaces, 2019. 11(8): p. 7703-7714. [CrossRef]
- Fall, A.B., et al., Colloidal stability of aqueous nanofibrillated cellulose dispersions. Langmuir, 2011. 27(18): p. 11332-8. [CrossRef]
- Brakat, A. and H. Zhu, Nanocellulose-Graphene Derivative Hybrids: Advanced Structure-Based Functionality from Top-down Synthesis to Bottom-up Assembly. ACS Applied Bio Materials, 2021. 4(10): p. 7366-7401. [CrossRef]
- Wang, Y., et al., Stretchable, Conductive, and Self-Healing Hydrogel with Super Metal Adhesion. Chemistry of Materials, 2018. 30(13): p. 4289-4297. [CrossRef]
- Shin, S.R., et al., Graphene-based materials for tissue engineering. Adv Drug Deliv Rev, 2016. 105(Pt B): p. 255-274. [CrossRef]
- Huang, N., et al., Multifunctional Electrochemical Platforms Based on the Michael Addition/Schiff Base Reaction of Polydopamine Modified Reduced Graphene Oxide: Construction and Application. ACS Appl Mater Interfaces, 2015. 7(32): p. 17935-46. [CrossRef]
- Zhou, P., et al., Rapidly-deposited polydopamine coating via high temperature and vigorous stirring: formation, characterization and biofunctional evaluation. PLoS One, 2014. 9(11): p. e113087. [CrossRef]
- Huang, N., et al., Multifunctional Electrochemical Platforms Based on the Michael Addition/Schiff Base Reaction of Polydopamine Modified Reduced Graphene Oxide: Construction and Application. ACS Applied Materials & Interfaces, 2015. 7(32): p. 17935-17946. [CrossRef]
- Sileika, T.S., et al., Colorless Multifunctional Coatings Inspired by Polyphenols Found in Tea, Chocolate, and Wine. Angewandte Chemie International Edition, 2013. 52(41): p. 10766-10770. [CrossRef]
- Maugeri, A., et al., Pharmacology and toxicology of tannins. Archives of Toxicology, 2022. 96(5): p. 1257-1277. [CrossRef]
- Wang, Y., Z. Shi, and J. Yin, Facile Synthesis of Soluble Graphene via a Green Reduction of Graphene Oxide in Tea Solution and Its Biocomposites. ACS Applied Materials & Interfaces, 2011. 3(4): p. 1127-1133. [CrossRef]
- Zeng, J., et al., Cellulose nanofibrils manufactured by various methods with application as paper strength additives. Scientific Reports, 2021. 11(1): p. 11918. [CrossRef]
- Andrade, A., et al., Effect of the chemical and structural characteristics of pulps of Eucalyptus and Pinus on the deconstruction of the cell wall during the production of cellulose nanofibrils. Cellulose, 2021. 28(9): p. 5387-5399. [CrossRef]
- Ghose, T.K., Measurement of cellulase activities. Pure and Applied Chemistry, 1987. 59(2): p. 257-268. [CrossRef]
- Marcano, D.C., et al., Improved Synthesis of Graphene Oxide (vol 4, pg 4806, 2010). Acs Nano, 2018. 12(2): p. 2078-2078.
- Bocalandro, C., et al., Comparison of the composition of Pinus radiata bark extracts obtained at bench- and pilot-scales. Industrial Crops and Products, 2012. 38: p. 21-26. [CrossRef]
- Wei, J., et al., Bioinspired 3D Printable, Self-Healable, and Stretchable Hydrogels with Multiple Conductivities for Skin-like Wearable Strain Sensors. ACS Applied Materials & Interfaces, 2021. 13(2): p. 2952-2960. [CrossRef]
- Schuhladen, K., et al., Production of a novel poly(ɛ-caprolactone)-methylcellulose electrospun wound dressing by incorporating bioactive glass and Manuka honey. J Biomed Mater Res B Appl Biomater, 2021. 109(2): p. 180-192. [CrossRef]
- Li, M.Z., et al., A novel graphene-based micro/nano architecture with high strength and conductivity inspired by multiple creatures. Scientific Reports, 2021. 11(1). [CrossRef]
- Hsu, H.H., et al., An Eco-Friendly, Nanocellulose/RGO/in Situ Formed Polyaniline for Flexible and Free-Standing Supercapacitors. Acs Sustainable Chemistry & Engineering, 2019. 7(5): p. 4766-4776. [CrossRef]
- Faniyi, I.O., et al., The comparative analyses of reduced graphene oxide (RGO) prepared via green, mild and chemical approaches. SN Applied Sciences, 2019. 1(10): p. 1181. [CrossRef]
- Wang, J., et al., Nanocellulose-assisted low-temperature synthesis and supercapacitor performance of reduced graphene oxide aerogels. Journal of Power Sources, 2017. 347: p. 259-269. [CrossRef]
- Song, J., X. Wang, and C.-T. Chang, Preparation and Characterization of Graphene Oxide. Journal of Nanomaterials, 2014. 2014: p. 276143. [CrossRef]
- Hsu, H.H., et al., An Eco-Friendly, Nanocellulose/RGO/in Situ Formed Polyaniline for Flexible and Free-Standing Supercapacitors. ACS Sustainable Chemistry & Engineering, 2019. 7(5): p. 4766-4776. [CrossRef]
- Soto, R., J. Freer, and J. Baeza, Evidence of chemical reactions between di- and poly-glycidyl ether resins and tannins isolated from Pinus radiata D. Don bark. Bioresource Technology, 2005. 96(1): p. 95-101. [CrossRef]
- Zhu, Y.H., et al., The synthesis of tannin-based graphene aerogel by hydrothermal treatment for removal of heavy metal ions. Industrial Crops and Products, 2022. 176. [CrossRef]
- Gu, R.P., W.Z. Xu, and P.A. Charpentier, Synthesis of polydopamine-coated graphene-polymer nanocomposites via RAFT polymerization. Journal of Polymer Science Part a-Polymer Chemistry, 2013. 51(18): p. 3941-3949. [CrossRef]
- Liao, J.M., et al., Antibacterial Performance of a Mussel-Inspired Polydopamine-Treated Ag/Graphene Nanocomposite Material. Materials, 2019. 12(20). [CrossRef]
- Mohaiyiddin, M.S., et al., Characterization of nanocellulose recovery from Elaeis guineensis frond for sustainable development. Clean Technologies and Environmental Policy, 2016. 18(8): p. 2503-2512. [CrossRef]
- Liu, X.R., et al., Thiol-branched graphene oxide and polydopamine-induced nanofibrillated cellulose to strengthen protein-based nanocomposite films. Cellulose, 2019. 26(12): p. 7223-7236. [CrossRef]
- Liu, X., et al., Thiol-branched graphene oxide and polydopamine-induced nanofibrillated cellulose to strengthen protein-based nanocomposite films. Cellulose, 2019. 26(12): p. 7223-7236. [CrossRef]
- Li, M., et al., Preparation of and research on bioinspired graphene oxide/nanocellulose/polydopamine ternary artificial nacre. Materials & Design, 2019. 181. [CrossRef]
- Gan, P.G., et al., Thermal properties of nanocellulose-reinforced composites: A review. Journal of Applied Polymer Science, 2020. 137(11): p. 48544. [CrossRef]
- Zhao, Y., et al., Mechanical Reinforcement in Nylon 6 Nanocomposite Fiber Incorporated with Dopamine Reduced Graphene Oxide. Materials, 2022. 15(15): p. 5095. [CrossRef]
- Nguyen Dang, L. and J. Seppälä, Electrically conductive nanocellulose/graphene composites exhibiting improved mechanical properties in high-moisture condition. Cellulose, 2015. 22(3): p. 1799-1812. [CrossRef]
- Ding, Z.J., Y.J. Tang, and P. Zhu, Reduced graphene oxide/cellulose nanocrystal composite films with high specific capacitance and tensile strength. International Journal of Biological Macromolecules, 2022. 200: p. 574-582. [CrossRef]
- Anikushin, B.M., et al., Zeta Potential of Nanosized Particles of Cellulose as a Function of pH. Chemistry and Technology of Fuels and Oils, 2022. 57(6): p. 913-916. [CrossRef]
- Simsek, B., et al., Improvement of the Graphene Oxide Dispersion Properties with the Use of TOPSIS Based Taguchi Application. Periodica Polytechnica-Chemical Engineering, 2018. 62(3): p. 323-335. [CrossRef]
- Guo, Q., et al., Fabrication of Super Extensible and Highly Tough Graphene Composite Hydrogels by Thermal Treatment Strategy for the Mixture of Tannin and Graphene Oxide. Macromolecular Chemistry and Physics, 2017. 218(6): p. 1600549. [CrossRef]
- He, F., et al., Structure-Dependent Eco-Toxicity of Vegetable Tannin. Processes, 2022. 10(5): p. 816. [CrossRef]
- Schmidt, A.J., et al., Impact of Plant Extracts Tested in Attention-Deficit/Hyperactivity Disorder Treatment on Cell Survival and Energy Metabolism in Human Neuroblastoma SH-SY5Y Cells. Phytotherapy Research, 2010. 24(10): p. 1549-1553. [CrossRef]
- Schmidt, C.A., et al., Catechin Derivatives from Parapiptadenia rigida with in Vitro Wound-Healing Properties. Journal of Natural Products, 2010. 73(12): p. 2035-2041. [CrossRef]
Disclaimer/Publisher’s Note: The statements, opinions and data contained in all publications are solely those of the individual author(s) and contributor(s) and not of MDPI and/or the editor(s). MDPI and/or the editor(s) disclaim responsibility for any injury to people or property resulting from any ideas, methods, instructions or products referred to in the content. |
© 2023 by the authors. Licensee MDPI, Basel, Switzerland. This article is an open access article distributed under the terms and conditions of the Creative Commons Attribution (CC BY) license (http://creativecommons.org/licenses/by/4.0/).


