1. Introduction
The ceramic of ZYTO system is popular candidate for the next generation of thermal barrier coatings, with advantages such as thermodynamic stability [
1,
2] at high temperature, resistance to harmful phase transformation, low thermal conductivity [
3,
4], potential strength and toughness [
5,
6]. However, the fracture toughness of ZYTO system is higher than some traditional ceramics but not compared with the YSZ [
7], this weakness will shorten its service life as thermal barrier coating. Therefore, the toughening mechanism of ZYTO system has aroused widespread concern of scholars. As we know, several toughening mechanism in ZYTO system, such as phase transition toughening and ferroelastic toughening, which maximizes the toughness of ceramic and enhances their practicability in practical applications [
8,
11]. In this paper, we focus on the mechanism that the second phase M-YTaO4 affects the toughening by changing the crack behavior, based on that, we try to determine the best toughening formula of the M-YTaO
4 doping.
This paper studies the mechanical properties characterization and crack growth mode of fluorite field and M-YTaO4 field in ZYTO system. The M-YTaO4 solid solution was studied by XRD and EDS, the distribution of the second phase was observed under SEM, and several crack propagation behaviors were studied. The fined grain, phases stability, interface binding and residual stress of composites are shown to be influenced by the second phase doping content. We try to find some answers for several remaining problems. First, are the crack propagation behaviors and the fracture toughness sensitively dependent on composition? Second, the ferroelastic toughening and the second phase toughening are cooperation or competition. Moreover, does the best toughening formula exist for this composite ceramic?
2. Material and Methods
ZYTO composite ceramic powders were prepared by chemical coprecipitation and calcination. First, five groups of YT1-YT5 samples were set in x mol%Ta2O5(x=10/20/30/40/50) increments. All samples were prepared by chemical coprecipitate using precursor solutions of ZrO(NO3)2 (≥99.99%), Y(NO3)3·6H2O (≥99.99%) and TaCl5 (≥99.99%). The pH of the solution is maintained above 10 to ensure the precipitation of all the mixed cations at the molecular level. we was to separate the solution and hydroxide precipitate by centrifuge, clean twice with ethanol, and dry in a drying oven for 12h. To ensure full conversion of tantalum-rich hydroxide to oxide, the pyrolysis was then conducted at 1300℃ for 5 hours. The obtained powder was pressed into a single shaft at ~200 MPa and sintered in air at 1500℃ for 10 hours.
Vickers hardness (
HV) is measured by indentation method. The indentation hardness Test and analysis system (ZHVST-30F, China) was used for measurement on the polished surface of the sample with a load of 10s at 29.8N. At least 6 effective indentations per sample. Fracture toughness (
KIC) was calculated by Ref [
12]:
where
Hv is Vickers hardness,
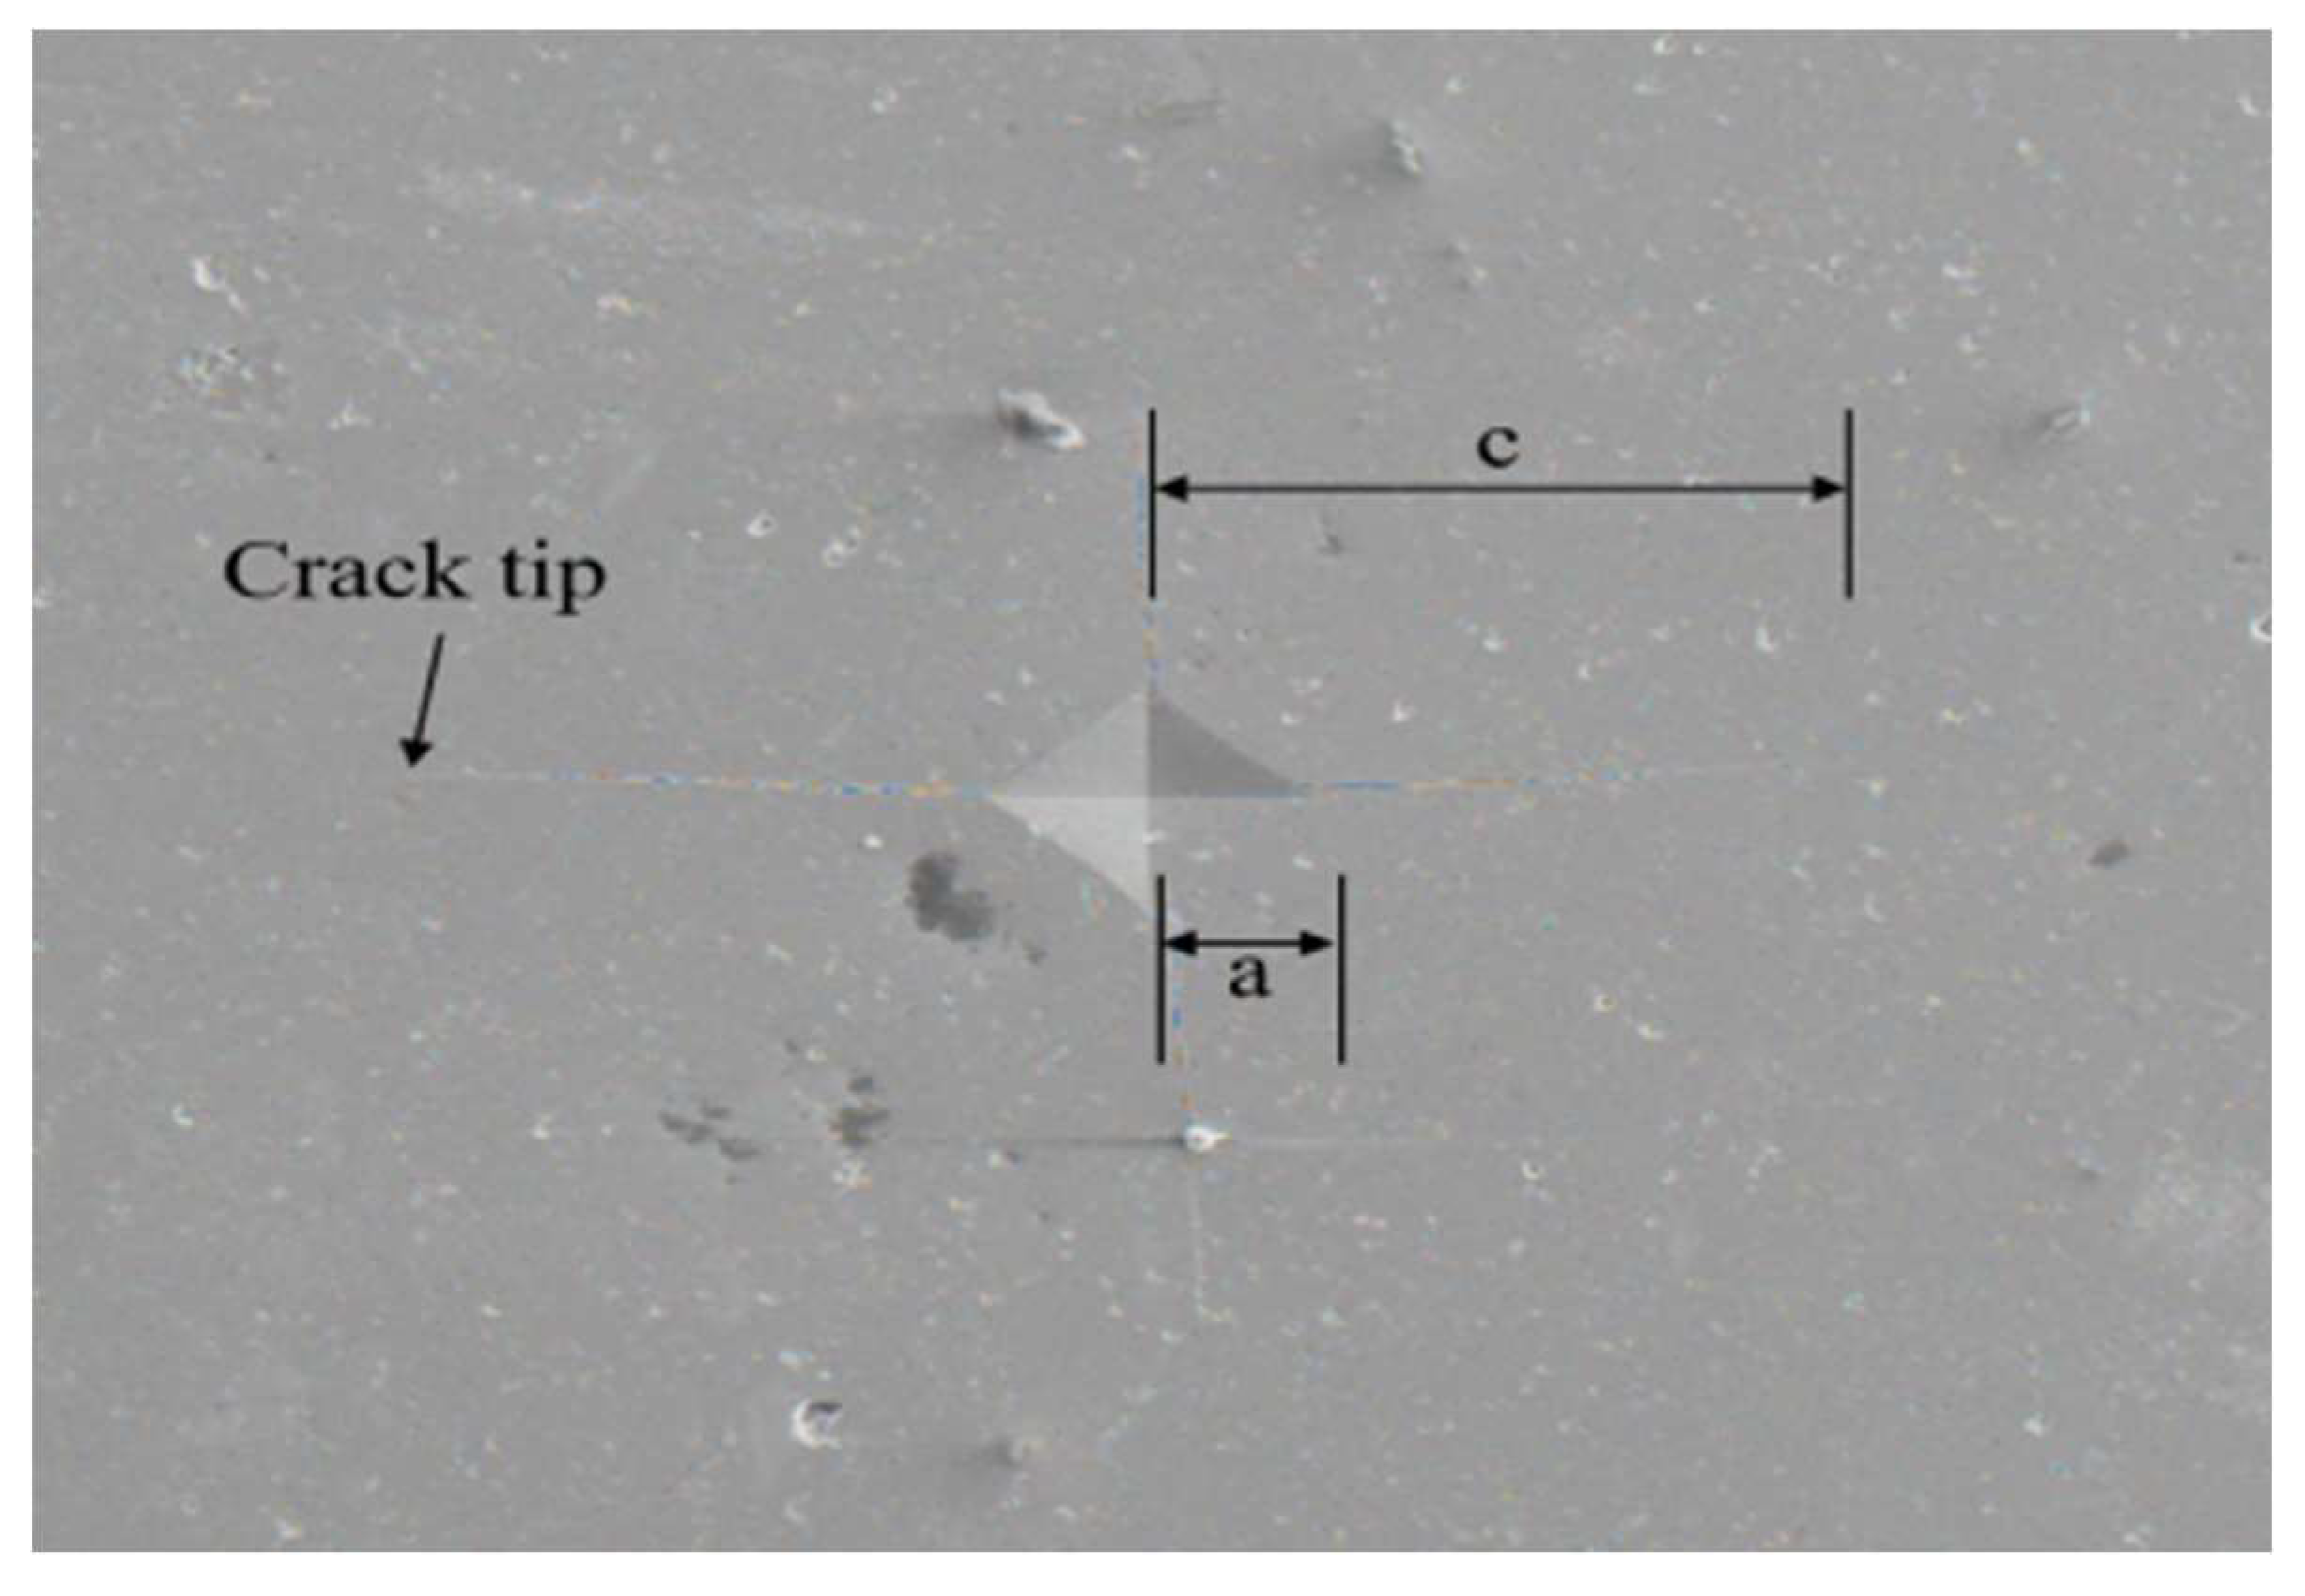
a is the half length of the diagonal of the indent, and
c is the half crack length measured from the middle of the dent to the crack tip, as shown in
Figure 1.
The critical energy release rate Γ (fracture energy) refers to the ability to resist the fracture, is the actual crack propagation parameter, a dynamic evolutionary variable indicating the energy required to propagate a certain length of crack. The Γ is N·m/m2 or J/m2. Therefore, the Γ is also understood as the energy provided by the system with each unit area of crack propagation or the force provided by the system with each unit length of crack propagation. The Γ, is also called the driving force or the fracture energy. The formula is:
where ξ value is 0.016(±0.004) calibration constant, P is loading force, a is the half length of the diagonal of the indent, c is the average crack length measured from the indentation center.
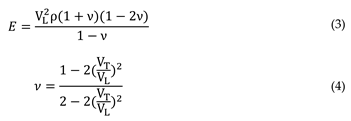
Young's modulus (
E) can be measured by the UMS Advanced Ultrasonic Material Characterization System (UMS-100, Rohde Schwarz, Germany). Young's modulus can be obtained by the following formula [
13,
14]:
where
vT is transverse sound speed,
vL is longitudinal sound speeds,
ν is the Poisson's ratio and
ρ is the density and measured by Archimedes' principle shown in
Table 1.
3. Results and Discussion
3.1. Microstructure Characterization
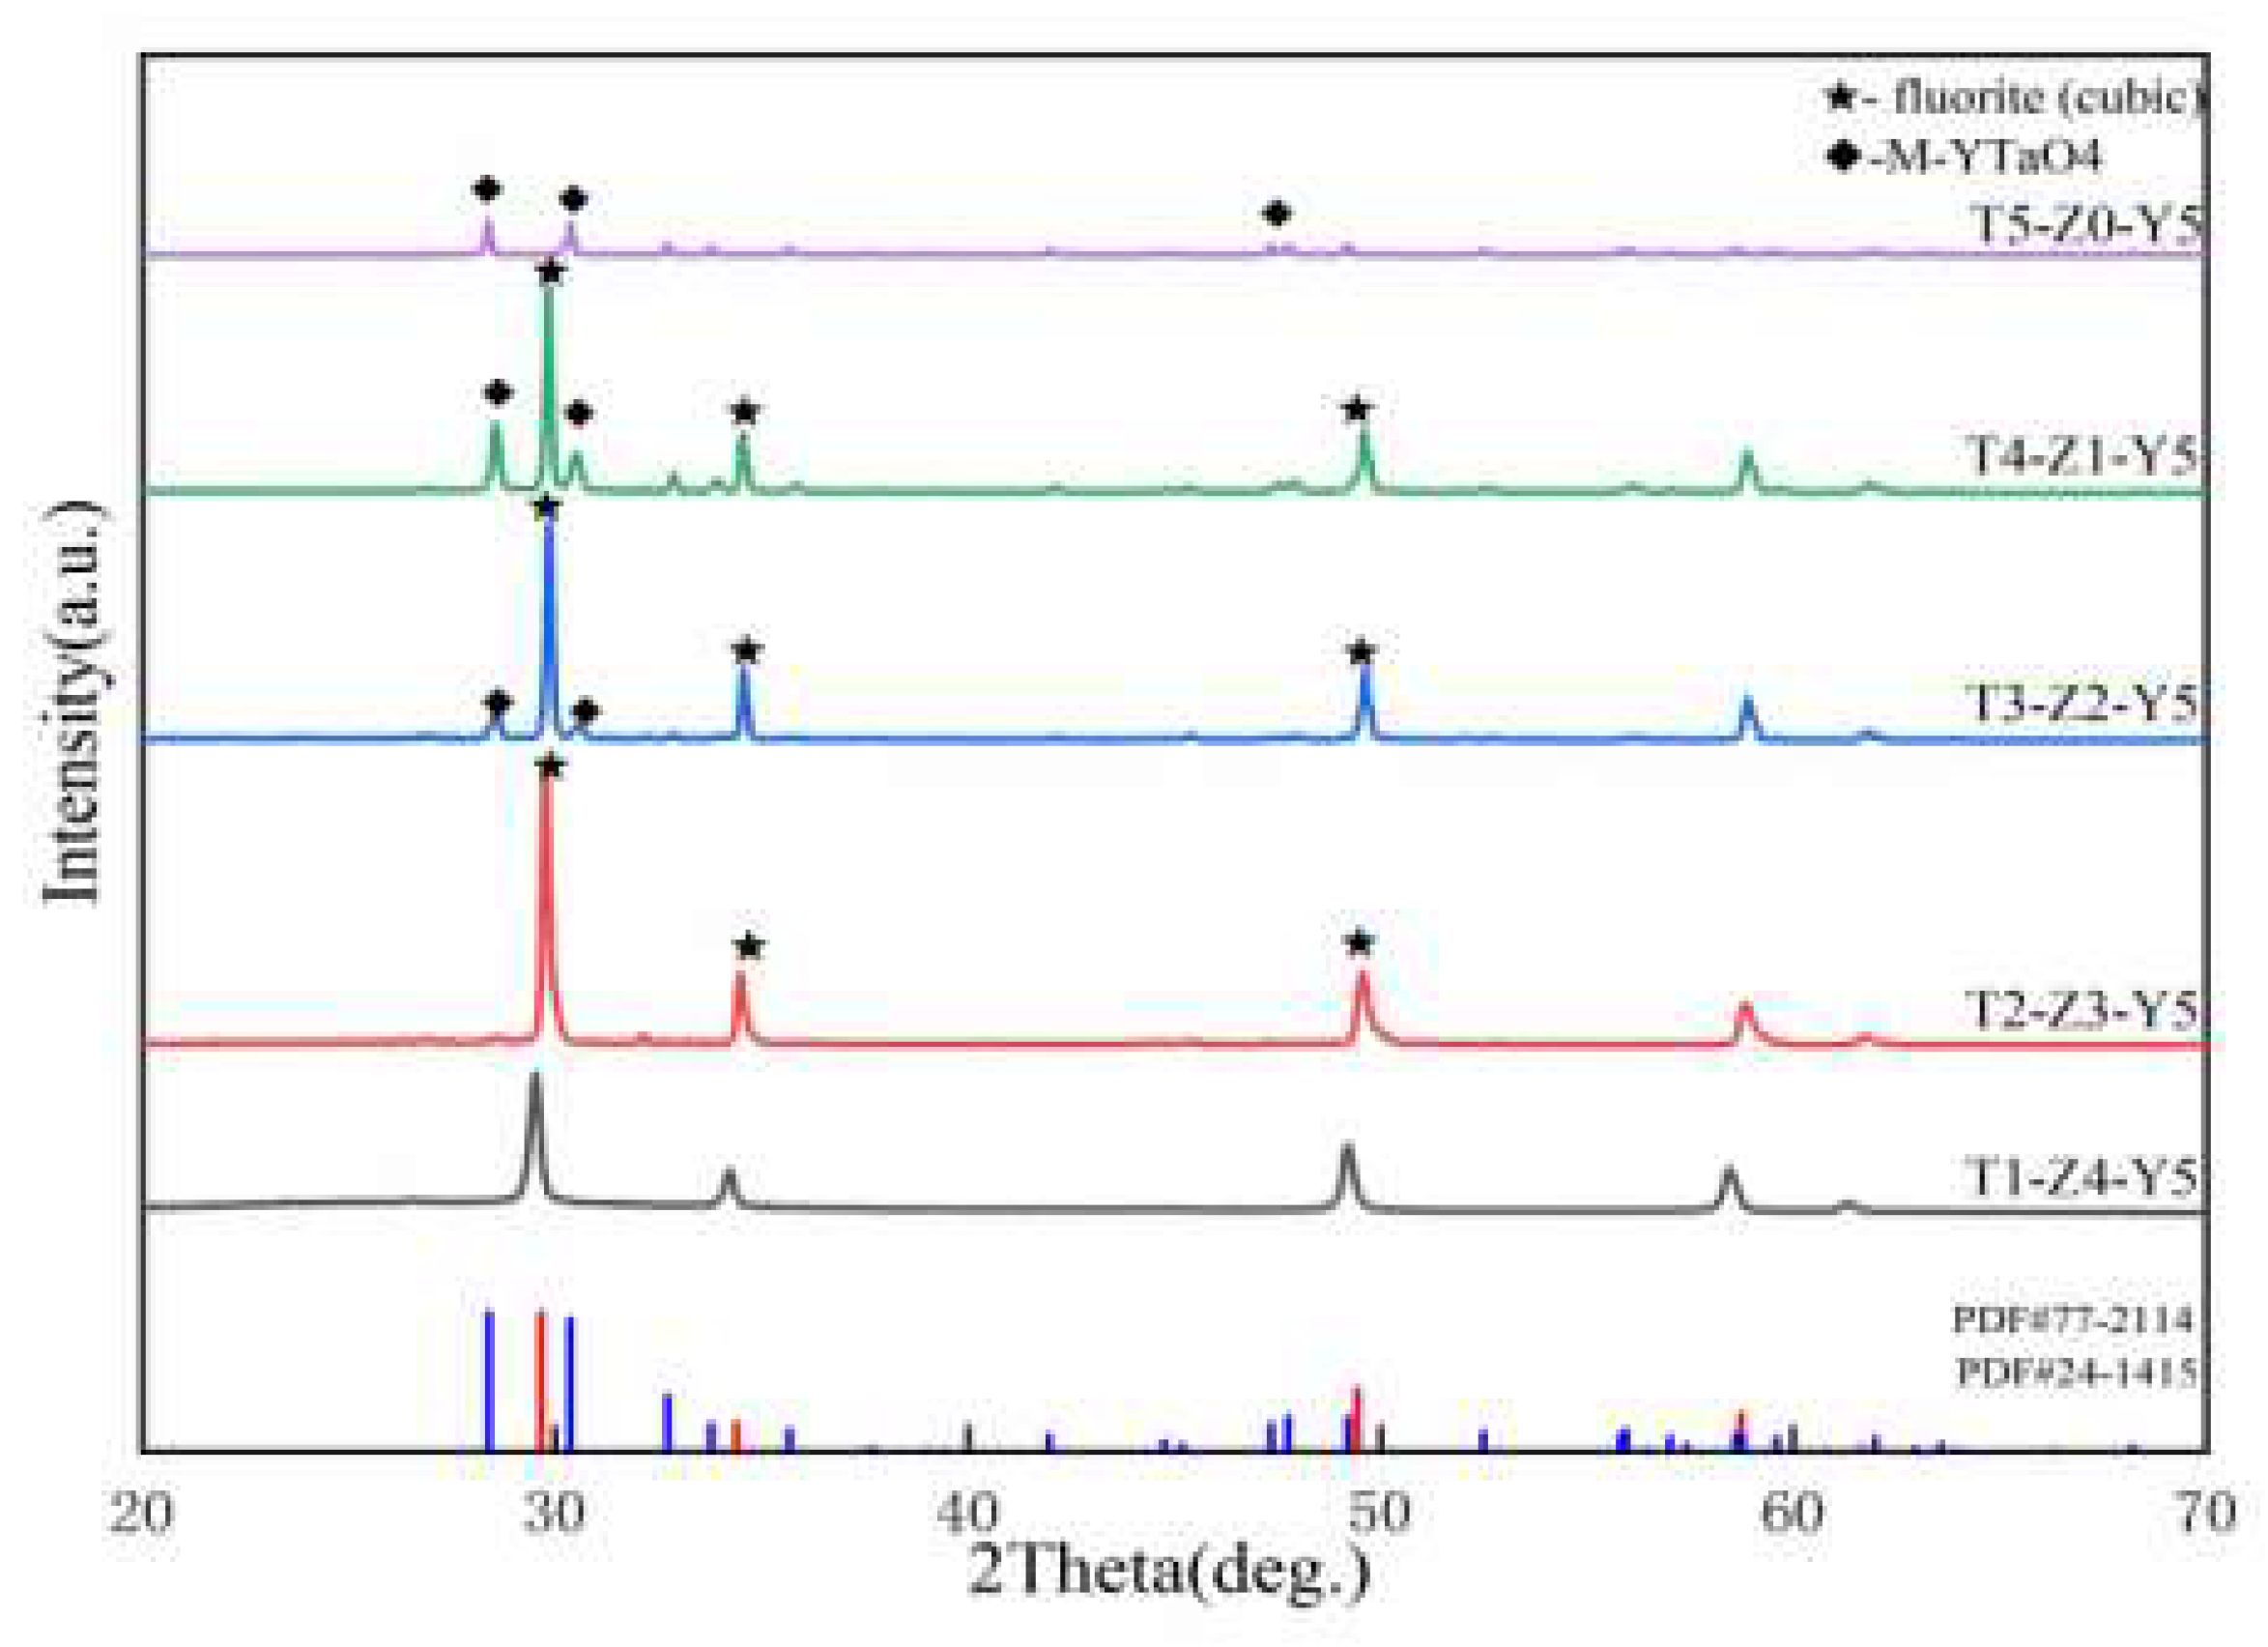
The XRD patterns of ZYTO composites are shown in
Figure 2. The XRD reflections of fluorite phase and M-YTaO
4 are fluorite and scheelite structures.
Figure 2 shows that with the increase of M-YTaO
4 content, scheelite peak increases, indicating the increase of scheelite phase amount. Only the fluorite phase and the M-YTaO
4 phase were detected in the composite, revealing that no chemical reaction between the fluorite phase and M-YTaO
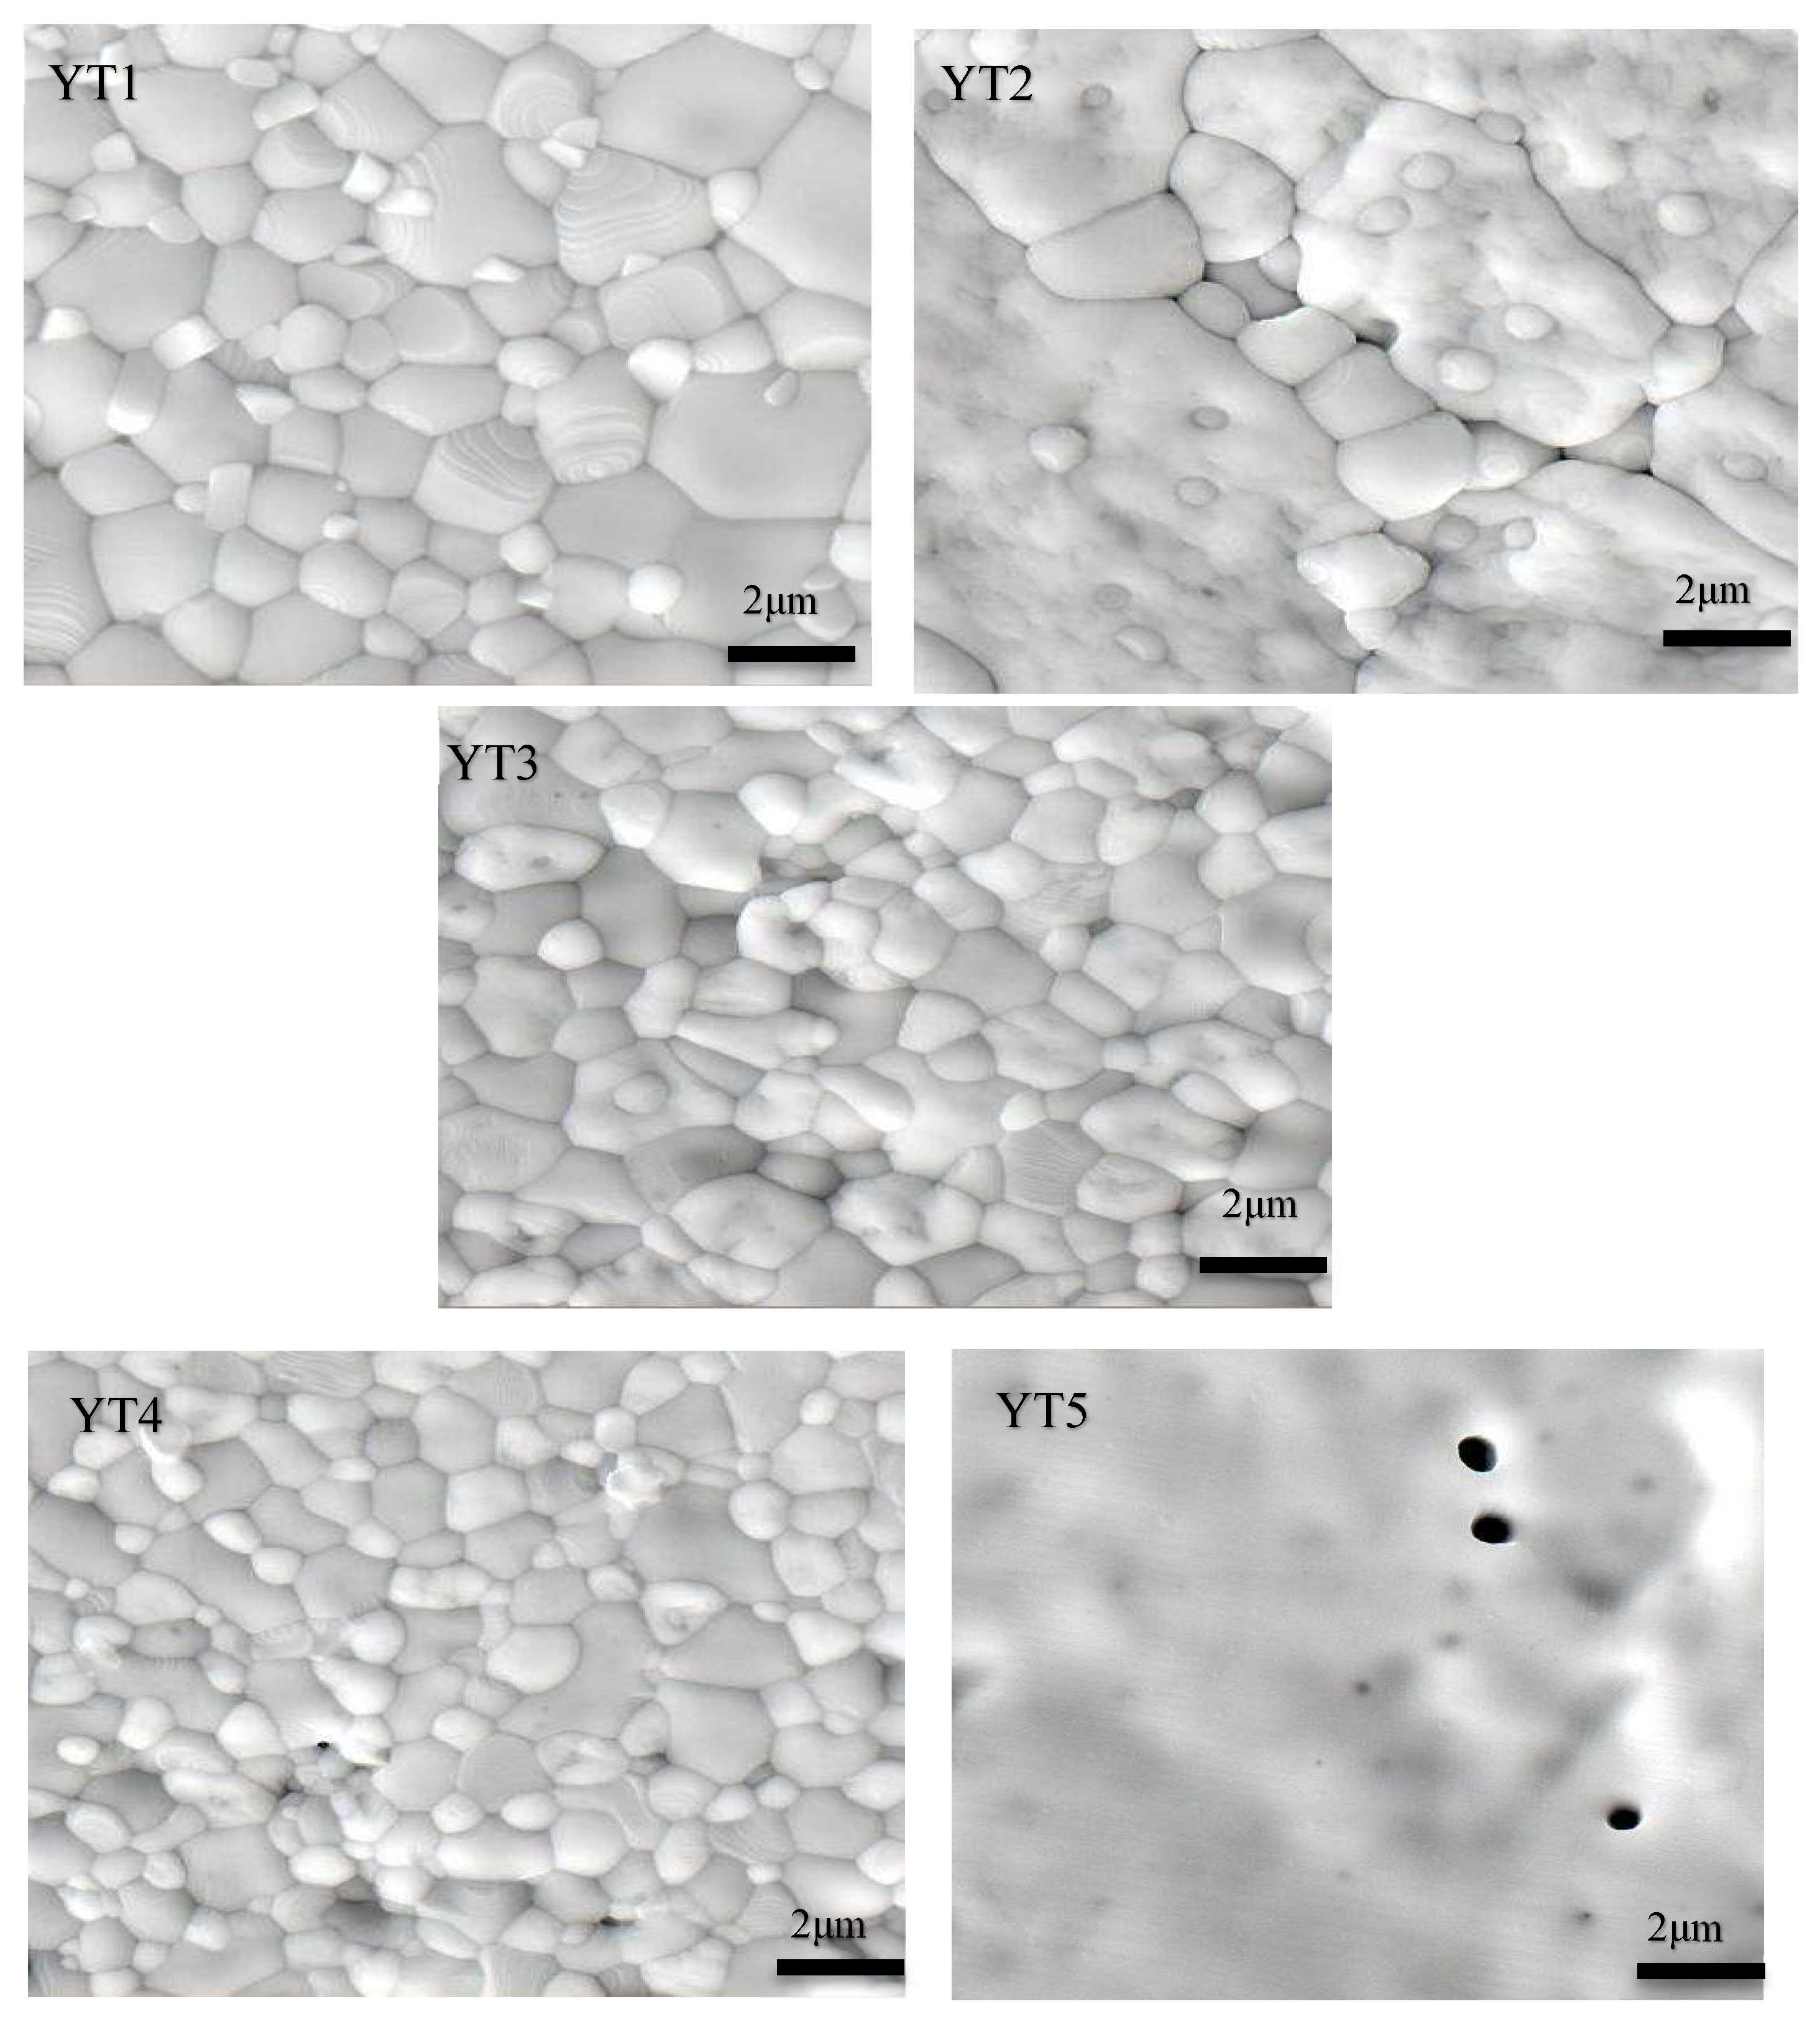
4. We analyse the phase distribution by means of scanning electron microscopy (SEM) equipped with Energy dispersion spectrometer (EDS). Surface SEM images of hot-etched ZYTO pellets are shown in
Figure 3. In the image of the YT1-YT4, grains with light is the M-YTaO
4, dark is the fluorite phase, the clear contrasts are observed. With the increase of the doping content, fluorite grain sizes further decreases.
The linear intercept method [
15] was used to estimate the average grain size in the composite. As shown in
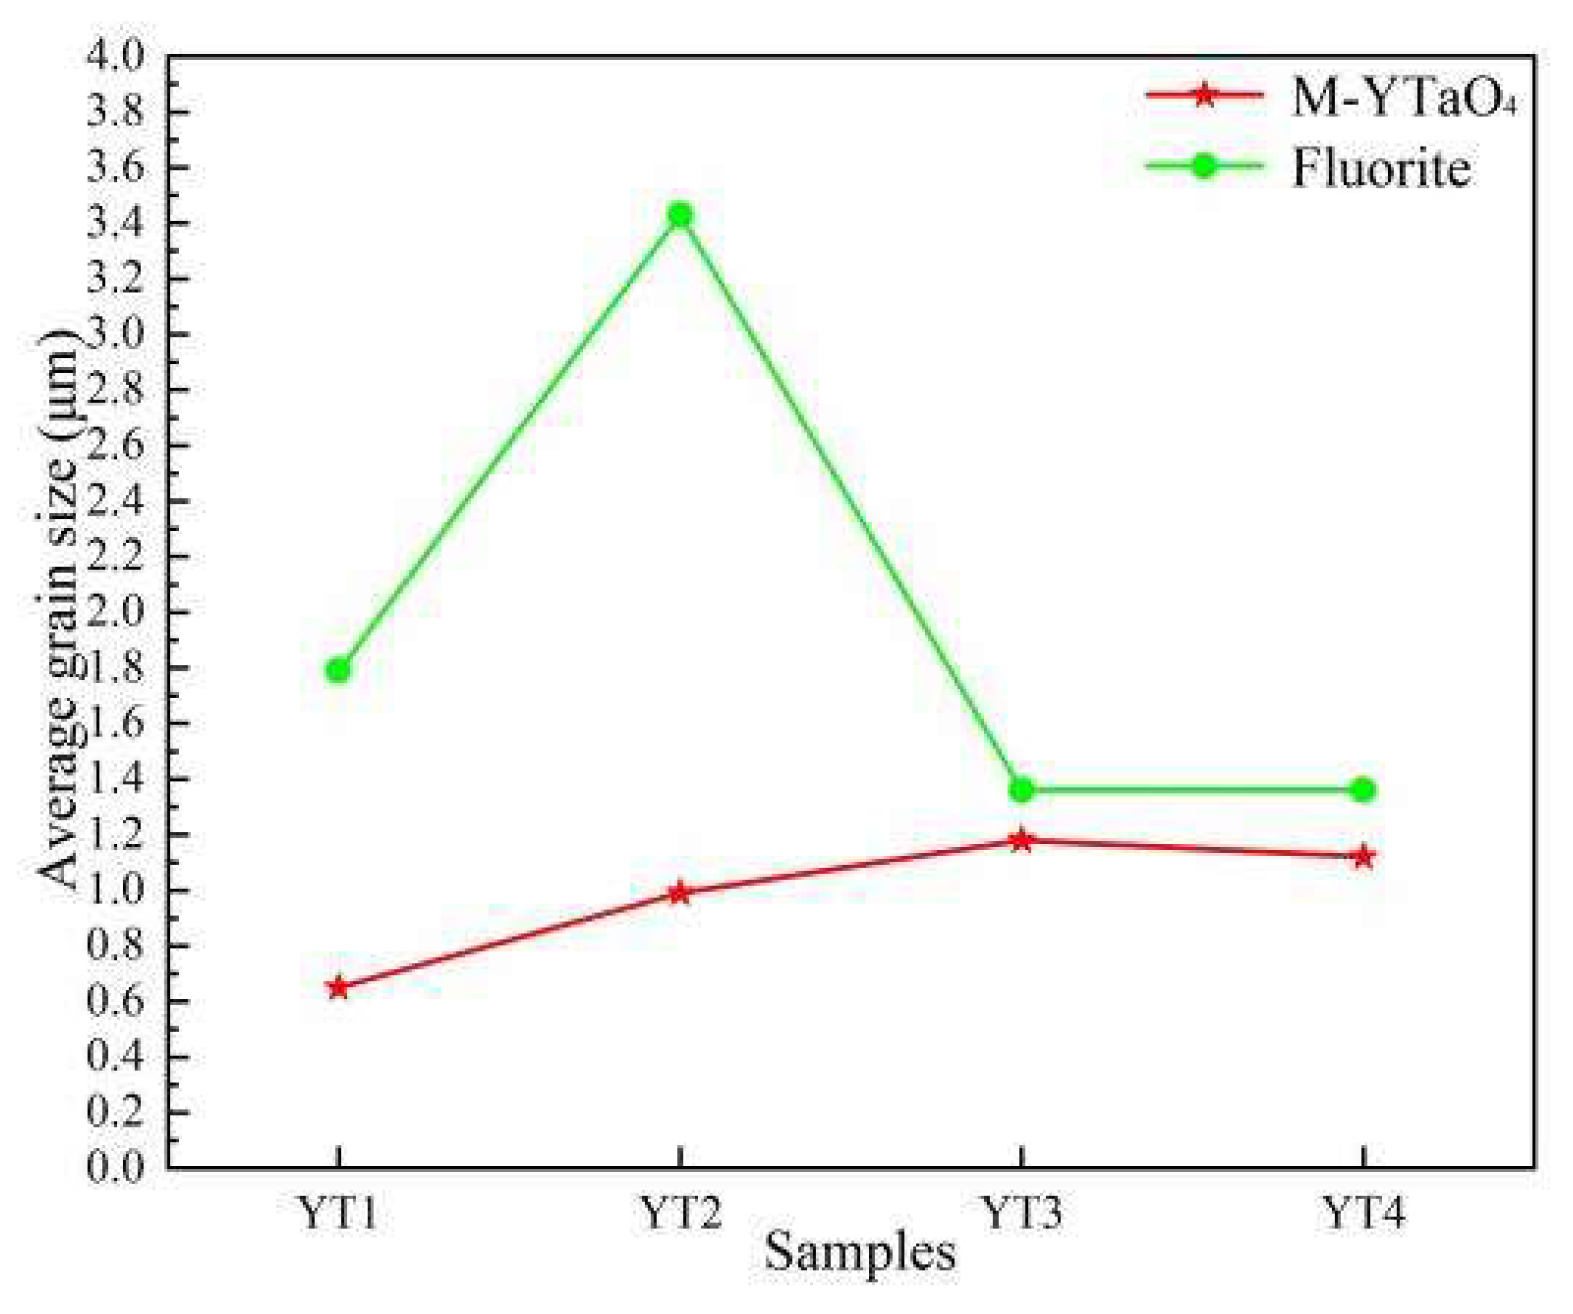
Figure 4, the average size of fluorite grains showed a decreasing trend with the increase of the second phase. This indicates that the doping of M-YTaO4 can inhibit the growth of fluorite grains during the sintering process. As shown in
Figure 3, interconnection of M-YTaO4 grains occurs in YT3 and YT4, and the M-YTaO4 grains in the composites becomes gradually larger. Note in particular that when the doping amounts are YT3 and YT4, the fluorite and M-YTaO4 grains in the composites are close in size. According to percolation theory, there is a critical range of 14~16 vol% second phase volume fraction in the two-phase composites beyond which the second phase interconnection effect occurs [
16,
19]. In the present study, the M-YTaO4 content was significantly higher than this range, which is why this phenomenon occurred. Furthermore, other studies have shown [
20,
21] that doping the second phase can refine the grain size of the matrix phase and enhance the mechanical properties of the composites.
3.2. Hardness and Fracture Toughness
The Vickers hardness of ZYTO composites as a function of M-YTaO
4 doping as shows in
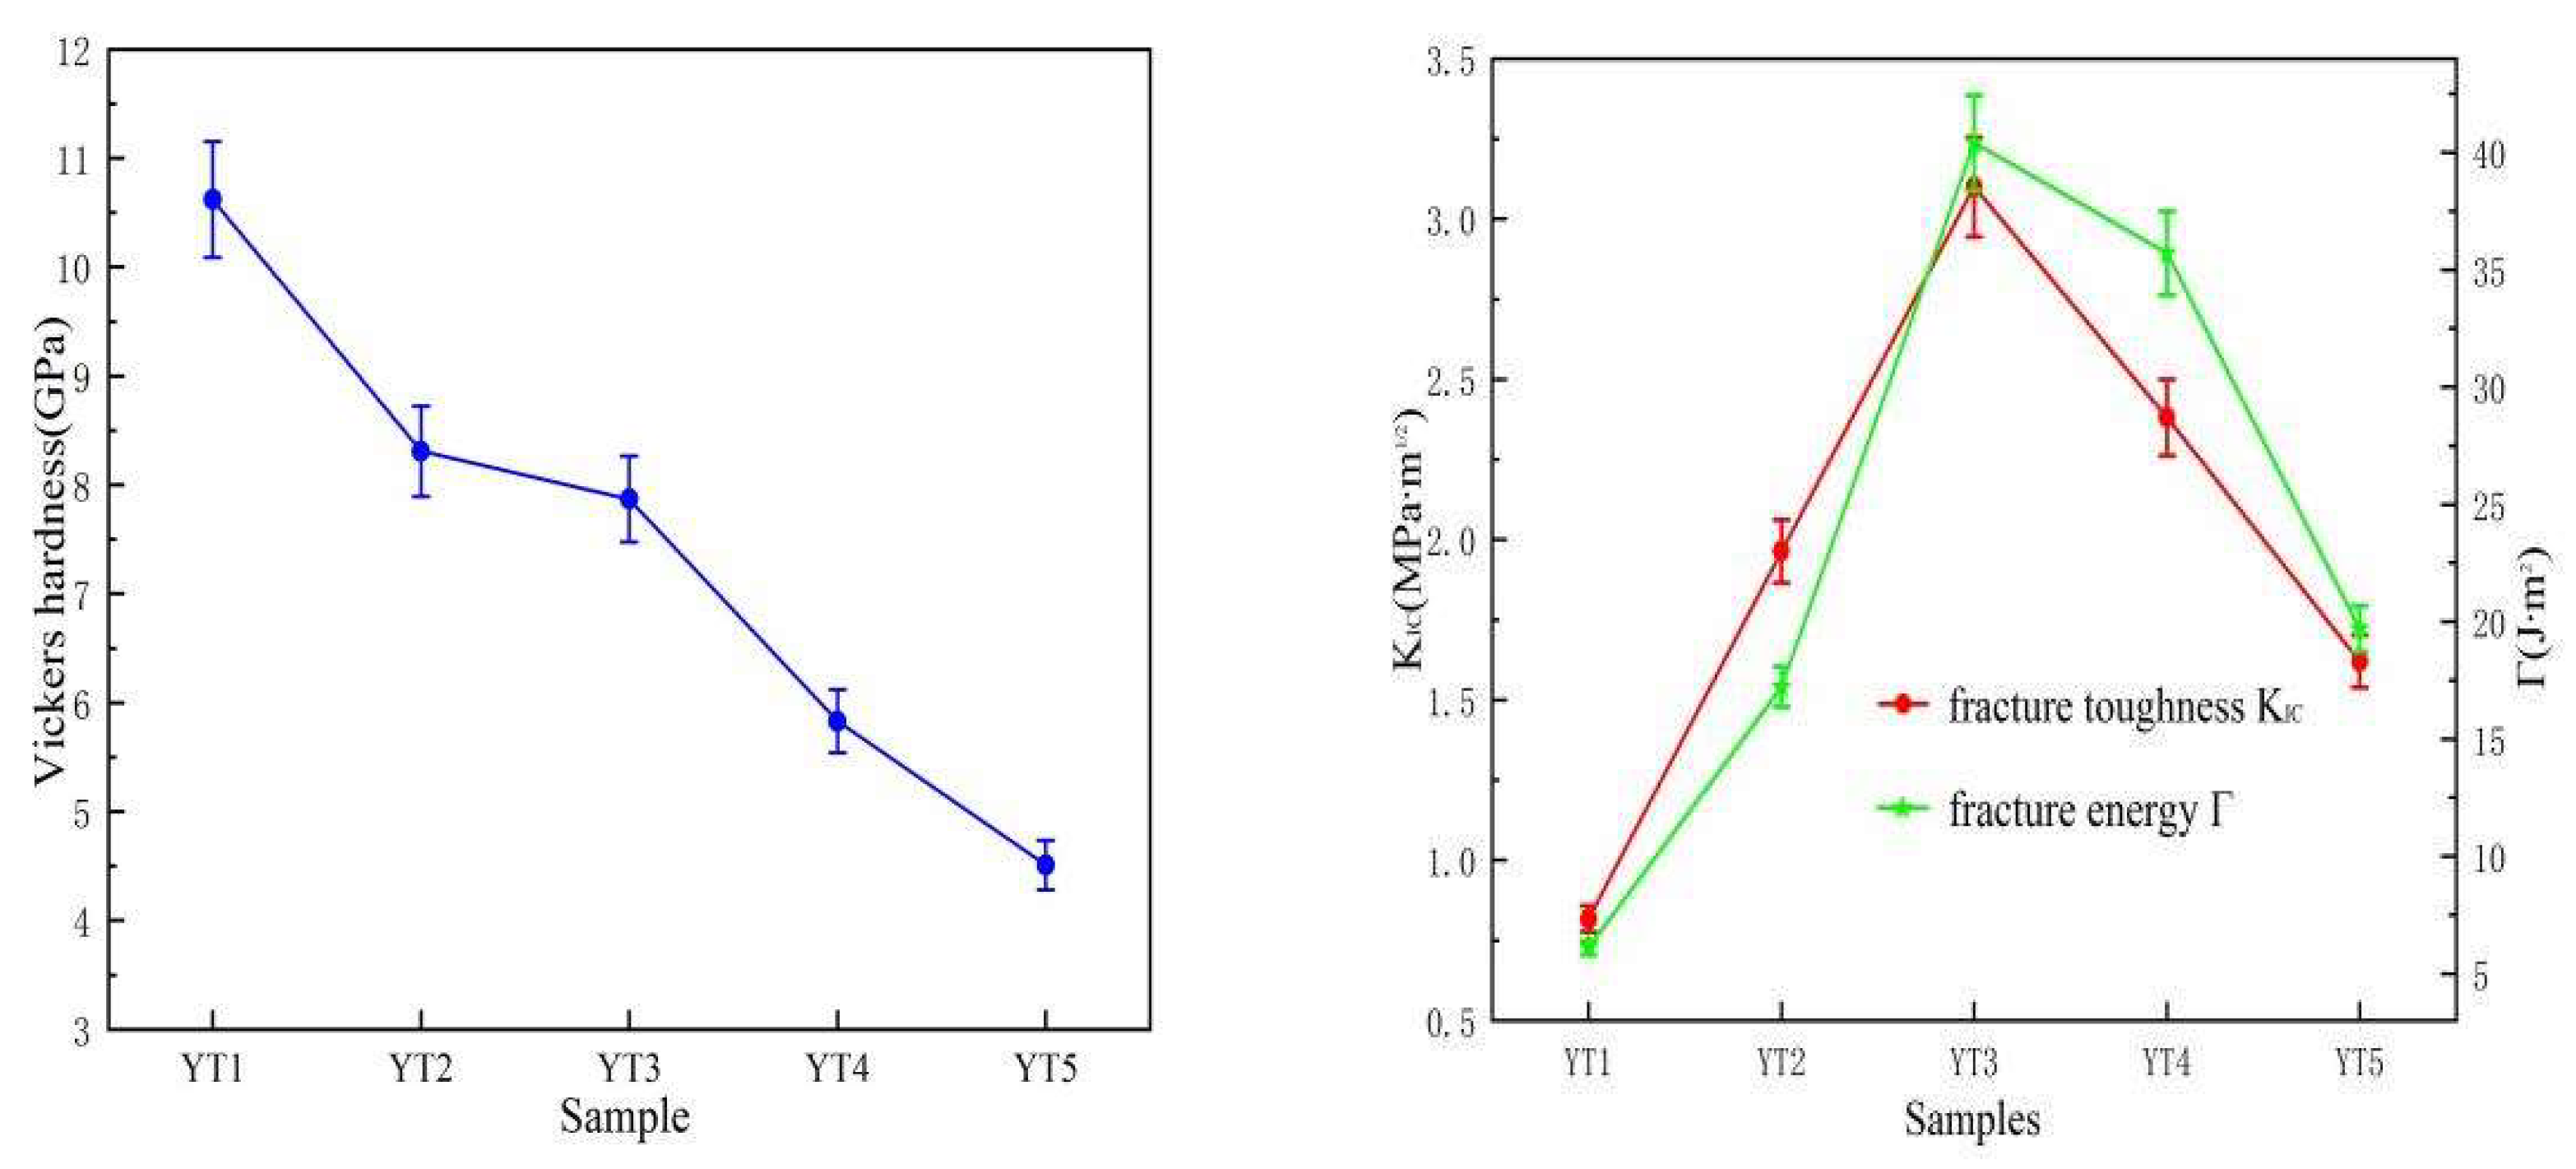
Figure 5a. Obviously, the hardness decreases almost linearly with the doping of the second phase. The hardness decreased from 10.6 GPa to 4.5GPa, which was higher than that of 8YSZ without additives (from 1.52 to 2.05 GPa) and was considerably lower than that of 8YSZ with additives CuO-TiO2 (17.2 to 17.96 GPa) [
22].
Furthermore, due to the low density of the sample, more pores, under the same load, the surface of the material is more prone to deformation, resulting in a sharp decline in hardness. Secondly, the porosity and cracks in the sample increase and the brittleness of the material increases, which also affects the mechanical properties of the material. In addition, pores were apparent in the ceramics, which can decrease the hardness of sintered specimens. As shown in
Figure 3, a small amount of M-YTaO
4 doping is able to enhance the fluorite phase grain boundaries. The fluorite phase ceramic material has improved resistance to deformation in local areas. As a result, the hardness of YT1 is higher. As the amount of M-YTaO
4 doping increases, the hardness of the composites YT2-YT4 decreases instead compared to their fluorite phase counterparts. It can be inferred from the mixing law that the overall hardness approaches that of the M-YTaO
4 phase ceramics as the M-YTaO
4 doping content increases.
The trends in fracture toughness and fracture energy calculated by Equations (1) and (2) are shown in
Figure 5b. The fracture toughness increases with increasing the M-YTaO
4 content and reaches a highest value (approximately 3.1 MPa·m
1/2) at the samples YT3, which is almost 300% higher than that of fluorite ceramic. At this moment, the fracture energy also reaches a highest value (approximately 42 J/m
2). Fracture toughness and fracture energy follow the similar trend with increasing doping, both increase and then decrease. The original increase of fracture toughness can be attributed to the grain size effect [
24].
3.3. Mechanism of Toughening
Based on the above analytical results, we can conclude that the introduction of the second phase M-YTaO4 into fluorite phase ceramics is beneficial to improve the hardness and fracture toughness, although this change is not linearly proportional to the doping concentration. Further analysis of the toughening mechanism of composite ceramics has revealed that the increase in fracture toughness is strongly related to residual stress, interface state, crack propagation mechanism and ferroelastic switching.
3.3.1. Effects of the Residual Stress
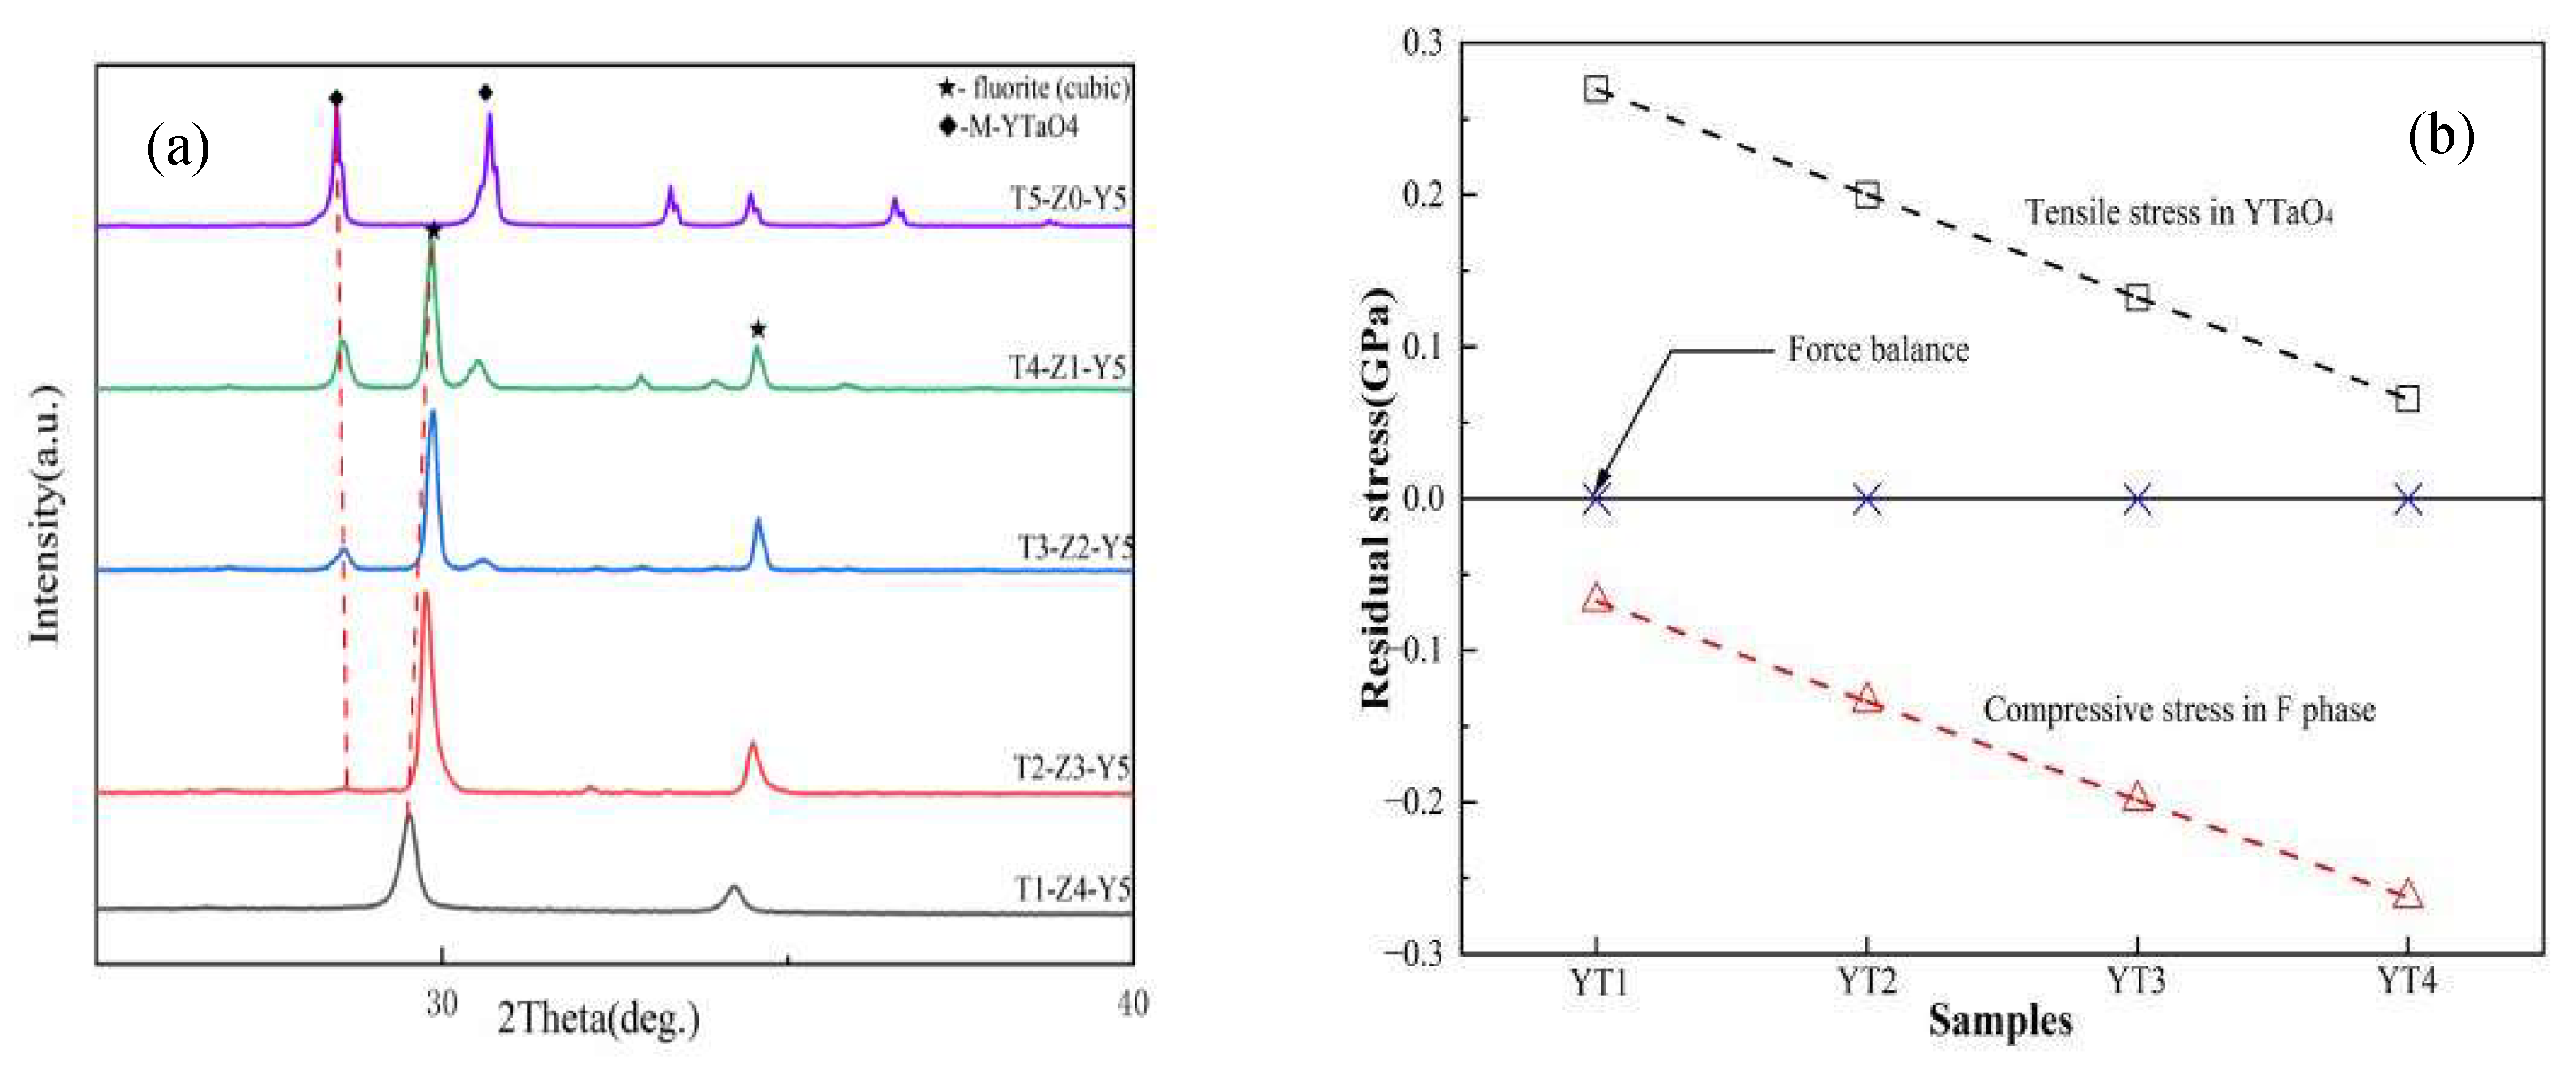
In ZYTO composites ceramics, some studies show that the TEC (thermal expansion coefficient) of the second phase is higher than that of the matrix. When cooled from sintering temperature to room temperature, the base phase and the second phase produce compressive and tensile stresses, respectively, which is an average (effective) stress level. The displacement of diffraction peak in XRD pattern can reflect the residual stress. Therefore, the peak displacement can exhibite whether compressive stress or tensile stress is generated. As shown in
Figure 6a, the diffraction peaks of the second phase and the matrix move in the opposite trend with the increase of doping amount. For example, the M-YTaO4 peaks move at low angles to produce tensile stresses, while the matrix fluorite phase peaks move at high angles to produce compressive stresses. This confirms the formation of tensile stresses in the second phase and compressive stresses in the substrate. The actual situation at the different grains and interfaces may be completely different, because the grain size, grain shape in terms of sharp notches, temperature gradient during cooling at the corresponding location, presence of stress micro-concentrators in the form of voids, micro-cracks, etc.
According to the model proposed by Taya [
25], the residual stress in the composite can be calculated by the following equation:

where the subscripts
s and m represent the second phase and the matrix respectively,
x is the content of the second phase, Young's modulus
E, Poisson's ratio
ν, thermal expansion coefficient
α, tensile stresses
σs and compressive stresses
σm.
T0 and
T are room temperature and sintering temperature respectively.
Table 3 lists the values of these parameters for calculating residual stress. The TEC of fluorite phase is (9.6×10
−6K
−1), lower than that of M-YTaO
4 phase (10.7×10
−6K
−1) [
26]. The Young's modulus and Poisson's ratio of M-YTaO
4 phase is (177 GPa and 0.35), that of fluorite phase were (210GPa and 0.3) [
27]. Therefore, the calculated residual stresses are shown in
Figure 6b. It is obvious that in the composite, the second phase grain is subjected to tensile stress, while the matrix is under compressive stress. With the increase of the second phase content, the tensile stress of the second phase grain decreases, while the compressive stress in the matrix increases. As we know, residual stresses during cooling can heal cracks and improve toughness [
28].
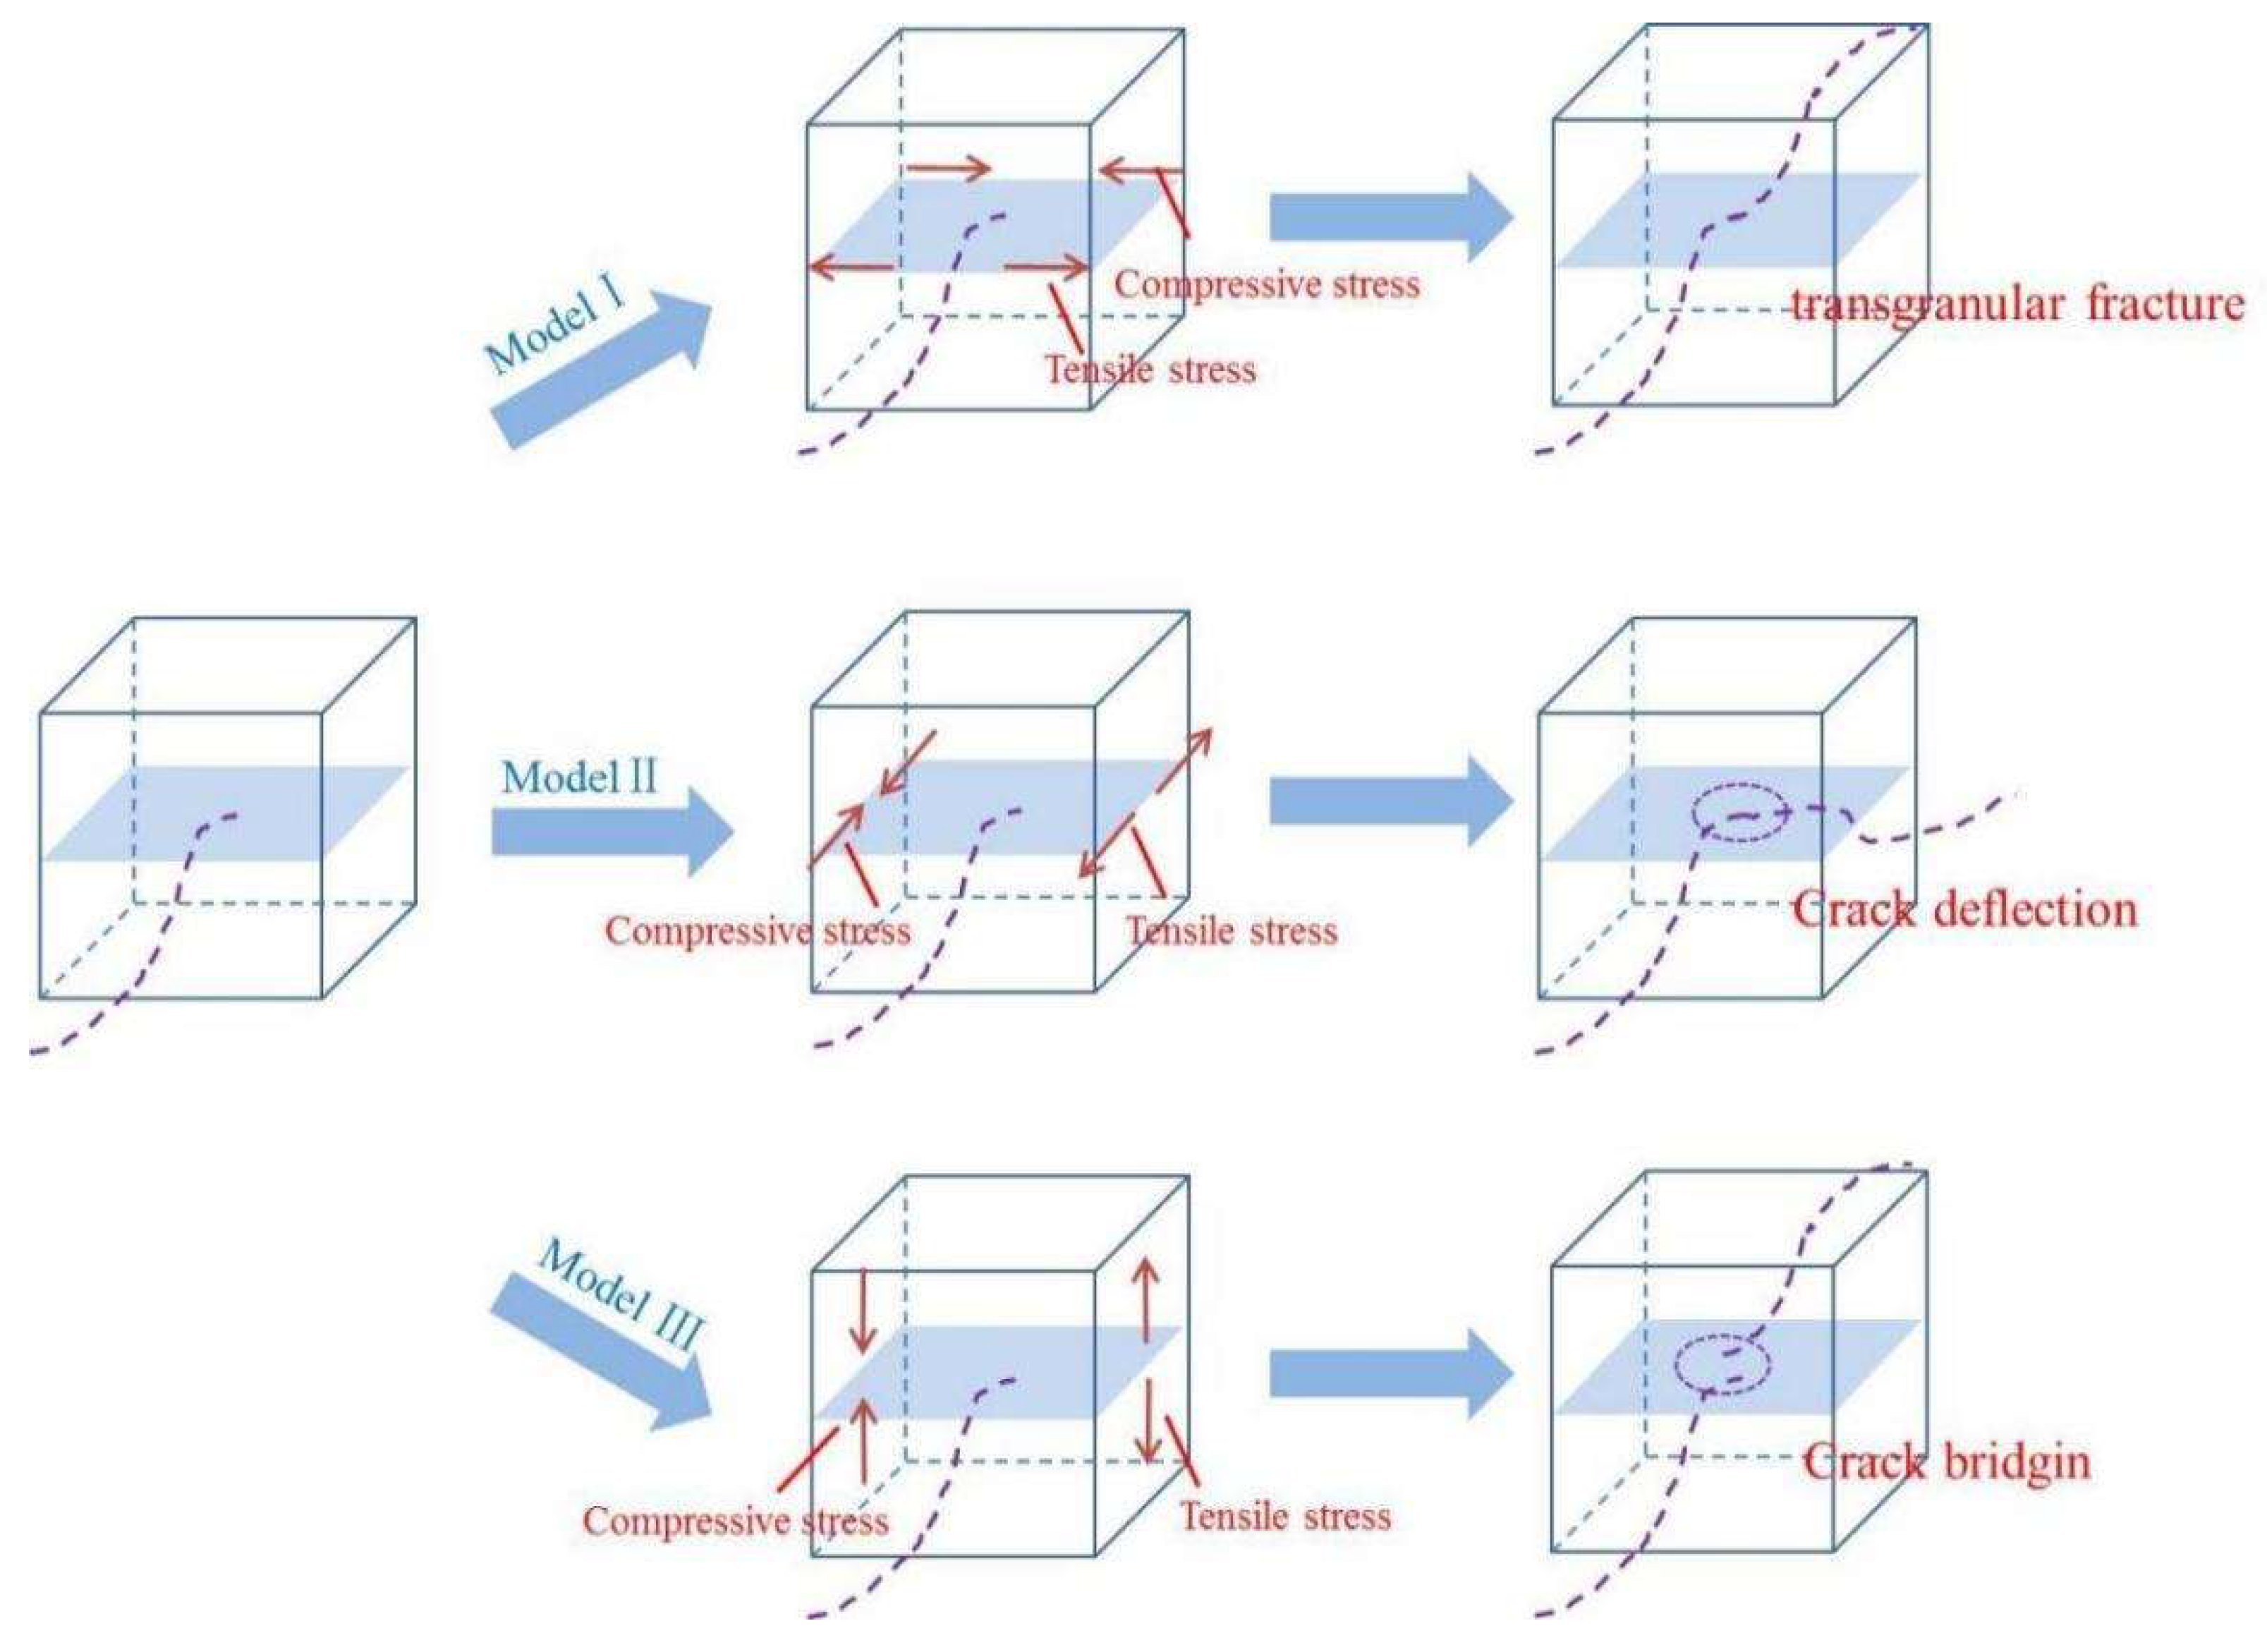
The synergistic influence of residual stress on crack growth behavior is schematically ploted in
Figure 7. When the tensile stress is perpendicular to the direction of the crack extension and the compressive stress is opposite to the direction of the tensile stress, the crack will pass through the second phase, which consumes fracture energy and to improve the toughness of the material (mode I). When the tensile stress direction is parallel to the interface, the crack is likely to propagate in the interface plane rather than along the initial path, resulting in crack deflection (Mode II). If the tensile stress is perpendicular to the interface, a new crack originating at the interface, crack bridging (mode III) may occur. For composite ceramics with different M-YTaO
4 content, their second phase distribution and residual stress distribution are different.
3.3.2. Effect of Interface Binding
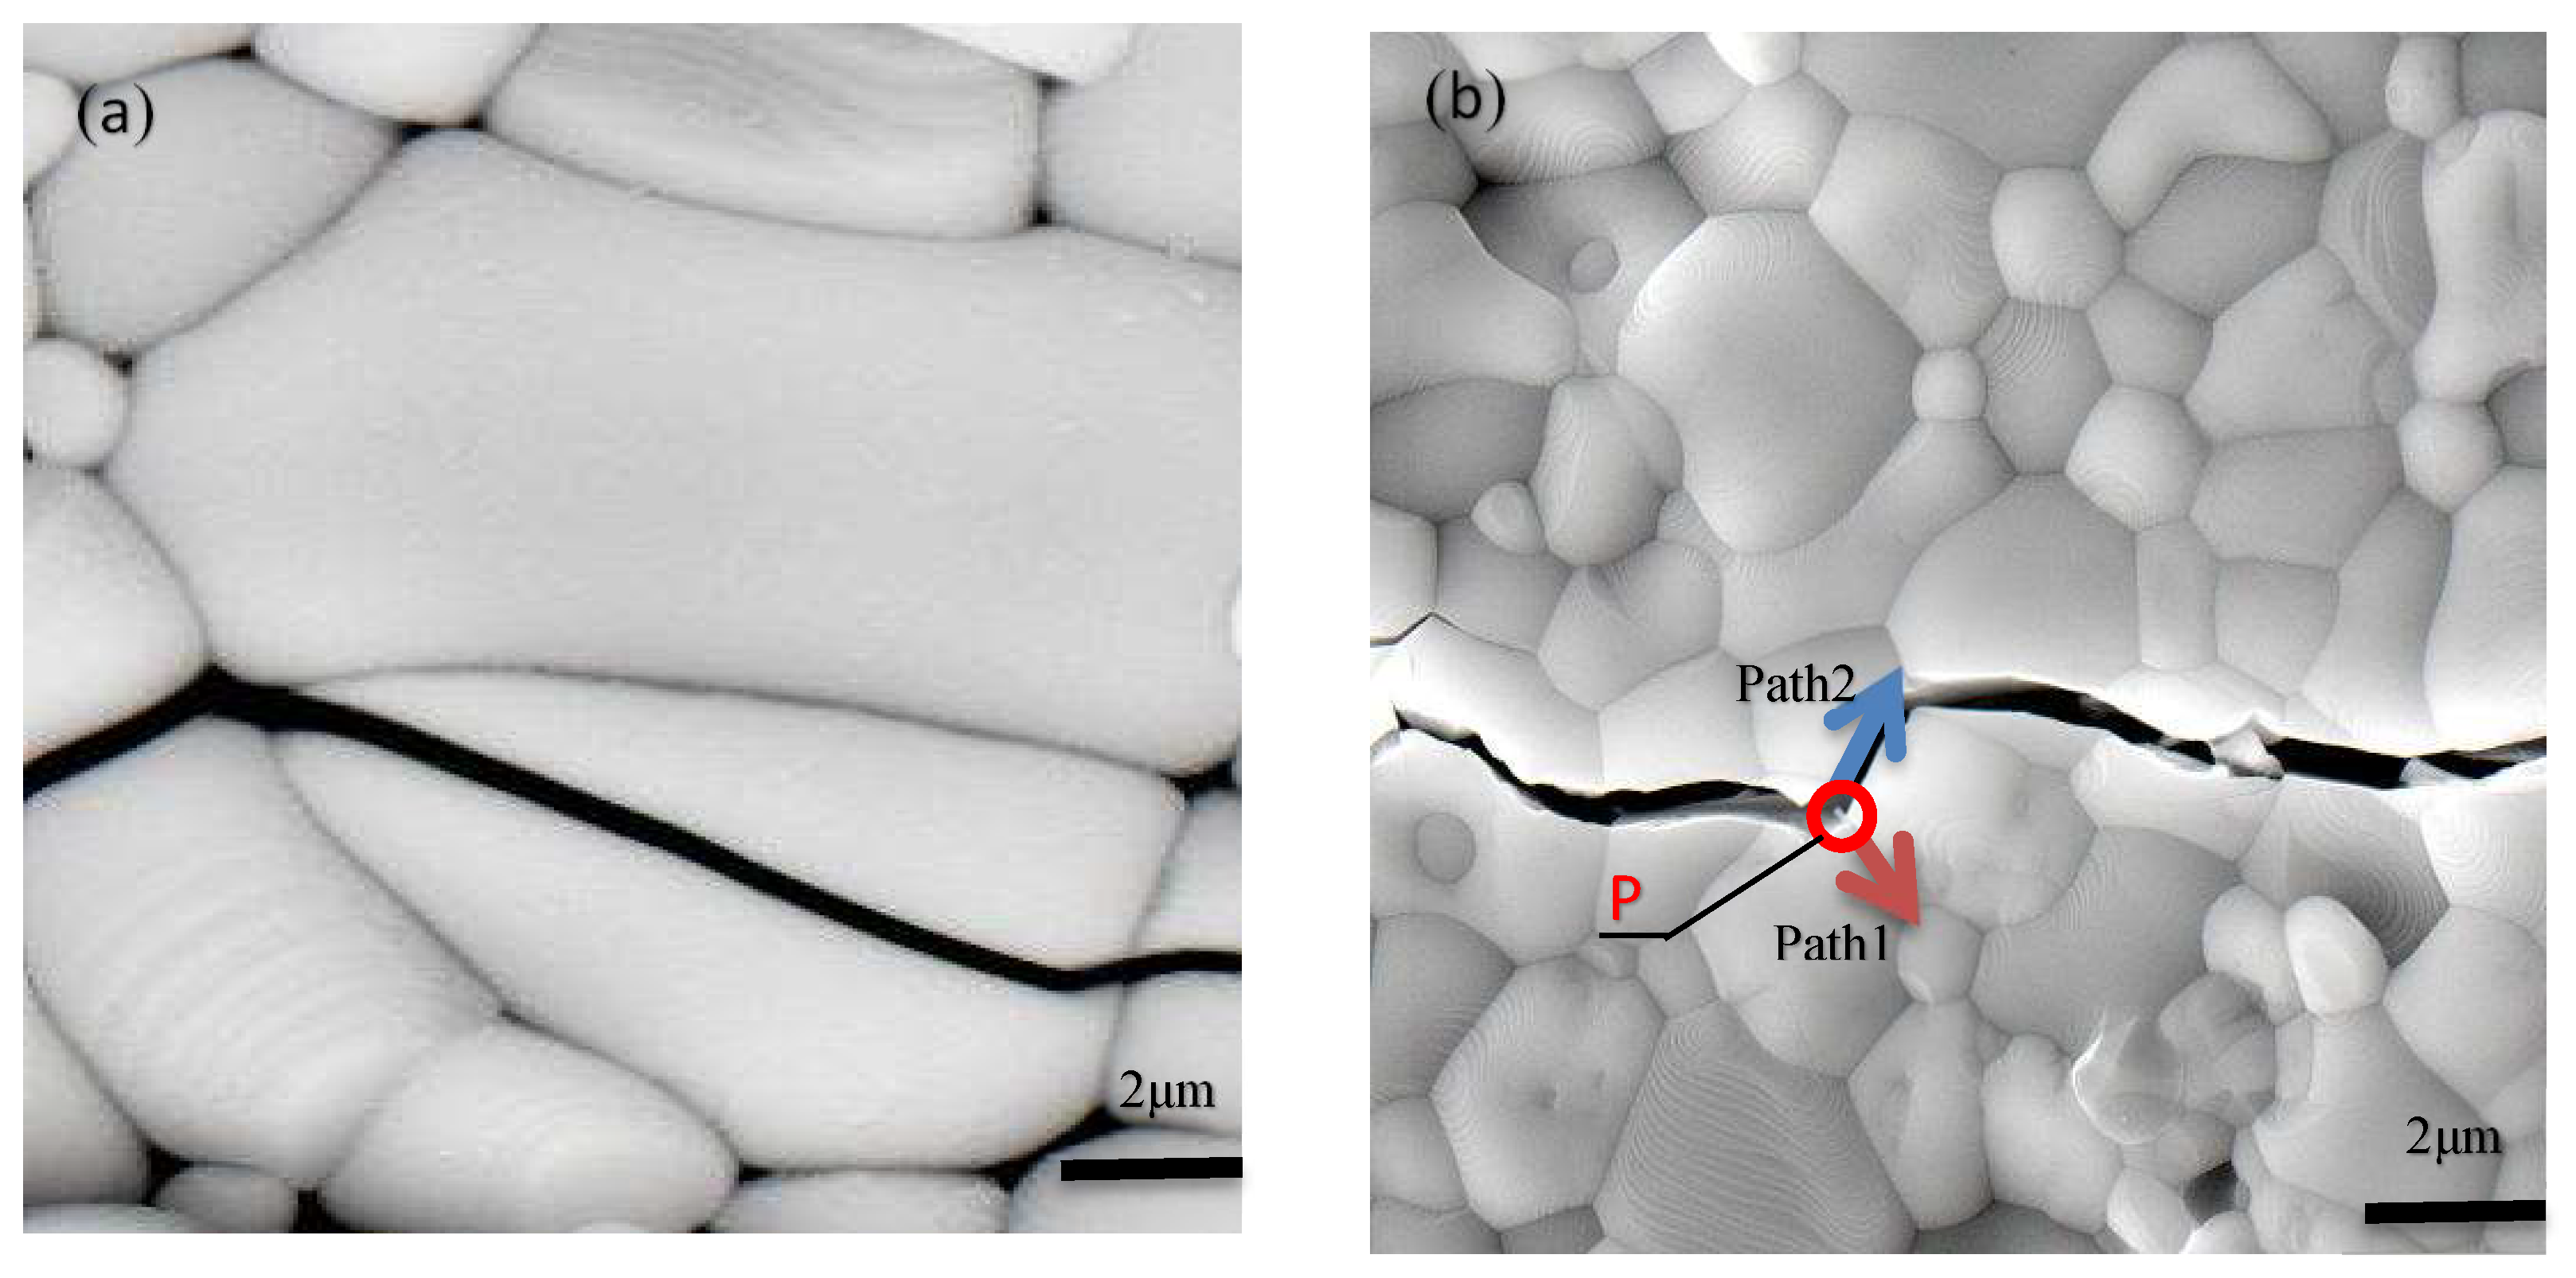
Figure 8a show that the fluorite phase exhibits an transgranular fracture mode, indicating weaker fracture toughness in the fluorite phase.
Figure 8b show that the in composites exhibits crack deflection mode, indicating stronger fracture toughness in the M-YTaO
4 phase. When the crack propagates to the position P, path 1 along the interface between M-YTaO
4 and M-YTaO
4 grains, and path 2 along the M-YTaO
4/fluorite grain boundaries. The existence of path 2 suggests that the interface strength of M-YTaO
4/fluorite is weaker than that of M-YTaO
4/M-YTaO
4.
As is described above, there are numerous interfaces between M-YTaO
4 and Fluorite grains in the composites. Therefore, the first problem is how does the M-YTaO
4/fluorite interface strength affect the fracture toughness of the composite? Unfortunately, measure the interface strength between grains is almost impossible. In order to prove that the change of the doping has an effect on the Young's modulus of the composite, a linear analysis is carried out followed Voigt’s work [
29]. Voigt provided a qualitatively analyzed model to investigate how the interface strength affect the Young's modulus. The equation for the related calculation is as follows:
where the
s and
x represent content of second phase and the second phase respectively,
m is the matrix phase.
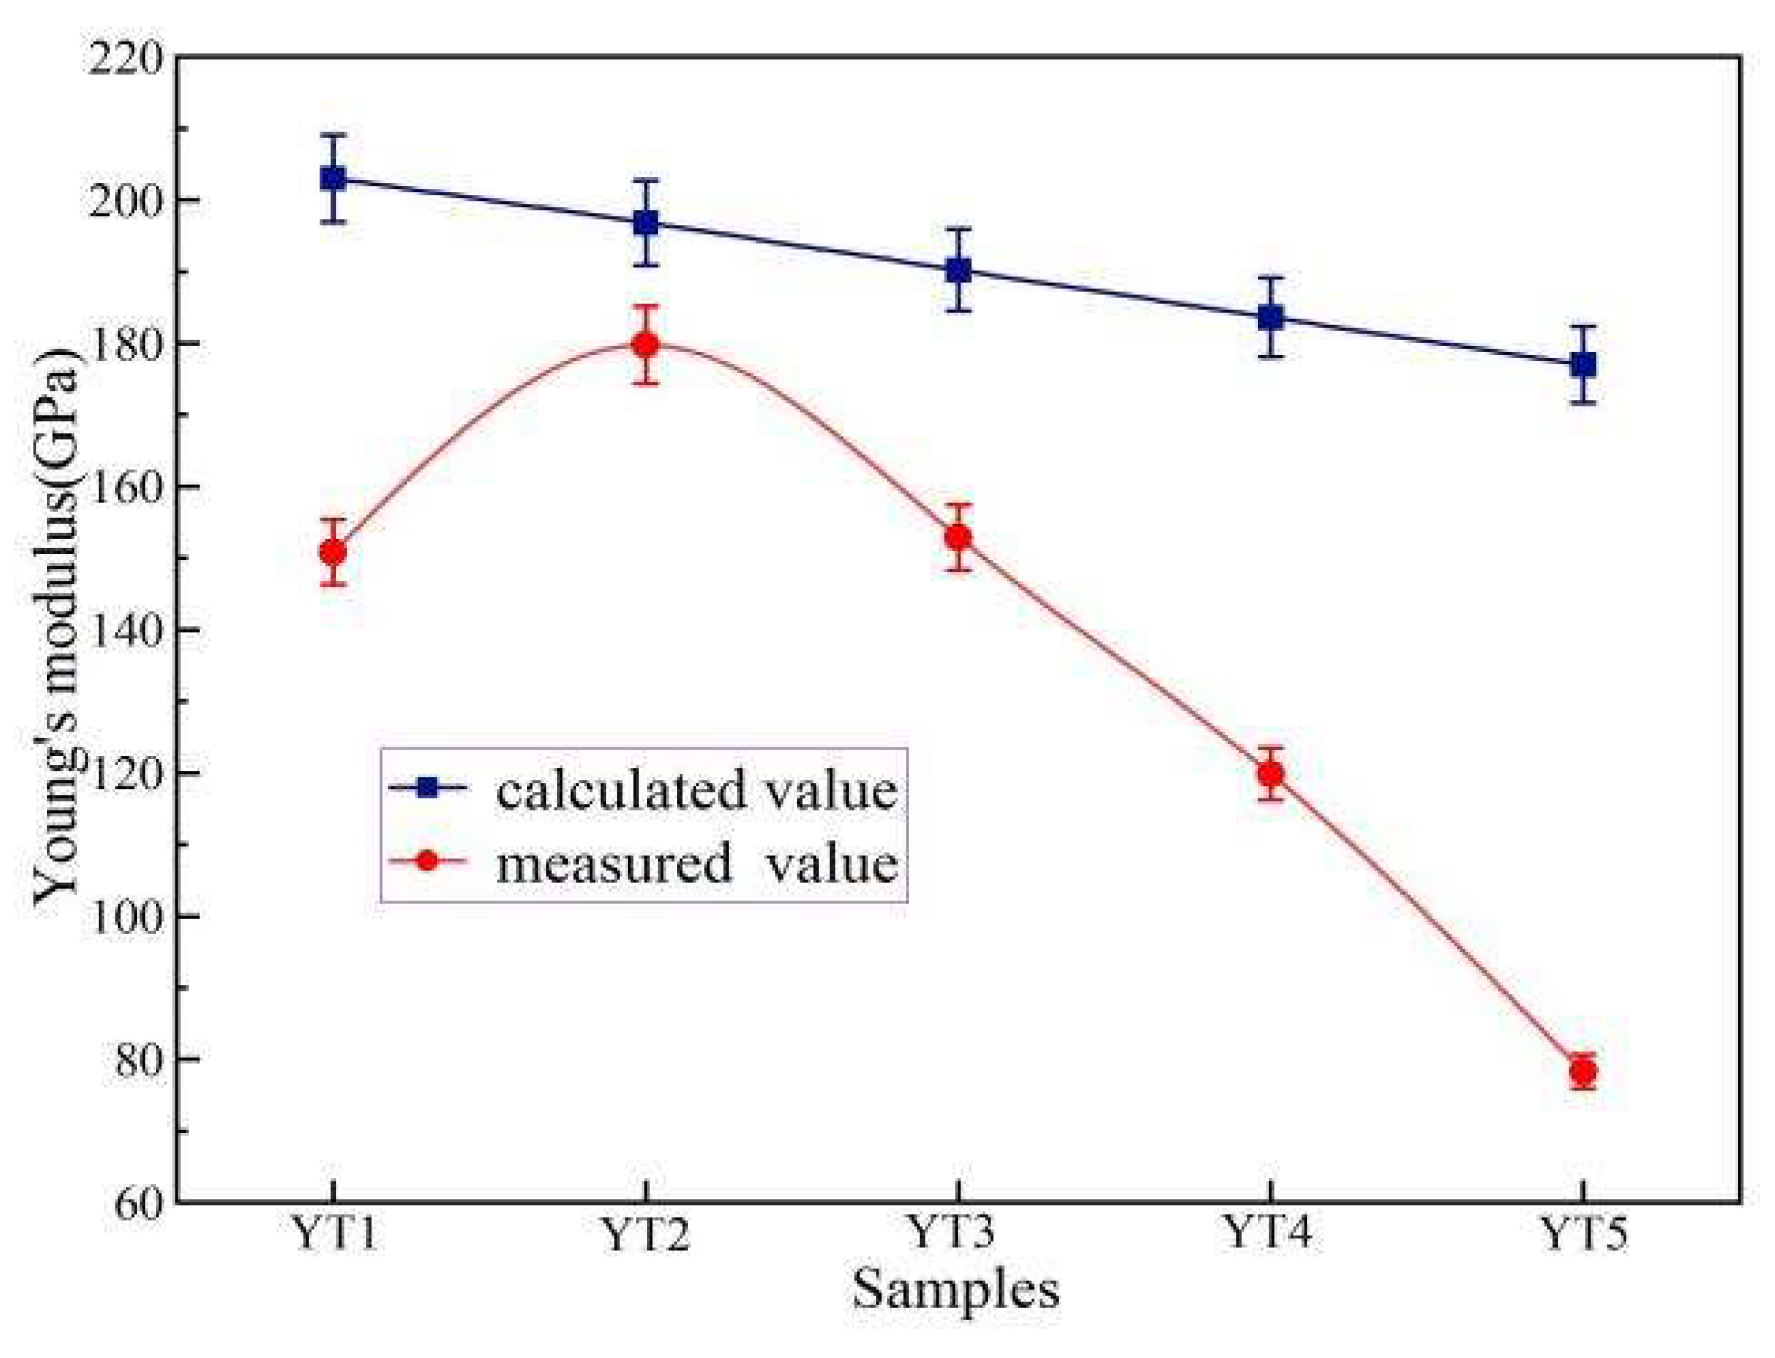
Table 4 shows Young's modulus of composites calculated values and the experimental values.
Obviously, the Young's modulus is measured value lower than the calculated value. However, voigt believed that strengthening interface bonding means increasing Young's modulus [
30].
Figure 9 show that the measured value first increases and then decreases, reaching a maximum value at YT2. Combined with
Figure 3, the nonlinearity behavior of Young's modulus may be caused by M-YTaO4 grains are wrapped by fluorite phase grains at YT2. The fluorite phase grains and M-YTaO4 grains are closely combined to enhance the interface strength. However, as the second phase increases, the second phase grain becomes larger and the pores on crease. These leads to the rapid decline of Young's modulus. In addition, both the calculated and measured values of Young's modulus show a downward trend after adding M-YTaO
4. As we know, the low Young's modulus can result in higher strain tolerance in the thermal barrier coating, effectively alleviating the stress caused by thermal shock [
31]. Based on the above discussion, we can conclude that M-YTaO
4 doping has a significant impact on the interface bonding of composite materials.
3.3.3. Analysis of Crack Propagation Mechanism
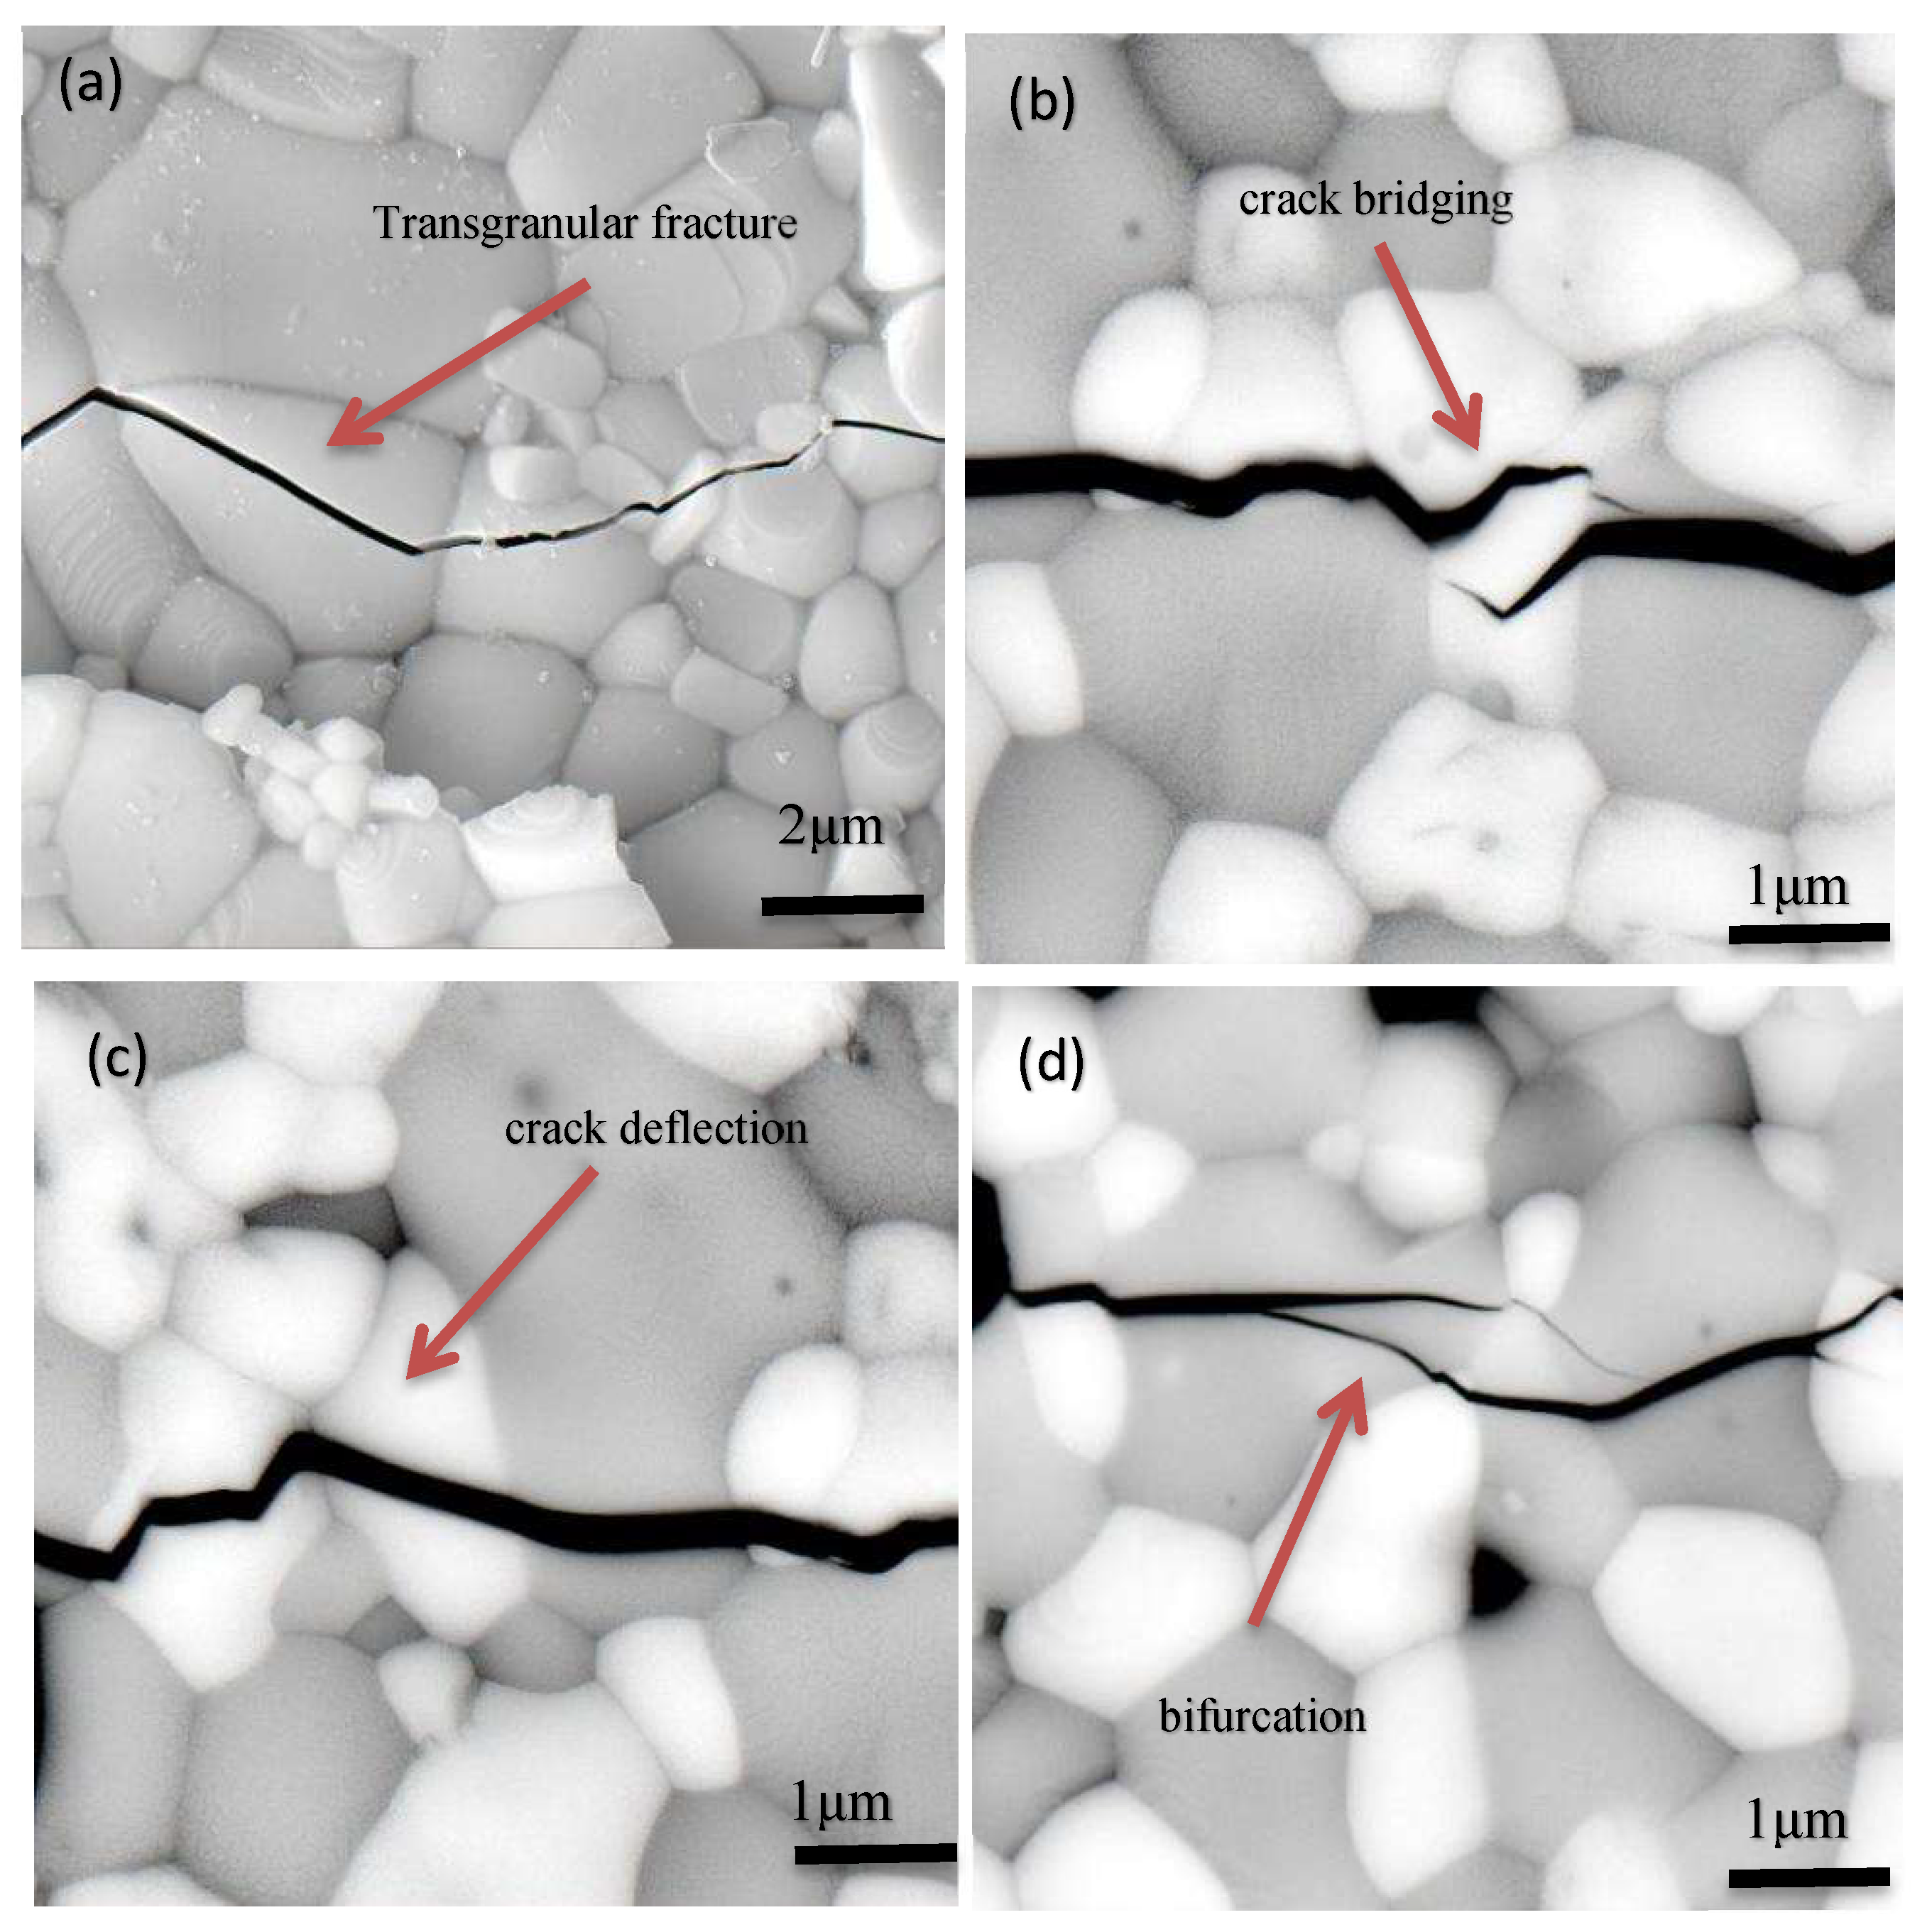
In this study, composites YT1 mainly reveal an transgranular fracture mode, as shown in
Figure 10a. Cracks initiates in the matrix and cross through the fluorite phase grain. The crack extension of the composites YT2-YT4 is shown in
Figure 10b–d. When the crack encounters the second phase (M-YTaO
4 grains), crack deflection, bridging and bifurcation are the main modes of propagation. The crack needs to consume more energy for propagation because of the higher interface bonding of M-YTaO
4 grains, giving rise to an enhanced toughness, which could account for the obviously high toughness of this composite. Thus, cracks deflection, bridging and bifurcation are considered as important toughening mechanisms. Hence, introducing the second phase is a primary contributor to the improved toughness of the ceramic materials.
Due to the unfixed angle between the tensile interface and the layer interface, when the crack encounters the M-YTaO
4 grain interface, it may penetrates or deflectes, adding new free surfaces and releasing more fracture energy.
Figure 10 exhibits three fracture modes, crack deflection, intergranular fracture, and crack bridging, indicating that the strength of M-YTaO
4 grains are larger than those of the fluorite phase, which leads to the toughness of the two-phase region is improved. By analyzing the crack propagation behavior in the composite material, the bonding strength of the two-phase interface can be recognized. Similar phenomena have been observed by other researchers [
32].
3.3.4. Toughening Mechanism of Ferroelastic Domain of YTaO4
M-YTaO
4 is a stable ferroelastic structure in room temperature. The T
→M phase transition of YTaO
4 being ferroelastic is of a continuous second order nature. Previous research states that the volume variation in YTaO
4 T
→M phase transition is so tiny that it can be omitted [
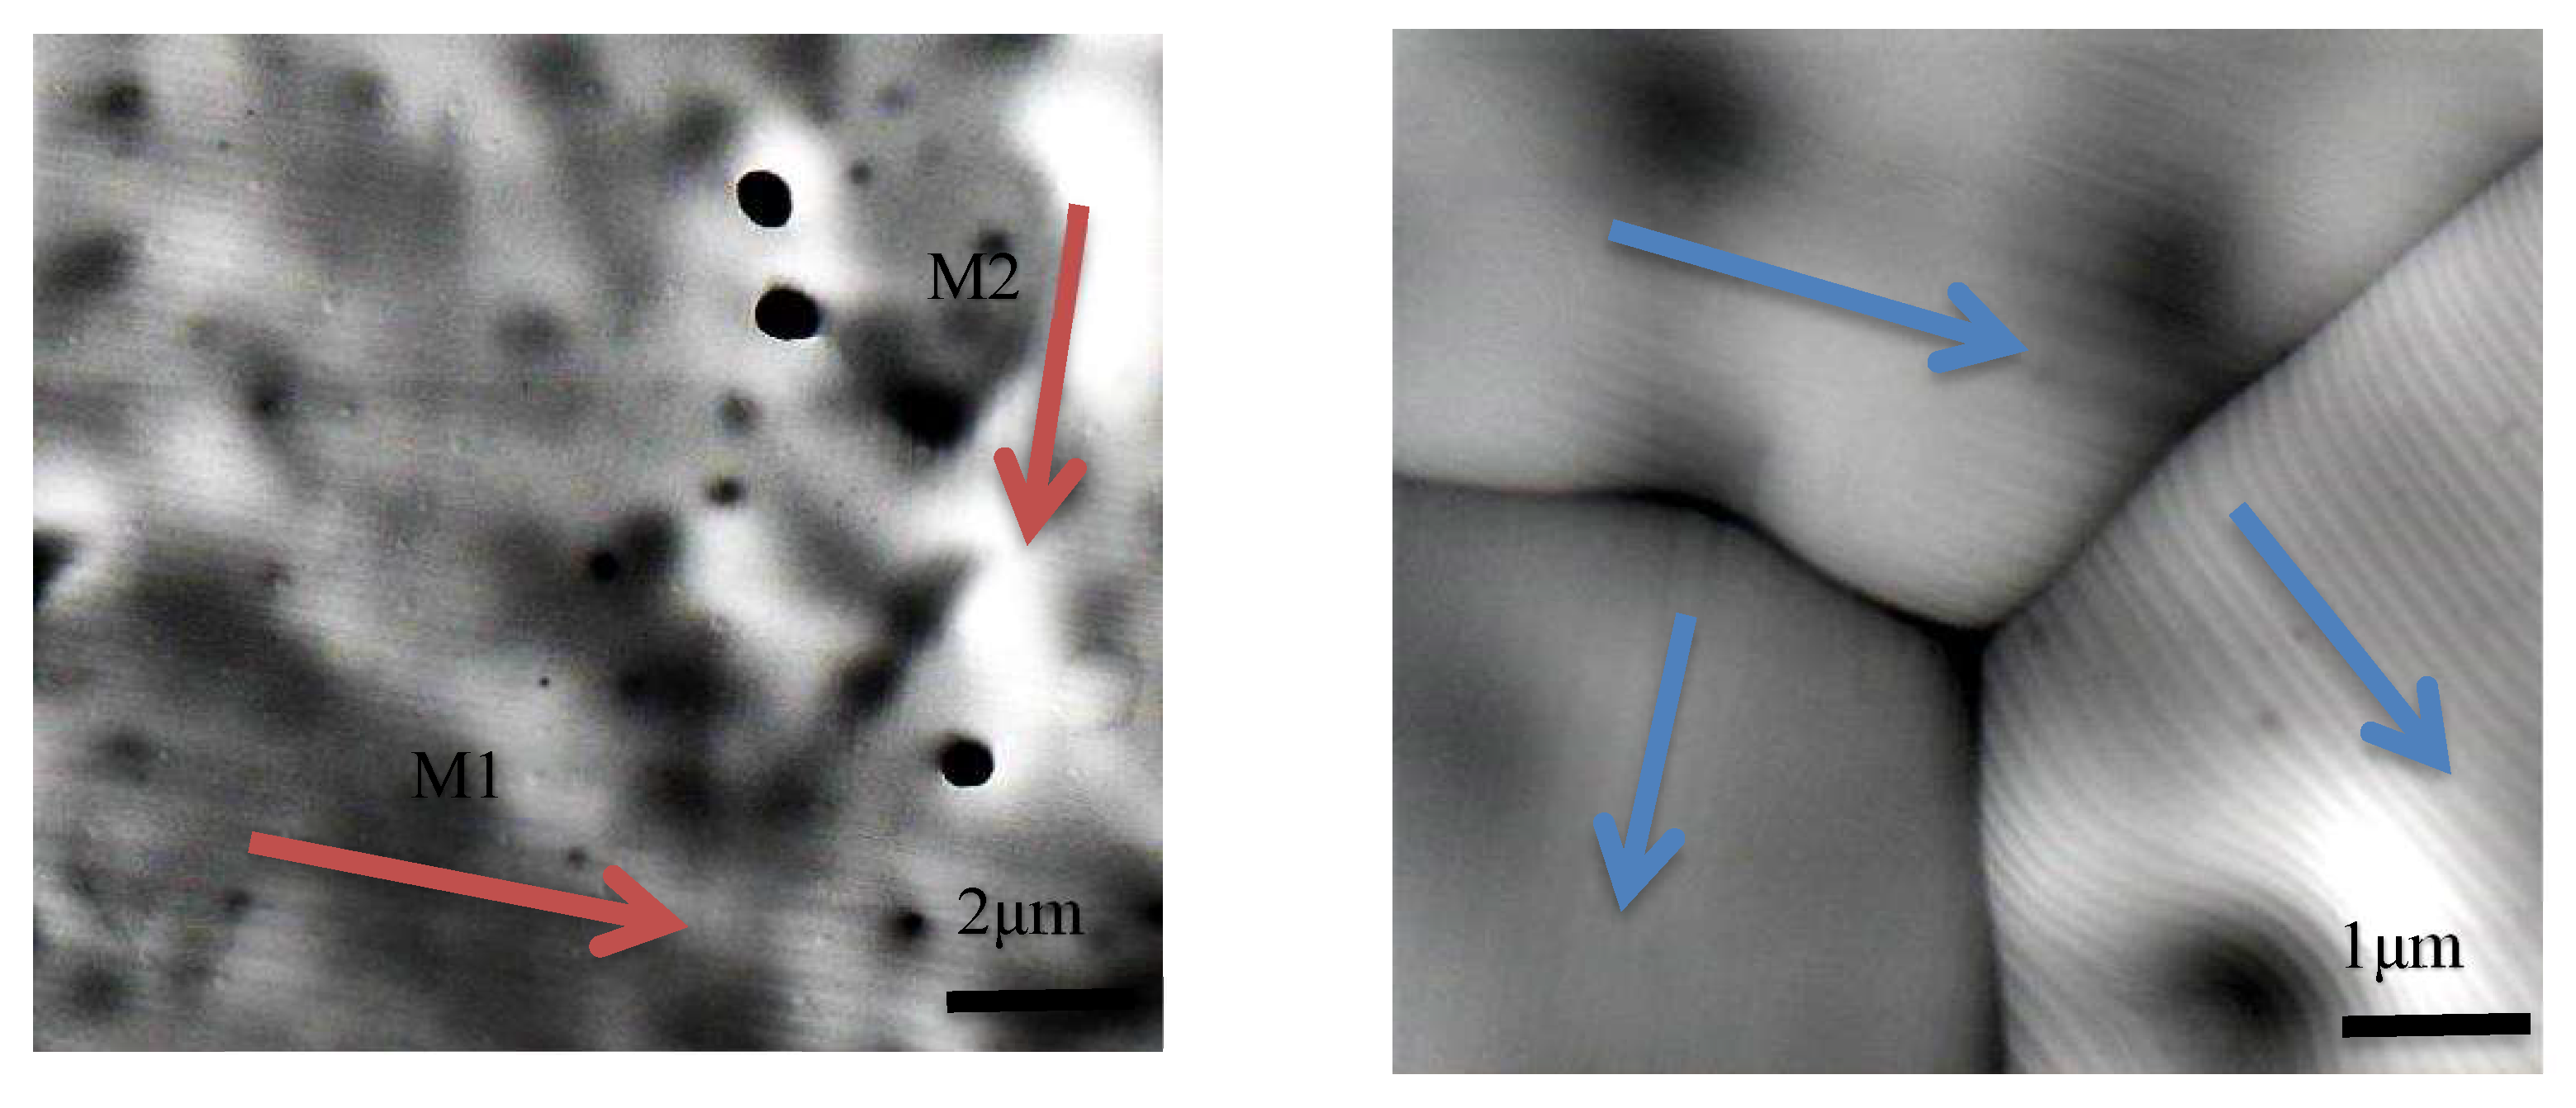
33]. Ferroelastic domain exists of parallel striped structured in pure YTaO
4 ceramic(samples YT5) and the SEM results are shown in
Figure 11. Furthermore, we found that the ferroelastic structure becomes more pronounced as the grains become larger.
There are two different orientation states in the monoclinic phase, related by two ferroelastic variants [
34]. We first characterized the XRD of M-YTaO
4 in
Figure 2, then we recognized the two variants (M1 and M2) in
Figure 11. We observe that variants M1 and M2 could ferroelastic switching in the process of crack propagation. It is known that M1 variant can transform to the M2 variant by F operation consisting of 90° rotation about the c axis [
35].
Figure 11 shows that M1 and M2 are perpendicular to each other which agrees with the theoretical studies. Therefore, the M2 variant transforms to M1 variant can be seen as a sort of rotating twinning process. M1 variant transforms to M2 variant is indeed ferroelastic switching.
When the crack penetrates through in M-YTaO
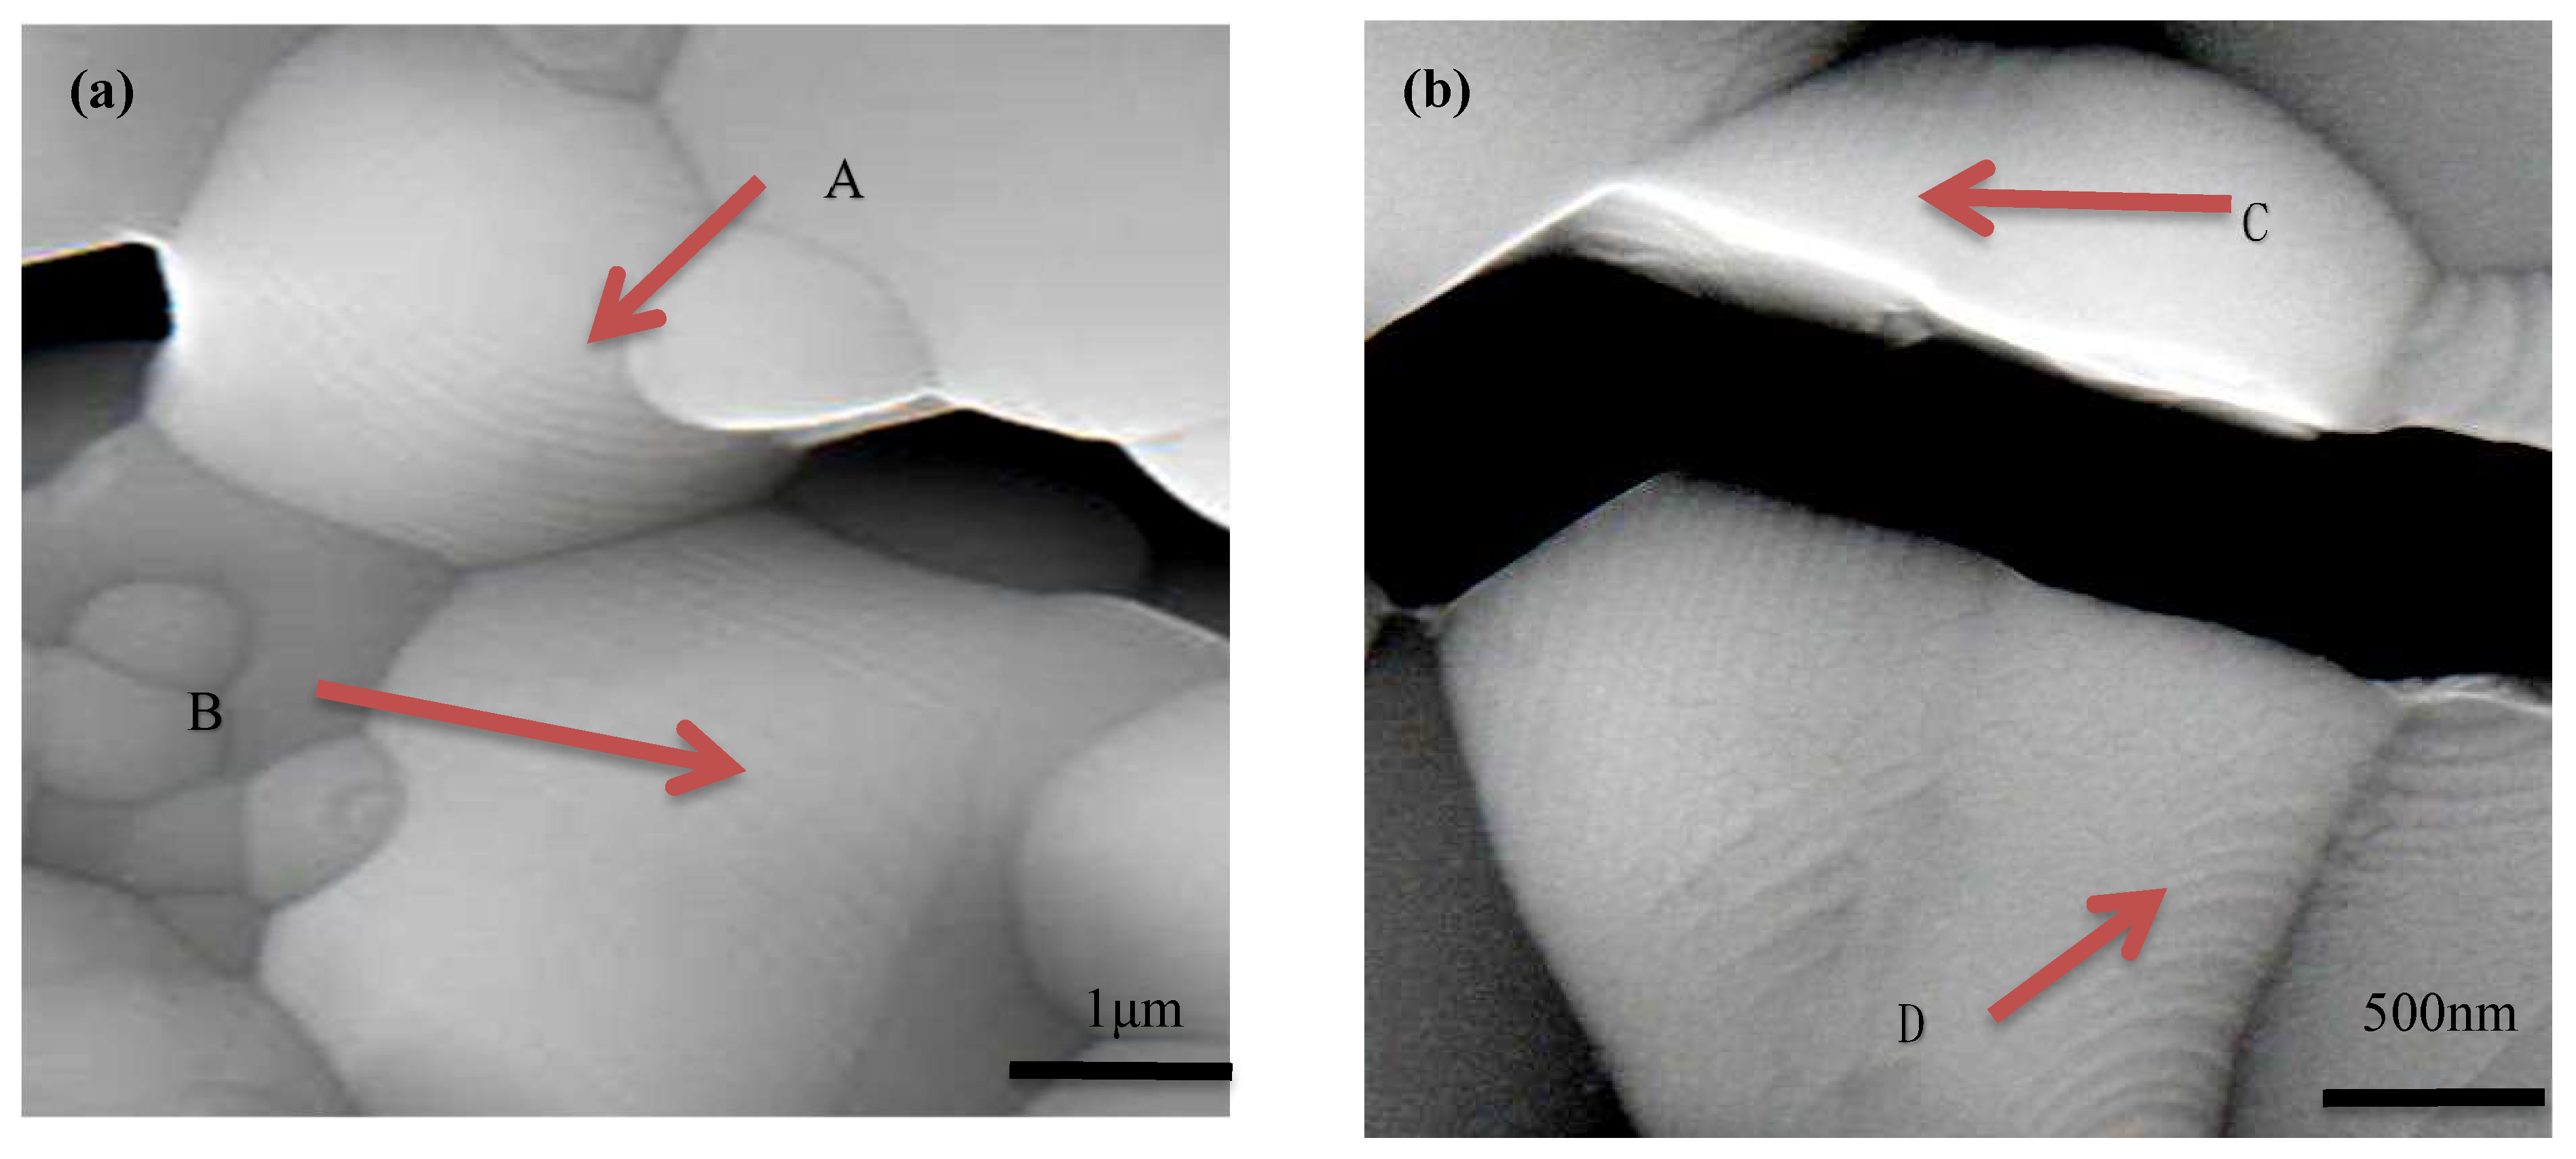
4, the ferroelastic switching is occured. The reorientation of M variant places a compressive stress on the crack surface and causes toughening. We can see in
Figure 12a, that A and B, belonging to the second phase grain, have ferroelastic domains structures with different polarization directions, and at the same time in regions C and D in
Figure 12b, ferroelastic domain structures with orthogonal polarizations also can be seen. Moreover, in the two phase region, the toughness value is constantly increasing, as shown in
Figure 5.
As we know, ferroelastic switching can be seen as a sort of mechanical twinning [
35]. Twinning stress is influenced by grain size followed by Hall-Petch law [
36]. An increase in grain size serves to decrease the critical twinning stress. In the experiments, we indeed find that in the larger grain the ferroelastic switching near crack shows more deterministic than small grains. Therefore, we believe that the ferroelastic toughening occupied an important position than others to affect the toughness of the composite ceramic with increasing of M-YTaO
4 doping.
4. Conclusions
In this study, ZYTO composite ceramic materials were prepared by chemical coprecipitation method. The microstructure of ZYTO were studied as well as the mechanical properties and toughening mechanisms. The following conclusions could be drawn:
(1) ZYTO composite ceramics show excellent phase stability and no chemical reactions between the two phases. The grain size of the two phases is gradually consistent with increasing M-YTaO4 doping concentration. M-YTaO4 phase refines the fluorite phase grain.
(2) By calculation and analysis, both the density and porosity of the ZYTO composite ceramics increase with increasing doping. The hardness decreases almost linearly with the doping of M-YTaO4, from 10.6 GPa to 4.5GPa. The fracture toughness first increased and then decreased with M-YTaO4 doping concentration, and YT3 possessed the highest fracture toughness of 3.1 MPa·m1/2.
(3) The residual stress, interface state, crack propagation mechanism and ferroelastic switching have important effects on the toughness of the ZYTO composites ceramics. In this case, due to the introduction of M-YTaO4 grains, the toughness of ZYTO composites ceramic are impacted by second phase toughening and ferroelastic toughening, which helps to further improve the fracture toughness. We believed that the second phase toughening and ferroelastic toughening plays the dominate role in improving the toughness of material.
Acknowledgments
This research is sponsored by National Natural Science Foundation of China (NSFC) under grant No.52171015, and Science and Technology Innovation Program of Hunan Province (Grant No. 2022RC1082).
Declaration of Competing Interest
The authors declare that they have no known competing financial interests or personal relationships that could have appeared to influence the work reported in this paper.
References
- Macauley, C.A; Fernandez, A. N; Van, Sluytman, J.S. Phase equilibria in the ZrO2-YO1.5-TaO2.5 system at 1250℃ [J]. Journal of the European Ceramic Society. 2018, 38, 4523–4532. [Google Scholar] [CrossRef]
- Macauley, C. A, Fernandez, A.N; Levi, C.G. Phase equilibria in the ZrO2-YO1.5-TaO2.5 system at 1500 C [J]. Journal of the European Ceramic Society. 2017, 37, 4888–4901. [Google Scholar] [CrossRef]
- Limarga, A. M; Shian, S; Leckie, R.M. Thermal conductivity of single-and multi-phase compositions in the ZrO2-Y2O3-Ta2O5 system [J]. Journal of the European Ceramic Society. 2014, 34, 3085–3094. [Google Scholar] [CrossRef]
- Guo, X; Wang, Z. Effect of niobia on the defect structure of yttria-stabilized zirconia [J]. Journal of the European Ceramic Society. 1998, 18, 237–240. [Google Scholar] [CrossRef]
- Heinze, S.G. Phase equilibria and toughness of ZrO2-(Y/Yb)O1.5-TaO2.5 thermal barrier coatings [M]. University of California, Santa Barbara. 2018.
- Han, M; Tang, X; Yin, H. Fabrication, microstructure and properties of a YSZ electrolyte for SOFCs [J]. Journal of Power Sources. 2007, 165, 757–763.
- Stefan, G; Heinze, Jason, S. Van, Sluytman; Carlos, G, Levi.Microstructure evolution and physical properties of ZrO2-(Y+Yb)O1.5-TaO2.5 thermal barrier coatings, Surface and Coatings Technology, Volume 389, 2020, 125648,ISSN 0257-8972.
- Fünfschilling, S; Fett, T; Hoffmann, M. J. Mechanisms of toughening in silicon nitrides: the roles of crack bridging and microstructure [J]. Acta Materialia. 2011, 59, 3978–3989.
- Ferraro, C; Meille, S; Réthoré, J. Strong and tough metal/ceramic micro-laminates [J]. Acta Materialia. 2018, 144, 202–215. [Google Scholar] [CrossRef]
- Bartolomé, J.F; Gutiérrez-González, C.F; Pecharroman, C. Synergistic toughening mechanism in 3Y–TZP/Nb composites [J]. Acta materialia. 2007, 55, 5924–5933. [Google Scholar] [CrossRef]
- Kumar, R.S. Crack-growth resistance behavior of mode-I delamination in ceramic matrix composites [J]. Acta Materialia, 2017, 131, 511–522. [Google Scholar] [CrossRef]
- Zhang, Y; Guo, L; Zhao, X. Toughening effect of Yb2O3 stabilized ZrO2 doped in Gd2Zr2O7 ceramic for thermal barrier coatings [J]. Materials Science and Engineering: A. 2015, 648, 385–391.
- Asmani, M; Kermel, C; Leriche, A; Ourak, M. Influence of porosity on Young's modulus and Poisson's ratio in alumina ceramics. J Eur Ceram Soc 2001, 21, 1081–6. [Google Scholar] [CrossRef]
- Wan, C.L; Qu, Z.X; Du, A.B; Pan, W. Influence of B site substituent Ti on the structure and thermophysical properties of A2B2O7-type pyrochlore Gd2Zr2O7. Acta Mater 2009, 57, 4782–9. [Google Scholar] [CrossRef]
- ASTM E112-96. Standard test methods for determining average grain size. 2004.
- Yang, J; Wan, C. L; Zhao, M; Shahid, M; Pan, W. Effective blocking of radiative thermal conductivity in La2Zr2O7/LaPO4 composites for high temperature thermal insulation applications. J Eur Ceram Soc 2016, 36, 3809–14. [Google Scholar] [CrossRef]
- Wang, C. M; Guo, L; Ye, F.X. LaPO4 as a toughening agent for rare earth zirconate ceramics. Mater Des 2016, 111, 389–93. [Google Scholar] [CrossRef]
- Evans, A.G; Charles, E.A. Fracture toughness determinations by indentation. J Am Ceram Soc 1976, 59, 371–2. [Google Scholar] [CrossRef]
- Asmani, M; Kermel, C; Leriche, A; Ourak, M. Influence of porosity on Young's modulus and Poisson's ratio in alumina ceramics. J Eur Ceram Soc 2001, 21, 1081–6. [Google Scholar] [CrossRef]
- Ren, X.R; Guo, S. C; Zhao, M; Pan, W. Thermal conductivity and mechanical properties of YSZ/LaPO4 composites. J Mater Sci 2014, 49, 2243–51. [Google Scholar] [CrossRef]
- Du, A. B; Pan, W; Ahmad, K; Shi, SL; Qu, Z.X; Wan, C.L. Enhanced mechanical properties of machinable LaPO4/Al2O3 composites by spark plasma sintering. Int J Appl Ceram Technol 2009, 6, 236–42. [Google Scholar] [CrossRef]
- Zhou, H; Guo, Y; Li, J; et al. Microstructure and mechanical properties of 8YSZ ceramics by liquid-phase sintering with CuO-TiO2 addition [J]. Journal of Central South University, 2012, 19, 1196–1201.
- Ren, X.R; Guo, S. C; Zhao, M; Pan, W. Thermal conductivity and mechanical properties of YSZ/LaPO4 composites, J. Mater. Sci. 2014, 49, 2243–2251. [Google Scholar] [CrossRef]
- Steinberg, L; Naraparaju, R; Heckert, M; Mikulla, C; Schulz, U; Leyens, C. Erosion behavior of EB-PVD 7YSZ coatings under corrosion/erosion regime: effect of TBC microstructure and the CMAS chemistry, J. Eur. Ceram. Soc. 2018, 38, 5101–5112. [Google Scholar] [CrossRef]
- Taya, M; Hayashi, S; Kobayashi, A. S; Yoon, H.S. Toughening of a particulate reinforced ceramic-matrix composites by thermal residual stress. J Am Ceram Soc 1990, 73, 1382–91. [Google Scholar] [CrossRef]
- Zhou, Y; Gan, M; Yu, W; et al. First-principles study of thermophysical properties of polymorphous YTaO4 ceramics [J]. Journal of the American Ceramic Society, 2021, 104, 6467–6480.
- Chen, L; Song, P; Feng, J. Influence of ZrO2 alloying effect on the thermophysical properties of fluorite-type Eu3TaO7 ceramics [J]. Scripta Materialia, 2018, 152, 117–121.
- Wang, D.Z; Hu, Q.W; Zeng, X.Y. Residual stress and cracking behaviors of Cr13Ni5Si2 based composite coatings prepared by laser-induction hybrid cladding [J]. Surface and Coatings Technology, 2015, 274, 51–59. [Google Scholar] [CrossRef]
- Chung, D. H; The Voigt-Reuss-Hill (VRH) approximation and the elastic moduli of polycrystalline ZnO, TiO2 (Rutile), and -Al2O3. J Appl Phys. 1968, 39, 2777–82. [Google Scholar] [CrossRef]
- Yang, J; Wan, C; Zhao, M; et al. Effective blocking of radiative thermal conductivity in La2Zr2O7/LaPO4 composites for high temperature thermal insulation applications [J]. Journal of the European Ceramic Society, 2016, 36, 3809–3814.
- Shen, Z; Liu, Z; Mu, R; et al. LaGdZrO/YSZ thermal barrier coatings by EB-PVD: microstructure, thermal properties and failure mechanism [J]. Chemical Engineering Journal Advances, 2021, 5, 100073.
- Cao, Y. N; C, Li; Y, Ma; Luo, H. Y; Yang, Y.H; Guo, H.B. Mechanical properties and thermal conductivities of 3YSZ-toughened fully stabilized HfO2 ceramics, Ceram.Int. 2019, 45, 12851–12859. [Google Scholar]
- Zhou, Y; Gan, M; Yu, W; et al. First-principles study of thermophysical properties of polymorphous YTaO4 ceramics [J]. Journal of the American Ceramic Society, 2021, 104, 6467–6480.
- Luo, C; Li, C; Cao, K; et al. Ferroelastic domain identification and toughening mechanism for yttrium tantalate–zirconium oxide [J]. Journal of Materials Science & Technology, 2022, 127, 78–88.
- Arlt, G. Twinning in ferroelectric and ferroelastic ceramics: stress relief [J]. Journal of materials Science, 1990, 25, 2655–2666. [Google Scholar] [CrossRef]
- Korolev, P.V; Savchenko, N.L; Kul’kov, S.N. Texture formation on the friction surface in transformation-toughened ceramics [J]. Technical physics letters, 2004, 30, 12–14. [Google Scholar] [CrossRef]
Figure 1.
shows the secondary electron diagram of composite ceramic materials.
Figure 1.
shows the secondary electron diagram of composite ceramic materials.
Figure 2.
XRD pattern of fluorite phase and M-YTaO4 phase composite at 1500°C.
Figure 2.
XRD pattern of fluorite phase and M-YTaO4 phase composite at 1500°C.
Figure 3.
Surface SEM morphology images of Sample YT1-YT5.
Figure 3.
Surface SEM morphology images of Sample YT1-YT5.
Figure 4.
Comparison of the average size of M-YTaO4 and fluorite grains in the composite.
Figure 4.
Comparison of the average size of M-YTaO4 and fluorite grains in the composite.
Figure 5.
Shows the relationship of Vickers hardness (a), fracture toughness and fracture energy (b).
Figure 5.
Shows the relationship of Vickers hardness (a), fracture toughness and fracture energy (b).
Figure 6.
Slow-scan XRD pattern (a) of the composite at 2θ=25°-40°, as well as residual stress (b).
Figure 6.
Slow-scan XRD pattern (a) of the composite at 2θ=25°-40°, as well as residual stress (b).
Figure 7.
shows a schematic diagram of crack growth behavior under the synergistic action of tension and compression.
Figure 7.
shows a schematic diagram of crack growth behavior under the synergistic action of tension and compression.
Figure 8.
Cracks propagation behavior in YT1 showing an intergranular fracture mode (a), and in YT2-YT4 showing an deflection mode triggering mechanism (b).
Figure 8.
Cracks propagation behavior in YT1 showing an intergranular fracture mode (a), and in YT2-YT4 showing an deflection mode triggering mechanism (b).
Figure 9.
The relationship between the measured value of Young's modulus and the value calculated according to the Voigt model.
Figure 9.
The relationship between the measured value of Young's modulus and the value calculated according to the Voigt model.
Figure 10.
Transgranular fracture in YT1 (a), crack bridging (b), deflection (c), and bifurcation (d) in YT2-YT4 due to second phase doping.
Figure 10.
Transgranular fracture in YT1 (a), crack bridging (b), deflection (c), and bifurcation (d) in YT2-YT4 due to second phase doping.
Figure 11.
The M-YTaO4 ferroelastic domain structure was observed by SEM.
Figure 11.
The M-YTaO4 ferroelastic domain structure was observed by SEM.
Figure 12.
The twin grain visible in the figure is the M phase resulting from the displacement phase transformation of T-YTaO4 during cooling, which accords with the characteristics of ferroelastic toughening.
Figure 12.
The twin grain visible in the figure is the M phase resulting from the displacement phase transformation of T-YTaO4 during cooling, which accords with the characteristics of ferroelastic toughening.
Table 1.
Density of sample.
Table 1.
Density of sample.
| Sample |
Density ρ(g•m−3) |
| YT1 |
5.09 |
| YT2 |
5.93 |
| YT3 |
6.22 |
| YT4 |
6.68 |
| YT5 |
6.95 |
Table 2.
Some measured mechanical properties of samples YT1 - YT4.
Table 2.
Some measured mechanical properties of samples YT1 - YT4.
| Sample |
VL |
VT |
E/GPa |
B/GPa |
G |
ʋ |
HV |
| YT1 |
6095.24 |
3413.33 |
150.814 |
110.033 |
59.3027 |
0.271563 |
5.12 |
| YT2 |
6175.44 |
3450.98 |
179.797 |
131.984 |
70.6219 |
0.272956 |
8.31 |
| YT3 |
5803.92 |
3067.36 |
152.886 |
131.494 |
58.5221 |
0.30622 |
7.87 |
| YT4 |
5333.33 |
2580.65 |
119.861 |
130.692 |
44.4872 |
0.347146 |
5.83 |
Table 3.
Calculation parameters of residual stress.
Table 3.
Calculation parameters of residual stress.
| |
E (GPa) |
ν |
α (K-1) |
| Fluorite |
210 |
0.30 |
9.6×10⁻⁶
|
| M-YTaO4
|
177 |
0.35 |
10.7×10⁻⁶
|
Table 4.
Young's modulus of sample.
Table 4.
Young's modulus of sample.
| sample |
Young's Modulus E (GPa) |
| Calculated Values |
Measured Values |
| YT1 |
203.0 |
150.8 |
| YT2 |
196.8 |
179.8 |
| YT3 |
190.2 |
152.9 |
| YT4 |
183.6 |
119.9 |
| YT5 |
177.0 |
78.3 [∗] |
|
Disclaimer/Publisher’s Note: The statements, opinions and data contained in all publications are solely those of the individual author(s) and contributor(s) and not of MDPI and/or the editor(s). MDPI and/or the editor(s) disclaim responsibility for any injury to people or property resulting from any ideas, methods, instructions or products referred to in the content. |
© 2023 by the authors. Licensee MDPI, Basel, Switzerland. This article is an open access article distributed under the terms and conditions of the Creative Commons Attribution (CC BY) license (https://creativecommons.org/licenses/by/4.0/).


