Preprint
Article

Chloride Nutrition Influences the Nitrogen Use Efficiency in Coffee.

Altmetrics

Downloads

168

Views

67

Comments

0

A peer-reviewed article of this preprint also exists.

Submitted:

13 April 2023

Posted:

14 April 2023

You are already at the latest version

Alerts
Abstract
Chloride (Cl-) is applied in coffee in rates as a “macronutrient” due that potassium (K+) is one of the most demanded nutrients by the coffee plant, and the potassium muriate (KCl) bases fertilizer is one the most used by the coffee growers. Does not exist scientific evidence that addresses the question regarding with which is the influences of the Cl- applied in the K fertilization base on MOP on coffee growth, nutrient uptake, and nitrogen use efficiency (NUE). Over four years, two trials were conducted on greenhouse and field conditions to address these questions. The trials set up were designed to test the influence of increased Cl- and reduced S rates on biomass accumulation, nutrient uptake, and NUE. A significant effect of the Cl- rates on growth was observed under greenhouse conditions but a non-significant effect on yield under field conditions. Cl- and S significantly influence the NUE in coffee. The result allows us to conclude that Cl- rates need to be balanced with S rates and that Cl- applied as a macronutrient can improve the NUE in coffee when those rates do not exceed 180 mg. L-1 Cl- and 80 mg.L-1 S in the greenhouse and 150 kg.ha-1.year-1 Cl- and 50 kg. ha-1.year-1 S in field conditions. In practical terms, coffee farmers need to balance the K base fertilizers sources to improve the nutrient use efficiency, especially the NUE.
Keywords: 
Subject: Biology and Life Sciences  -   Agricultural Science and Agronomy

1. Introduction

In crop production, chloride (Cl-) is still being seen as an undesired anion rather than a plant nutrient, mainly because of its toxicity effects resulting from excessive Cl- accumulation in sensitive plant organs under salt stress. There is also a widespread belief that Cl- and nitrate (NO3-) are antagonistic ions competing for plant uptake [1,2]. However, since 1954 Chloride has been considered an essential micronutrient when Broyer et al. [3] demonstrated a direct influence of Cl- on the growth of roots, leaves, stems, and petioles in tomato plants. Chloride is involved in important physiological processes including stomatal regulation, water splitting reactions or Hill reactions in photosystem II. Cl-, also has an osmoregulatory function in the vacuole participating in the phloem loading and unloading of sugars and stimulating the membrane-bound proton-pumping ATPases and PPiases [4,5]. Other important functions are related to balancing the electrical charge of essential cations such K+ and H+, both playing main roles in stabilizing the cell membranes' electrical potential and regulating pH gradients [6].
Being a non-assimilating highly mobile anion, Cl- is the preferred molecule to balance the electrical charge of important cations such as K+; Ca+2, and protons (H+), helping in the stabilization of the electrical potential of cell membranes and the regulation of the pH gradients and electrical excitability [2]. Cl- is directly involved in cell division and, subsequently, leaf area formation [2,7]. Most recently a positive influence of Cl- on the nitrogen use efficiency (NUE) in different crop species has been documented [8].
N fertilizer application in coffee is relatively high with rates of 200 to 500 kg.ha-1. year-1 [9,10,11,12,13]. The efficiency of the mineral N fertilizer or NUE depends on the N rate applied and crop N uptake at a given yield level. Bruno et al. [11] report an N recovery for the whole coffee plant at harvest time of 66% when the N rate was 200 kg N.ha-1 and only 37% when a high N rate of 800 kg N.ha-1 was used. Cannavo et al. [14] reported that 60% of the N applied to the coffee crop remained in the top 60 cm of the soil, meaning that not more than 40% of the N applied was used by the coffee crop. In nursery coffee plants Salamanca et al. [15] found that fertilizer N supplied approximately 20-29% of the total plant N after 4 months and an NUE lower than 10%. The above reports demonstrated that the NUE in coffee needs to be improved, and that integrated strategies must be sought from plant breeding to agronomic management. Within the agronomic management strategies, the appropriate use of sources and doses of fertilizers in conjunction with the times of application are part of the pool of alternatives that need to be considered with the aim to improve the NUE in coffee.
The most often used potassium source by coffee growers is the muriate of potassium (MOP) also known as potassium chloride (60% K2O, 46% Cl), because of its high K concentration, high solubility, and relatively low costs compared to other K sources like potassium sulfate (SOP) and potassium nitrate (PN). The potassium demand of the coffee crop is similar to the nitrogen demand, and in some phenological stages even higher. The mean application of K by the coffee growers changes from region to region, with K fertilization rates between 100 kg to 400 kg K2O ha-1.year-1 depending on the expected yield and K content in the soil [13,16,17,18]. In Colombia, for example, the economic optimum bean yield is achieved with a mean rate of 273 kg K2O ha-1.year-1 in productive coffee plantations [12]. High K2O rates applied with MOP result in high inputs of Cl-, reaching up to 300 kg Cl-.ha-1.year-1.
In weathered tropical soils, the natural content of Cl- tends to be low. Cl- as an anion is not adsorbed by the soil particles and hence is very mobile in the soil. It can be easily lost by leaching under freely drained conditions [4,19]. However, despite its role as a plant nutrient, laboratories in the coffee regions usually don’t consider Cl- in soil or plant analysis.
Chloride (Cl-) is not included as a key nutrient in any of the nutritional programs in the coffee regions, only in fertigation special emphasis is made that Cl- should not exceed 350 mg.L-1 to avoid a reduction in the production capacity of the trees [13]. In rainfed conditions, Cl- is the third most applied nutrient in coffee when MOP is used to supply the K+ needs of the coffee crop. Excess supply and uptake of Cl- in plants is a serious problem, mainly in crops that grow on salt-affected soils [1,19]. Recently Santos et al. [20] demonstrate the negative effect of the chloride applied via fertilizers in coffee with respect to the productivity and coffee cup quality in the Minas Gerais state of Brazil, but no references are available regarding the effects of high Cl- supplies on nitrogen use efficiency (NUE) in coffee growing under rainfed conditions. Hence, this research aimed to evaluate the influence of Cl- applied at rates of a macronutrient on coffee on NUE in coffee.

2. Results

2.1. Influence of Cl and S Rates on Biomass Accumulation, Nutrient Uptake, and NUE under Greenhouse Conditions

The greenhouse had the aim to evaluate the influences of growing Cl- rates and decreasing S rates on the coffee plants’ growth and NUE after 9 months of transplanting. The dry biomass was significantly affected by the Cl/S rates (Table 1), a significant reduction of the dry biomass was observed in the treatment without S with the highest Cl- rates (300 mg.L-1), this reduction can be basically attributed to the strong S deficit observed on this treatment, this low dry biomass accumulation reduces the total N uptake, NUTE, and NUE, clearly indicating the importance of the S on coffee growth and NUE. Otherwise, the treatment without Cl- and the highest S rate (200 mg.L-1) showed the highest biomass accumulation and NUTE but not the highest NUE. The intermediate treatment with 180 mg.L-1 of Cl- and 80 mg.L-1 of S showed the highest total N uptake, and NUE but significantly lower NUTE (Table 1).

2.2. Cl/S Ratios Influence the Nutrient Concentration and Uptake by the Coffee Beans under Field Conditions
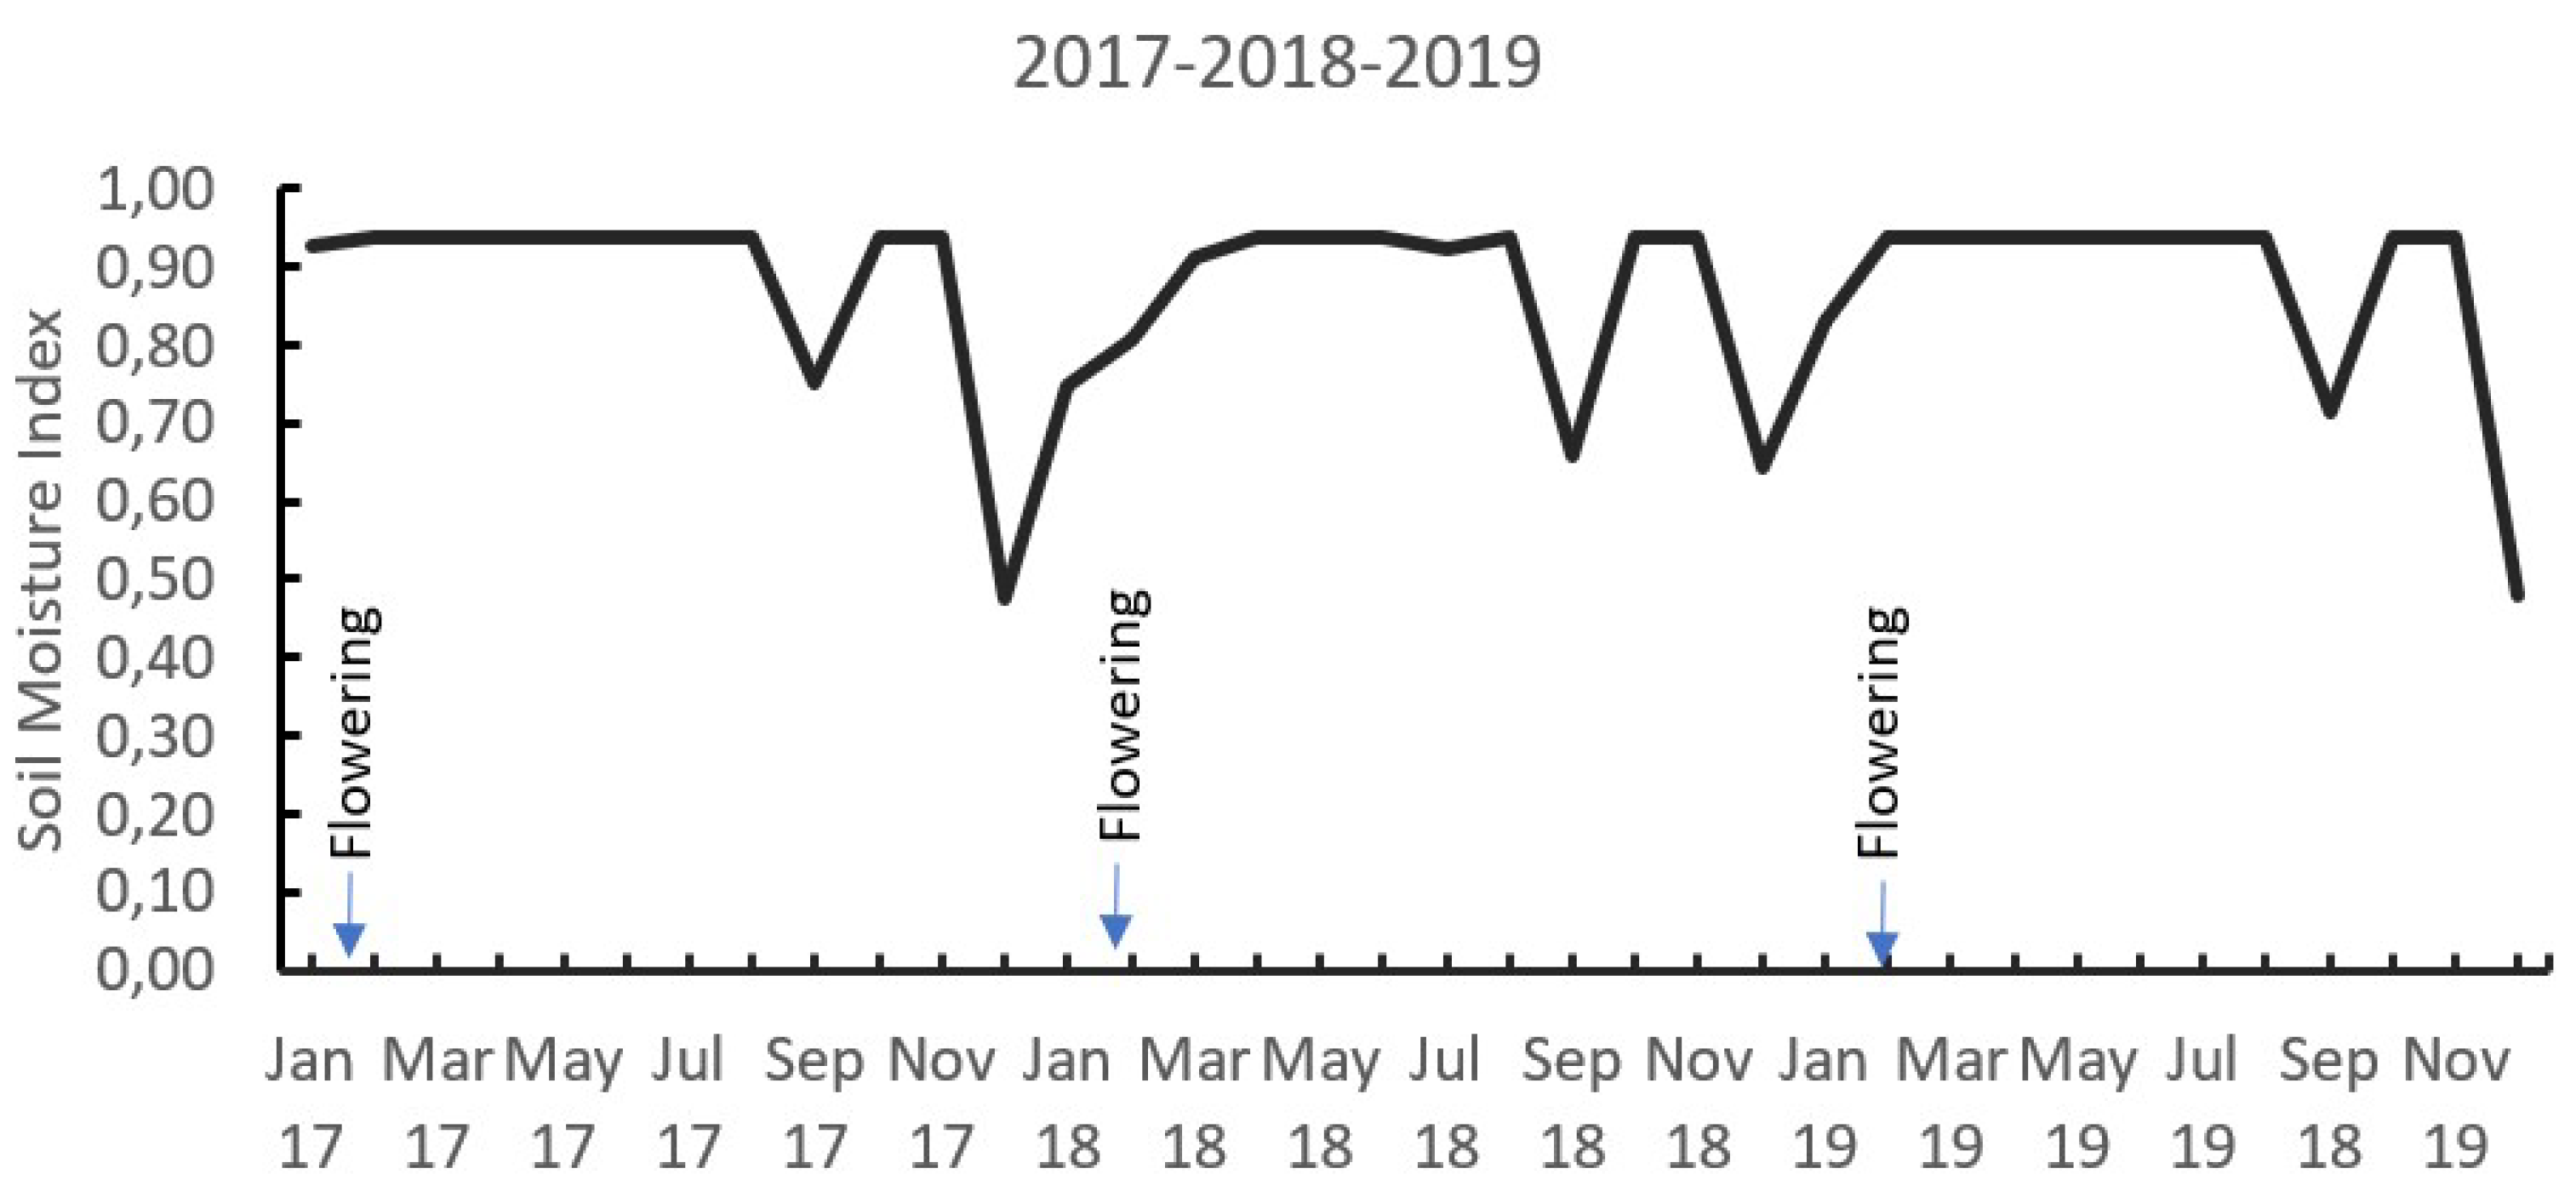
In the field conditions where the present study was carried out, it was possible to observe the occurrence of two dry periods during the year, represented by a soil moisture index (SMI) lower than 1.0, during the months of July to September and December to March. The greatest flowering occurred in the months of February to March associated with a greater water deficit with SMI values between 0.7 and 0.5, indicating that between 70% and 50% of the pore space of the soil is being occupied by water (Figure 1).
Figure 1. Soil moisture index distribution for 3 years (2017, 2018, and 2019). Soil moisture index means the fraction of the porous media of the soil that is occupied by water, SMI = 1,0 means 100% of the soil porous occupied by water, and SMI = 0, soil is completely dry. (See Ramirez et al. [39]).
Preprints 70968 g001
In field conditions on productive coffee plants, the nutrient concentration of the coffee cherries after flowering was reduced in the way that the fresh cherries develop and gain weight. Nitrogen (N) concentrations move from a mean value of 3,6% 30 days after flowering to 1,8% 240 days after flowering or harvest time. At harvest time the N concentration was significantly different between treatments (Table 2), where the treatment with the higher Cl/S ratio (201 kg Cl/33 kg S) showed the lowest N concentration with a mean value of 1,69% compared with the treatment with 150 kg Cl /50 kg S that shown a mean N concentration of 1,89% (Figure 2A).
The potassium (K+) concentration on the coffee cherries moves in average values of 2,7% 30 days after flowering to 1,9% 240 days after flowering. Significant differences between treatments were observed in potassium (K+) at 60 and 150 days after flowering (Table 2). 60 days after flowering the treatment with 201 kg Cl/33S showed a significantly lower K+ concentration of 2,27% than the treatment with 150 kg Cl/50 which shows 2,5% of K+ on the cherries. 150 days after flowering the treatment without Cl- and high S (0 kg Cl/125 kg S) showed the lowest and most significant different K+ concentration on the cherries of 1,95% compared with the treatment with a higher Cl/S ratio of 201 kg Cl/33 kg S with 2,14% of K+ concentration of the cherries (Figure 2B). At harvest time no significant differences were observed in the K concentration on the coffee cherries, but the treatment with a higher Cl/S ratio (201 kg Cl/33 kg S) showed the lowest K+ concentration on the cherries with 1,82% concerning the other treatments where the K+ concentration tend to be higher.
The calcium (Ca+2) concentration in the coffee cherries moves from a mean value of 1,6% 30 days after flowering to 0,36% 240 days after flowering, without any significant differences between treatments during the coffee cherry’s development period (Figure 2C).
The Magnesium (Mg+2) concentration in the coffee cherries moves from a mean value of 0,61% 30 days after flowering to 0,12% 240 days after flowering (Figure 2D), with significant differences between treatments 60 days after flowering (Table 2), where the treatment with a higher Cl/S ratio showed the lowest Mg+2 concentration of 0,25% respect with the treatment with 150 kg Cl/50 kg S, that register a concentration of Mg+2 of 0,30% at that development stage. At harvest time no significant differences were observed in the Mg+2 concentration in the coffee cherries.
The sulfur (S) concentration on the coffee cherries moves from a mean value of 0,32% 30 days after flowering to 0,15% 240 days after flowering (Figure 2E), with significant differences between treatments observed 210 days after flowering (Table 2), the treatment with a medium Cl/S ratio (101 kg Cl and 73 kg S) showed a lower S concentration of 0,12%. No significant differences in the S concentration on the cherries were observed at harvest time (240 days after flowering).
The Cl- was the only nutrient that does not reduce the concentration during the cherries’ development as was described with the other nutrients previously. At 30 days after flowering, the Cl- concentration on the coffee cherries showed a mean value of 0,16%, while 120 days after flowering the Cl- concentration was 6 times higher reaching a mean value of 0,92%, with a subsequent reduction 240 days after flowering reaching a mean value of 0,028% (Figure 2F).
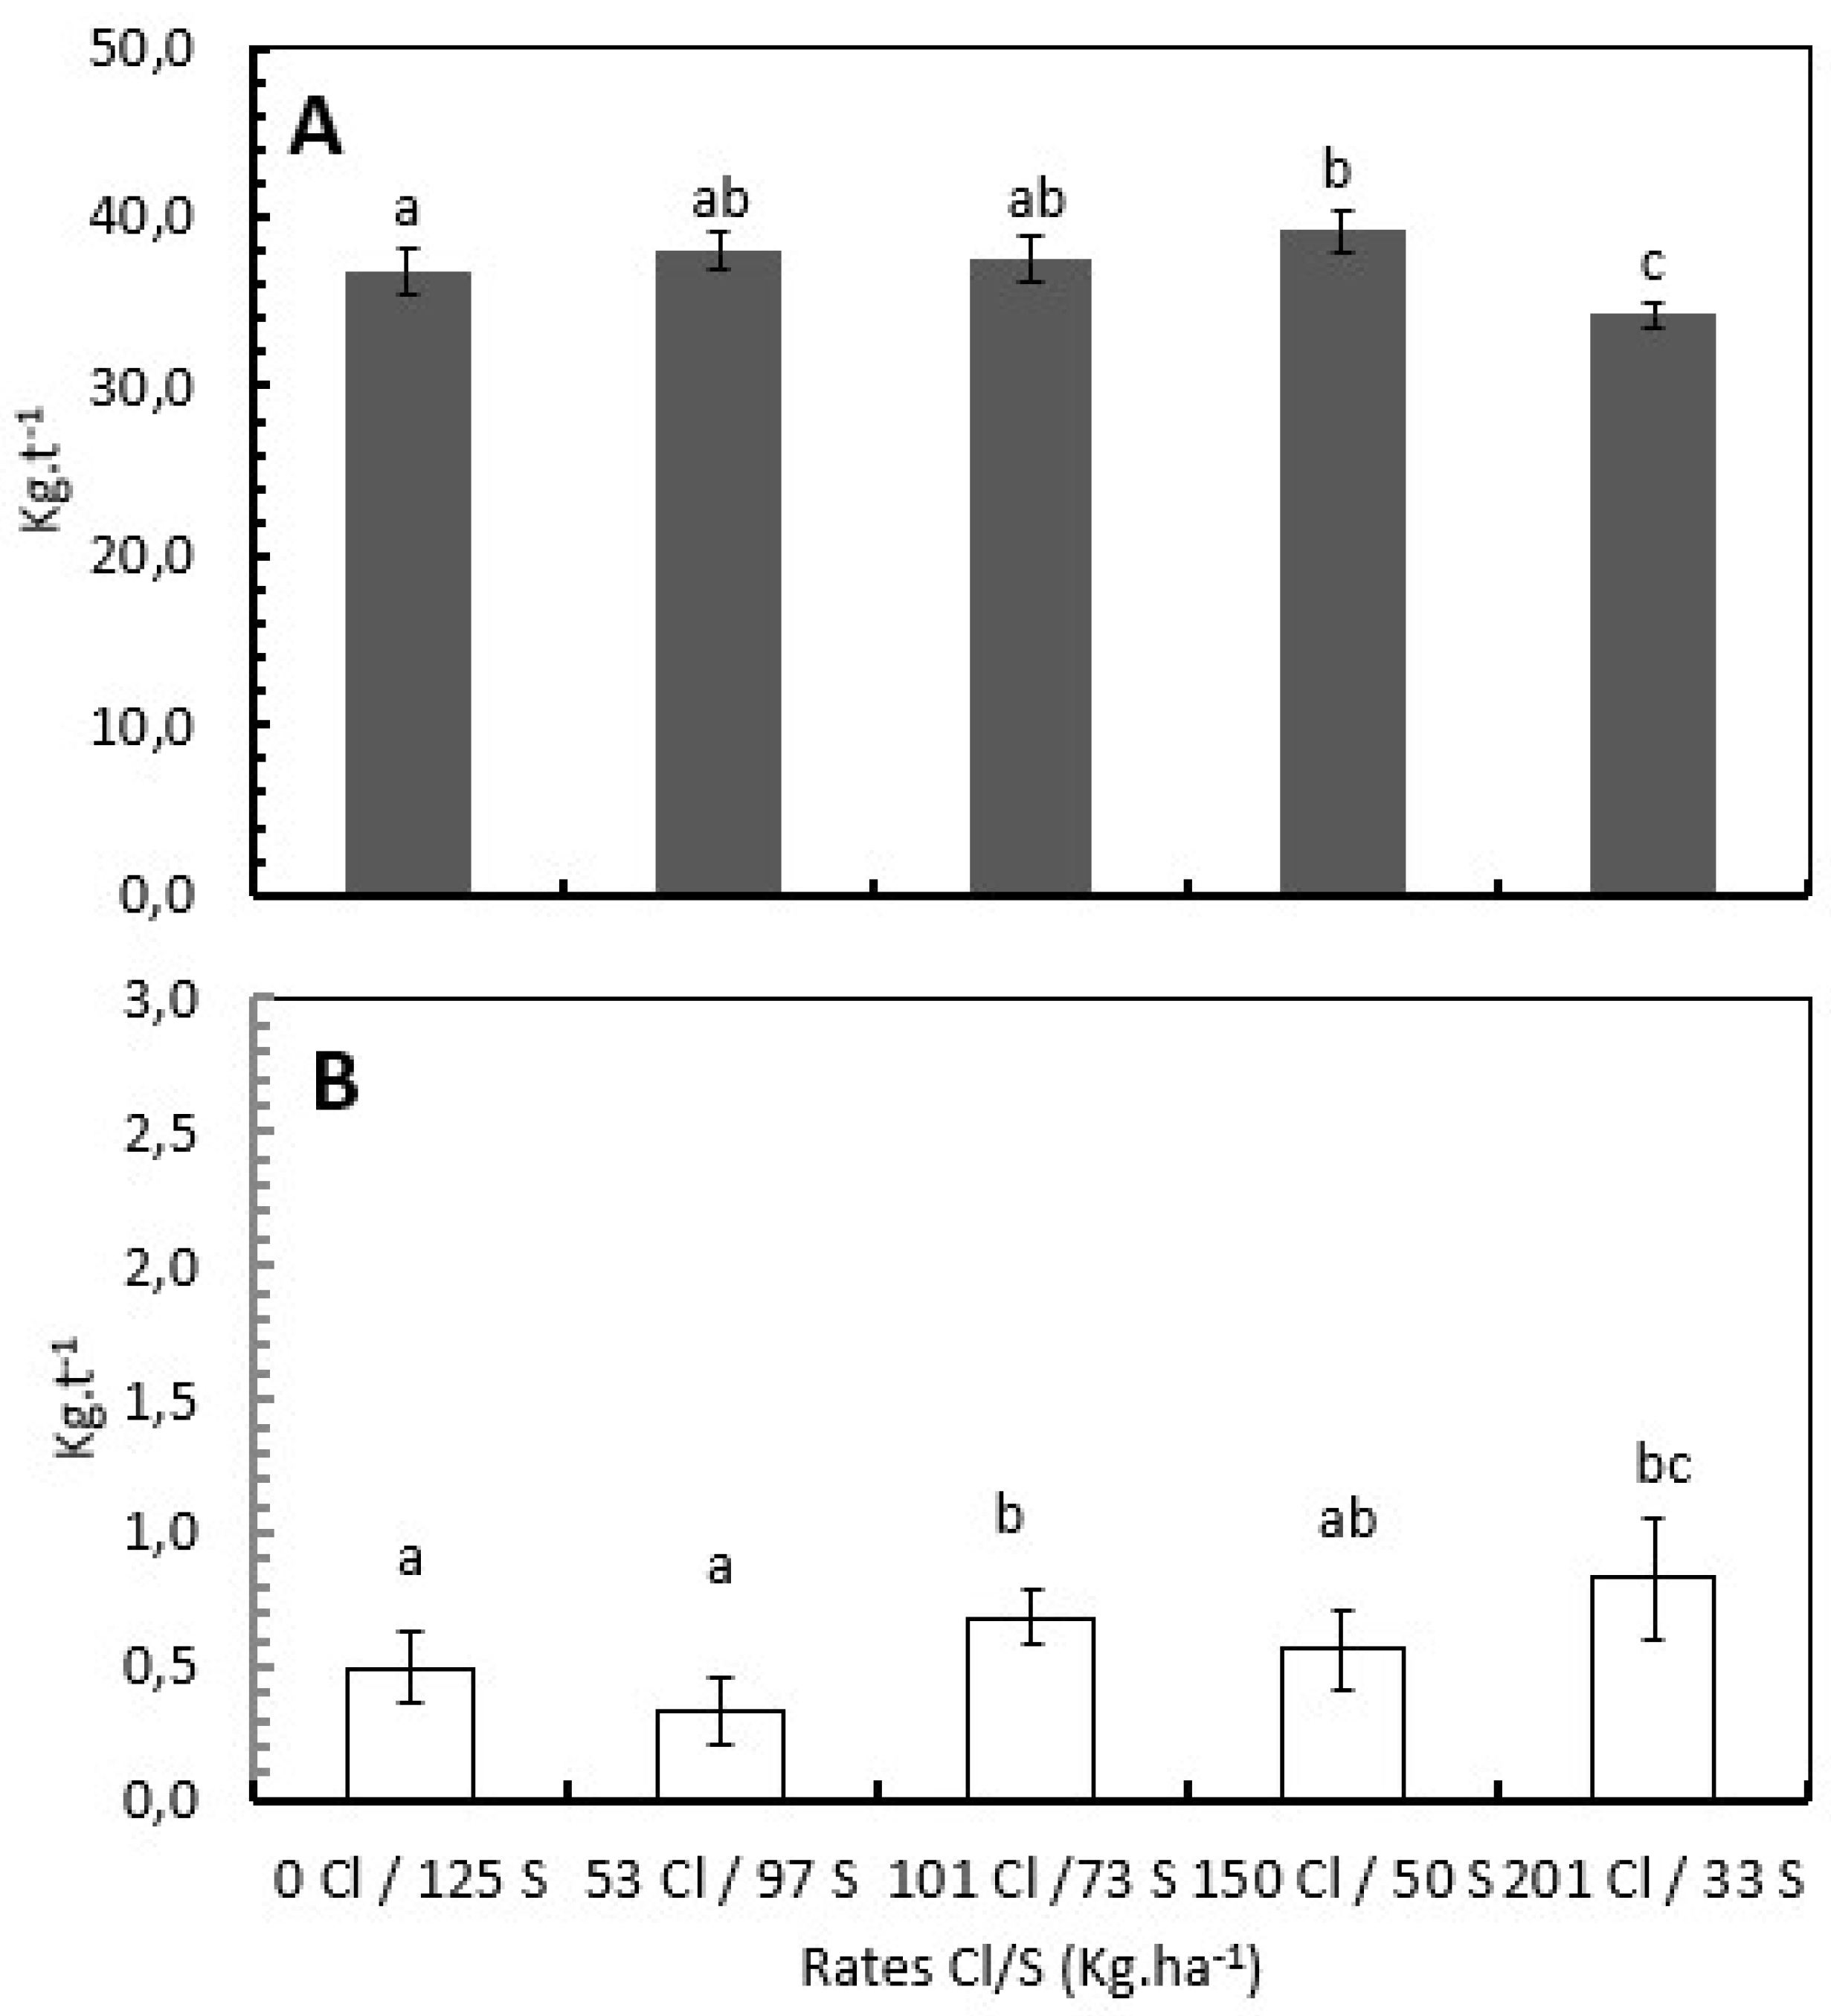
The Cl/S ratios significantly influence the total N and Cl- uptake per ton of green coffee beans. For N, the treatment with 150 kg Cl/50 kg S showed a mean N uptake of 39,13 kg .t-1 of green coffee bean, 14% more N uptake per ton of green coffee than the treatment with 201 kg Cl/33 kg S than showed a mean N uptake of 34,2 kg N.t-1, followed by the treatments with 101 kg Cl/73S with 37,5 kg N.t-1 and the treatment with 53 kg Cl/97 kg S with 37,9 kg N.t-1 representing 9% and 11% more N uptake per ton of green coffee bean respectively (Figure 3A).
The Cl- uptake per ton of green coffee bean was increased proportionately with the increase of the Cl/S ratio, treatments without and with low Cl- presented lower and significantly different Cl- uptake per ton of green coffee with 0,497 kg Cl.t-1 of green coffee bean for the treatment with 0 kg Cl/123 kg S, and 0,336 kg Cl.t-1 of green coffee bean for the treatment with 53 kg Cl/97 kg S. This represents 65% and 144% less Cl- uptake respect to the treatment with the higher Cl- rate (201 kg Cl/53S) where the mean uptake was 0,82 kg Cl.t-1 of green coffee bean (Figure 3B).

2.3. Cl/S Ratios Influence Nitrogen Uses Efficiency by the Coffee Beans at the Field Level

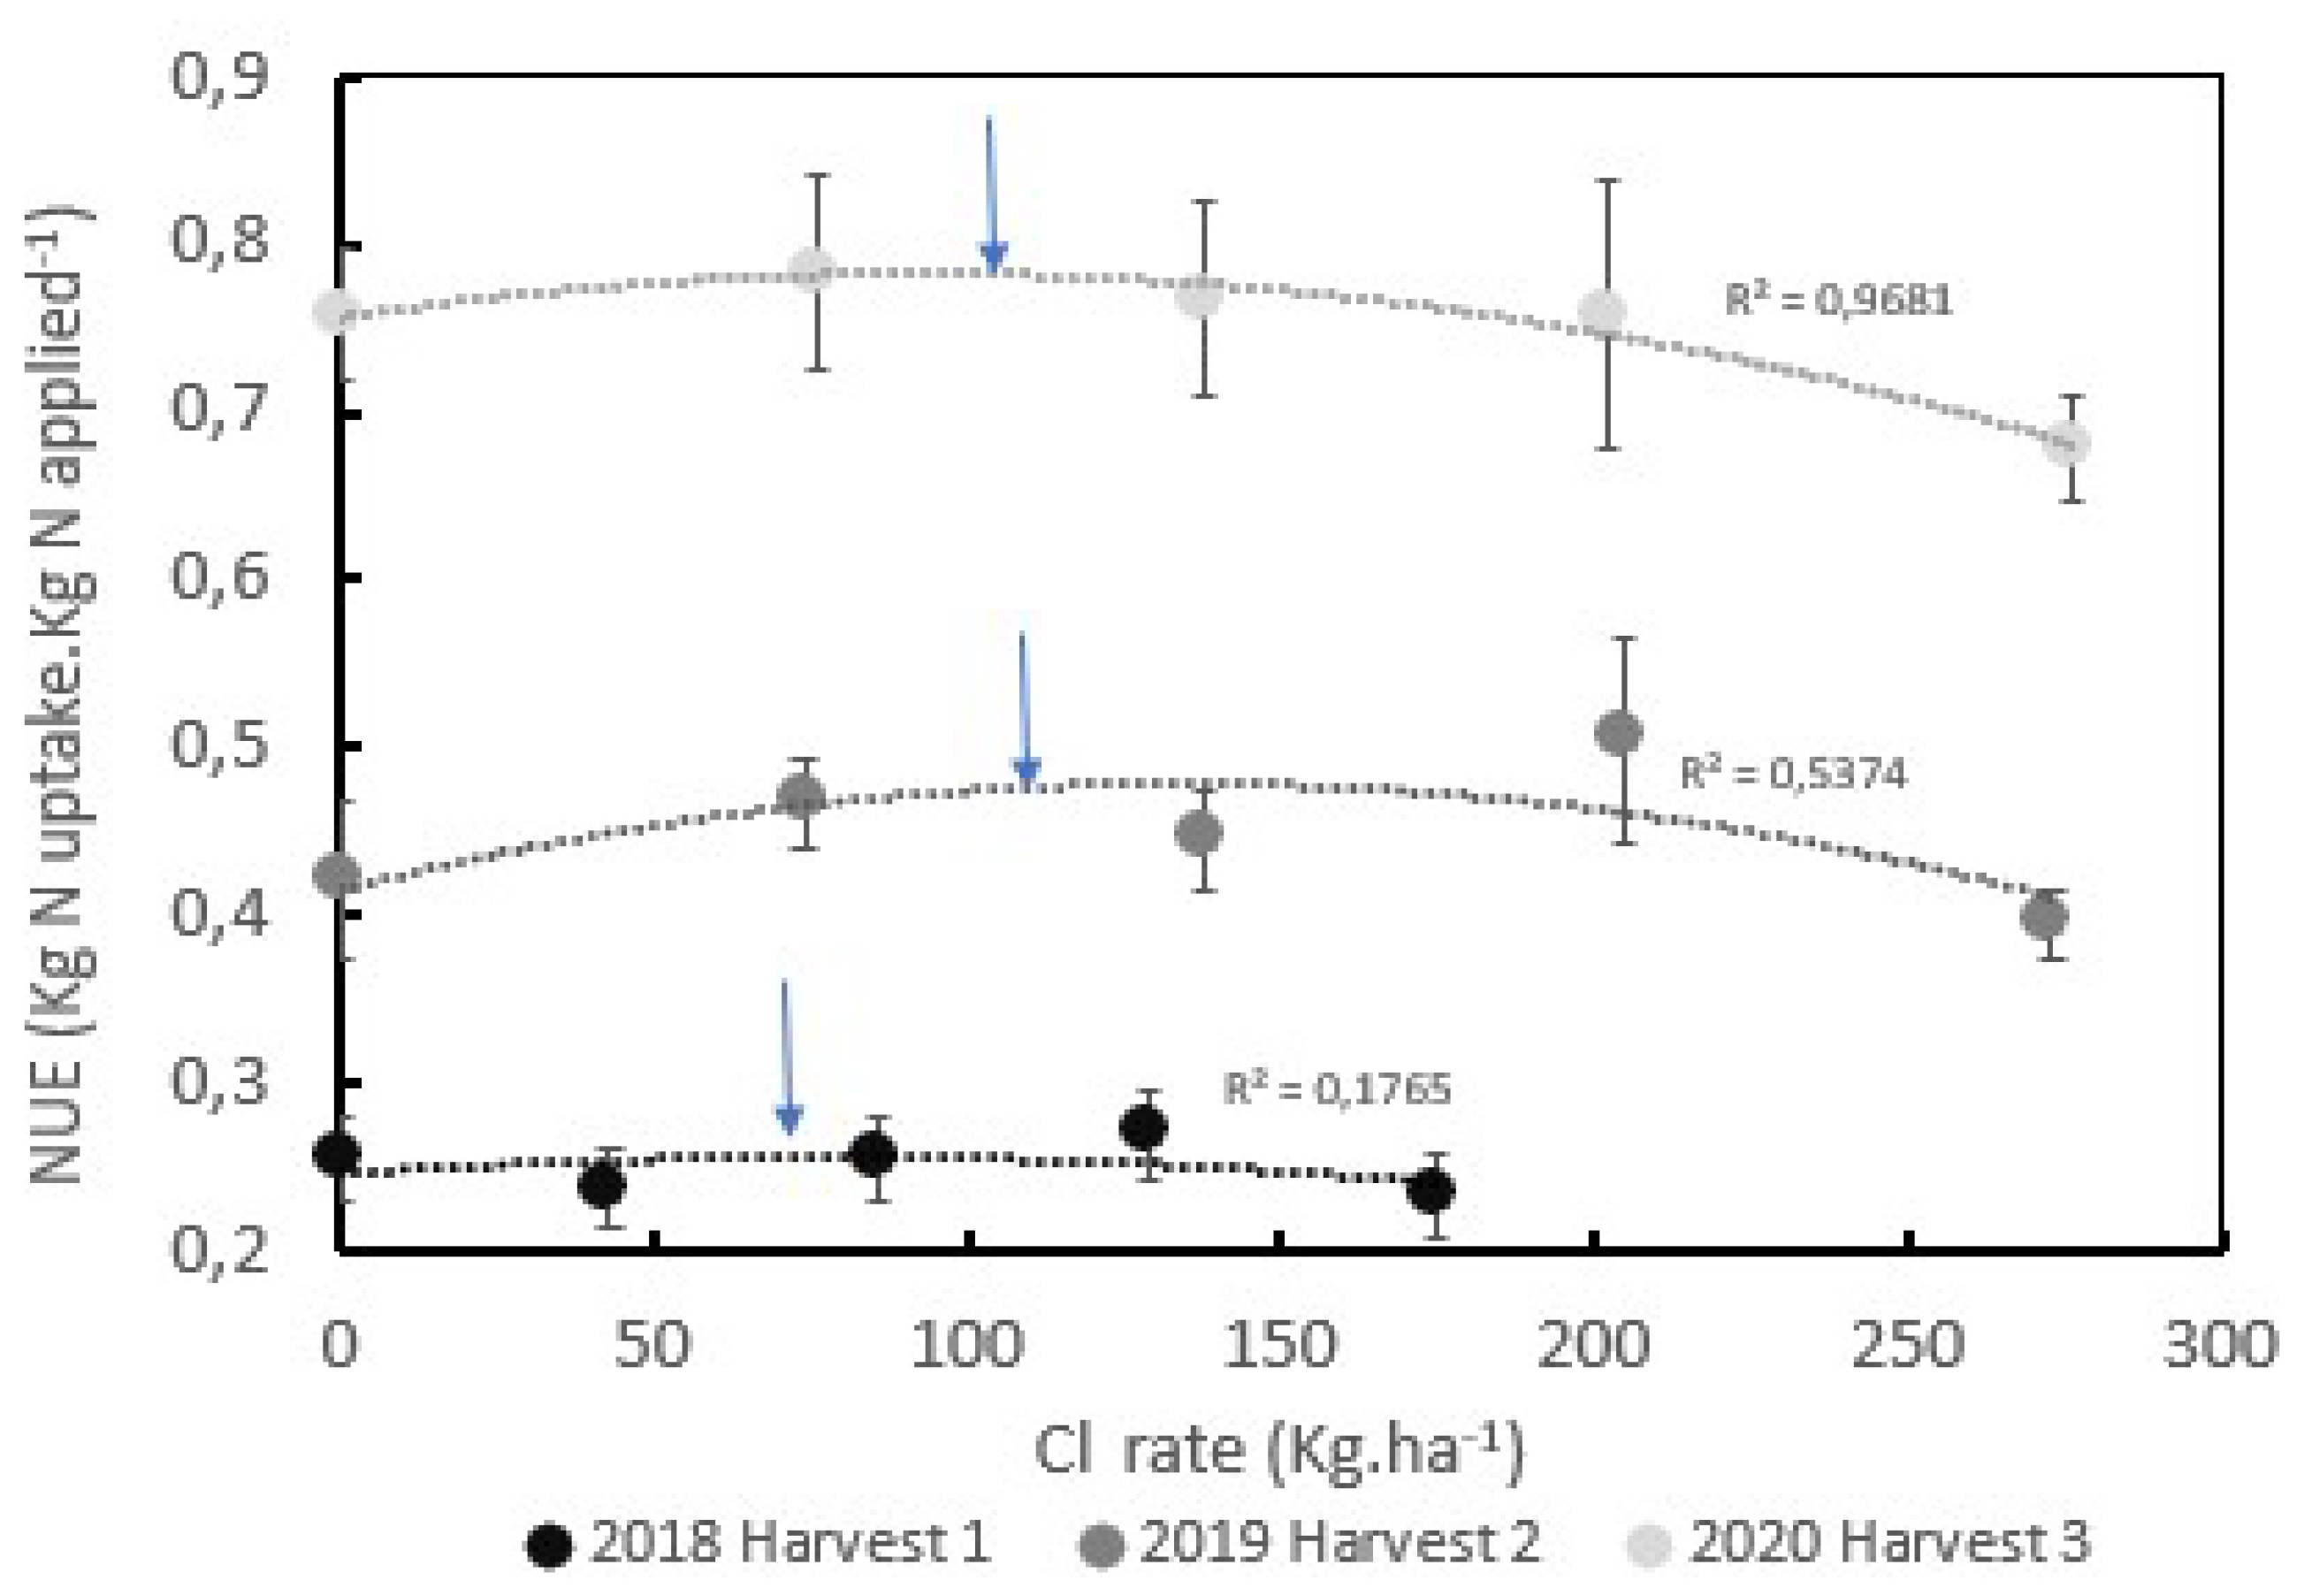
The NUE in the field trial, described as the ratio of the N uptake by the green coffee beans with respect to the mineral N applied, was significantly influenced by the age of the plantation and by the yield (Figure 4). For instance, the NUE for the first harvest after stem pruning was lower than 0,25 kg N uptake per kg of N applied, while in the second harvest increased until a mean value of 0,45 kg N uptake per kg of N applied reached the highest level during the third harvest year with a mean value of 0,75 kg N uptake.kg N applied-1.
The NUE for the productive plants shows a polynomial correlation with respect to Cl- rates (Figure 4), during the second and third harvest years. A significant polynomial correlation between the Cl- rates and the NUE was observed (R2 =0,54 for the second harvest and R2 =0,97 for the third harvest). The polynomial function reaches an optimal NUE with Cl- rates of 73, 113, and 110 kg.ha-1 during the first, second, and third harvests respectively (Figure 4).
The Cl/S rates do not have a significant effect on the coffee yield (Table 3), the treatment with a higher Cl/S ratio (201 kg Cl/33 kg S) during 4 years trial and 3 harvests showed only a 3% lower yield compared with the treatments with lower Cl/S ratios like 145kg Cl/50 kg S or treatment with 53 kg Cl/97kg S, but those treatments showed an improvement on the NUE with a mean value of 14% and 16% respectively.
On average, the NUE range between 0,44 kg to 0,51 kg of green coffee per kg of N applied in the treatments with a higher Cl/S ratio (201 kg Cl/33 kg S) and a lower Cl/S ratio (53 kg Cl/97 kg S) respectively (Table 3).

2.4. Cl/S Ratios Influence the Cl and S Distribution in the Soil Profile

Significant differences in the Cl- concentration in the soil were observed between treatments into the soil depths of 10 and 20 cm. The treatment with a higher Cl/S ratio (201 kg Cl/33 kg S), showed a higher concentration with a mean value of 95,8 mg.L-1 of Cl- at 10 cm depth and 66,4 mg.L-1 at 20 cm depth, which was significantly different from the other treatments were the means Cl- concentrations at that depths range between 27 mg.L-1 at 10 cm depth, and 18 mg.L-1 at 20 cm depth in the treatment with 101 kg Cl/73 kg S, reaching the lowest concentration in the treatment with 0 kg Cl/125 kg S with a mean Cl- concentration of 9,4 mg.L-1 at 10 cm and 10,18 mg.L-1 at 20 cm depth (Figure 5).
These results clearly show a reduction in the Cl- concentration in the soil on the treatments with less Cl- applied and within the soil depth. At 50 cm depth, no significant differences in the Cl- concentration were observed between treatments (Figure 5).
In the case of the S, no significant differences were observed between treatments, but significant differences between soil depths. In the first 20 cm, the treatment with the higher Cl/S ratio (201 kg Cl/33 kg S) had a mean S content of 15,6 mg.kg-1, while the treatment without Cl- and the higher S rate (0 kg Cl/125 kg S) shown a mean value of 23,4 mg.kg-1, but a 50 cm of depth the treatment without Cl- and the higher S rates (0 kg Cl/125 kg S) increase the S concentration significantly until 71,8 mg.kg-1, while the treatments lower S rates and medium Cl- rates (150 kg Cl/50 kg S) shown a lower S concentration of 11,92 mg.kg-1 at 50 cm depth.

3. Discussion

3.1. Cl- Concentration on Tissues and Influence on Growth and Productivity

The Cl- does not appear a typical micronutrient since the actual Cl- concentration in plants is in the range of 0,2 to 2% of dry matter [4,6]. In most plant species the Cl- requirements for optimal plant growth, however, is in the range of 0,02% to 0,04% of dry matter [5]. In this research, the Cl- concentration on the leaves changes according to the Cl- rate from 0,03% in the treatment without Cl- until 2,98% of the dry matter for the treatment with 300 mg.L-1 Cl- without S, these increase of the Cl- concentration on the greenhouse trial had a significant effect on the dry biomass accumulation with a significant reduction with the increasing of the Cl- rates (Table 1). According to Chen et al. [4], when Cl- levels are high enough to be toxic, the cations absorption like K+ decrease because of the disordered cell metabolism. In the greenhouse trial, we see this tendency with the significant reduction in the dry biomass accumulation when the Cl- rates increase from 0 to 60 mg.L-1.(Table 1), and in the field conditions, a significant reduction in the K+ concentration on the coffee cherries was observed 60 days after flowering but no significant effect on the K+ uptake at harvest time (Table 2, Figure 2).
The Cl- content in grains, fruits, and seeds is very low and is hardly affected by the Cl- concentration of the soil solution [21]. In the case of the field trial, we observe strong changes in the Cl- concentration in the coffee cherries during the development process that was directly linked with the fertilizer application time and the soil moisture changes during the year (Figure 1 and Figure 2). In the work of Silva et al. [22] who compared the influence of K-sources on coffee productivity and quality, it is possible to observe 30% less Cl- concentration in the coffee beans on the treatments with SOP compared with the MOP, with significant impact on the coffee quality parameters like the total sugar content and polyphenol oxidase activity.
The Cl- application stimulates plant growth when it is supplied at macronutrient levels [8]. The increase in biomass production induced by the higher rates of Cl- applications as a macronutrient are associated with the stimulation of higher turgor, cell size, and shoot expansion [2,6]. Studies in soils with high to very high extractable K+ levels on wheat and alfalfa in Argentina showed a positive influence of the Cl- fertilization using MOP and ammonium chloride as a fertilizer source [23]. In both cases, the authors report 50% yield increases independently of the fertilizer sources with Cl- rates between 23 to 56 kg.ha-1. In anion crop, Cl- supplied in higher levels up to 500 mg.kg-1 on the nutrient solution shows that Cl- on average is the fourth most utilized essential element, superseded only by N, K, and P [24]. In this investigation, in both coffee trials, no stimulating effect of the application of Cl- on growth and yield was observed (Table 1 and Table 3), otherwise a reduction in biomass accumulation in the greenhouse with Cl- rates higher than 60 mg.L-1. At field conditions, in Brazil Santos et al. [20] report yield reduction with the application of 100% of the K+ as a MOP, which represented an average Cl- dose of 230 kg Cl.ha-1.year-1.
A negative effect could be observed in some crops when the rates of Cl- increase to 200-400 mg.kg-1, for most crops the negative effect could be obvious when the applied amount increase to 400-500 mg.kg-1, and the yield of most crops decreased rapidly when the applied Cl- exceed 800 mg.kg-1 [4].

3.2. Cl- Influence on Nutrients Uptake and NUE

Cl- plays a quantitatively important role in ion balance when Cl- is abundant, but other anions (nitrate, malate) can fulfill this role when Cl- supply is reduced. Competitive effects in uptake between Cl- and N-NO3- and Cl- and SO44- were documented by De Wit et al. [25], recently has been reported that Cl- somewhat affects the uptakes and utilities of N, P, K, Ca, Mn, Si, S, Zn, Mg, Fe, and Cu in potatoes, and most extreme competitive effect with N-NO3- in crops like rice, corn, soybean, cabbage, tomato, strawberry, melon and lettuce, peanut, barley, citrus, and spring wheat [4,21].
Cl- in excess can strongly reduce the NUE specially interfering with its uptake, transport, and loading into the root xylem, since it uses the same anion channels used by NO3- [26,27]. NO3- and Cl- are the most abundant inorganic anions in plants and share similar physical properties and transport mechanisms, which is the origin of the strong dynamic interactions between these two monovalent anions, and that frequently explains why the higher accumulation of Cl- leads to lower NO3- content in plants [2]. This antagonistic interaction between Cl- and NO3- has been reported by several authors [19,21,28], and is one of the reasons why Cl- is considered a detrimental nutrient in agriculture.
Colmenero-Flores et al. [2] have shown that prolongated exposures to a nutrient solution containing Cl- at a concentration of 4-5 mM (140-180 ppm), may cause a gradual non-toxic accumulation of Cl- at values ranging between 2,5 to 5,0 % DW (macronutrient levels), without any interferences on the plant growth and stress symptoms. According to Carillo and Rouphael [27], when Cl- is in excess, it is passively transported into the cortical cell and the xylem by anion channels such as the NO3- transporter NPF7.3 and S-type anion heteromeric channel SLAH1/SLAH3, high Cl- concentration at the leaf level turn out less controlled and more dangerous than those of sodium due to the lower capacity of the leaf blade to exclude Cl- and its limited basipetal phloem transport toward the roots.
When Cl- is accumulated in high concentration in the leaf tissues, it initially decreases the apoplast osmotic potential interfering with the cellular water relations [27]. Thereafter, it diffuses into the symplast by using anion (e.g., nitrate and phosphate) uptake symporters competing with these beneficial nutrients for the uptake within the cell [27].
In coffee growing under greenhouse conditions, the highest doses of Cl- without S strongly reduce N uptake, the NUTE, and NUE. Treatments without Cl- showed the highest NUTE but not the highest N uptake and NUE. Treatments with low to medium Cl- rates (60 to 18 mg.L-1) significantly increase NUE without significant changes in NUTE (Table 3).
At the field level, the results showed significant differences in the N uptake by the coffee cherries (Figure 3) according to the Cl- and S rates, the treatment with high Cl- (201 kg Cl/33 kg S) showed significantly lower N uptake than the treatment without Cl- (0kg Cl/125 kg S), but the higher and significantly different nitrogen uptake was achieved in the treatment with medium Cl- rate (between 100-150 kg Cl/73-50 kg S), similar tendency observed on the NUE (Figure 4).
Rosales et al [8], suggest that the Cl- nutrition reduces NO-3 sequestration in plant leaf tissues (e.g., vacuolar compartmentalization), making this valuable N source available for assimilation and biosynthesis of organic N. Cl- can improve the NUE, despite significantly reducing foliar NO-3 storage, which really represents a radical change in the perception of the Cl- and NO-3 antagonist. The most likely scenario is when NO-3 is available, the active transport mechanism which frequently is more selective for NO-3 than for Cl- prioritizes the NO-3 influx by inhibiting the Cl- uptake, when little NO-3 is available, Cl- influx is less inhibited increasing root uptake and intracellular Cl- concentration, which is expected to replace NO-3 in serving an osmotic function, allowing more efficient use of the available N [2]. Rosales et al. [8] report that Cl- significantly increases the NUE in different crops like tobacco, olive, mandarin, lettuce, spinach, and chard when accumulate at macronutrient level. Finely modulating the Cl- dose for decreasing the NO-3 accumulation in leaves or improving its uptake and assimilation without decreasing the growth and productivity of the plants is necessary [27].
In the case of coffee at the field level, this fine modulation of the Cl- and S rates and ratios shows potential benefits to improving the nitrogen use efficiency, as is indicated by these results, making a fine balance on the Cl/S rates with mean values on a productive coffee plantation between 100 to 150 kg Cl- ha-1. year-1 and 73 -50 kg S.ha-1.year-1.
The discussion on the effect of Cl- on the quality of the coffee cup is still open. Silva et al. [22] demonstrated more than ten years ago a reduction in quality parameters with the application of MOP in coffee, and recently Santos et al. [20] demonstrated a significant reduction in the quality assessment of the coffee cup in treatments that had low and high proportions of Cl- in mineral K fertilization. But an interesting note in the study by Santos et al. [20] is that the treatment without Cl- was not the one that presented the highest yields in coffee, while the treatment with 25 to 50% of K+ as MOP and 75% to 50% as SOP (57 to 115 kg Cl.ha-1.year-1) presented the highest yield, probably related to the effect of Cl- on the NUE.

3.3. Cl- on the Soil

The Cl- content of the soil is not an intrinsic property of the soil but rather a result of soil management [21]. As Cl- can move freely with the soil water, soil Cl- levels can be highly variable and can increase or decrease from year to year, depending on the water table and the location in the landscape [1,29]. Soils considered low in Cl- are below 2 mg.kg-1. In wheat in several soils of the USA, Fixen et al. [30], report that higher Cl- levels on the soil of 43,5 kg.ha-1 (0-0,6 m) were adequate for near-maximum wheat yield; in Argentina, Diaz-Zorita et al. [23] report that the Cl- levels in the soil are higher than 13,2 mg.Kg-1 (0,0 to 0,2 m) was adequate for maximum grain yield.
In the present research in coffee, the Cl- concentration on the treatments with 201 kg Cl/33S showed a mean value of Cl- of 98,5 mg.L-1 at 0-0.10 m depth and 66,4 mg.L-1 at 0,10-0.20 m depth, without significant differences on the crop yield during 4 years, but with significant influence on N uptake and efficiency. Those results are indicating that for coffee the ideal Cl- concentration on the soil should be below 30 mg. L-1. In Coffee in Brazil Santos et al. [20], found a significant difference in the Cl- content in the soil, the treatments with 100% K+ applied as MOP had an average Cl- content in the soil in the first 20 cm of the depth of 130 kg.ha-1 (approx. 65 mg.L-1 of Cl-), while the treatment without Cl- with 100% K+ applied as SOP had a significantly lower Cl- content in the soil at the same depth equivalent to 50 kg .ha-1 (approx. 25 mg.L-1 of Cl-).

4. Materials and Methods

During the period of four years, two trials were carried out under greenhouse and field conditions, with the aim to test rates and rations of Cl- and S in coffee and its influences on growth, nutrient uptake, productivity, and NUE.

4.1. Greenhouse Trial

The greenhouse trial was located in Dülmen, Germany at the Hanninghof Research Center of Yara International. The mean air temperature was 23,1°C (+/- 2,2°C) with a maximal air temperature of 31,4°C and minimal air temperature of 15,3°C, mean relative humidity of 64% (+/- 10%), mean light intensity of 20,0 Klux during summertime. A supplemental light (300 mmol m-2 s-1 photosynthetic photon flux density) over a period of 12 -14 h was given when the natural light became insufficient.
Coffee seeds from the Coffea arabica var. Cenicafé 1 were pre-germinated in dark conditions with a mean temperature of 28°C for 6 weeks using disinfected sphagnum-moos as a germination medium. Before the radicle emerged (BBCH scale 03-Arcila et al., 2002 [31], the pre-germinated seeds were moved to small containers with perlite as a growing medium. The seeds were allowed to germinate for 6 months, during this germination process the plants received a nutrient solution once per week containing: N (7,6mM), P (0,3mM), K (1,7mM), Mg (0,2mM), Ca (0,9mM), Fe (5,0mM), Mn (2,9mM), Zn (1,5mM), Cu (0,6mM), B (9,2mM) and Mo (0,2mM).
Once the plants reached three pairs of leaves that were completely open (BBCH scale 13- Arcila et al. [31], they were transplanted in pots of 4,5 L. The aim of the greenhouse trials was to evaluate the influence of different Cl- and S rates and proportions on growth and nutrient uptake and NUE. In this trial several Cl- and S rates and ratios were tested as follows: 0/200; 60/160; 120/120; 180/80; 240/40 and 300/0 Cl/S in mg.L-1. In this trial, the coffee plants were grown in coarse sand as a growing medium. All other nutrients were applied as a nutrient solution to the soil surfaces, without any foliar application. Pots were watered with a complete nutrient solution containing N (28,6mM), P (1,5 mM), Mg (6 mM), Ca (4,5 mM), Fe (14,7 mM), Mn (8,4 mM), Zn (5,3 mM), B (5,2 mM)), Cu (14,2 mM) and Mo (1,5 mM). The nutrient solution was applied once per week with application volumes between 60 and 120 mL, according to the water demand of the plants. The soil moisture was daily monitored with the aim of avoiding water deficits or excess, keeping it between 60% to 70% of the water holding capacity.
After 9 months of transplanting the coffee plants were trimmed, and the tissues (leaves, stems, and branches) were dried in an oven at 65°C until a constant weight was attained. The dried material was then finely ground for nutrient analysis in the lab.
Finely milled plant materials were used for elemental analysis after wet digestion in a microwave digester (MLS mega; MLS GmbH, Leutkirch, Germany). All the micro- and macronutrients (excluding nitrogen) were analyzed using inductively coupled plasma optical emission spectrometry (Perkin-Elmer Optima 3000 ICP-OES; Perking-Elmer Corp, CT, USA). The nitrogen was determined by the micro-Kjeldahl method.
Two nitrogen use efficiency (NUE) indicators were calculated: (i) N uses efficiency (NUE) calculated as the total nitrogen uptake by the shoot plant divided by total N applied during the growing period (g shoot DW g-1 N) and (ii) N utilization efficiency (NUTE) calculated as the total shoot dry biomass divided by the total nitrogen content in the shoot (g DW mg-1 N). The NUTE indicator allows for an understanding of how efficiently the transported N is used by the plant [8].

4.2. Field Trial

For four years, from January 2017 to December 2020, a field trial was carried out in the southeast region of Colombia, in Garzón-Huila on a farm located at 02°11´N-75° 34´W and at 1.437 m elevation. In a soil predominantly of consolidated materials, mainly granitic in nature, with moderately low soil fertility as follow: pH 4,71; organic matter at 3,08%; and P, K, Ca, and Mg contents at 11, 125, 530, and 52 mg.kg-1, respectively, with a soil particles distribution of 48% sand, 18% silt, and 34% clay. The pH was determined in water (1:1), organic matter by Walkley-Black, P by Bray-II, and the exchangeable fraction of K, Mg, and Ca with 1 N ammonium acetate extraction (1 N NH4C2H3O2, pH 7,0). The cations in the extracts were detected using an ICP (Perkin Elmer, Optima 8000), and soil texture analysis was done using the hygrometer-Bouyoucos method. The mean climatic conditions observed in the region from 2017 to 2019 are shown in Table 4.
The trial was installed in a Coffea Arabica L. variety Castillo® with resistance to the coffee leave rust (CLR) disease generated by the fungi Hemileia vastatrix Berkeley and Brome [32]. The plantation was established in 2012 in a full sunshine condition (FS) planted at a density of 6.666 plants.ha-1 at 1,0 m distance between plants and 1,5 m distance between rows. Before the treatment application, the plantation was stem trimmed at 30 cm height in January 2017, aiming to rejuvenate the plantation and initiate a new productive cycle from 2018 to 2020. Five treatments differing in their Cl/S ratio have been installed in the trial. Rates of Cl- and S increased over the 4 years according to increments in growth and yield formation. (Table 5).
The sources of Cl- used in the trial were potassium muriate (MOP with 60% K2O and 46% Cl) and the S source was potassium sulfate (SOP with 50% K2O and 18 % S). The Cl- and S rates were adjusted based on the potassium requirement of the crop, considering crop K2O demand and K2O content in the soil [33,34,35]. The mean nutrient rates over 4 years were: 231 kg N, 265 kg K2O, 80 kg P2O5, 110 kg CaO, and 51 kg MgO kg.ha-1 (Table 5). The total nutrient rate was split into 3 applications during the year: at pre-flowering, and at 30 and 100 days after flowering.
The experiment was set up in a randomized complete block design with four replications, each plot in the block had 45,0 m2 with 12 effective plants. Five plants of each compelling lot were selected for yield assessments, and the other 7 plants of the plot were chosen to make destructive sampling of the coffee cherries every 30 days after flowering until harvest with the aim to evaluate the nutrient concentration and nutrient uptake of the coffee cherries and beans over time. In each of the 7 plants, branch number 10, counted from the apex to the base, was labeled at the pre-flowering stage (BBCH scale 54-57) and the cherries of the labeled branch were harvested every 30 days from 30 to 240 days after flowering. Each effective plant served as a replicate.
The other 5 effective plants were used for the assessments at harvest. On average the coffee was harvested over 8 months in a year with the main harvest (70% of the year) collected from September to November. The coffee cherries were harvested when reaching maturity at BBCH scale 88 at 240 days after flowering.
All cherry samples were dried at 60°C for a few days until a constant weight was attained and finely ground for nutrient analysis. The nutrients K, Ca, Mg, S, and Cl were analyzed using inductively coupled plasma optical emission spectrometry (Perkin-Elmer 400; Perking-Elmer Corp., Norwalk, CT, USA). N was analyzed by Micro-Kjeldahl method.
The nitrogen uses efficiency by the coffee beans (NUE) was estimated using an index between the total nitrogen uptake by the coffee beans at harvest (BBCH scale 88) divided by the total amount of nitrogen applied during the crop season. This NUE indicator is known as a fertilizer-base indicator [36] and can be considered similar to the partial N balance (PNB = plant N content per unit of fertilizer N applied) described by Doberman [37].
With the aim to evaluate the Cl- concentration, and distribution in the soil profile after three years of treatment application, soil samples were collected per treatment and replication at a 25 cm lateral distance to the stem where nearly 86% of the coffee roots are located [38]. Samples were taken at three soil depths (10 cm, 30 cm, and 50 cm).
A soil moisture index (SMI) was estimated using daily weather data. The SMI is defined as the ratio between actual volumetric soil moisture and volumetric saturation humidity [39], following the water balance approach described by Ramirez and Küsters [40].
All data were submitted to statistical analysis (ANOVA) according to the experimental design using the Statgraphics Centurion software package (Statgraphics Technologies, Inc). The Shapiro-Wilk modified test was applied for normality testing and the residual vs prediction test to evaluate the heterogeneity of variances. Fischer´s test was used to detect the treatments that significantly affected the ANOVA.

5. Conclusions

This work presents novel results regarding the influence of the Cl- application in coffee and its influence on growth, productivity, and NUE. After four years of research on the greenhouse and field, we can conclude that:
-A balance between Cl- and S is necessary for coffee with the aim to improve N uptake and NUE, at greenhouse conditions should be between 60 to 180 mg.L-1 of Cl and 160 to 80 mg.L-1 of S. Plants without Cl- or without S significantly reduce the NUE. At the field level, the balances should be between 100 to 150 kg Cl- ha-1. year-1 and 73 to 50 kg S. ha-1. year-1.
-Cl- is applied in coffee in rates as a “macronutrient”, and the coffee plants can take higher amounts of Cl- reaching concentration on the leaves higher than 0,69% without toxicity symptoms, clearly indicating that coffee is a Cl- tolerant crop. With the aim to keep a balance between biomass accumulation and NUE, the Cl- content on the leaves should be lower than 0,33%.
-Cl- rates at field level highest than 150 kg Cl- ha-1. year-1 significantly increases the Cl- content in the soil, the Cl- uptake by the coffee cherries, and reduces the N uptake by the coffee cherries, reducing the NUE on average by 9 to 14%.
-In terms of the NUE the Cl- content in the soil in coffee in the first 20 cm depth should not exceed the concentration of 30 mg.L-1.
-The NUE in coffee could be improved by using agronomical management practices like the selection of the mineral potassium fertilizer sources, with the main aim to reduce the Cl- application rates and limit them to no more than 100 to 150 kg Cl- ha-1 with a fine balance with S rates as was mentioned before.

Author Contributions

Trials conceptualization, data analysis, and writing V.R.B., J.K.; Field trial implementation, and data acquisition J.A., L.L.; greenhouse trial implementation, and data acquisition E.T.

Funding

This work was supported by Yara International.

Data Availability Statement

No applicable.

Acknowledgments

The authors thank the Plant Science Departments from the National University of Colombia to support the graduate student, especially Dr. Maria Sara Mejía de Tafur, and Jaime Figueroa-Cantillo coffee grower to support the field trial.

Conflicts of Interest

The authors declare that there is no conflict of interest.

References

  1. White, J.P.; Broadley, R.M. Chloride in Soils and its Uptake and Movement within the Plant. A Review. Annals of Botanic. 2001. 88:967-988. [CrossRef]
  2. Colmenero-Flores, J.M.; Franco-Navarro, J.D.; Cubero-Front, P.; Peinado-Torrubia, P.; Rosales, M.A. Chloride as a beneficial Macronutrient in Higher Plants: New Roles and Regulation. Int. J. Mol.Sci. 2019. 20. 4686. [CrossRef]
  3. Broyer, T.C.; Carlton, A.B.; Johnson, C.M.; Stout, P.R. Chlorine-A micronutrient element for higher plants. Plant Physiol. 1954.29:526-532.
  4. Chen, E.; He, L. Z.; Yang, E.X.; Mishra, S.; Stoffella, J.P. Chlorine nutrition of higher plants: progress and perspectives. Journal of Plant Nutr. 2010. 33:943-952. [CrossRef]
  5. Marschner, P. Marschner´s Mineral Nutrition of Higher Plants. Third Edition. 2012. Edited by Petra Marschner. Academic Press/Elsevier.668p.
  6. Franco-Navarro, J.D.; Brúmos, J.; Rosales, M.A.; Cubero-Font, P.; Talón, M.; Colmero-Flores. J.M. Chloride regulates leaf cell size and water relations in tobacco plants. J.Exp.Bot. 2015. 67: 873-891. [CrossRef]
  7. Terry, N. Photosynthesis, Growth, and the Role of Chloride. Plant Physiol. 1977.60:69-75.
  8. Rosales, M.A.; Franco-Navarro, J.D.; Peinado-Torrubia, P.; Diaz-Rueda, P.; Alvarez, R.; Colmero-Flores, J.M. Chloride Improves Nitrates Utilization and NUE in Plants. Front. Plant Sci. 2020.11.442. [CrossRef]
  9. Neto, A.P.; Favarin, J.L.; Munhoz de Almeida, R.E.; Dos santos-dias, C.T.; Tezotto, T, Ferreira, M.T. Changes of Nutritional Status during a Phenological Cycle of Coffee under High Nitrogen Supply by Fertigation. Communications in Soil Science and Plant Analysis. 2011. 42:2414-2425. [CrossRef]
  10. Neto, A.P.; Favarin, J.L; Rodrigues do Reis, A.; Tezotto, T.; Munhoz de Almeida, R.E.; Levres, J.; Gallo, L.A. Nitrogen metabolism in coffee plants in response to nitrogen supply by fertigation. Theor.Exp.Plant Physiol.2015.27:41-50. [CrossRef]
  11. Bruno, P.I.; Unkovich, J.M.; Bortolotto, P.R.; Bacchi, O.S.; Dourado, N.D., Reichardt, K. Fertilizer nitrogen in fertigated coffee crop: Absorption changes in plant compartments over time. Field Crops Research. 2011.124:369.377.
  12. Sadeghian, K. S.; Duque, O.H. Optimal doses of nutrients for coffee plantations in production: Economical considerations (in Spanish) Advances Técnicos Cenicafé, 2021.533, 1–8. [CrossRef]
  13. Favarin, J.L.; Teles de Souza, L.; Mazzafera, P.; Dimenstein, L. Soil correction and fertilization of irrigated coffee plants in production.(in Portuguese) In: Cafeicultura do Cerrado/editores técnicos Gladyston Rodrigues/Carvalho et al-Belo Horizonte:EPAMIG. 2021. 564p.
  14. Cannavo, P.; Harmand, J.M.; Zeller, B.; Vaast, F.; Ramirez, J.E.; Dambrine, E. Low nitrogen use efficiency and high nitrate leaching in a highly fertilized Coffea arabica -Inga densiflora agroforestry system: a 15N labeled fertilizer study. Nutr. Cycl. Agroecosyst. 2013.92(2). [CrossRef]
  15. Salamanca, J.A.; Doane, T.; Horwath, R.W. Nitrogen Use Efficiency of Coffee at the Vegetative Stage as Influenced by Fertilizer Application Method. Front.Plant Sci. 2017. 8:223. [CrossRef]
  16. Silva, E.B., Nogueira, F.D., Guimaräes, P.T.G.; Furtini Neto, A.E. Responds of the coffee to the potassium fertilization (in Portuguese). Pesq. Agropec. Bras. 2001. 36(11):133-1337.
  17. Sadeghian, K. S. Soil fertility and coffee nutrition in Colombia (in Spanish). Boletín Técnico No 32.-Cenicafé. 2008.43p.
  18. Cuzato-Mancuso, M.A.; Peres, S.R.; Costa, C.C.A.; Amaral, C.G.S. Effect of the potassium sources and rates on arabica coffee yield, nutrition, and macronutrient export.Rev..Bras.Cienc.Solo.2014.38(5):1448-1456. [CrossRef]
  19. Mengel, K.; Kirkby, E.A. Principles of Plant Nutrition. Edt. International Potash Institute, CH-3048 Worblaufen-Bern/Switzerland.1978.593p.
  20. Santos, C.; Malta, M.R.; Gonzalves, M.G.M.;Borém, F.M.; Pozza, A.A.A.; Martinez, H.E.P.; de Souza, T.I.; Chagas, W.F.T.; de Melo, M.E.A.; Oliveira, D.P. et al.. Chloride Applied via Fertilizer Affects Plant Nutrition and Coffee Quality.. Plants.2023.12, 885. [CrossRef]
  21. Xu, G.; Magen, H.; Tarchitzky, J.; Kafkafi, U. Advances in chloride nutrition of plants. In Advances in Agronomy; Sparks, D.L., Ed.; Academic Press: San Diego, ca, USA.2000.Vol 68: 97-150.
  22. Silva, E.B., Nogueira, F.D., Guimaräes, P.T.G.; Chagas, S.J.R.; Costa, L. Sources and rates of potassium influence on productivity and quality of the coffee (in Portuguese). Pesq. Agropec. Bras. 1999.34(3):133-1337.
  23. Diaz-Zorita, M.; Duarte, A.G.; Barraco, M. Effects of Chloride Fertilization on Wheat (Triticum aestivum L.) Productivity in the Sandy Pampas Region, Argentina. Agron. Journal. 2004.96(3): 839-844. [CrossRef]
  24. Randle, M.W. Chloride Requirements in Onion: Clarifying a Widespread Misunderstanding. Better Crops. 2004.88(4).
  25. De Wit, C.T.; Dijkshoorn, W.; Noggle, J.C. Ionic balance and growth of plants. Verlagen van landbouwkundige onderzoekingen, Wageningen, 1963.68p.
  26. Diatlofft, E.; Roberts, M.; Sanders, D.; Roberts, K.S. Characterization of Anion Channels in the Plasma Membrane of Arabidopsis Epidermal Roots Cells and the Identifications of a Citrate-Permeable Channel Induced by Phosphate Starvation. Plant. Physi.2004.136:4136-4149.
  27. Carillo, P and Rouphael, Y. Nitrate Uptake and Use Efficiency: Pros and Cons of Chloride interference in the Vegetable Crops. Front. Plant. Sci. 2022. 13:899552. [CrossRef]
  28. Kafkafi, U.; Valoras, N.; Letey, J. Chloride interaction with nitrate and phosphate nutrition in tomato (Lycopersicon esculentum L.). J. of Plant. Nutr.2008.5(12): 1369-1385. [CrossRef]
  29. Imas, P.; Bansal, S.K. Use of MOP as fertilizer- Some Myths and Reality. Fertilizer News. 2004.49(11):51-55.5p.
  30. Fixen, P.E.; Buchenau, W.G.; Gelderman, H.R.; Schumacher, E.T.; Gerwing, E.T.; Cholick.; A.F.; Farber, G.B. Influences of Soil and Applied Chloride on Several Wheat Parameters. Agron. J. 1989.78(4): 736-740.
  31. Arcila, P. J., Buhr, L., Bleiholder, H., Hack, H., Meier, U., and Wicke, H. Application of the extended BBCH scale for the description of the growing stages of coffee (Coffea spp.).Ann. Appl. Biol.2002.141, 19–27. [CrossRef]
  32. Alvarado, G.; Posada, H.E.; Cortina, H.A. CASTILLO a New Coffee Variety with Rust Resistance (in Spanish). Av. Tec. Cenicafe. 2005.337, 1–8.
  33. Riaño, H. N.M.; Arcila, P.J.; Jaramillo, R.A.; Chaves, C.B. Dry matter accumulation and nutrient extraction by Coffea arabica L cv. Colombia in three localities of the central coffee zone (in Spanish). Cenicafé.2004.55(4): 265-276.
  34. Sadeghian, K. S.; Mejia, M.B.; Arcila, P.J. Elemental composition of coffee fruits and extraction of nutrients by the harvest in the coffee zone of Colombia (in Spanish). Cenicafé. 2006.57(4): 251-261.
  35. Sadeghian, K.S.; Mejia, M.B.; González, O. H. Accumulation of nitrogen, phosphorus, and potassium in coffee fruits (in Spanish). Av. Tec. Cenicafe. 2013. 429, 1–8.
  36. Congreves, K.A.; Otchere, O.; Ferland, D.; Farzadfar, S.; Williams, S.; and Arcand, MM. Nitrogen Use Efficiency Definitions of Today and Tomorrow. Front. Plant Sci. 2021.12:637108. [CrossRef]
  37. Dobermann, A. Nutrient uses efficient measurement and management. Agronomy & Horticulture. University of Nebraska-Faculty Publications.2007.1442. https://digitalcommons.unl.edu/agronomyfacpub/1442.
  38. Rendón, S.J.R.; Giraldo, H. Distribution of roots in coffee variety Castillo® under two spatial arrangements (in Spanish). Cenicafé.2019.70(1):7-17. [CrossRef]
  39. Ramirez, B. V.H.; Jaramillo, R.A.; Arcila, P.J. Indices to evaluate water status in coffee plantations (in Spanish). Cenicafé. 2010.61(1):55-66.
  40. Ramirez, B. V.H.; Küsters, J. Calcium and Potassium nutrition increase the water use efficiency in coffee: A promising strategy to adapt to climate change. Hydrology.2021.8, 75. [CrossRef]
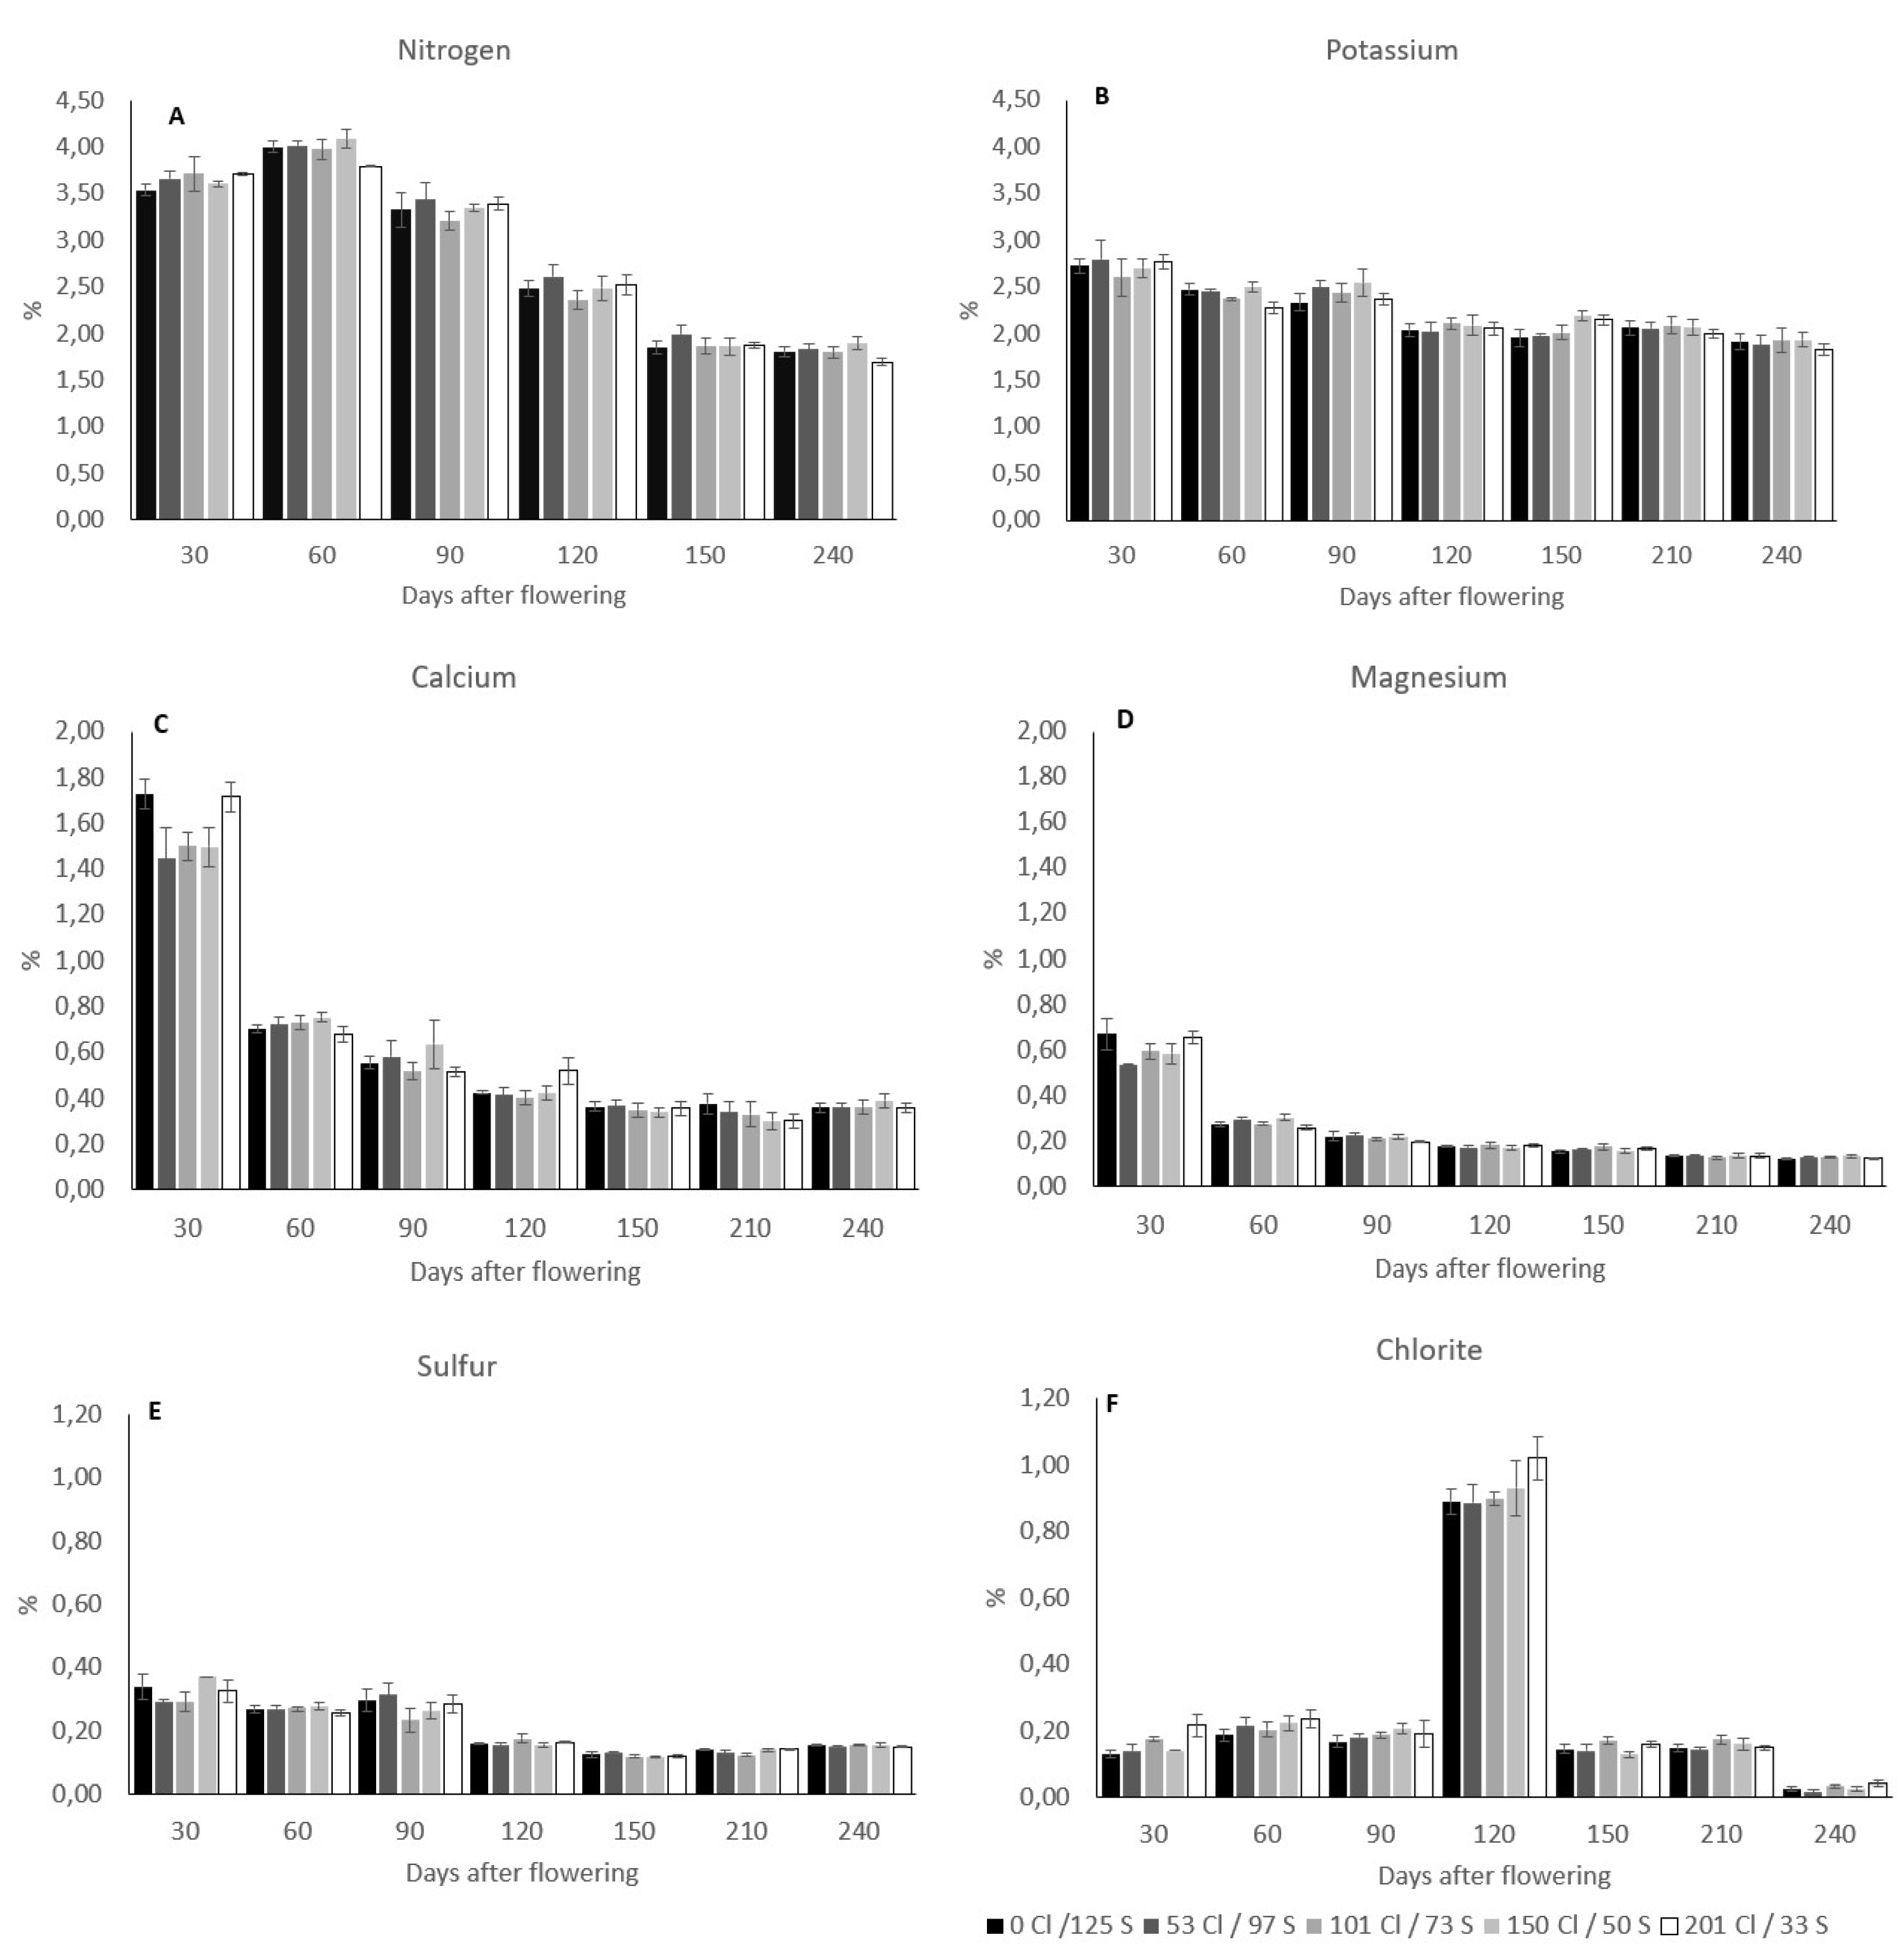
Figure 2. Influence of the Chloride rates on the nutrient concentration in the coffee cherries after flowering. The bars in the figure represent the standard error.
Preprints 70968 g002
Figure 3. Influence of the Chloride rates on the nutrient demand per ton of green coffee bean. The bars in the figure represent the standard error, and different letters denote statistically significant differences according to Fisher´s LSD test with p<0,05.
Preprints 70968 g003
Figure 4. Influence of the Chloride rates during three years of harvests on the Nitrogen uses efficiency-NUE (A) and influence of the means Cl/S ratio during three years on the mean NUE (B). Optimum Cl- rates 73,113 and 110 kg.ha-1 for the harvest years of 2018,2019 and 2020 respectively.
Preprints 70968 g004
Figure 5. Influence of the Chloride and sulfur rates on the Chloride (A) and sulfur (B) distribution in the soil profile. The bars in the figure represent the standard error.
Preprints 70968 g005
Table 1. Influence of different Chloride (Cl-) and Sulfur (S) rates on coffee plants biomass accumulation, nutrient uptake, and nitrogen use efficiency under greenhouse conditions.
Cl/S Rates Total DW Root
DW
N
Cl
N
Uptake
S
Uptake
Total Shoot Cl
Uptake
NUTE NUE
mg.L-1 g.plant-1 Content in Leaves
%
mg.plant-1 g2 DW.
mg-1 N
g Shoot DW. g-1 of N Applied
0/200 82,1d 27,0c 2,58a 0,03a 1.234,7b 174,2c 19,3a 0,047c 0,83c
60/160 74,1bc 20,3bc 2,68a 0,16b 1.230,0b 137,2c 89,1b 0,044c 0,86cb
120/120 79,4cd 23,3bc 2,59a 0,33c 1.236,5b 106,0c 173,4c 0,046c 0,86cb
180/80 74,8bc 18,5b 2,69a 0,55d 1.281,1c 90,4b 276,3d 0,038b 0,89b
240/40 72,1b 16,2ab 2,67a 0,69e 1.306,3c 84,9b 361,7e 0,043c 0,89b
300/0 37,9a 10,2a 4,43b 2,98f 1.095,8a 19,4a 587,2f 0,029a 0,73a
p-value *** ** *** *** *** *** *** *** ***
*P-value <0,10; **P-value <0,05; ***P-value<0,01; Tukey test alfalfa =0,05. ¥NUE Total N uptake/Total N applied N; NUTE Total DW/total N content.
Table 2. Pr>F values from the statistical output (ANOVA) for the influence of the Cl/S rates on the nutrient concentration after flowering and nutrient uptake at harvest time.
Nutrient Concentration (%) Nutrient Uptake at Harvest Time (t.ha-1)
Nutrient Days after Flowering
30 60 90 120 150 210 240 240
p-Value
N 0,67 0,13 0,48 0,37 0,61 -- 0,099* 0,028**
K 0,90 0,02** 0,64 0,93 0,03** 0,94 0,83 0,239
Ca 0,13 0,50 0,46 0,25 0,91 0,42 0,82 0,220
Mg 0,38 0,04** 0,52 0,85 0,49 0,83 0,19 0,398
S 0,38 0,68 0,18 0,36 0,60 0,081* 0,54 0,459
Cl 0,14 0,69 0,78 0,53 0,11 0,21 0,27 0,006**
*P-value <0,10; **P-value <0,05; ***P-value<0,01.
Table 3. Influence of the Cl/S rates on coffee yield, nitrogen uptake, and uses efficiency in coffee.
Cl/S Rate±
kg.ha-1
Yield+
N-Uptake
Mean N-Uptake
Mean N. Applied+
NUE +++
t.ha-1 kg.t-1 kg.ha-1 year-1 kg. kg-1
0/125 4,02
(+/-2,05)
36,7
(+/-2,04)
147,4
(+/-74,5)
308
(+/-20,75)
0,48
(+/-0,23)
53/97 4,01
(+/-1,85)
39,1
(+/-2,43)
157,3
(+/-75,3)
308
(+/-20,75)
0,51
(+/-0,24)
101/73 4,03
(+/-1,96)
37,5
(+/-2,32)
151,4
(+/-75,9)
308
(+/-20,75)
0,49
(+/-0,23)
150/50 4,03
(+/-2,11)
37,9
(+/-2,08)
152,8
(+/-78,5)
308
(+/-20,75)
0,50
(+/-0,24)
201/33 3,92
(+/-1,87)
34,3
(+/-1,31)
134,3
(+/-64,21)
308
(+/-20,75)
0,44
(+/-0,20)
p-value ns * * ns
± The Chlorate rate is the mean Cl- applied during the whole season (2017 to 2020); +Mean yield for three years of harvest 2018,2019,2020; ++Mean nitrogen applied for four years 2017 to 2020; ++NUE es the ratio between the N uptake or cumulated by the coffee cherries/ N applied during the season. This NUpE Total N uptake by the coffee cherries per ha/ Total N applied per ha; ns is not significant and * significant at P-value <0,10.
Table 4. Climate conditions obtained from the weather station*.
Year T.min
(°C)
T.max (°C) T. med (°C) R.H (%) Rainfall (mm) Sunshine (Hours) Rainfall in the Trial Area (mm)
2017
2018
2019
2020
16,9
16,6±
16,1
--
24,6
25,1±
23,8
--
20,2
20,3±
19,4
--
77,1
72,6±
--
--
1.575
1.234
1.426
1.206
1.146,7
--
1.314,0
--
2.483
2.053
2.319
2.100
Mean
*Jorge Villamil weather station 02°20´N-75° 31´W provided by the national Coffee Research Center-Meteorological Network. T. min, Average minimum air temperature; T. max, Average maximum air temperature; T. med, Average mean air temperature; R.H, Average relative humidity. ±Mean value for three months.
Table 5. Treatment description during the four years trial.
Treatment 2017 2018 2019 2020 Average
Cl/S Rates (kg.ha-1)
1 0/41 0/96 0/174 0/188 0/125
2 21/30 43/62 74/140 74/156 53/97
3 40/20 86/41 138/109 138/123 101/73
4 61/10 129/22 205/78 202/91 150/50
5 80/0 175/30 276/44 276/59 201/33
1 to 5 K2O rates (kg.ha-1)
110 230 360 360 265
N rates (kg.ha-1)
160 163 280 320 231
P2O5 rates (kg.ha-1)
90 46 92 92 80
CaO rates (kg.ha-1)
130 86 104 121 110
MgO rates (kg.ha-1)
29 50 54 72 51
Disclaimer/Publisher’s Note: The statements, opinions and data contained in all publications are solely those of the individual author(s) and contributor(s) and not of MDPI and/or the editor(s). MDPI and/or the editor(s) disclaim responsibility for any injury to people or property resulting from any ideas, methods, instructions or products referred to in the content.
Copyright: This open access article is published under a Creative Commons CC BY 4.0 license, which permit the free download, distribution, and reuse, provided that the author and preprint are cited in any reuse.
Prerpints.org logo

Preprints.org is a free preprint server supported by MDPI in Basel, Switzerland.

Subscribe

© 2024 MDPI (Basel, Switzerland) unless otherwise stated