1. Introduction
The pandemic of obesity constantly progresses worldwide and impacts the quality of life and economy of millions of people. During obesity, the excess fatty acids trigger a pro-inflammatory phenotype of adipose tissue and also lead to triglyceride storage in non-adipose tissues, such as skeletal muscle, pancreas, and liver. Eventually, due to the limited storage capacity of these tissues, toxic lipids are formed such as ceramide, sphingosine 1-phosphate, lysophosphatidylcholine etc. These lipid classes in some cases lead to lipotoxicity, a term describing the organelle dysfunction, cell death and inflammation caused by lipid signaling and accumulation in organelle and plasma membranes [
1]. In this process, various molecular mechanisms are involved such as endoplasmic reticulum stress, dysregulated autophagy, apoptosis, necroptosis, pyroptosis, ferroptosis, activation of various immune cells, platelets and hepatic stellate cells; a vicious cycle is formed exhibiting several positive feedback loops [
2]. The umbrella of these mechanisms when taking place in the liver constitutes non-alcoholic steatohepatitis (NASH). Despite the discovery of the details regarding the molecular and genetic pathogenesis of NASH, no approved treatment exists. However, among the several mechanisms mentioned, erythrophagocytosis remains the least explored.
Red blood cells, the gas exchangers in mammals, serve additional functions in both metabolism and immunity [
3]. An aberrant metabolic environment can convert erythrocytes to inflammatory mediators [
4,
5]. Their role in NASH was first discovered in 2007 by Otogawa et al [
6]. They found that erythrophagocytosis is an active mechanism in the liver of NASH animal models and human patients. Phagocytosis of red blood cells then leads to iron disposition in Kupffer cells and hepatocytes, eventually amplifying inflammation and fibrosis. Mechanistically, they showed that the exposed phosphatidylserine of erythrocyte membranes in NASH is partially responsible for erythrophagocytosis. Our previous results have shown that erythrocyte membranes of NASH patients also exhibit reduced levels of sphingomyelin [
7] and accumulation of sphingosine [
8], which can both result in phosphatidylserine exposure [
9,
10]. However, erythrocyte phosphatidylserine exposure can also be triggered by reduced nitric oxide levels [
11]. Since in erythrocytes arginase-1 is the main regulator of erythrocyte nitric oxide levels [
12], we decided to quantify the levels of arginase-1 in erythrocytes of NASH patients.
Apart from phosphatidylserine, phosphatidylethanolamine also translocates to the extracellular face of the lipid bilayer during erythrocyte storage [
13]. In fact, phosphatidylethanolamine has been reported to amplify the pro-phagocytic potential of phosphatidylserine [
14]. A recent study has also highlighted the effect of PE on NAFLD: inflammation, lipogenesis, disrupted autophagy, and reactive oxygen species were all triggered by phosphatidylethanolamine when incubated
in vitro with hepatocyte cell lines or hepatic stellate cell lines [
15]. Since erythrophagocytosis can deliver a substantial lipid cargo, we explored whether erythrocytes contain increased PE, and if they can release PE in vitro, which would be indicative of PE translocation to the extracellular face of the lipid bilayer.
Interestingly, other mechanisms can also lead to erythrophagocytosis. Importantly, erythrophagocytosis can be inhibited by the presence of the “do-not-eat-me” signal, CD47, on erythrocytes when recognized by its receptor SIRPα on macrophages [
16]. We previously found reduced CD47 levels on erythrocytes of NASH patients [
8]. Nevertheless, more recent studies have reported that aging and oxidative stress can convert CD47 to an “eat-me” signal, after conformational change and the subsequent binding of TSP-1 [
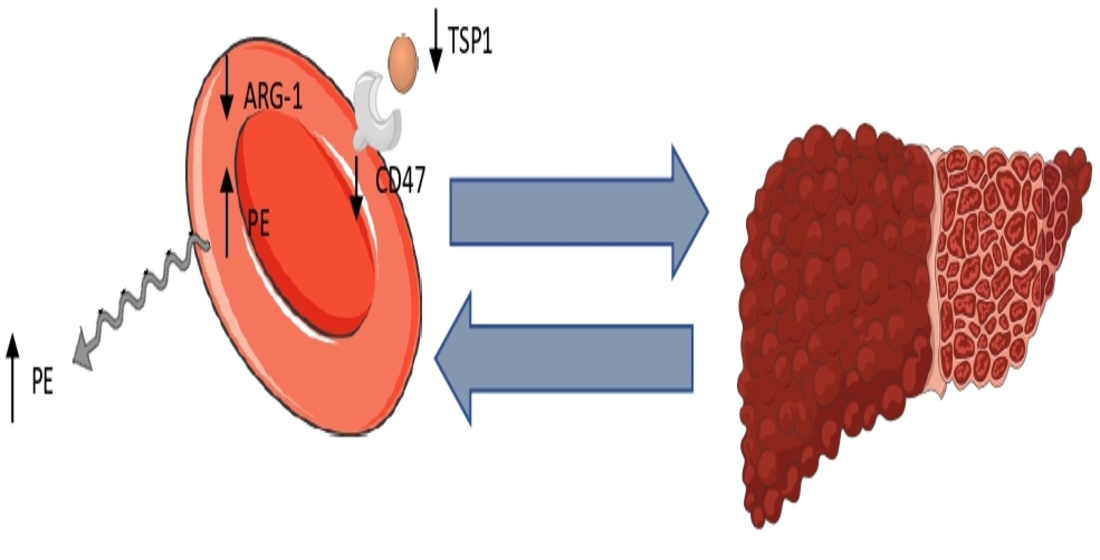
16]. We, thus, wondered whether this mechanism is active in NASH. A synopsis of our hypothesis can be found in
Figure 1.
2. Materials and Methods
Twenty-four patients (9 men and 15 women) and 14 healthy controls recruited consecutively (7 men and 7 women, nonobese, chronic condition-free, with no symptoms of infection in the past 2 months and with normal levels of aspartate aminotransferase [AST] and alanine transaminase [ALT]) participated in the study. They were recruited from the outpatient hepatology clinic of the First Department of Internal Medicine, School of Medicine, Democritus University of Thrace, Alexandroupolis, Greece. All patients were evaluated for the presence of hepatic steatosis using conventional ultrasonography performed by an experienced radiologist as recommended by European guidelines for adults at risk for NASH. At presentation, all patients had increased levels of the enzymes AST and ALT. A diagnosis of NASH was assumed after exclusion of viral hepatitis (A, B, C, D, E) through enzyme-linked immunosorbent assay (ELISA) and/or polymerase chain reaction test, alcoholic and drug induced hepatitis (through a questionnaire), and autoimmune hepatitis (through antibody detection). Patients were further evaluated by noninvasive serum biomarkers to assess stage of liver fibrosis (fibrosis-4 index [FIB-4], AST/ALT ratio). Their anthropometric and clinical characteristics are shown in
Table 1. The study was approved by the Scientific Council of the University Hospital of Alexandroupolis and the Ethics Committee, after informed consent of the participants.
Erythrocyte isolation
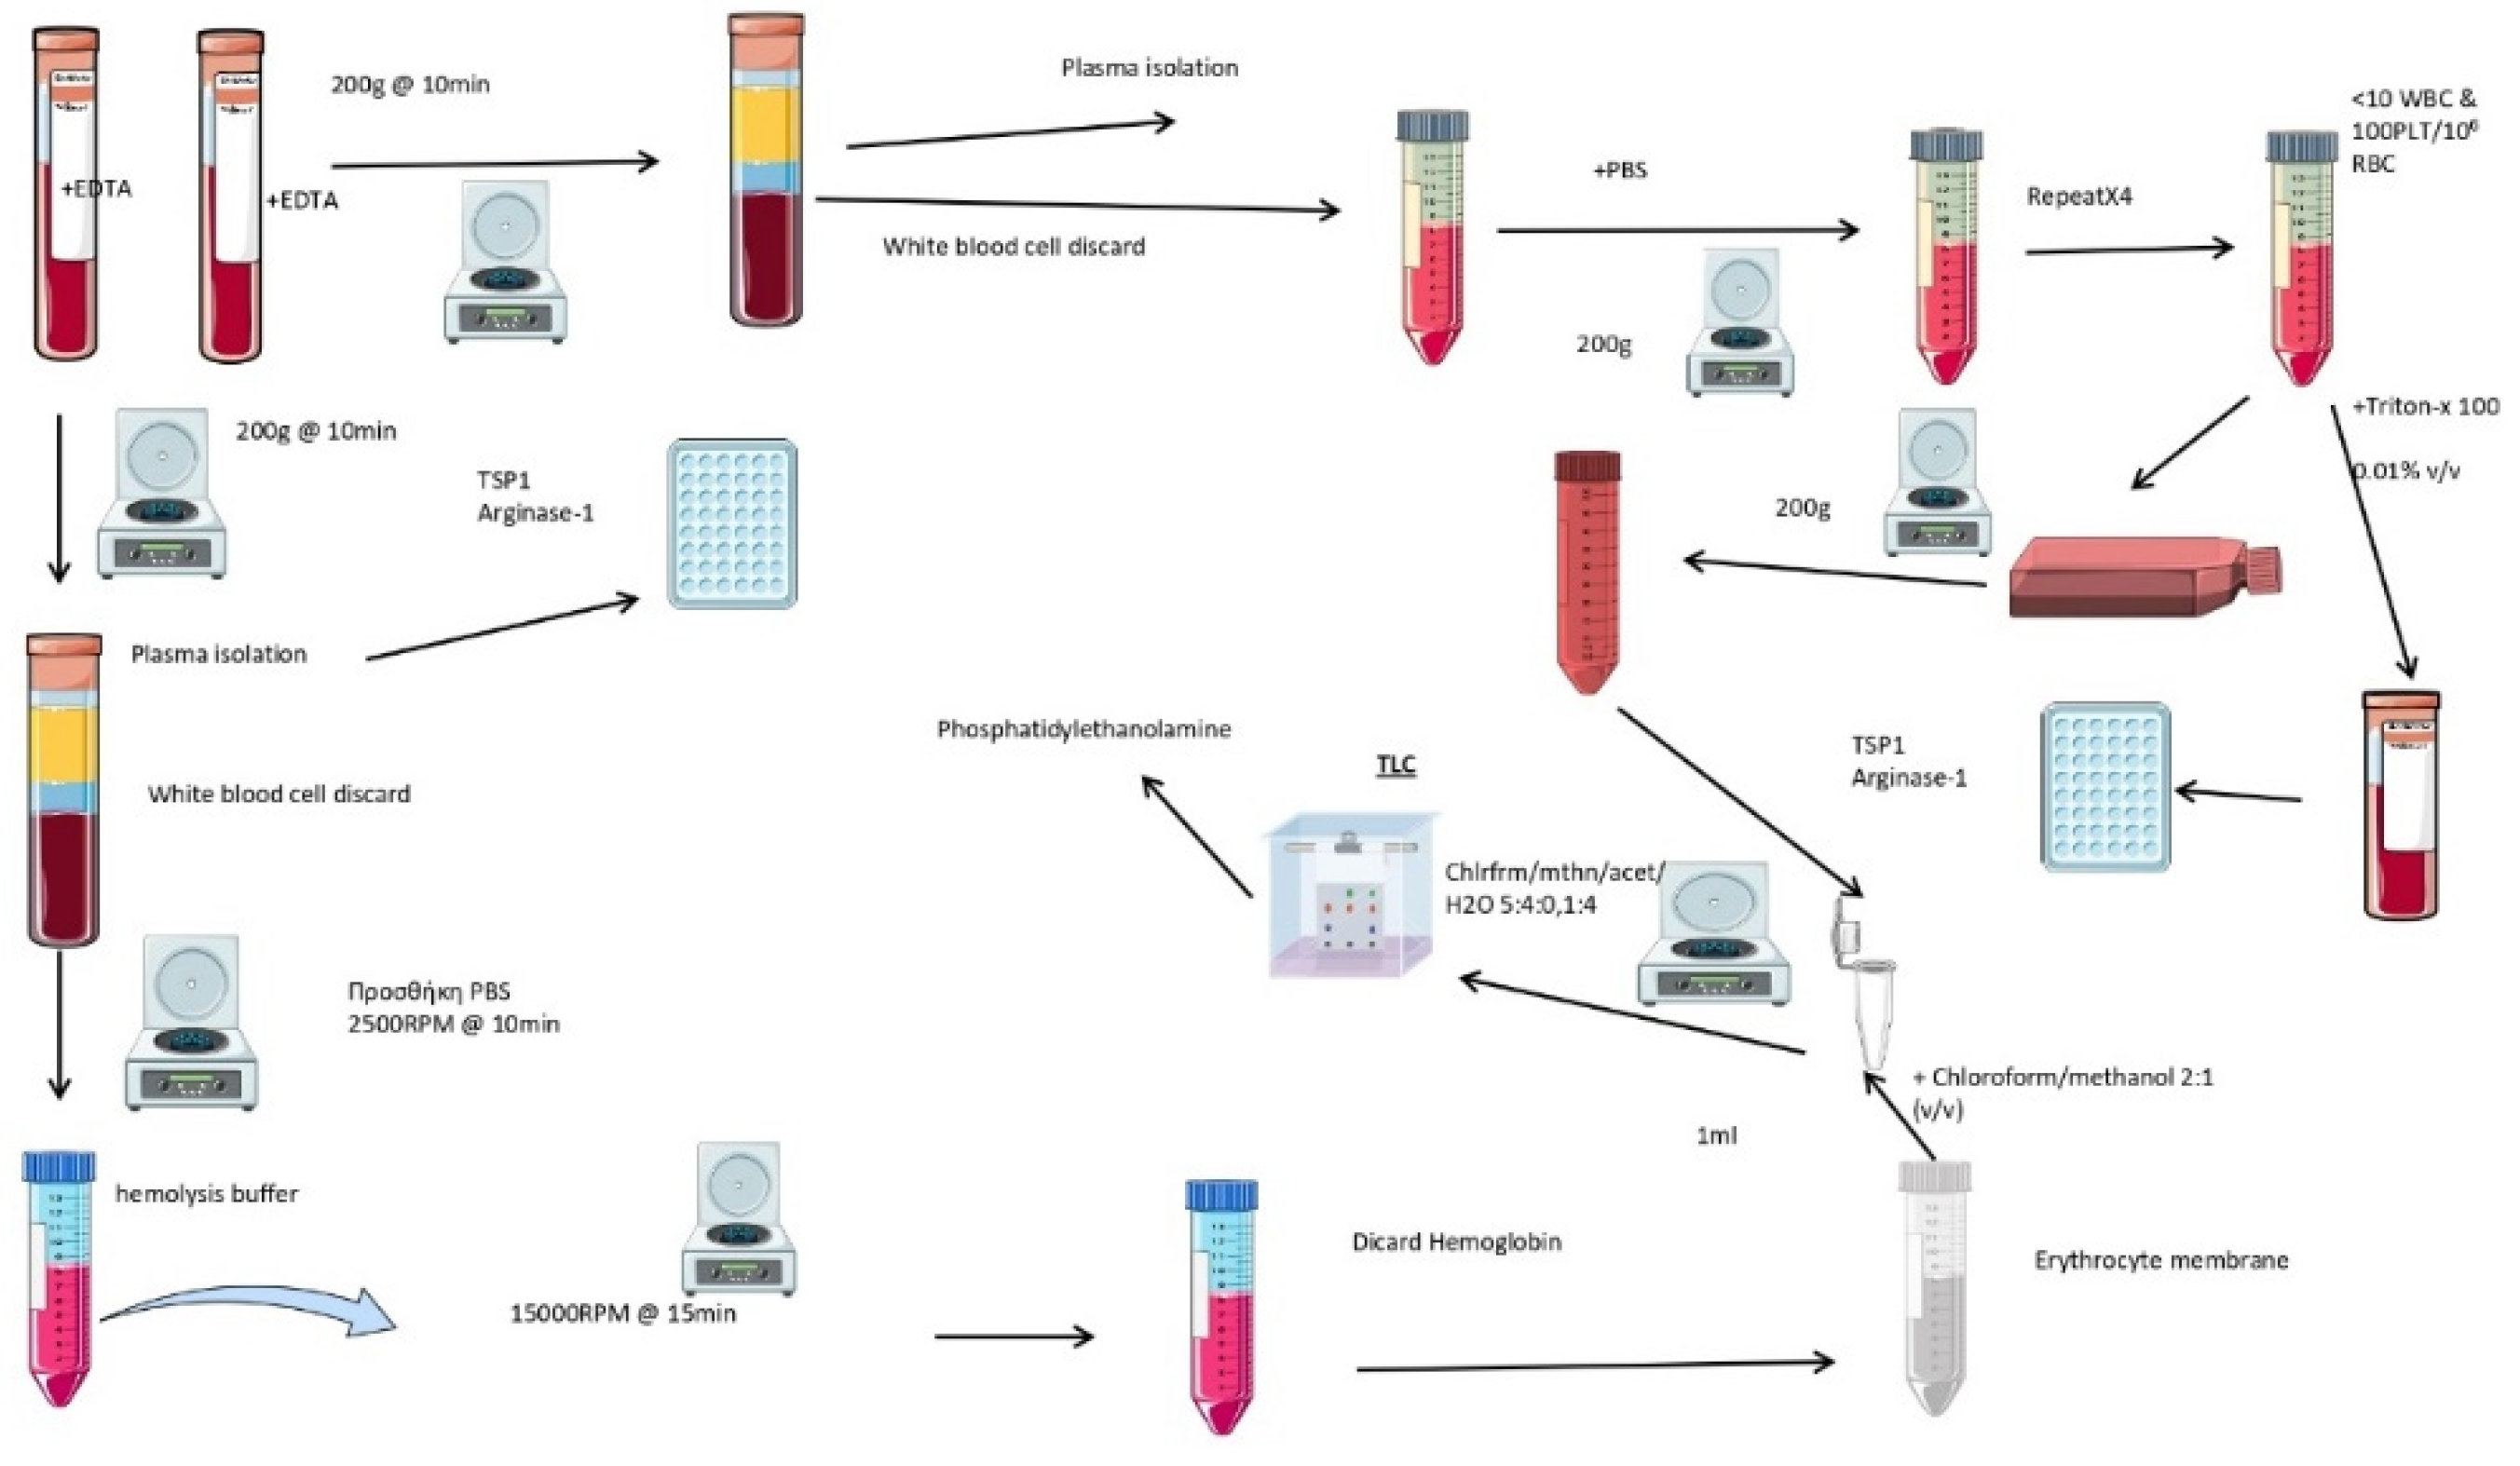
The entire methodology is summarized in
Figure 2. Three milliliters of blood containing 5.4 mg ethylenediaminetetraacetic acid (EDTA) was centrifuged at 200×g for 10 min at 4C. The plasma and buffy coat were removed. Then, 1 mL of erythrocyte pellet was washed with cold saline solution and centrifuged at 200×g for 10 min at 4C. This step was repeated four times, and red blood cells were then collected from the bottom of the tube.
Erythrocyte membrane isolation
Erythrocytes were diluted 1:10 (vol/vol) with cold hemolysis solution (Tris 1 mM-NaCl 10 mM-EDTA 1 mM, pH 7.2), followed by incubation for 30 min at 4oC with continuous shaking. They were then centrifuged at 10,000×g in a HERMLE 323 K centrifuge, 220.80 VO2 rotor, at 4oC for 15 min. The pellet was collected, and the last step was repeated as many times as needed, until the final pellet was milky-white, signifying hemoglobin removal. Samples were kept at -80oC until analysis.
Production of erythrocyte-conditioned media
Erythrocytes (5×10⁷/mL) were incubated in Roswell Park Memorial Institute (RPMI) culture medium 1640, containing 10% fasting blood sugar (FBS) (vol/vol), 1% streptomycin/penicillin (vol/vol), at 5% CO2, 37oC, for 24 hr. Then, the erythrocyte-derived conditioned medium (ECM), from both patients (P-ECM) and healthy controls (H-ECM), was collected by centrifugation at 200×g for 10 min. Conditioned media were stored at -80oC. As control, growth medium was placed in 6-well plates, in the same conditions, thereafter, following the same procedures as for ECM. Spectrophotometric assay indicated that no hemoglobin was released by erythrocytes, thus excluding hemolysis.
Lipid extraction
For lipid extraction, 500 μL of ECM or 100 μl erythrocyte membrane was used. We used a modified Folch method [
17]. Briefly, 500 μL of 2:1 chloroform/methanol was added to 500 μL of ECM or 100 μL of erythrocyte membrane. Then, the sample was vortexed for 30 sec and centrifuged for 10 min at 5000×g. The organic phase was collected, and the previous step was repeated to the aqueous phase. The two organic phases were washed with water by centrifugation for 10 min at 5000×g and then evaporated at 70
oC.
Lipid separation and visualization
Thin-layer chromatographic (TLC) analysis of lipids was performed on a 10×10 cm chromatographic plate (TLC Silica gel 60 F254; Merck KGaA 64071, Darmstadt, Germany) using a mixture of chloroform/methanol/acetic acid/water (60/50/1/4) (vol/vol/vol/vol). Before loading the samples, the plate was desiccated at 150oC for 10 min and pre-run with the developing solvent mixture. After sample separation, the plate was dried with hot air and then placed in a closed container of vaporized iodine (3.5g), placed facing the bottom of the container, for 30 min at room temperature. Lipids appeared as dark yellow bands against a lighter background. To ensure that the various lipids were well separated, they were identified by comparison with lipid standards, namely cholesterol, phosphatidylethanolamine, phosphatidylinositol, phosphatidylserine, phosphatidylcholine, and sphingomyelin and sphingosine, all purchased from Sigma–Aldrich (Munich, Germany).
Phosphatidylethanolamine quantitation
The method for PE quantitation is based on the intensity of the green color of the band corresponding to PE. The characteristics of the method (specificity, linearity, accuracy, precision, limit of detection, limit of quantification and sensitivity) can be found in a previous study [
7].
Lysis of erythrocytes
One milliliter of packed erythrocytes was lysed with Triton X-100 at a final concentration of 0.01% vol/vol [
8].
Determination of arginase and bound TSP-1 levels
Levels of CD47 and arginase were determined by ELISA in erythrocyte lysates or plasma according to the manufacturer’s instructions (OriGene, USA).
Statistical analysis
All statistical analyses were performed in the R programming language [
18]. Differences between groups were tested for statistical significance using the two-sided Welch’s independent samples t-test. The effect size
r was calculated as
where
t is the t-statistic and
df the degrees of freedom. The magnitude of the effect size according to [
19,
20] can be considered small, when
(the effect explains 1% of the total variance), medium when
(the effect accounts for 9% of the total variance) and large when
(the effect accounts for 25% of the total variance). It should be noted that
is not measured on a linear scale. Therefore, an effect with r=0.5 is not twice as big as one with r=0.25.
Linear regression was performed using the base R lm command. All plots were created using the ggplot package.
3. Results
Erythrocyte CD47
In a previous study [
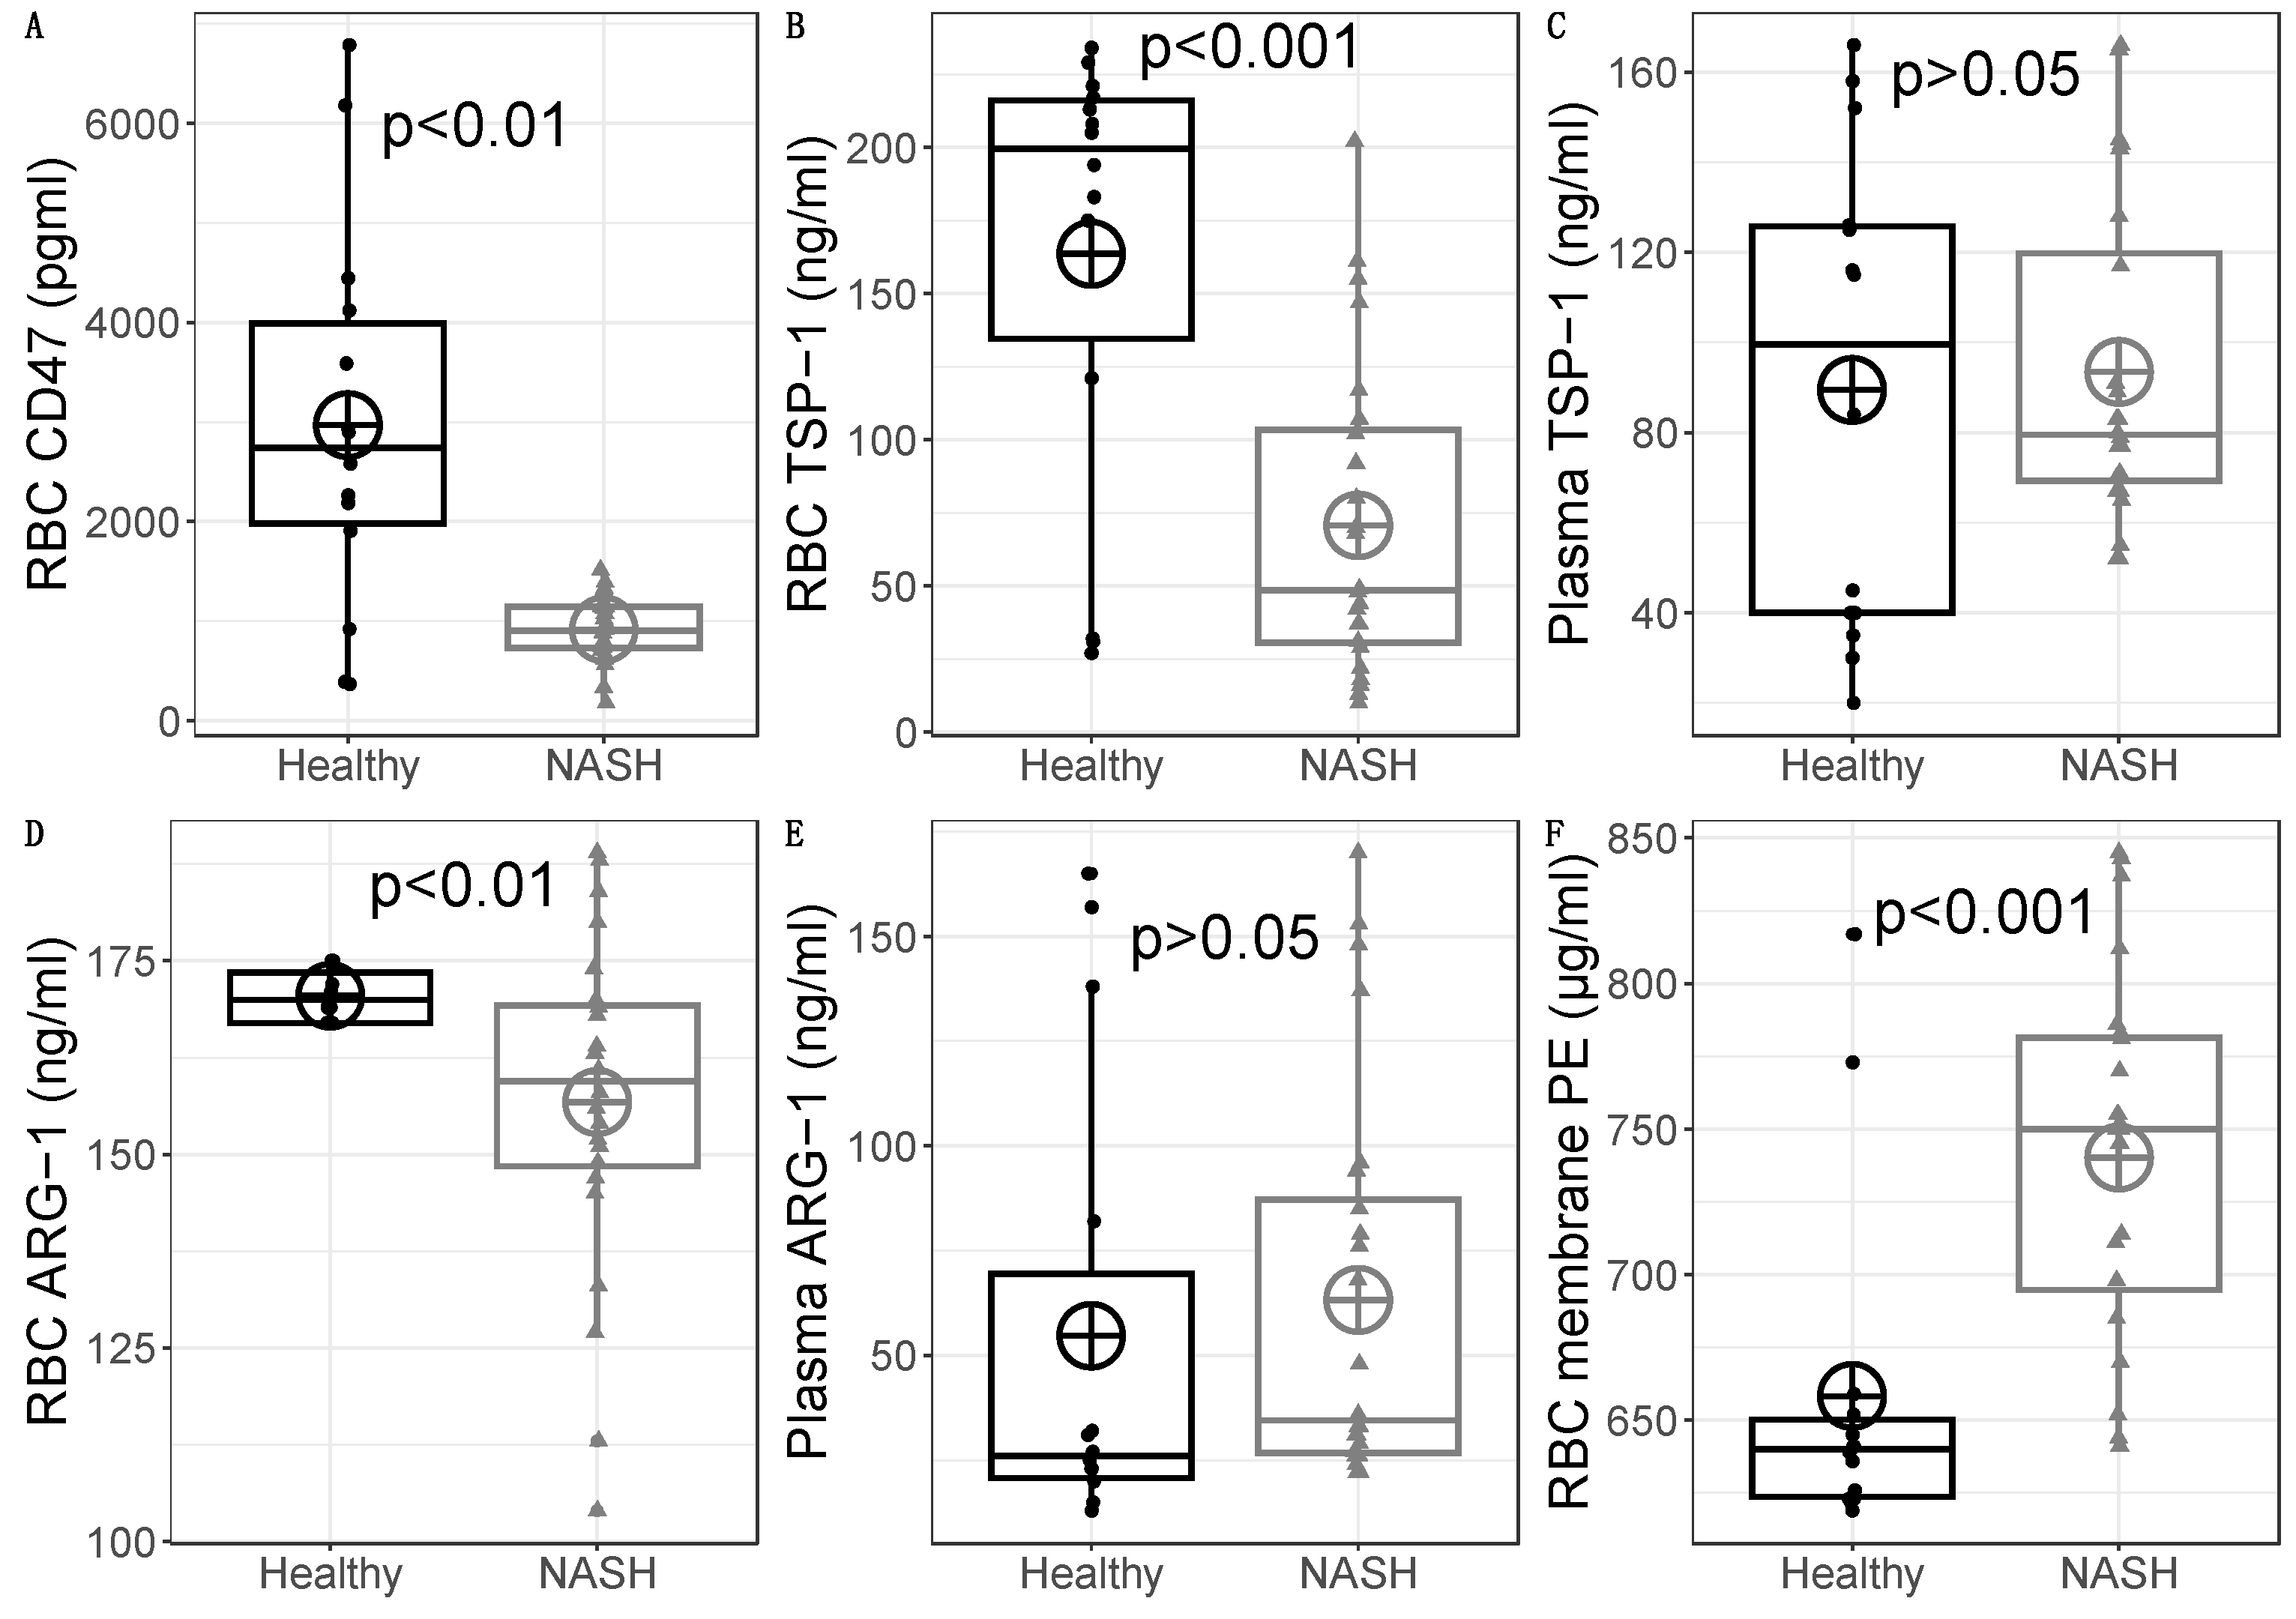
8], we reported reduced CD47 levels in 18 NASH patients compared to 14 healthy individuals. This was further verified here, with 24 NASH patients. The difference was statistically significant (healthy CD47 mean=2969 pg/ml, SD=1936 pg/ml versus NASH CD47 mean=916 pg/ml, SD=332 pg/ml), with t(13.4)=3.93, p=0.0016 (
Figure 3A).
Erythrocyte lysate TSP-1 levels
Based on these results of reduced erythrocyte CD47 levels in NASH patients [
8], we started our study by examining the levels of bound TSP-1 on erythrocytes. On average, NASH patients had lower levels of RBC TSP-1 (mean=71 ng/ml, SD=54 ng/ml) that healthy subjects (mean=164 ng/ml, SD=78 ng/ml). This difference was statistically significant t(20.40)=3.95, p=0.0008; the effect size was large (r=0.66) (
Figure 3B). This means that erythrocytes in the circulation of NASH patients bind lower levels of TSP-1. Hence, since TSP-1 acts as a removal signal, we conclude that this pathway is not significantly involved in the red blood cell clearance during NASH.
Plasma TSP-1 levels
Since we observed reduced levels of bound TSP-1 on erythrocytes of NASH patients, we wondered whether this difference is dependent on changes on the plasma levels. There was no statistically significant difference in plasma TSP-1 between NASH patients (mean=93 ng/ml, SD=35.8 ng/ml) and healthy subjects (mean=89 ng/ml, SD=53.1 ng/ml), with t(20.00)=-0.25, p=0.803 and a negligible effect size r=0.05 (
Figure 3C). Hence, the reduced levels of TSP-1 on erythrocytes of NASH patients are not explained by reduced levels in the plasma.
Correlation between erythrocyte CD47 and TSP-1 levels
Since the levels of erythrocyte-bound TSP-1 seem to be largely independent of the plasma levels, we hypothesized that alterations on erythrocytes are responsible for the observed difference. Previous studies have shown that TSP-1 binds on CD47 of erythrocytes [
21]. Linear regression was performed with RBC CD47
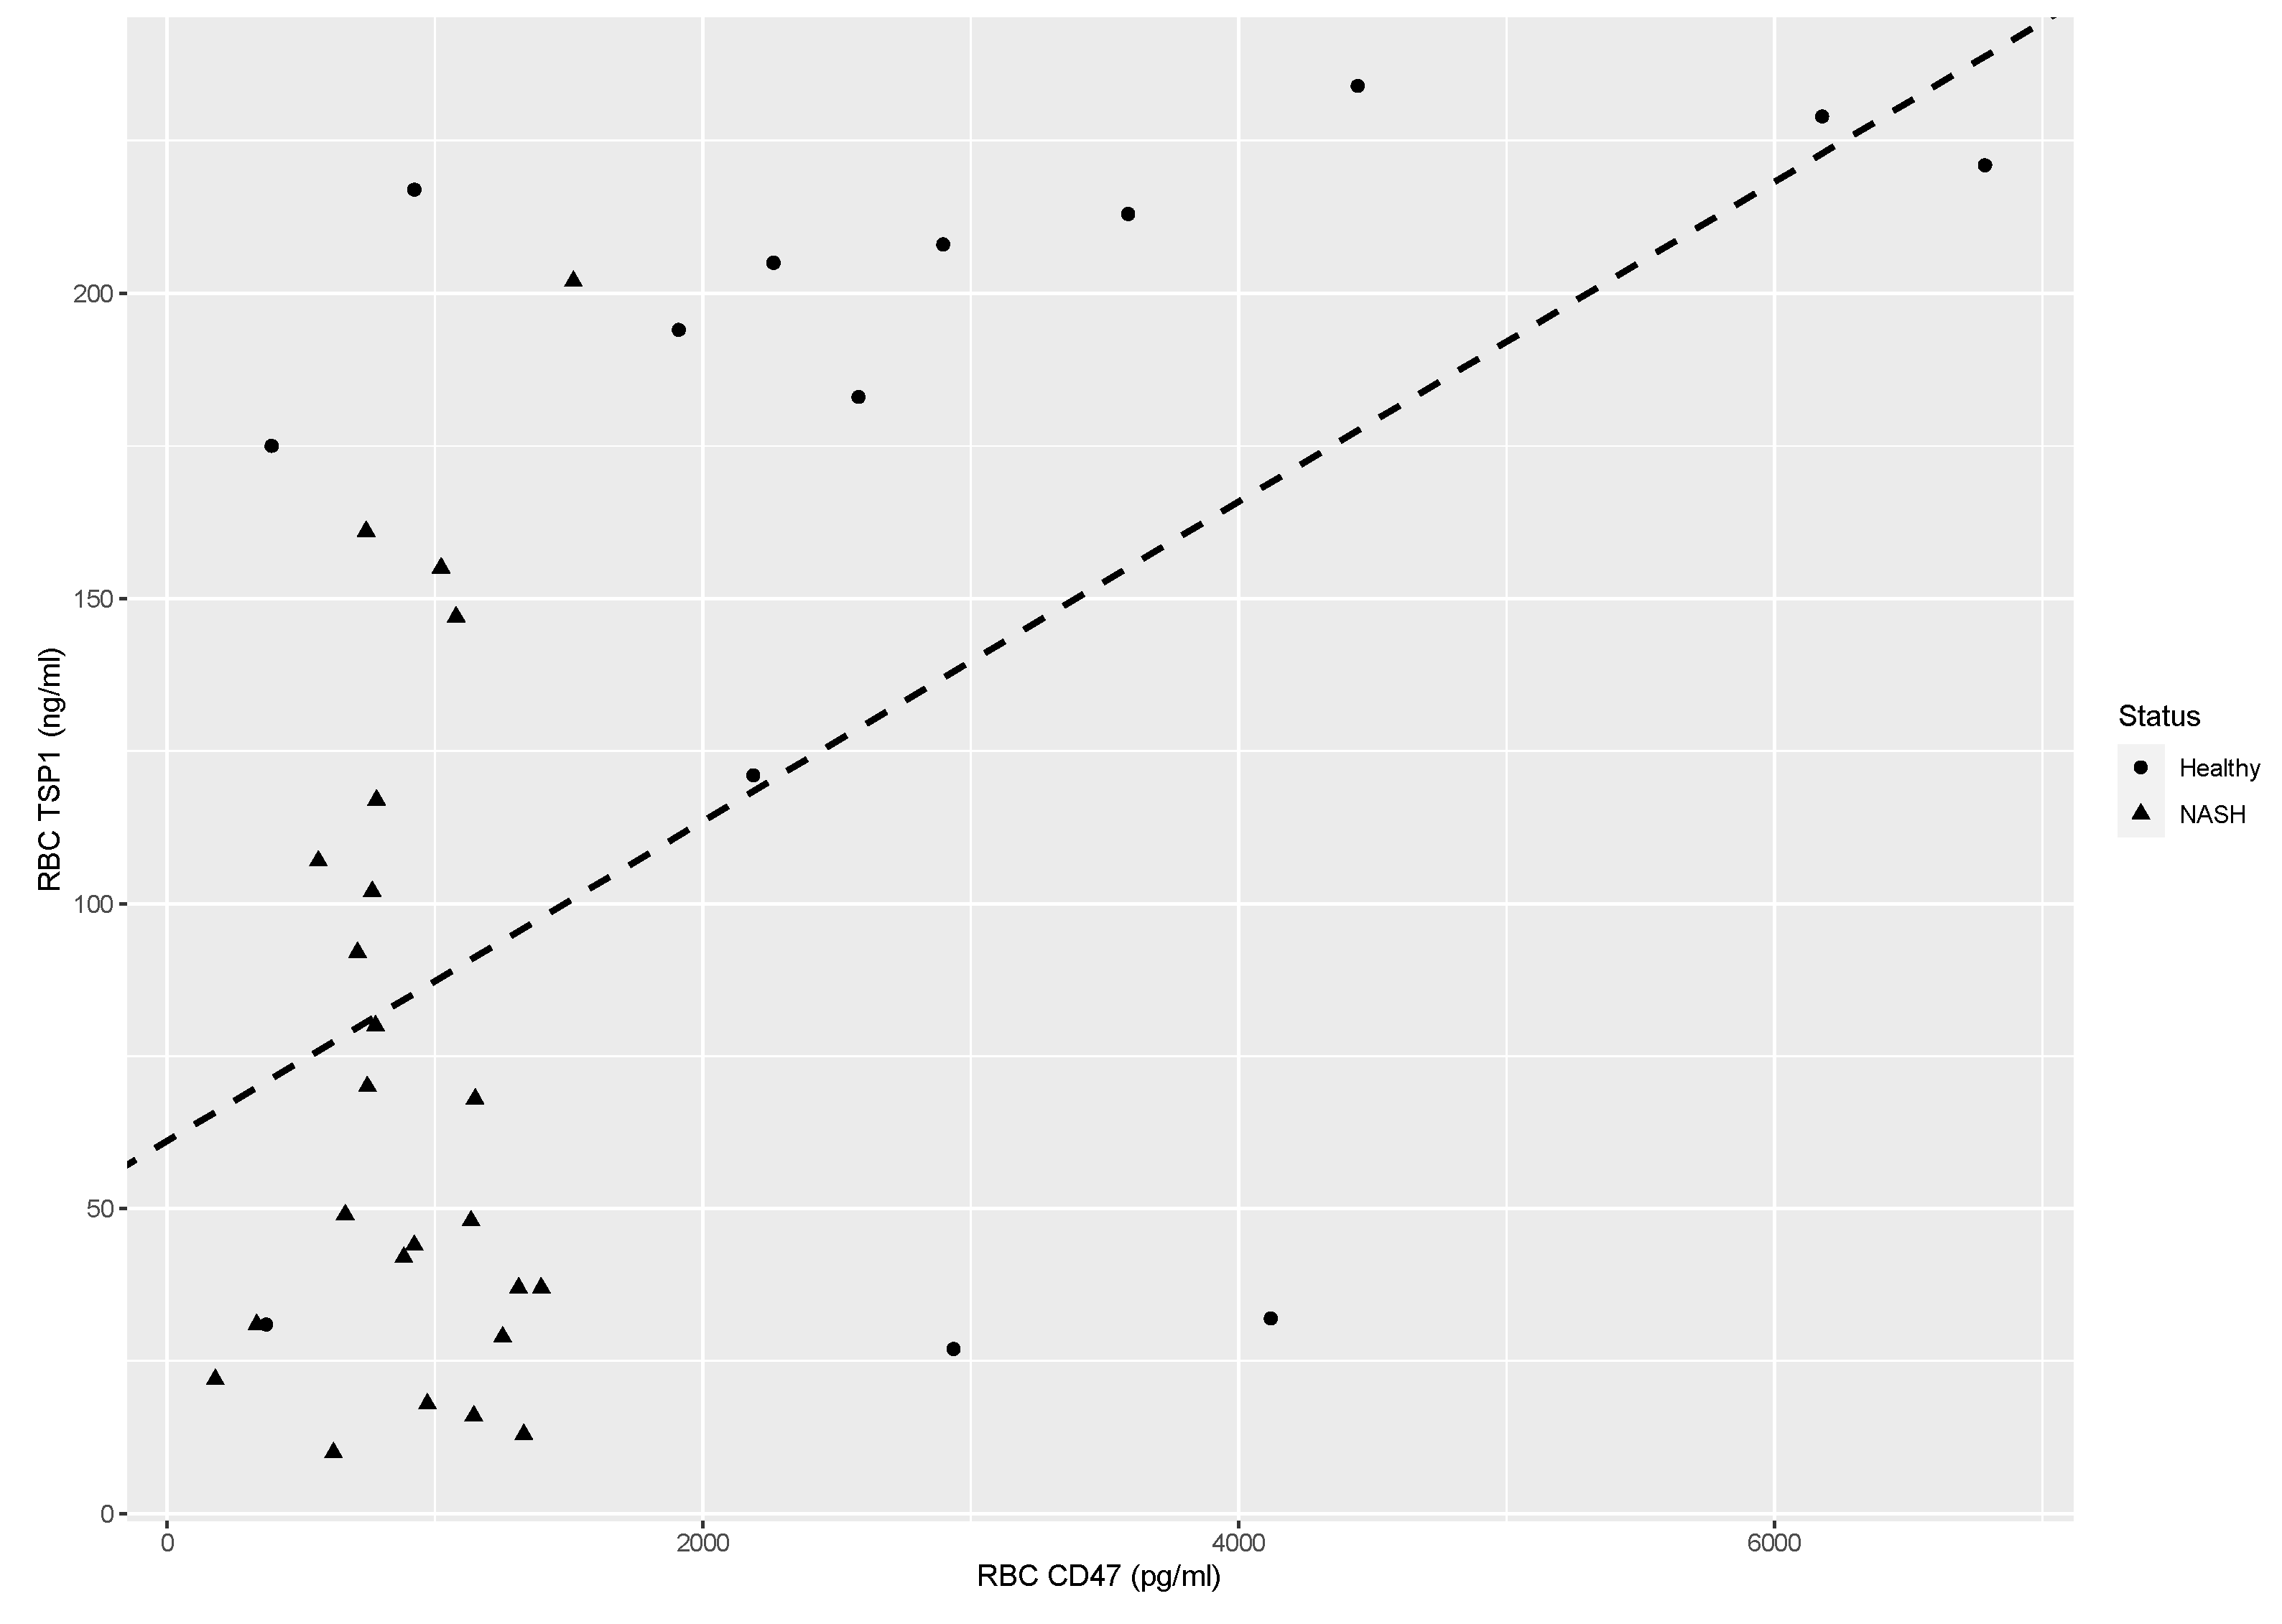
(based on the results of our previous study [8]) as the independent and TSP-1 as the dependent variable. The scatterplot along with the resulting regression line is shown in
Figure 4. The adjusted R
2 was 0.255, F(1,36)=13.63, p=0.00073. The intercept was 61.1 (SE=16.06, p=0.00053) and the slope was 0.026 (SE=0.0071, p=0.00073). Since the adjusted R
2 is 0.255, this means that 25.5% of the variation in RBC TSP-1 can be explained by the variation in RBC CD47. A slope of 0.026 means that when RBC CD47 decreases
increases by one unit (in pg/ml), RBC TSP-1 will decrease
increase by 0.026 units (in ng/ml). Since the values of RBC CD47 are in the thousands, a more illustrative explanation is that when RBC CD47 decreases
increases by 100 pg/ml, RBC TSP-1 decreases
increases by 2.6 ng/ml (
Figure 4). Thus, it seems that the degree of TSP-1 binding on erythrocytes is in part dependent on the levels of CD47. This result seems to contrast with previous reports regarding the binding of TSP-1 on erythrocytes. More specifically, other researchers report that reduction of erythrocyte CD47 levels is accompanied by the alteration of the conformation of CD47, resulting in higher affinity for TSP-1 [
21]. We speculate that the reduction of erythrocyte CD47 levels in NASH is not accompanied by the formation of denser CD47 clusters.
Erythrocyte arginase-1 levels
Phosphatidylserine exposure is the main removal marker for erythrocytes. Otogawa et al [
6] have already found the importance of this pathway for NASH. Phosphatidylserine exposure can be triggered by various mechanisms. Among those, we have previously reported reduced sphingomyelin [
7] (possibly due to the action of sphingomyelinase) and accumulation of sphingosine [
8]. Another important mechanism is the reduction of nitric oxide [
11]. Because arginase-1 is an important modulator of the nitric oxide levels on erythrocytes, we wondered whether its protein levels are increased in erythrocytes of NASH patients. NASH patients had lower RBC arginase-1 levels (mean=157 ng/ml, SD=21.6 ng/ml) than healthy subjects (mean=171 ng/ml, SD=3.3 ng/ml), with a significant difference t(24.83)=3.06, p=0.0052 with a large effect size r=0.52 (
Figure 3D). Thus, we hypothesize that contrary to what has been reported for diabetes patients, erythrocyte arginase expression is downregulated in NASH. This could lead to defective efferocytosis [
22], as it will be discussed below.
Plasma arginase-1 levels
Erythrocytes can uptake arginine from their environment. Thus, the levels of available arginine for the production of erythrocytic nitric oxide can be also regulated by the levels of plasma arginase. As such, we determined the protein levels of arginase-1 in the plasma of NASH patients and healthy controls. There was no statistically significant difference in plasma arginase-1 between NASHpatients (mean=63 ng/ml, SD=47.4 ng/ml) and healthy subjects (mean=55 ng/ml, SD=56.3 ng/ml), with t(23.68)=-0.48, p=0.637 and a negligible effect size r=0.09 (
Figure 3E). Based on these results we propose that plasma arginase-dependent phosphatidylserine exposure is unlikely for erythrocytes of NASH patients.
Erythrocyte membrane phosphatidylethanolamine levels
Phosphatidylethanolamines are increased during NASH and actively participate in pathogenic mechanisms [
15]. Erythrocyte efferocytosis delivers important cargo to the liver. Our previous results of disrupted lipid metabolism of patients with NASH led us to investigate the levels of phosphatidylethanolamine on erythrocytes of NASH patients. There was a statistically significant elevation in the PE levels of packed erythrocytes between NASH patients (mean=740 μg/ml, SD=63.0 μg/ml) and healthy subjects (mean=658 μg/ml, SD=59.8 μg/ml), with t(28.55)=-3.99, p=0.0004 and a large effect size r=0.60 (
Figure 3F). These results show that erythrocytes could amplify the hepatic phosphatidylethanolamine upregulation during NASH.
Phosphatidylethanolamine levels in the erythrocyte-conditioned media
As previously mentioned, phosphatidylserine exposure is the main erythrocyte removal marker. Nevertheless, phosphatidylethanolamine translocation to the outer face of the lipid bilayer is also enhanced during storage [
13]. In addition, PE exposure seems to amplify the recognition of PSer by the pro-phagocytic receptors on phagocytes [
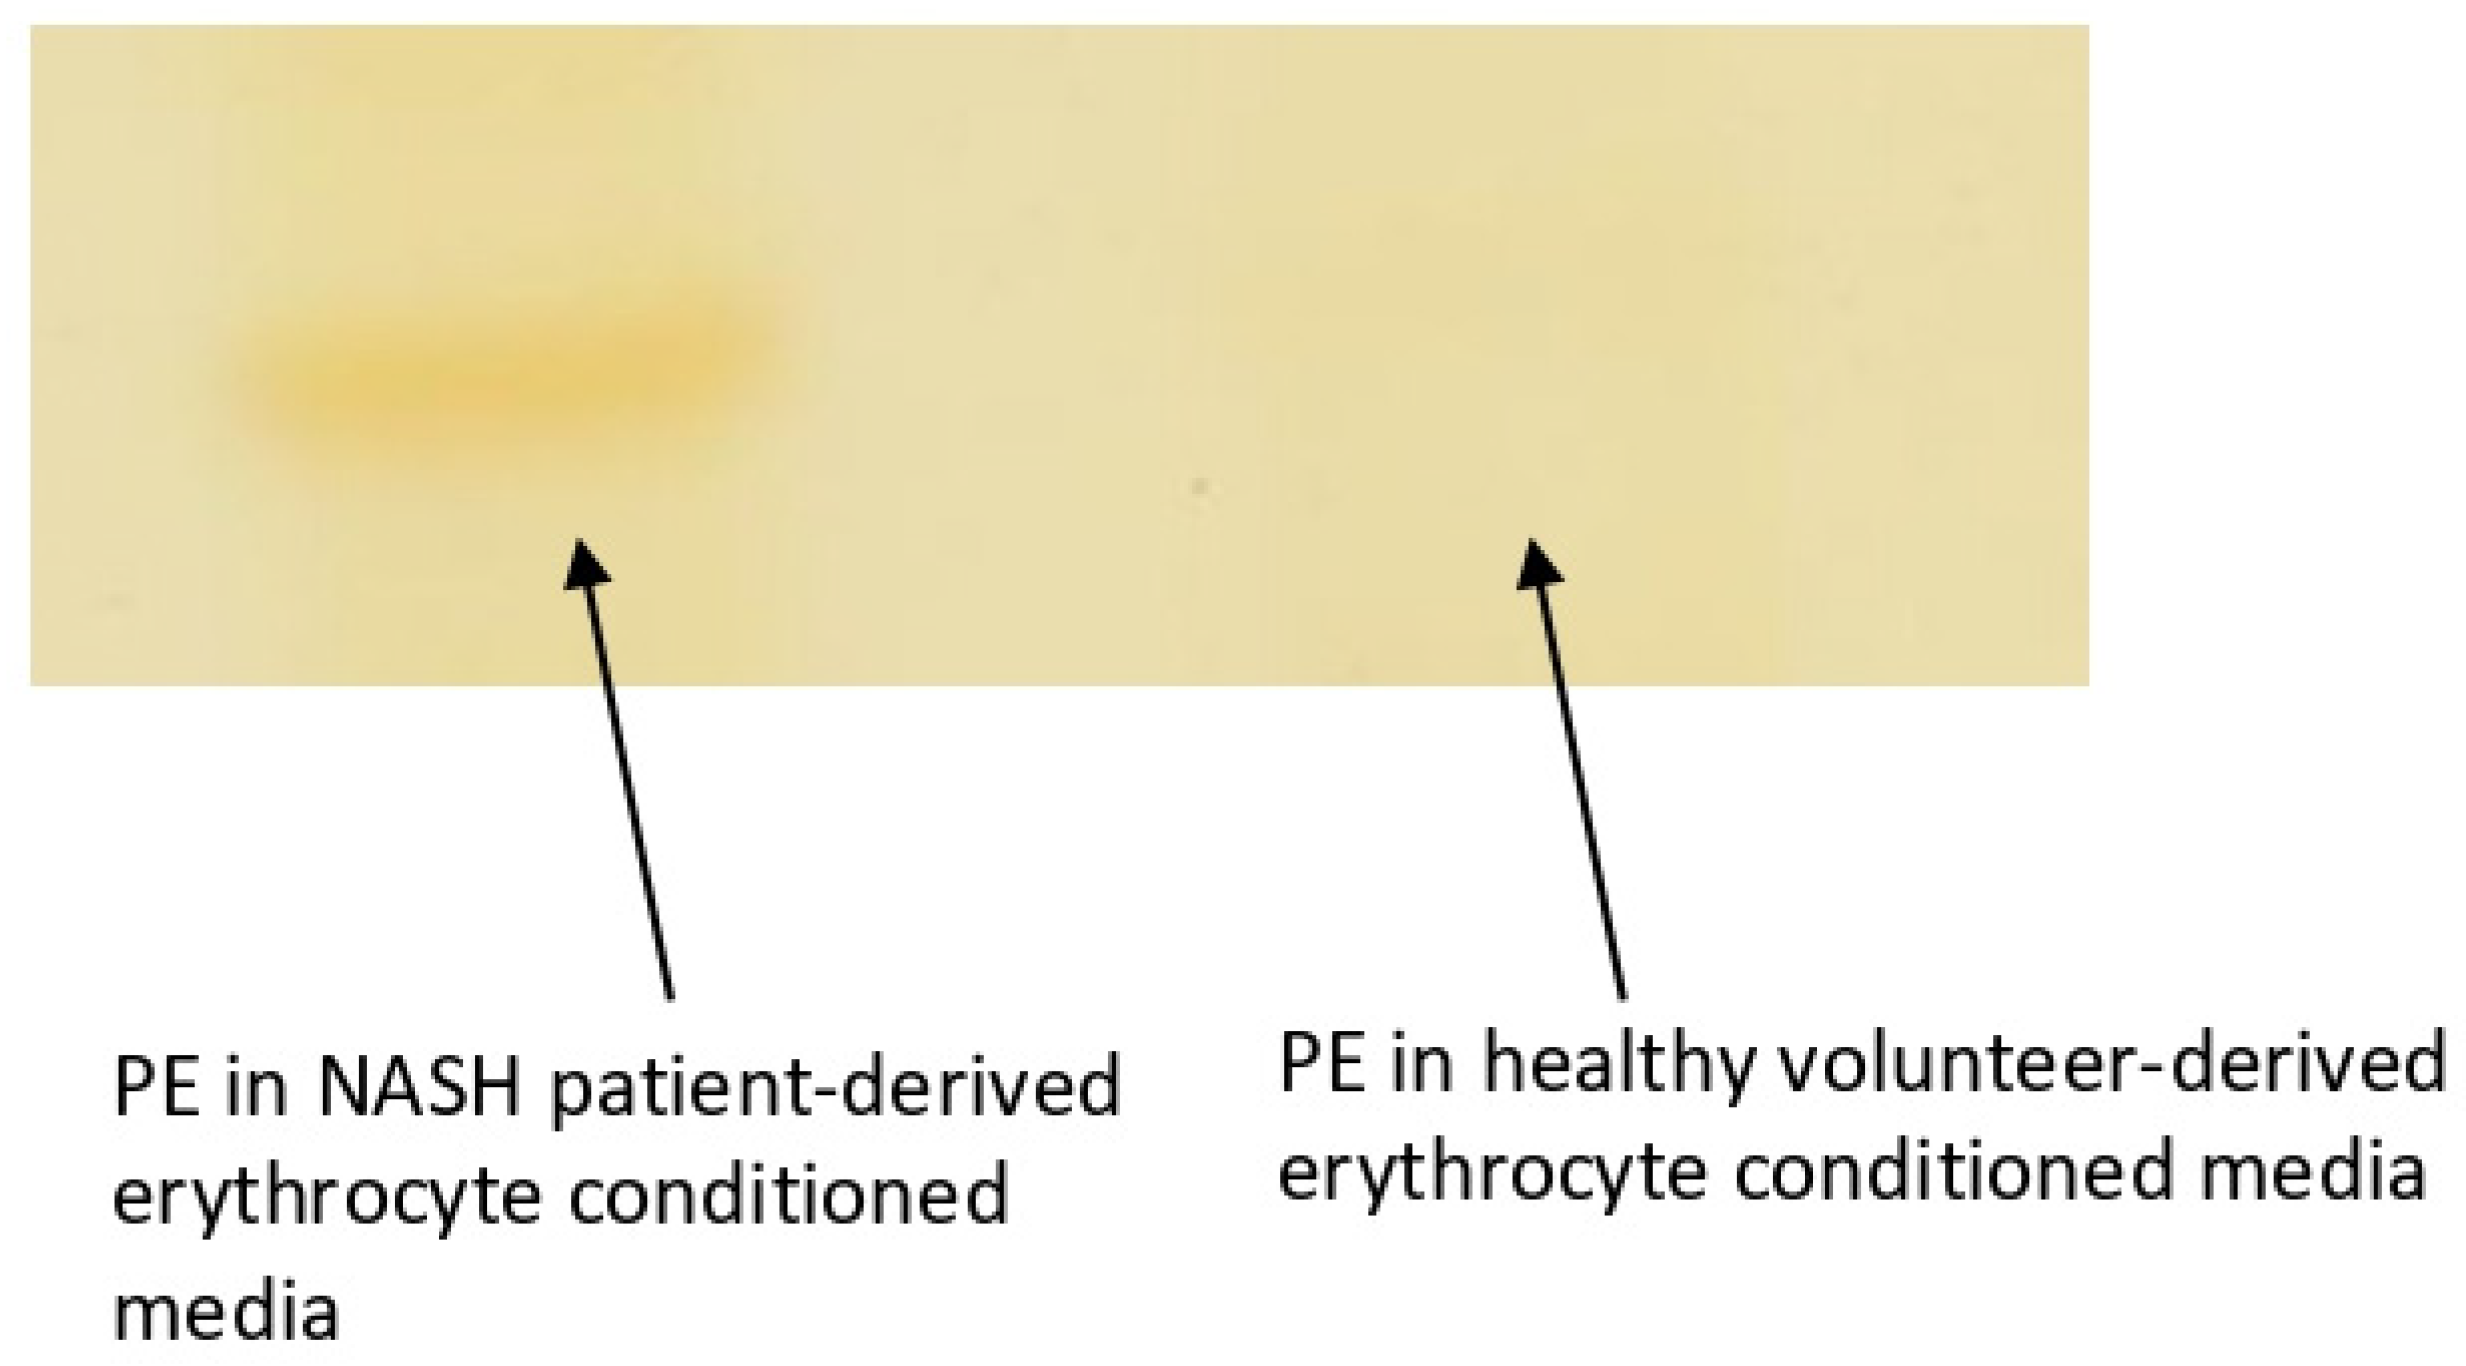
14]. Based on these data and our previous result for increased PE in the erythrocyte membrane of NASH patients we sought to investigate whether PE is exposed. We used an indirect measure by determining the levels of released PE in the erythrocyte-conditioned media of 10 NASH patients and 10 healthy controls. This method is based on the notion that PE can be released to the growth medium if it is located on the extracellular face of the lipid bilayer. Our method has a limit of quantification of 0.25μg/spot. Our results show that PE was above the limit of detection for the P-ECM, whereas on H-ECM were undetectable for all-but one healthy volunteer (
Figure 5). Although far from certain, we provide evidence for the possible PE exposure on the erythrocyte membrane of NASH patients.
4. Discussion
Hepatic erythrophagocytosis constitutes an important, yet largely, unexplored pathomechanism in NASH [
6]. Phagocytosis of erythrocytes by Kupffer cells in NASH leads to iron accumulation, culminating in inflammation and fibrosis. Recognition of phosphatidylserine exposure partially explains the augmented phagocytosis of erythrocytes. However, various mechanisms driving erythrophagocytosis have also emerged. Reduced CD47 surface levels, binding of TSP-1 on conformationally changed CD47 [
16], and sphingolipid-induced reduction of deformability [
10] can result in erythrophagocytosis. We recently showed that erythrocytes of these patients also exhibit increased sphingosine levels [
8]. In addition, the levels of the CD47 molecule, a “do-not-eat-me” signal, are reduced in erythrocytes of NAFLD patients [
8]. However, during aging of erythrocytes, the reduction of CD47 levels is accompanied by denser clustering of the remaining CD47 molecules[
21]. These clusters lead to a conformational alteration of CD47, which permits the binding of TSP-1. This binding acts itself as an “eat-me” signal, and also drives the formation of additional pro-phagocytic levels on erythrocytes, such as phosphatidylserine exposure [
11]. Hence, we sought to investigate whether the reduction of the erythrocyte CD47 levels are accompanied by increased TSP-1 binding due to CD47 clustering.
We show that despite the previously reported CD47 reduction, this is not followed by increased TSP-1 binding on circulating erythrocytes. Interestingly, we also report no statistically significant difference with regards to plasma TSP-1 levels between NASH patients and healthy controls. This possibly means that the reduced erythrocyte-bound TSP-1 levels are noticed due to changes on erythrocytes and not due to changes on the plasma levels. We can, thus, conclude that despite the reduction of CD47 molecules on the surface of erythrocytes, this is not accompanied by significant formation of denser CD47 clusters. We speculate that the reduced CD47 levels on the surface of erythrocytes of NASH patients are responsible for the reduced bound TSP-1 levels.
Despite seemingly contradictive, reduced TSP-1 binding by erythrocytes could also facilitate their engulfment by Kupffer cells. Before the action of “eat me” signals, apoptotic cells also release “find me” signals. We have previously shown that erythrocytes of NASH patients, release greater levels of the MCP1 chemokine [
23]. In addition, we have explored the release of another important “find me” signal, S1P; we reported no statistically significant change with comparison to healthy volunteers [
23]. Reduced TSP-1 binding by erythrocytes could also create a “find me” signal in the liver. Recent studies have shown that TSP-1 is released by apoptotic cells and attracts macrophages [
24]. Hence, in the liver of NASH patients, macrophage-derived TSP-1, would not be bound by erythrocytes. These TSP-1 molecules would be free to act in an autocrine or paracrine manner, resulting in macrophage activation and erythrocyte efferocytosis.
Regarding the plasma TSP-1 levels, our results are in contradiction to the previous reports of other researchers. To the best of our knowledge, two studies have reported increased serum TSP-1 levels in NASH patients [
25,
26], and one study has reported decreased plasma TSP-1 levels [
27]. In our study, we report no statistically significant difference. However, the number of participants was a limiting factor, and our results should be considered with caution.
Otogawa et al [
6]identified that phosphatidylserine exposure is partially responsible for erythrophagocytosis. Various mechanisms can disrupt the phospholipid asymmetry of erythrocytes. Arginase-1 regulates the levels of nitric oxide [
12], which regulate eryptosis. In the context of NASH, arginase-1 levels have been found increased. We thus explored whether there is also increased arginase-1 in erythrocytes of NASH patients; this would facilitate erythrophagocytosis and would also augment the total arginase activity in blood. We found that arginase-1 levels are decreased in the erythrocytes of NASH patients. We conclude that arginase-1 is not implicated in hepatic erythrophagocytosis during NASH, but it could lead to defective efferocytosis. A recent study reports that apoptotic cell-derived arginine and ornithine are essential for sustained efferocytosis [
22].
In addition, no difference was noticed for plasma arginase levels. However, in our study we did not explore changes in the total activity of arginase. Hence, although our report is important, other mechanisms which regulate the activity of arginase should also be explored in the future. These mechanisms mainly include post-translational modifications and the substrate antagonism with nitric oxide synthase.
Exposed phosphatidylserine constitutes the main marker for the recognition of apoptotic cells by phagocytes. However, a recent report has identified exposed phosphatidylethanolamine as a factor that can amplify the recognition step [
14]. In fact, phosphatidylethanolamine exposure seems to occur more rapidly, during erythrocyte storage [
13]. More importantly, phosphatidylethanolamine was very recently associated with various pathogenic mechanisms of NASH [
15]. Previously, we reported disrupted erythrocyte membrane composition in NASH patients, with increased cholesterol and sphingosine [
8] and reduced sphingomyelin [
7]. Thus, we explored whether erythrocytes could be a source of increased phosphatidylethanolamine for the liver. We also investigated if phosphatidylethanolamine is exposed on erythrocytes. We report increased phosphatidylethanolamine levels on the erythrocyte membranes of NASH patients. This could mean that after erythrophagocytosis, phosphatidylethanolamine could accumulate in the liver. In addition, we reported phosphatidylethanolamine release from erythrocytes of NASH patients. Although an indirect measurement, this could indicate that phosphatidylethanolamine is more readily available for lipoproteins. Since this event is mainly dependent on the lipid topology in the two faces of the lipid bilayer, we propose that PE exposure is increased on the erythrocyte surface of NASH patients. We conclude that erythrocytes can be a source of hepatic phosphatidylethanolamine and that phosphatidylethanolamine possibly facilitates hepatic erythrophagocytosis.
Combining our current and previous results [
7,
8,
23,
28] and the results of Otogawa et al [
6], we conclude that hepatic erythrophagocytosis in NASH is triggered by: increased exposed phosphatidylserine and phosphatidylethanolamine, reduced CD47 levels, increased sphingosine levels, increased binding and release of the chemokine MCP1, unaltered release of the signaling lipids S1P and LPA, reduced TSP-1 scavenging, and induction of a significant pro-inflammatory activation of macrophages. After phagocytosis, the cargo of erythrocytes (iron, sphingosine, phosphatidylethanolamine and cholesterol) modulates the response of macrophages, amplifying inflammation and fibrosis. Previous studies have also showed that enhanced erythrophagocytosis can impair efferocytosis [
29]. This can be partially attributed to sphingosine [
30], downregulated arginase-1 [
22] and inflammation [
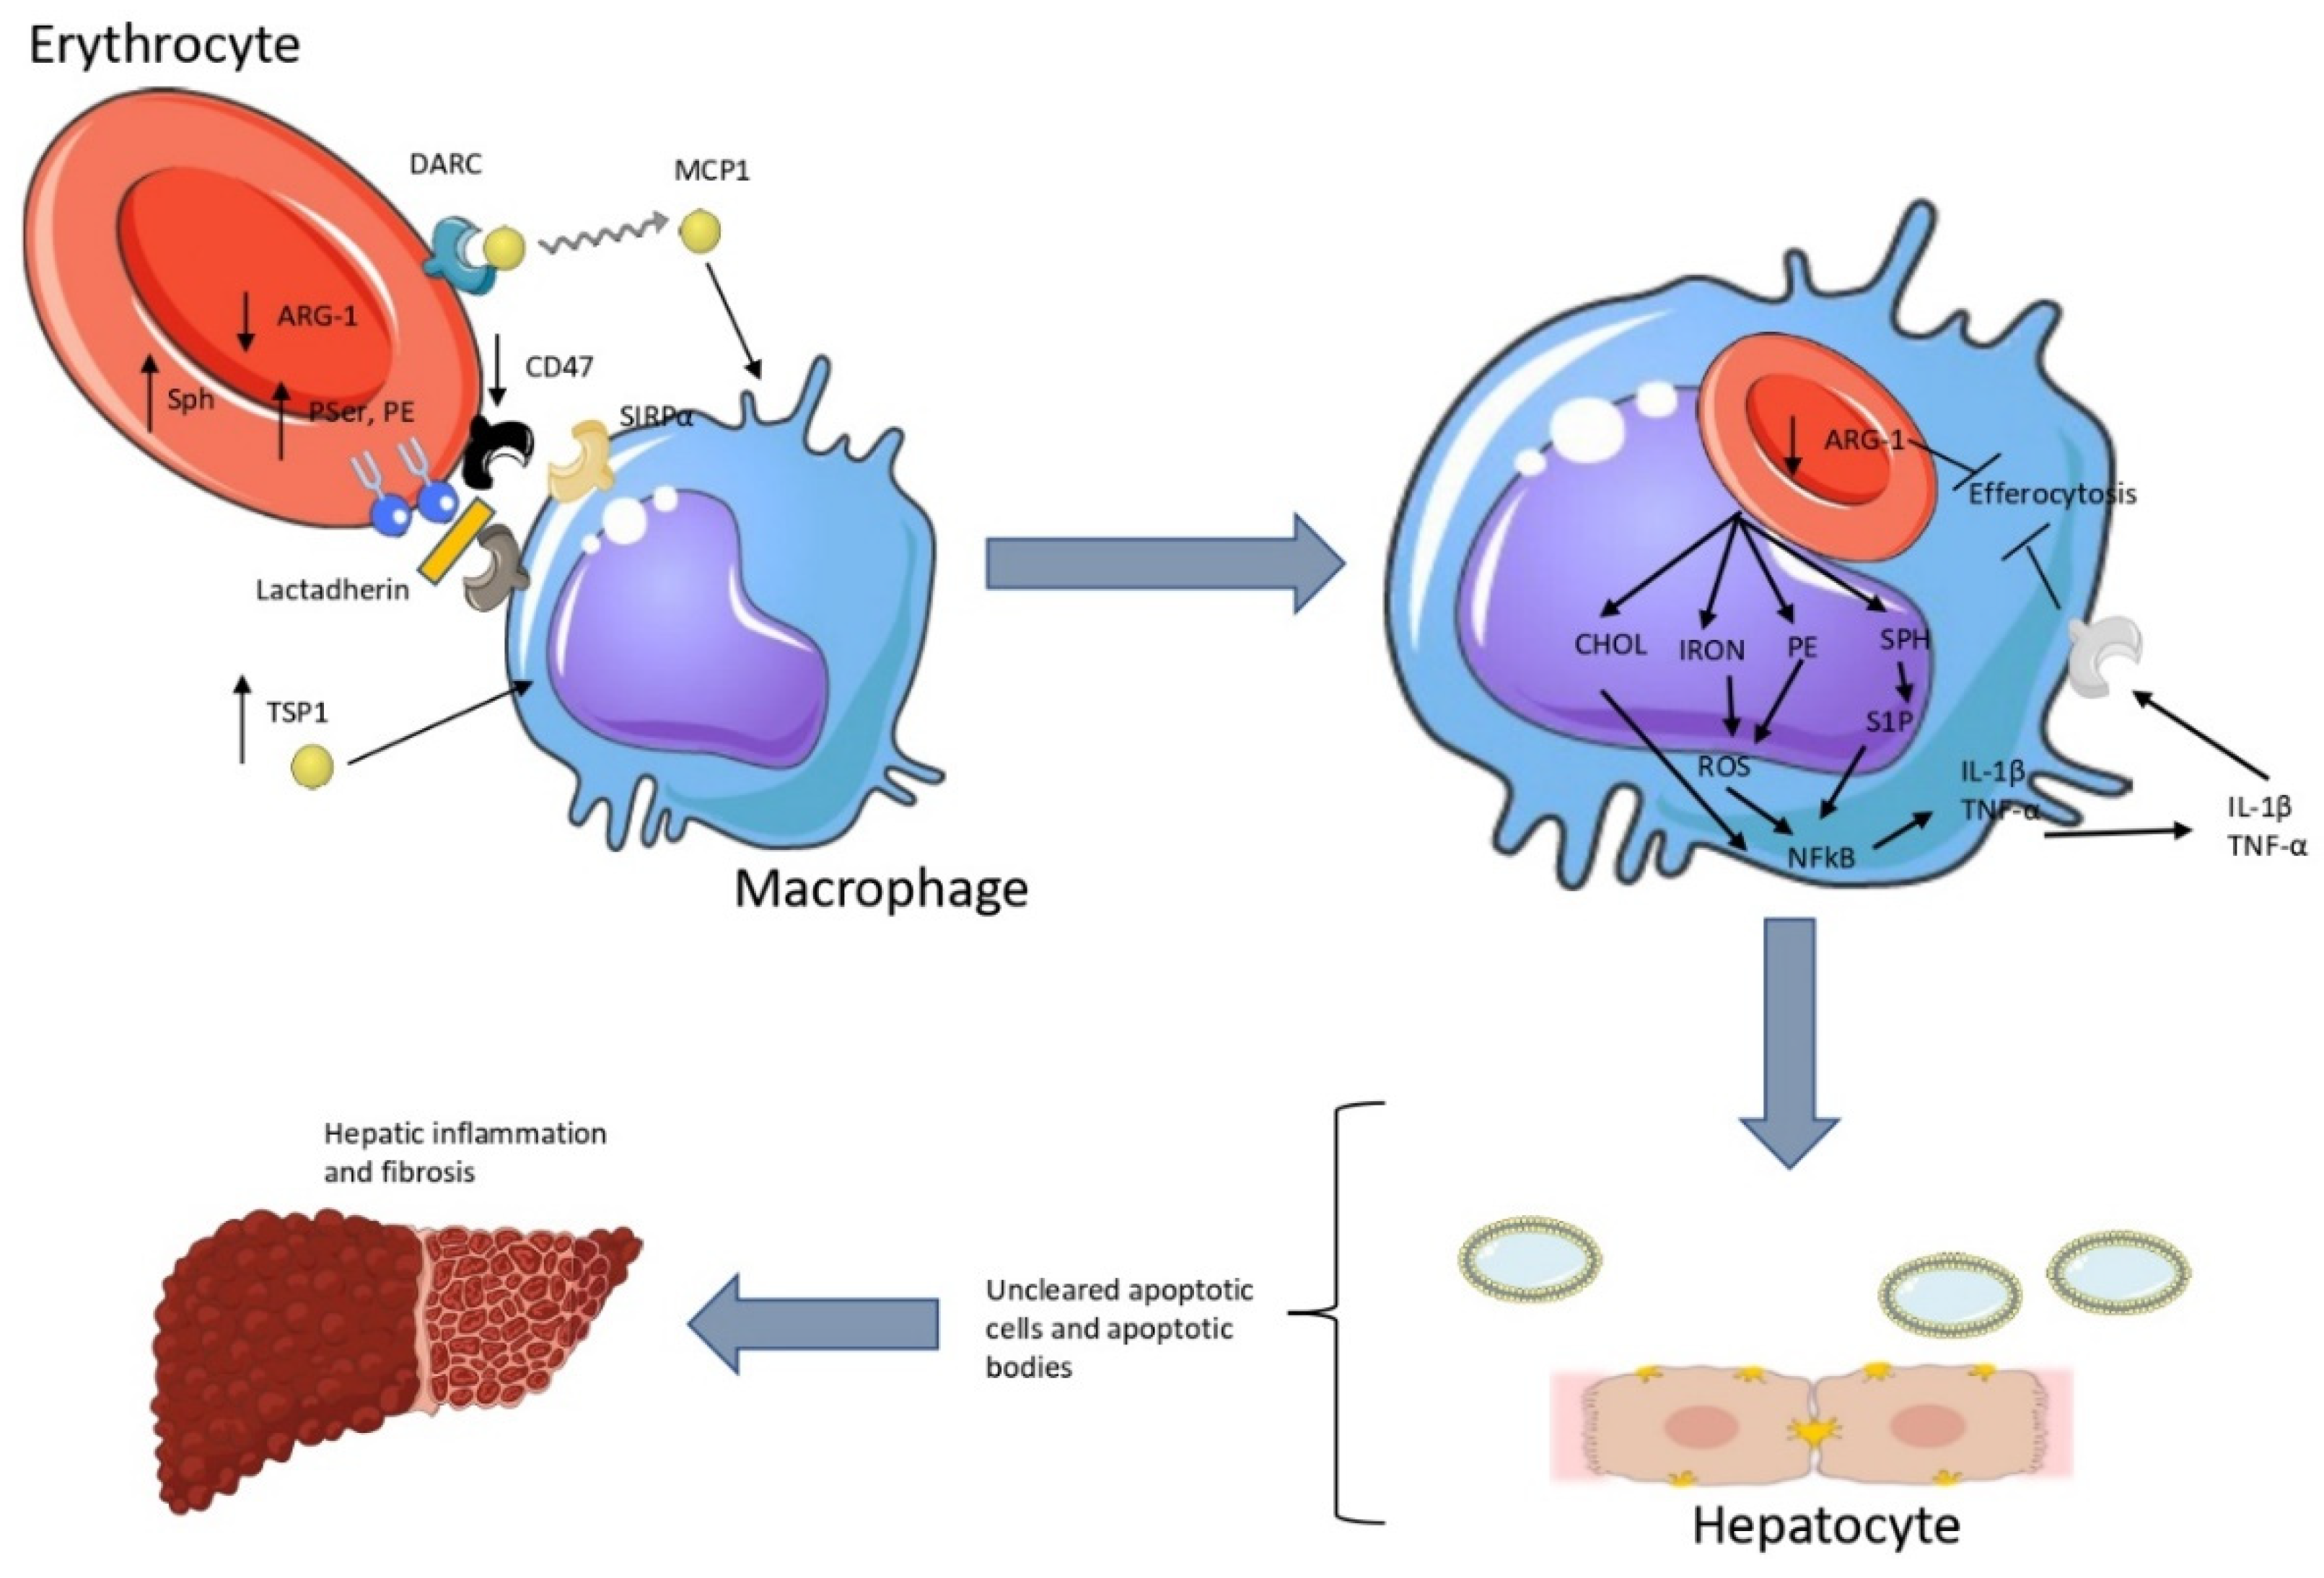
31]. Hence, we propose that the cargo of erythrocytes could also disrupt the phagocytosis of apoptotic hepatocytes. (
Figure 6). Overall, we suggest that erythrocyte dysfunction is a substantial aspect of metabolic inflammation as already evidenced by previous studies [
6,
8,
23,
32]
(Left) Reduced erythrocyte CD47 levels lead to reduced erythrocyte-bound TSP-1 levels. This provides a larger amount of more free TSP-1 molecules in the environment of Kupffer cells. Meanwhile, PE amplifies the recognition of phosphatidylserine by lactadherin, which acts as a bridge for pro-phagocytic receptors on macrophages. (Right) These signals lead to erythrophagocytosis, providing a pro-inflammatory metabolic cargo for macrophages. This cargo consists mainly of cholesterol, iron, phosphatidylethanolamine and sphingosine. The metabolites upregulate the expression of pro-inflammatory cytokines. Inflammation, along with the delivered cargo, disrupts the efferocytosis of apoptotic hepatocytes. CD47: cluster of differentiation 47, CHOL: cholesterol, DARC: duffy antigen receptor for chemokines, IL-1β: interleukin 1β, MCP1: monocyte chemoattractant protein 1, PE: phosphatidylethanolamine, PSer: phosphatidylserine, SIRPα: signal regulatory protein a, SPH: sphingosine, S1P: sphingosine 1-phosphate, TNF-α: tumor necrosis factor-a, TSP-1: thombospondin-1
Our results explain the reported anemia in animal models of NASH, where CD47 targeting had a therapeutic potential on NASH [
33,
34]; since erythrocytes of NASH patients and animal models exhibit reduced CD47 levels and increased pro-phagocytic signals, targeting of CD47 on erythrocytes enhances their phagocytosis. In addition, our results could also explain the negative impact of the chronic CD47 targeting in NASH animal models [
35]; erythrophagocytosis would lead to hepatic dysfunction. Conversely, targeting of TSP-1 would not alter the rate of erythrophagocytosis significantly.
Despite the obvious importance, our study has some limitations. The number of the healthy volunteers and patients is low. More importantly, our interpretation of the results, while being plausible, cannot be proved without the exploitation of animal models. More importantly, regarding arginase, we shall quantify the activity of the enzyme. Nevertheless, we have shed light on the molecular mechanisms of erythrophagocytosis in NASH.
5. Conclusions
In the current study we show that the levels of thrombospondin-1 on erythrocytes of NASH patients are decreased, and this is partially dependent on the reduction of the CD47 levels, and does not depend on the levels of thrombospondin-1 in the blood. We also show the accumulation of a membrane lipid, phosphatidylethanolamine, in patients’ erythrocytes. We also provide preliminary evidence that this accumulation is accompanied by exposure of phosphatidylethanolamine on the erythrocyte surface, possibly enhancing engulfment of erythrocytes. Protein levels of erythrocyte arginase-1 are reduced, possibly impairing sustained efferocytosis after erythrophagocytosis. Our study elaborates on the mechanisms of hepatic erythrophagocytosis during NASH. Since there does not exist an approved treatment for this disease, our study could provide insights for novel molecular therapeutic targets.
Author Contributions
Conceptualization, C.P; methodology, C.P, K.A .; software, K.A; validation, C.P, KA.; formal analysis, C.P, K.A; investigation, C.P.; resources, I.T., K.M; data curation, K.A.; writing—original draft preparation, C.P.; writing—review and editing, C.P, K.A, I.T., K.M; supervision, K.A.; project administration, C.P, I.T.; funding acquisition, I.T. All authors have read and agreed to the published version of the manuscript.
Funding
This research received no external funding
Institutional Review Board Statement
The study was conducted in accordance with the Declaration of Helsinki, and approved by the Ethics Committee of University Hospital of Alexandroupolis (protocol code 72/23-01-2018 and date of approval 02-04-2018).
Informed Consent Statement
Informed consent was obtained from all subjects involved in the study.
Conflicts of Interest
The authors declare no conflict of interest.
Abbreviations
| CD47: cluster of differentiation 47 |
| CHOL: cholesterol |
| IL-1β: interleukin 1β |
| NASH: non alcoholic steatohepatitis |
| PE: phosphatidylethanolamine |
| PSer: phosphatidylserine |
| SIRPα: signal regulatory protein a |
| SPH: sphingosine |
| S1P: sphingosine 1-phosphate |
| TNF-α: tumor necrosis factor-a |
| TSP-1: thombospondin-1 |
References
- Papadopoulos, C.; Tentes, I.; Papazoglou, D.; Anagnostopoulos, K. Lysophospholipid Metabolism and Signalling in Non-Alcoholic Fatty Liver Disease. Folia Med. (Plovdiv) 2022, 64, 7–12. [CrossRef]
- Caligiuri, A.; Gentilini, A.; Marra, F. Molecular Pathogenesis of NASH. Int. J. Mol. Sci. 2016, 17, 1575. [CrossRef]
- Papadopoulos, C.; Panopoulou, M.; Anagnostopoulos, K.; Tentes, I. Immune and Metabolic Interactions of Human Erythrocytes: A Molecular Perspective. Endocr. Metab. Immune Disord. Drug Targets 2021, 21, 843–853. [CrossRef]
- Papadopoulos, C.; Tentes, I.; Anagnostopoulos, K. Lipotoxicity Disrupts Erythrocyte Function: A Perspective. Cardiovasc. Hematol. Disord. Drug Targets. 2021, 21, 91–94. [CrossRef]
- Papadopoulos, C. Erythrocyte Glucotoxicity Results in Vascular Inflammation. Endocr. Metab. Immune Disord. Drug Targets 2022, 22, 901–903. [CrossRef]
- Otogawa, K.; Kinoshita, K.; Fujii, H.; Sakabe, M.; Shiga, R.; Nakatani, K.; Ikeda, K.; Nakajima, Y.; Ikura, Y.; Ueda, M.; et al. Erythrophagocytosis by Liver Macrophages (Kupffer Cells) Promotes Oxidative Stress, Inflammation, and Fibrosis in a Rabbit Model of Steatohepatitis: Implications for the Pathogenesis of Human Nonalcoholic Steatohepatitis. Am. J. Pathol. 2007, 170, 967–980. [CrossRef]
- Papadopoulos, C.; Mimidis, K.; Tentes, I.; Tente, T.; Anagnostopoulos, K. Validation and Application of a Protocol for the Extraction and Quantitative Analysis of Sphingomyelin in Erythrocyte Membranes of Patients with Non-Alcoholic Fatty Liver Disease. JPC – J. Planar Chromatogr. – Mod. TLC 2021, 34, 411–418. [CrossRef]
- Papadopoulos, C.; Spourita, E.; Mimidis, K.; Kolios, G.; Tentes, L.; Anagnostopoulos, K. Nonalcoholic Fatty Liver Disease Patients Exhibit Reduced CD47 and Increased Sphingosine, Cholesterol, and Monocyte Chemoattractant Protein-1 Levels in the Erythrocyte Membranes. Metab. Syndr. Relat. Disord. 2022, 20, 377–383. [CrossRef]
- Dinkla, S.; Wessels, K.; Verdurmen, W.P.R.; Tomelleri, C.; Cluitmans, J.C.A.; Fransen, J.; Fuchs, B.; Schiller, J.; Joosten, I.; Brock, R.; et al. Functional Consequences of Sphingomyelinase-Induced Changes in Erythrocyte Membrane Structure. Cell Death Dis. 2012, 3, e410. [CrossRef]
- Dupuis, L.; Chauvet, M.; Bourdelier, E.; Dussiot, M.; Belmatoug, N.; Le Van Kim, C.; Chêne, A.; Franco, M. Phagocytosis of Erythrocytes from Gaucher Patients Induces Phenotypic Modifications in Macrophages, Driving Them toward Gaucher Cells. Int. J. Mol. Sci. 2022, 23, 7640. [CrossRef]
- Bissinger, R.; Petkova-Kirova, P.; Mykhailova, O.; Oldenborg, P.-A.; Novikova, E.; Donkor, D.A.; Dietz, T.; Bhuyan, A.A.M.; Sheffield, W.P.; Grau, M.; et al. Thrombospondin-1/CD47 Signaling Modulates Transmembrane Cation Conductance, Survival, and Deformability of Human Red Blood Cells. Cell Commun. Signal. CCS 2020, 18, 155. [CrossRef]
- Zhou, Z.; Mahdi, A.; Tratsiakovich, Y.; Zahorán, S.; Kövamees, O.; Nordin, F.; Uribe Gonzalez, A.E.; Alvarsson, M.; Östenson, C.-G.; Andersson, D.C.; et al. Erythrocytes From Patients With Type 2 Diabetes Induce Endothelial Dysfunction Via Arginase I. J. Am. Coll. Cardiol. 2018, 72, 769–780. [CrossRef]
- Larson, M.C.; Karafin, M.S.; Hillery, C.A.; Hogg, N. Phosphatidylethanolamine Is Progressively Exposed in RBCs during Storage. Transfus. Med. Oxf. Engl. 2017, 27, 136–141. [CrossRef]
- Zhang, L.; Richard, A.S.; Jackson, C.B.; Ojha, A.; Choe, H. Phosphatidylethanolamine and Phosphatidylserine Synergize To Enhance GAS6/AXL-Mediated Virus Infection and Efferocytosis. J. Virol. 2020, 95, e02079-20. [CrossRef]
- Shama, S.; Jang, H.; Wang, X.; Zhang, Y.; Shahin, N.N.; Motawi, T.K.; Kim, S.; Gawrieh, S.; Liu, W. Phosphatidylethanolamines Are Associated with Nonalcoholic Fatty Liver Disease (NAFLD) in Obese Adults and Induce Liver Cell Metabolic Perturbations and Hepatic Stellate Cell Activation. Int. J. Mol. Sci. 2023, 24, 1034. [CrossRef]
- Burger, P.; Hilarius-Stokman, P.; de Korte, D.; van den Berg, T.K.; van Bruggen, R. CD47 Functions as a Molecular Switch for Erythrocyte Phagocytosis. Blood 2012, 119, 5512–5521. [CrossRef]
- Folch, J.; Lees, M.; Sloane Stanley, G.H. A Simple Method for the Isolation and Purification of Total Lipides from Animal Tissues. J. Biol. Chem. 1957, 226, 497–509.
- R: The R Project for Statistical Computing Available online: https://www.r-project.org/ (accessed on 23 March 2023).
- Cohen, J. Statistical Power Analysis for the Behavioral Sciences; 2nd ed.; Routledge: New York, 1988; ISBN 978-0-203-77158-7.
- Cohen, J. A Power Primer. Psychol. Bull. 1992, 112, 155–159. [CrossRef]
- Wang, F.; Liu, Y.-H.; Zhang, T.; Gao, J.; Xu, Y.; Xie, G.-Y.; Zhao, W.-J.; Wang, H.; Yang, Y.-G. Aging-Associated Changes in CD47 Arrangement and Interaction with Thrombospondin-1 on Red Blood Cells Visualized by Super-Resolution Imaging. Aging Cell 2020, 19, e13224. [CrossRef]
- Yurdagul, A.; Subramanian, M.; Wang, X.; Crown, S.B.; Ilkayeva, O.R.; Darville, L.; Kolluru, G.K.; Rymond, C.C.; Gerlach, B.D.; Zheng, Z.; et al. Macrophage Metabolism of Apoptotic Cell-Derived Arginine Promotes Continual Efferocytosis and Resolution of Injury. Cell Metab. 2020, 31, 518-533.e10. [CrossRef]
- Papadopoulos, C.; Mimidis, K.; Papazoglou, D.; Kolios, G.; Tentes, I.; Anagnostopoulos, K. Red Blood Cell-Conditioned Media from Non-Alcoholic Fatty Liver Disease Patients Contain Increased MCP1 and Induce TNF-α Release. Rep. Biochem. Mol. Biol. 2022, 11, 54–62. [CrossRef]
- Kirsch, T.; Woywodt, A.; Klose, J.; Wyss, K.; Beese, M.; Erdbruegger, U.; Grossheim, M.; Haller, H.; Haubitz, M. Endothelial-Derived Thrombospondin-1 Promotes Macrophage Recruitment and Apoptotic Cell Clearance. J. Cell. Mol. Med. 2010, 14, 1922–1934. [CrossRef]
- Gwag, T.; Reddy Mooli, R.G.; Li, D.; Lee, S.; Lee, E.Y.; Wang, S. Macrophage-Derived Thrombospondin 1 Promotes Obesity-Associated Non-Alcoholic Fatty Liver Disease. JHEP Rep. Innov. Hepatol. 2021, 3, 100193. [CrossRef]
- Min-DeBartolo, J.; Schlerman, F.; Akare, S.; Wang, J.; McMahon, J.; Zhan, Y.; Syed, J.; He, W.; Zhang, B.; Martinez, R.V. Thrombospondin-I Is a Critical Modulator in Non-Alcoholic Steatohepatitis (NASH). PLoS ONE 2019, 14, e0226854. [CrossRef]
- Ekinci, I.; Dumur, S.; Uzun, H.; Anataca, G.; Yalcinkaya, I.; Buyukkaba, M.; Cinar, A.; Ozkan, H.; Utku, I.K.; Akarsu, M.; et al. Thrombospondin 1 and Nuclear Factor Kappa B Signaling Pathways in Non-Alcoholic Fatty Liver Disease. J. Gastrointest. Liver Dis. JGLD 2022, 31, 309–316. [CrossRef]
- PAPADOPOULOS, C.; TENTES, I.; ANAGNOSTOPOULOS, K. Red Blood Cell Dysfunction in Non-Alcoholic Fatty Liver Disease: Marker and Mediator of Molecular Mechanisms. Mædica 2020, 15, 513–516. [CrossRef]
- Wang, W.; Liu, W.; Fidler, T.; Wang, Y.; Tang, Y.; Woods, B.; Welch, C.; Cai, B.; Silvestre-Roig, C.; Ai, D.; et al. Macrophage Inflammation, Erythrophagocytosis, and Accelerated Atherosclerosis in Jak2 V617F Mice. Circ. Res. 2018, 123, e35–e47. [CrossRef]
- Petrusca, D.N.; Gu, Y.; Adamowicz, J.J.; Rush, N.I.; Hubbard, W.C.; Smith, P.A.; Berdyshev, E.V.; Birukov, K.G.; Lee, C.-H.; Tuder, R.M.; et al. Sphingolipid-Mediated Inhibition of Apoptotic Cell Clearance by Alveolar Macrophages. J. Biol. Chem. 2010, 285, 40322–40332. [CrossRef]
- McPhillips, K.; Janssen, W.J.; Ghosh, M.; Byrne, A.; Gardai, S.; Remigio, L.; Bratton, D.L.; Kang, J.L.; Henson, P. TNF-Alpha Inhibits Macrophage Clearance of Apoptotic Cells via Cytosolic Phospholipase A2 and Oxidant-Dependent Mechanisms. J. Immunol. Baltim. Md 1950 2007, 178, 8117–8126. [CrossRef]
- Unruh, D.; Srinivasan, R.; Benson, T.; Haigh, S.; Coyle, D.; Batra, N.; Keil, R.; Sturm, R.; Blanco, V.; Palascak, M.; et al. Red Blood Cell Dysfunction Induced by High-Fat Diet: Potential Implications for Obesity-Related Atherosclerosis. Circulation 2015, 132, 1898–1908. [CrossRef]
- Shi, H.; Wang, X.; Li, F.; Gerlach, B.D.; Yurdagul, A.; Moore, M.P.; Zeldin, S.; Zhang, H.; Cai, B.; Zheng, Z.; et al. CD47-SIRPα Axis Blockade in NASH Promotes Necroptotic Hepatocyte Clearance by Liver Macrophages and Decreases Hepatic Fibrosis. Sci. Transl. Med. 2022, 14, eabp8309. [CrossRef]
- Gwag, T.; Ma, E.; Zhou, C.; Wang, S. Anti-CD47 Antibody Treatment Attenuates Liver Inflammation and Fibrosis in Experimental Non-Alcoholic Steatohepatitis Models. Liver Int. 2022, 42, 829–841. [CrossRef]
- Tao, H.-C.; Chen, K.-X.; Wang, X.; Chen, B.; Zhao, W.-O.; Zheng, Y.; Yang, Y.-G. CD47 Deficiency in Mice Exacerbates Chronic Fatty Diet-Induced Steatohepatitis Through Its Role in Regulating Hepatic Inflammation and Lipid Metabolism. Front. Immunol. 2020, 11.
|
Disclaimer/Publisher’s Note: The statements, opinions and data contained in all publications are solely those of the individual author(s) and contributor(s) and not of MDPI and/or the editor(s). MDPI and/or the editor(s) disclaim responsibility for any injury to people or property resulting from any ideas, methods, instructions or products referred to in the content. |
© 2023 by the authors. Licensee MDPI, Basel, Switzerland. This article is an open access article distributed under the terms and conditions of the Creative Commons Attribution (CC BY) license (http://creativecommons.org/licenses/by/4.0/).
