Preprint
Article

Optimizing Biochar Particle Size for Plant Growth and Mitigation of Soil Salinization

Altmetrics

Downloads

426

Views

77

Comments

0

A peer-reviewed article of this preprint also exists.

This version is not peer-reviewed

Submitted:

14 April 2023

Posted:

17 April 2023

You are already at the latest version

Alerts
Abstract
Pyrolyzed waste biomass, or biochar, has been suggested as a means to increase plant growth and to mitigate soil salinization, which is a widespread agricultural issue and can reach extreme levels in urban soils impacted by de-icing salts. Soil mixing is enhanced by reduced biochar particle size; however, biochar properties vary with particle size and recent studies suggest that plant growth responses may be maximized at intermediate particle sizes. We examined the responses of two plant species (cowpea (Vigna unguiculata) and velvetleaf (Abutilon theophrasti)) to biochar amendments that spanned a wide range of particle sizes obtained by sieving, with and without de-icing salt additions. The smallest size fractions of biochar reduced plant growth relative to unamended controls. Plant biomass production was generally maximized at intermediate biochar particle size treatments, with particles sizes of 0.5-2.0 mm showing the best response. Mitigation of salt effects was also improved at intermediate biochar particle sizes in this particles size range. Our results emphasize the importance of optimizing biochar particle size to best enhance plant responses to biochar, with particular reference to saline soils.
Keywords: 
Subject: Environmental and Earth Sciences  -   Environmental Science

1. Introduction

Soil salinization is a global economic and environmental issue, with large impacts on agricultural productivity and high costs of remediation [1,2]. An estimated ~1.26 billion hectares are impacted by salinization globally [3]. High soil salinity can be induced by human activities, often through poor fertilization and water management practices [4]; however, saline soils also occur naturally, especially in arid and semi-arid regions where precipitation is low [5]. In an urban context, use of de-icing salts, mainly sodium chloride (NaCl), in the winter months, is a main cause of soil salinization [6,7]. The runoff and infiltration of de-icing salts increase soil electrical conductivity and chloride concentration in the surrounding environment [8,9], often resulting in contamination of surface and groundwaters [10,11]. Additional adverse environmental impacts of de-icing salts include inhibition of soil nutrient cycling [12], alteration of aquatic and plant communities [13,14,15], and toxicological effects on birds [16].
Both Na+ and Cl- are toxic at high concentrations and stunt plant growth by displacing nutrients in the soil and reducing plant water availability by osmotic effects [5]. Urban street trees are often susceptible to road salt pollution due to their proximity to roads and high traffic areas, though some species show relatively high salt tolerance [17,18,19]. Plants affected by soil salinization tend to have lower leaf chlorophyll concentrations because excessive chloride is associated with chlorophyll degradation [20]. The negative impacts of de-icing salts are clear; however, use of de-icing salt remains widespread due to its effectiveness and low cost. Alternative de-icing agents are often costly and may themselves have adverse environmental impacts [21]; research on practices to reduce road salt impacts on urban ecosystems remains scarce.
Biochar is an organic soil amendment product made from carbon-rich organic waste materials by pyrolysis [22]. Although much biochar research has focused on agricultural applications [23,24] and carbon sequestration [25,26], biochar has also been applied to forest restoration [27], wastewater treatment [28] and pollutant removal [29,30]. Biochar can potentially remediate salt-affected soils by salt sorption [31,32]. Specifically, biochar sorption of Na+ in the soil solution can both reduce plant Na uptake and increase the relative uptake of Ca2+ and Mg2+ [33,34]. More broadly, biochar can generally enhance plant growth by improving soil properties, such as cation-exchange capacity (CEC), water retention capacity, and bulk density [23]. By increasing the soil CEC and water-holding capacity (WHC), biochar can reduce fertilizer and water use [35,36], which is particularly beneficial in the context of urban ecosystems.
The quality and performance of biochars depend on their chemical and physical properties, which are affected by the feedstock materials, pyrolysis method and conditions, and post-processing treatments [37,38]. Physical manipulation of biochar by post-processing treatments, such as sieving and grinding to alter the particle size and shape, can substantially change biochar porosity characteristics, WHC, bulk density and pH [39]. For example, sieved biochar has a higher aspect ratio than ground biochar, which can increase WHC by generating increased inter-pore space [40]. Heat treatment and aeration increase surface area and reduce non-water-soluble volatile organic compounds and toxins in biochar [38,41]. In general, the properties of biochar can be manipulated to target specific applications.
Previous studies by Thomas et al. [31] and Akhtar et al. [33,34] have highlighted the importance of the ion sorption capacity of biochar in enhancing plant growth under saline soil conditions. Smaller biochar particles might be expected to better enhance biochar sorption capacity – and thus plant growth under salt stress – because smaller particles have a higher WHC [40] and improved soil-biochar contact [42]. However, recent studies suggest that there may generally be an optimum biochar particle size for enhancing plant growth responses. Large particles clearly reduce particle mixing and accessible surface area for sorption; however, very small particles may reduce soil WHC and hydraulic conductivity by filling soil inter-pores [43,44]. Small biochar particles also can show increased ash content and pH [39]. Although very few studies have examined plant growth responses across a wide range of biochar particle sizes, a recent meta-analysis presents evidence for an optimal biochar particle size of 0.5-1.0 mm [38]. Prior studies on biochar particle size effects have focused on agricultural soils; in urban ecosystems, compost-amended soils are common, and are likely to show distinct responses to both salt exposure and biochar amendments.
The present study examines soil and plant responses to a wide range of biochar particle sizes with and without additions of road salt. A greenhouse experiment was conducted over a 10-week growth period using a representative compost-amended topsoil substrate. We tested the following hypotheses: (1) biochar amendments will in general enhance plant growth and mitigate negative effects of salt additions; (2) an optimum biochar particle size will exist, with biochar particle size fractions of 0.5-1.0 mm best enhancing plant growth and plant tolerance of saline soil.

2. Materials and Methods

2.1. Experimental design and growth conditions

A greenhouse experiment was conducted at the University of Toronto for 67 days between March 19 and May 25, 2021. The average daily temperature was 20.1 ℃ with the highest 25.0 ℃ and lowest 13.4 ℃. The experiment included two treatment factors: biochar particle size and salt addition. The growth container for each plant had a volume of 0.5 L, 10 cm depth and a surface area of ~78 cm2. Biochar and salt treatment dosages were calculated based on the container’s surface area. A fibreglass mesh liner was added to each container to prevent soil and biochar loss. A total of 196 containers were used: 2 plant species x 6 biochar particle sizes and a control group x 2 salinity levels x 7 replicates per treatment. Replicates were grouped by using a randomized complete block designed to minimize spatial effects.
Two fast-growing plant species, Vigna unguiculata (L.) Walp. (cowpea), and Abutilon theophrasti Medik. (velvetleaf) were used in the experiment; seeds were sourced from Sprout Master and V&S Seed Supply, respectively. Cowpea is a nitrogen-fixing and salt-tolerant species suitable for hot and dry environments [45]. Velvetleaf is considered a weed in North America but is also grown as a crop plant for its edible leaves, seeds, and bast fibres [46]. Seeds were germinated in vermiculite for 17 days before being transplanted into individual containers. The growing period for cowpea was 50 days (from March 19 to May 8, 2021) and 67 days (from March 19 to May 25, 2021) for velvetleaf. Plants were watered every 3-4 days to field capacity. Both species were supplemented with ~1538.5 kg/ha (0.12 g per container) of 16-10-10 NPK slow-release fertilizer (Nutricote 16-10-10 NPK, from JCAM AGRI). Rhizocell C (LalRise Vita, from Lallemand Inc.), a mixture of live Bacillus velezensis and inert Saccharomyces cerevisiae, was also added as a biofertilizer to velvetleaf using an application rate of 50 ml per container. Five arthropod species, Aphidoletes aphidimyza, Rhopalosiphum padi, Neoseiulus fallacis, Encarsia Formosa and Stratiolaelaps scimitus, were released in the greenhouse as biocontrols to prevent pests and fungal disease.
A de-icing road salt (97% NaCl, from Sifto Safe Step) was added to the soil surface of half the pots after the seedlings were established on day 18 after the transplant on April 6, 2021. The salt dosage was 0.3 t/ha (0.234 g per container) to mimic common roadside conditions [31].

2.2. Soil and biochar characterization

The soil used was premium topsoil from LessMess Soil (Concord, ON), a typical topsoil used in an urban setting, with mineral soil components derived from calcareous subsoil material. Soil analysis was completed by Agriculture and Food Laboratory in Guelph. Basic soil properties were as follows: total C: 26.4%; total N: 1.06%; extractable P: 130 mg/L; extractable Mg: 480 mg/L; extractable K: 2500 mg/L; pH: 7.5.
The biochar used was produced by Burt‘s Greenhouses (Odessa, ON) from waste mixed-wood shipping pallets in a BlueFlame boiler using pyrolysis mode at 700℃ for 30 min [47,48]. Total carbon of the material was 64.5% (by Dumas combustion analysis, Activation Laboratories Ltd., Ancaster, ON). Detailed analyses of properties of the bulk biochar have been published elsewhere [47,48]. Biochar was sieved in a mechanic sieve shaker into six particle fractions (< 0.063 mm, 0.063-0.499 mm, 0.50-0.99 mm, 1.00-1.99 mm, 2.00-2.79 mm and ≥ 2.8 mm) using U.S. Standard sieves. Images of representative biochar samples from each size fraction were taken using a scanning electron microscope (SU3500, Hitachi). The biochar application dosage used was 10 t/ha (7.8 g per container); comparable to dosages used in the context of restoration [49,50].
The moisture content of each size fraction was calculated using the change in dried and pre-dried masses; these values were used to adjust biochar dosages on a dry mass basis. Biochar was dried in the convection oven at 105℃ for 24 h before measurement according to the protocol in ASTM D1762-84 [51]. After harvest, pH and electrical conductivity (EC) of biochar and soil mixture from each container were measured, the upper 2 cm of soil were collected, a pH/mV/Temp system from IQ Scientific Instruments and a conductivity meter from Hanna Instruments Inc. were used. A 1:5 (v/v) mixture of soil and deionized water mixture was shaken on an oscillating table at 60 rpm for 24 h before measurement [40]. Similar methods were used to determine pH and EC of biochar size fractions but using a 1:20 (v/v) mixture of biochar and deionized water. Bulk density of biochar size fractions was determined using a graduated cylinder and analytical balance, with tap density and compression (Hausner) ratio based on manual tapping of the cylinder to achieve an equilibrium volume.

2.3. Plant performance measurements

Plant mortality was recorded bi-weekly, and plants dying immediately after transplant were replaced (43% of the cowpea and 37% of the velvetleaf were dead and replanted within the first 10 days). Plant height and leaf length were measured to the nearest cm on day 14 (before the fertilizer and salt treatment) and before the final harvest. Leaf area (A) in cm2 was estimated using the leaf length (L) in cm. The allometric equation used for velvetleaf was based on a previous study: A = 0.613 x L2.204 [40]. An allometric equation for cowpea was developed based on the scanned leaf area and leaf length from 71 harvested leaves: A = 0.539 x L1.8729 (Adjusted r2 = 0.838). The final total leaf area of each plant was measured using a leaf area meter (Li-3100C from Li-Cor Biosciences).
Chlorophyll fluorescence and chlorophyll content of cowpea were measured before the final harvest using a chlorophyll fluorometer (MINI-PAM, Walz GmbH) and a chlorophyll meter (CCM-200 plus, Opti-Sciences Inc.), respectively. Light-saturated photosynthetic rate (Amax), stomatal conductance (gs) and instantaneous leaf water use efficiency (WUEi) were measured prior to harvest on the most recently developed fully expanded leaf of each surviving cowpea using a portable photosynthesis system (LI-6400xt, Li-Cor Biosciences, Lincoln, NE). Measurements were made between 7:00-14:00 local time at a light level 1500 µmol m-2 s-1 PPFD, leaf temperature 20-22°C, and humidity 50-60%. Leaf physiology measurements were made on cowpea only due to leaf area constraints. At harvest, above- and below-ground biomass of plants were separated at soil level. Stems and leaves were separated. Roots were removed from the soil and washed manually. All collected biomass was weighed after being dried in a forced-air oven at 60℃ for 48 h.

2.4. Statistical Analysis

Statistical analyses were conducted using R programming environment (R version 4.0.2, R Core Team 2021). Analysis of variance (ANOVA) and correlation tests were used in analyses of physical properties of biochar size fractions. For the greenhouse experiment, initial analyses including block as a random factor in a linear mixed model were run, but the block effect was not significant; therefore, simple two-way ANOVA was used to examine the effects of biochar particle size and salt on soil parameters and plant performance. Assumptions of normality of variances and homoscedasticity of residuals were confirmed graphically. As a supplementary test for biochar particle size effects per se, we conducted separate analyses excluding the control (no biochar) treatment. We used the Scott-Knott post-hoc test clustering algorithm [52] to group means by biochar particle size, making use of the SK() function in the ScottKnott R package [53]. Pairwise tests for salt effects within a biochar particle used t-tests with p-values adjusted for multiple comparisons using a false discovery rate correction.
In addition to species-specific analyses, we utilized meta-regression techniques to quantify general, species-pooled patterns of response. The response ratio statistic (R = ln(Xt/Xc) was used to quantify the effect size, where R is the response ratio statistic, Xt is the treatment mean, and Xc is the control mean. Pooled R values were inversely weighted by sampling variance. Response ratios were quantified for both biomass responses to biochar additions (relative to the unamended controls) and for biomass responses to salt additions (relative to the biochar-amended controls without salt additions). In both cases, we quantified response patterns using a 2nd-order polynomial meta-regression function and considered a negative 2nd-order term and positive 1st-order term consistent with an optimum curve response within the range of biochar particle sizes tested. Meta-regression analyses treated particle size classes as a ranked ordinal variable, and were conducted using the escalc() and rma() functions in the metafor R package [54].

3. Results

3.1. Biochar properties

Physiochemical properties of biochar fractions varied with particle size (Table 1). Biochar pH ranged from 9.0 to 9.5 and did not vary significantly with particle size (ANOVA p > 0.05). EC values did vary significantly (ANOVA p < 0.001): the smaller size fractions had a higher EC than the soil, while the larger fractions had a lower EC than the soil (> 1 mS/cm). Both bulk density and tap density of varied among particle size classes (ANOVA p < 0.001) and were negatively correlated with particle size (r = -0.881 and r = -0.860; p < 0.001: analysis based on mid-points of size ranges). The compression (Hausner) ratio also varied with particle size (ANOVA p = 0.018), being largest for the 0.063-0.5 mm size category and smallest for the 1-2 mm size category (Table 1). SEM images indicated a collapse of wood cell structure in biochar particles at the smallest size fractions (Figure 1), suggesting reduced macroporosity.

3.2. Soil properties

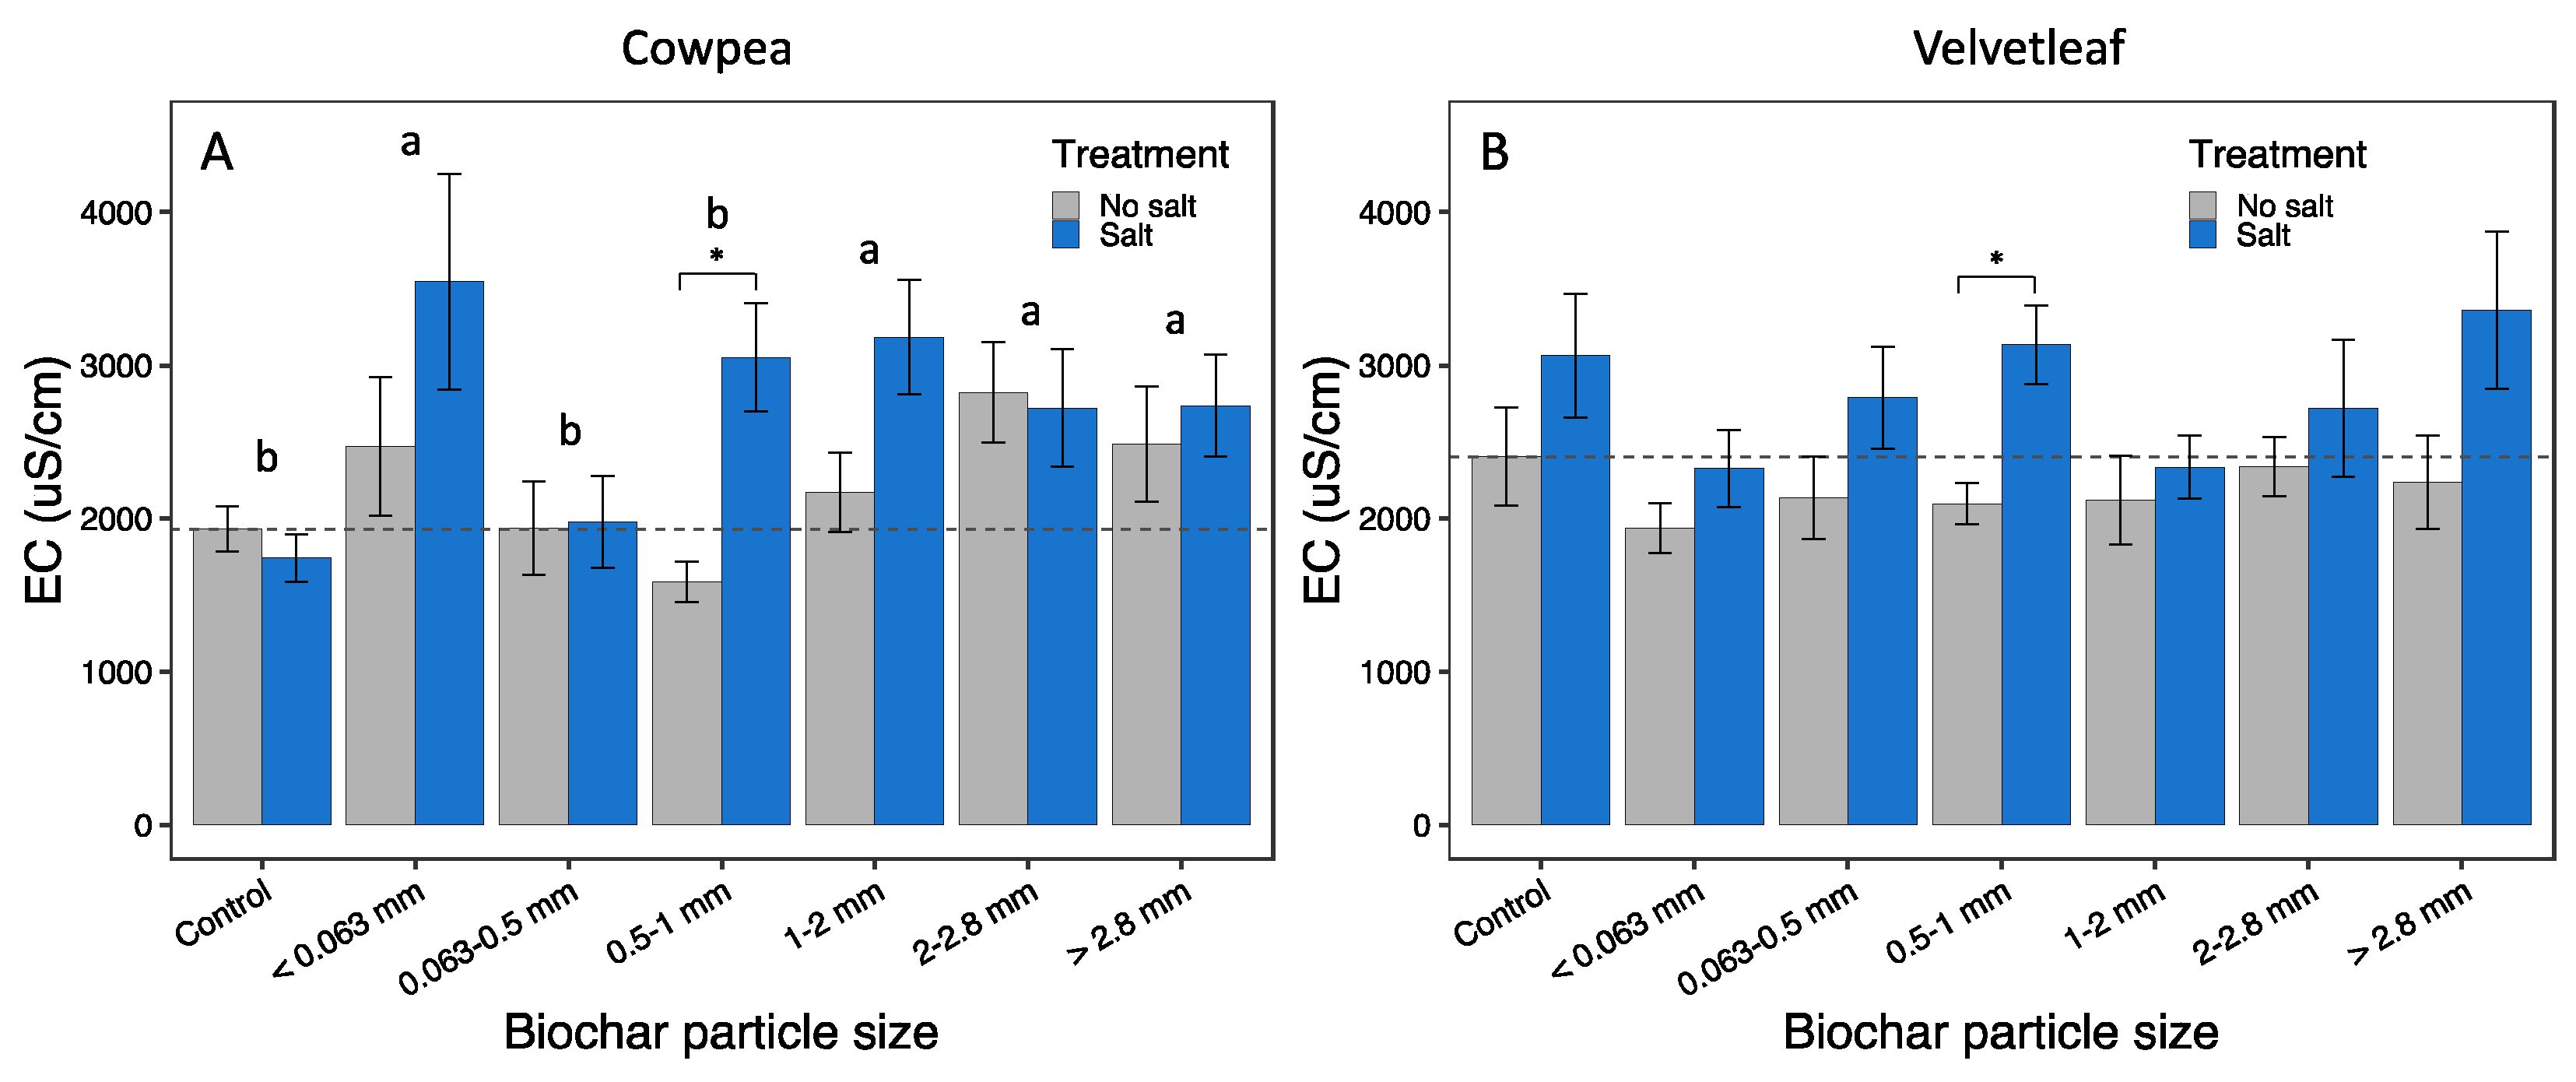
Biochar particle size effects on soil pH were statistically significant (p < 0.001 for cowpea, p = 0.043 for velvetleaf; Table 2); however, pH values remained in a narrow range near optimum pH levels (7.2-7.4; data not shown). Salt additions did not significantly affect pH (Table 2). Both salt and biochar particle size effects significantly affected soil EC in cowpea (Table 2); the smallest particle size (< 0.063 mm) showed the most pronounced increase in EC relative to the control (Figure 2A). Although there were no biochar particle size effects for velvetleaf, salt additions significantly increased EC (Figure 2B; Table 2).

3.3. Plant growth responses

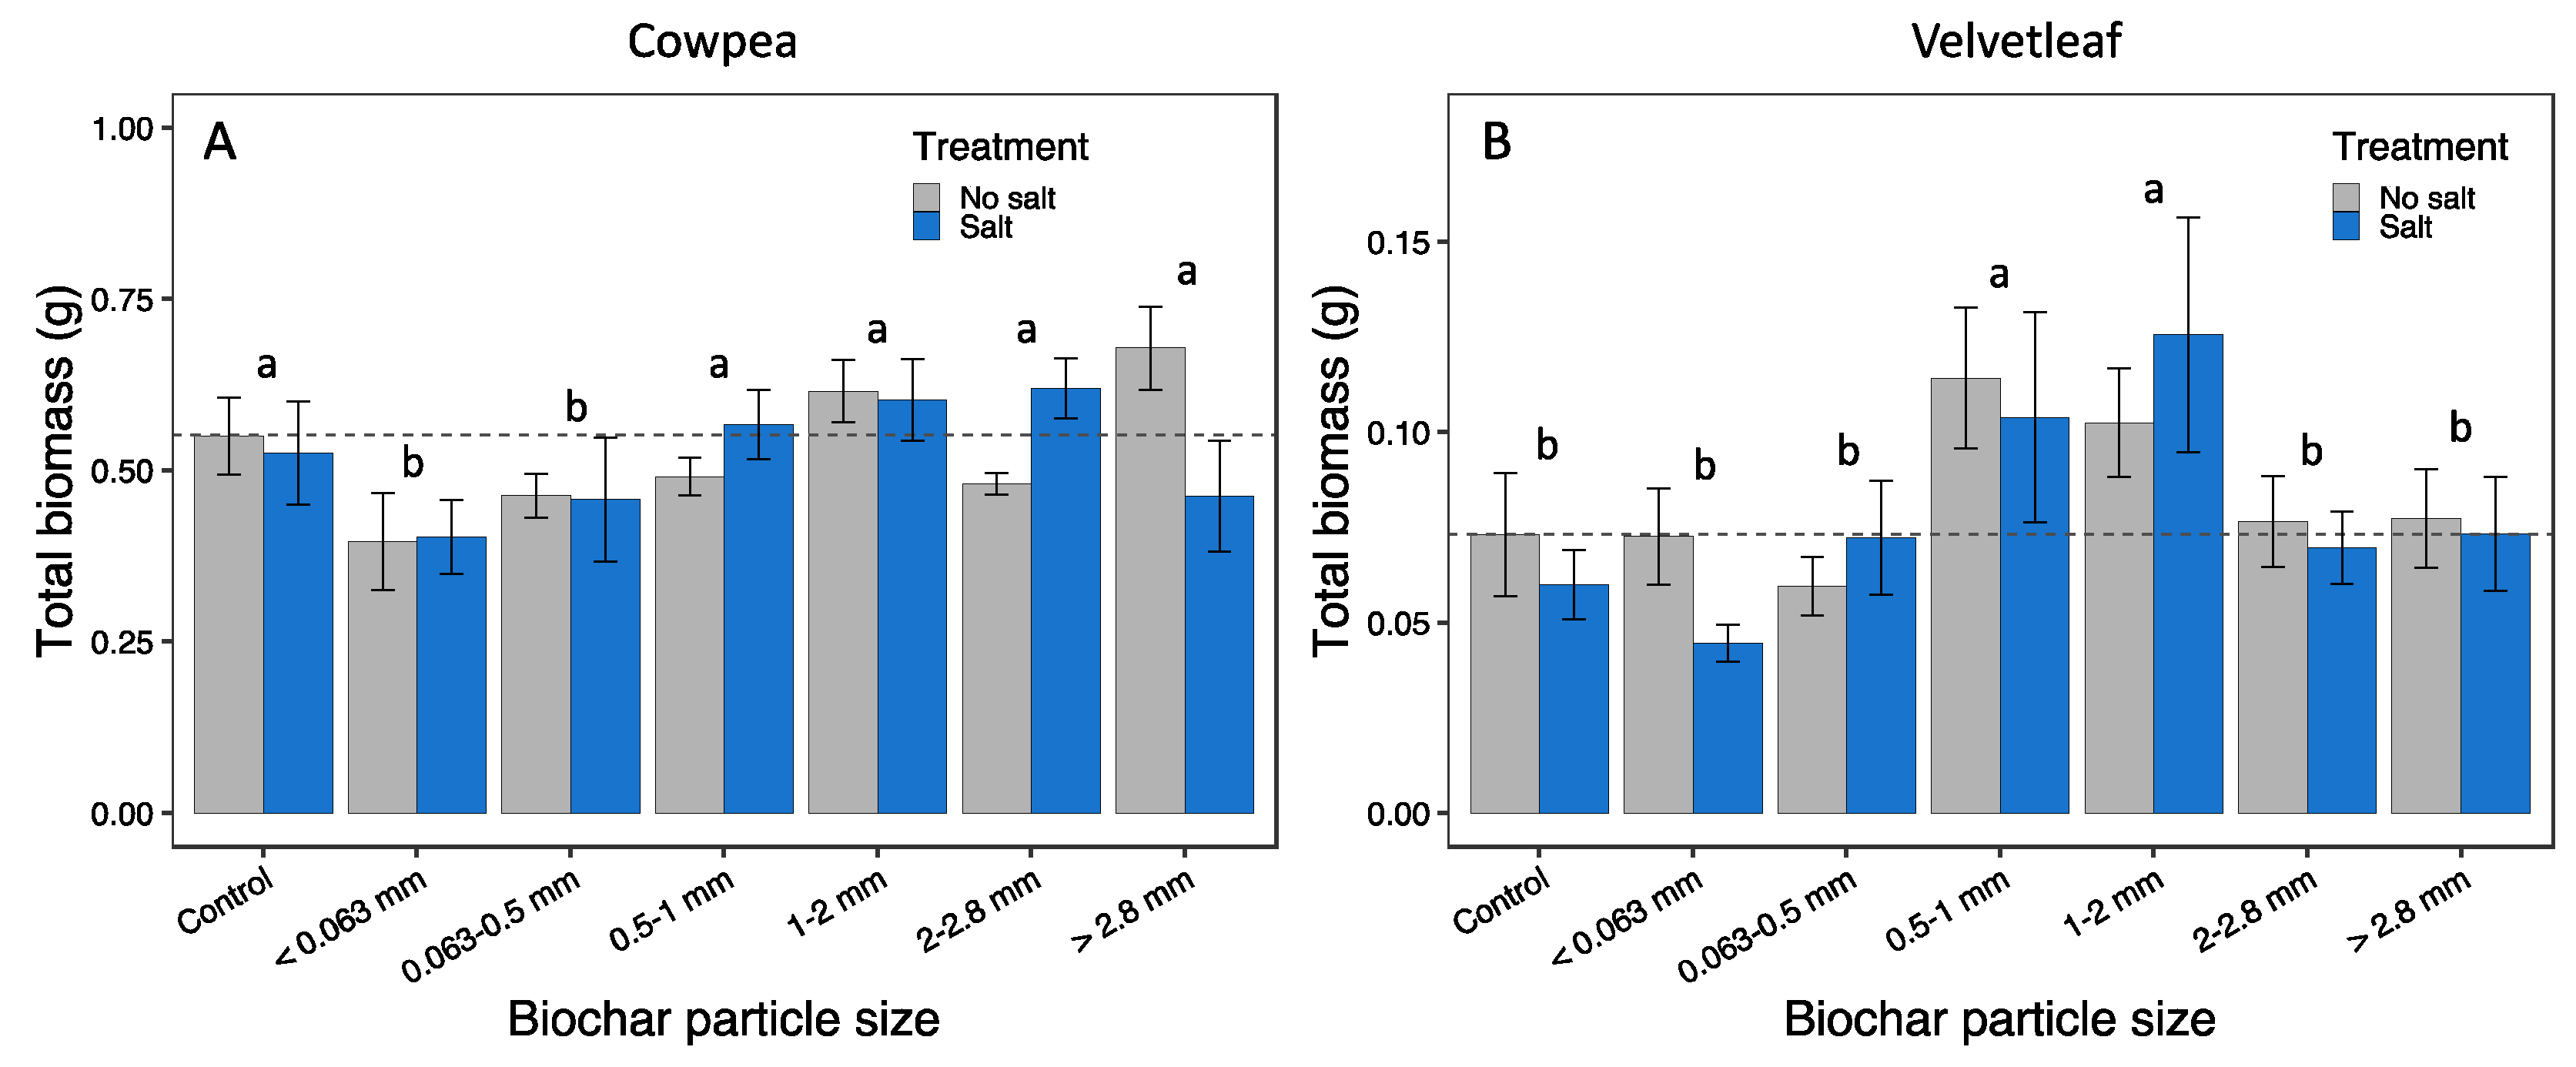
Mortality was low in the experiment, with 99% of the cowpea and 96% of the velvetleaf surviving to harvest. In early growth responses (based on non-destructive estimates of leaf area), cowpea showed a positive growth response to medium to large particle size (> 1.0 mm) biochar, but no response to smaller particle size (Table 2). Biomass responses showed significant responses to biochar particle sizes for both species. Cowpea growth was highest for particle sizes > 0.5 mm (Figure 3A; Table 2), while velvetleaf showed a clearer peak in response at intermediate particle sizes (0.5-2.0 mm) (Figure 3B; Table 2). Similar trends were found for various measures of plant size, including leaf area, and aboveground, belowground, and total biomass (Table 2). For velvetleaf, biomass was enhanced relative to controls for intermediate biochar particle sizes (0.5-1 and 1-2 mm) even for the salt addition treatments (Figure 3B: post-hoc comparisons signify ant at p < 0.5 in both cases). Leaf area at harvest showed a similar response to biomass for velvetleaf, but no significant response to treatments in cowpea (Table 2). Root fraction showed a significant response to biochar particle size in both species (Table 2), with root fraction increasing for larger biochar particle sizes. Leaf mass per area did not respond to treatments (Table 2). No visible root nodules were present on cowpea.
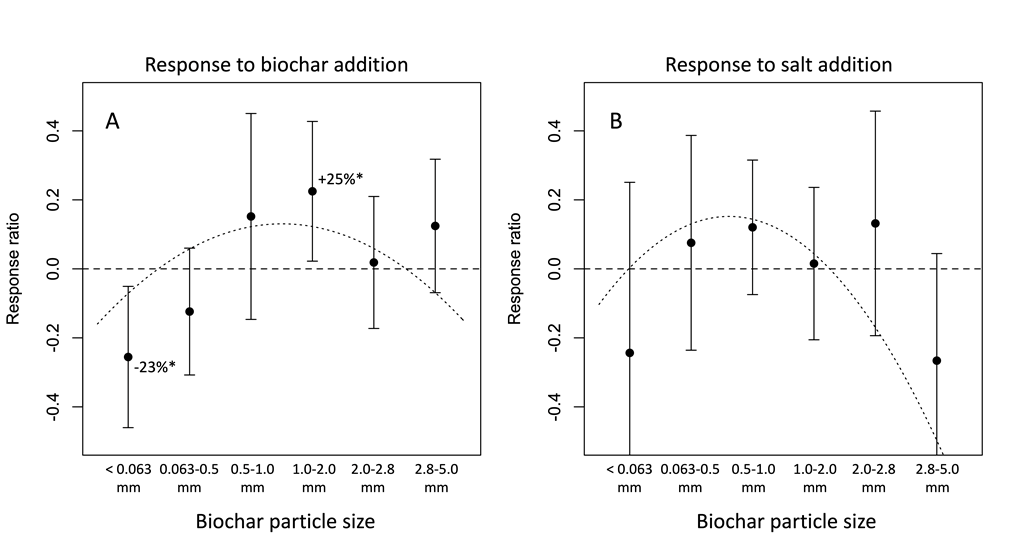
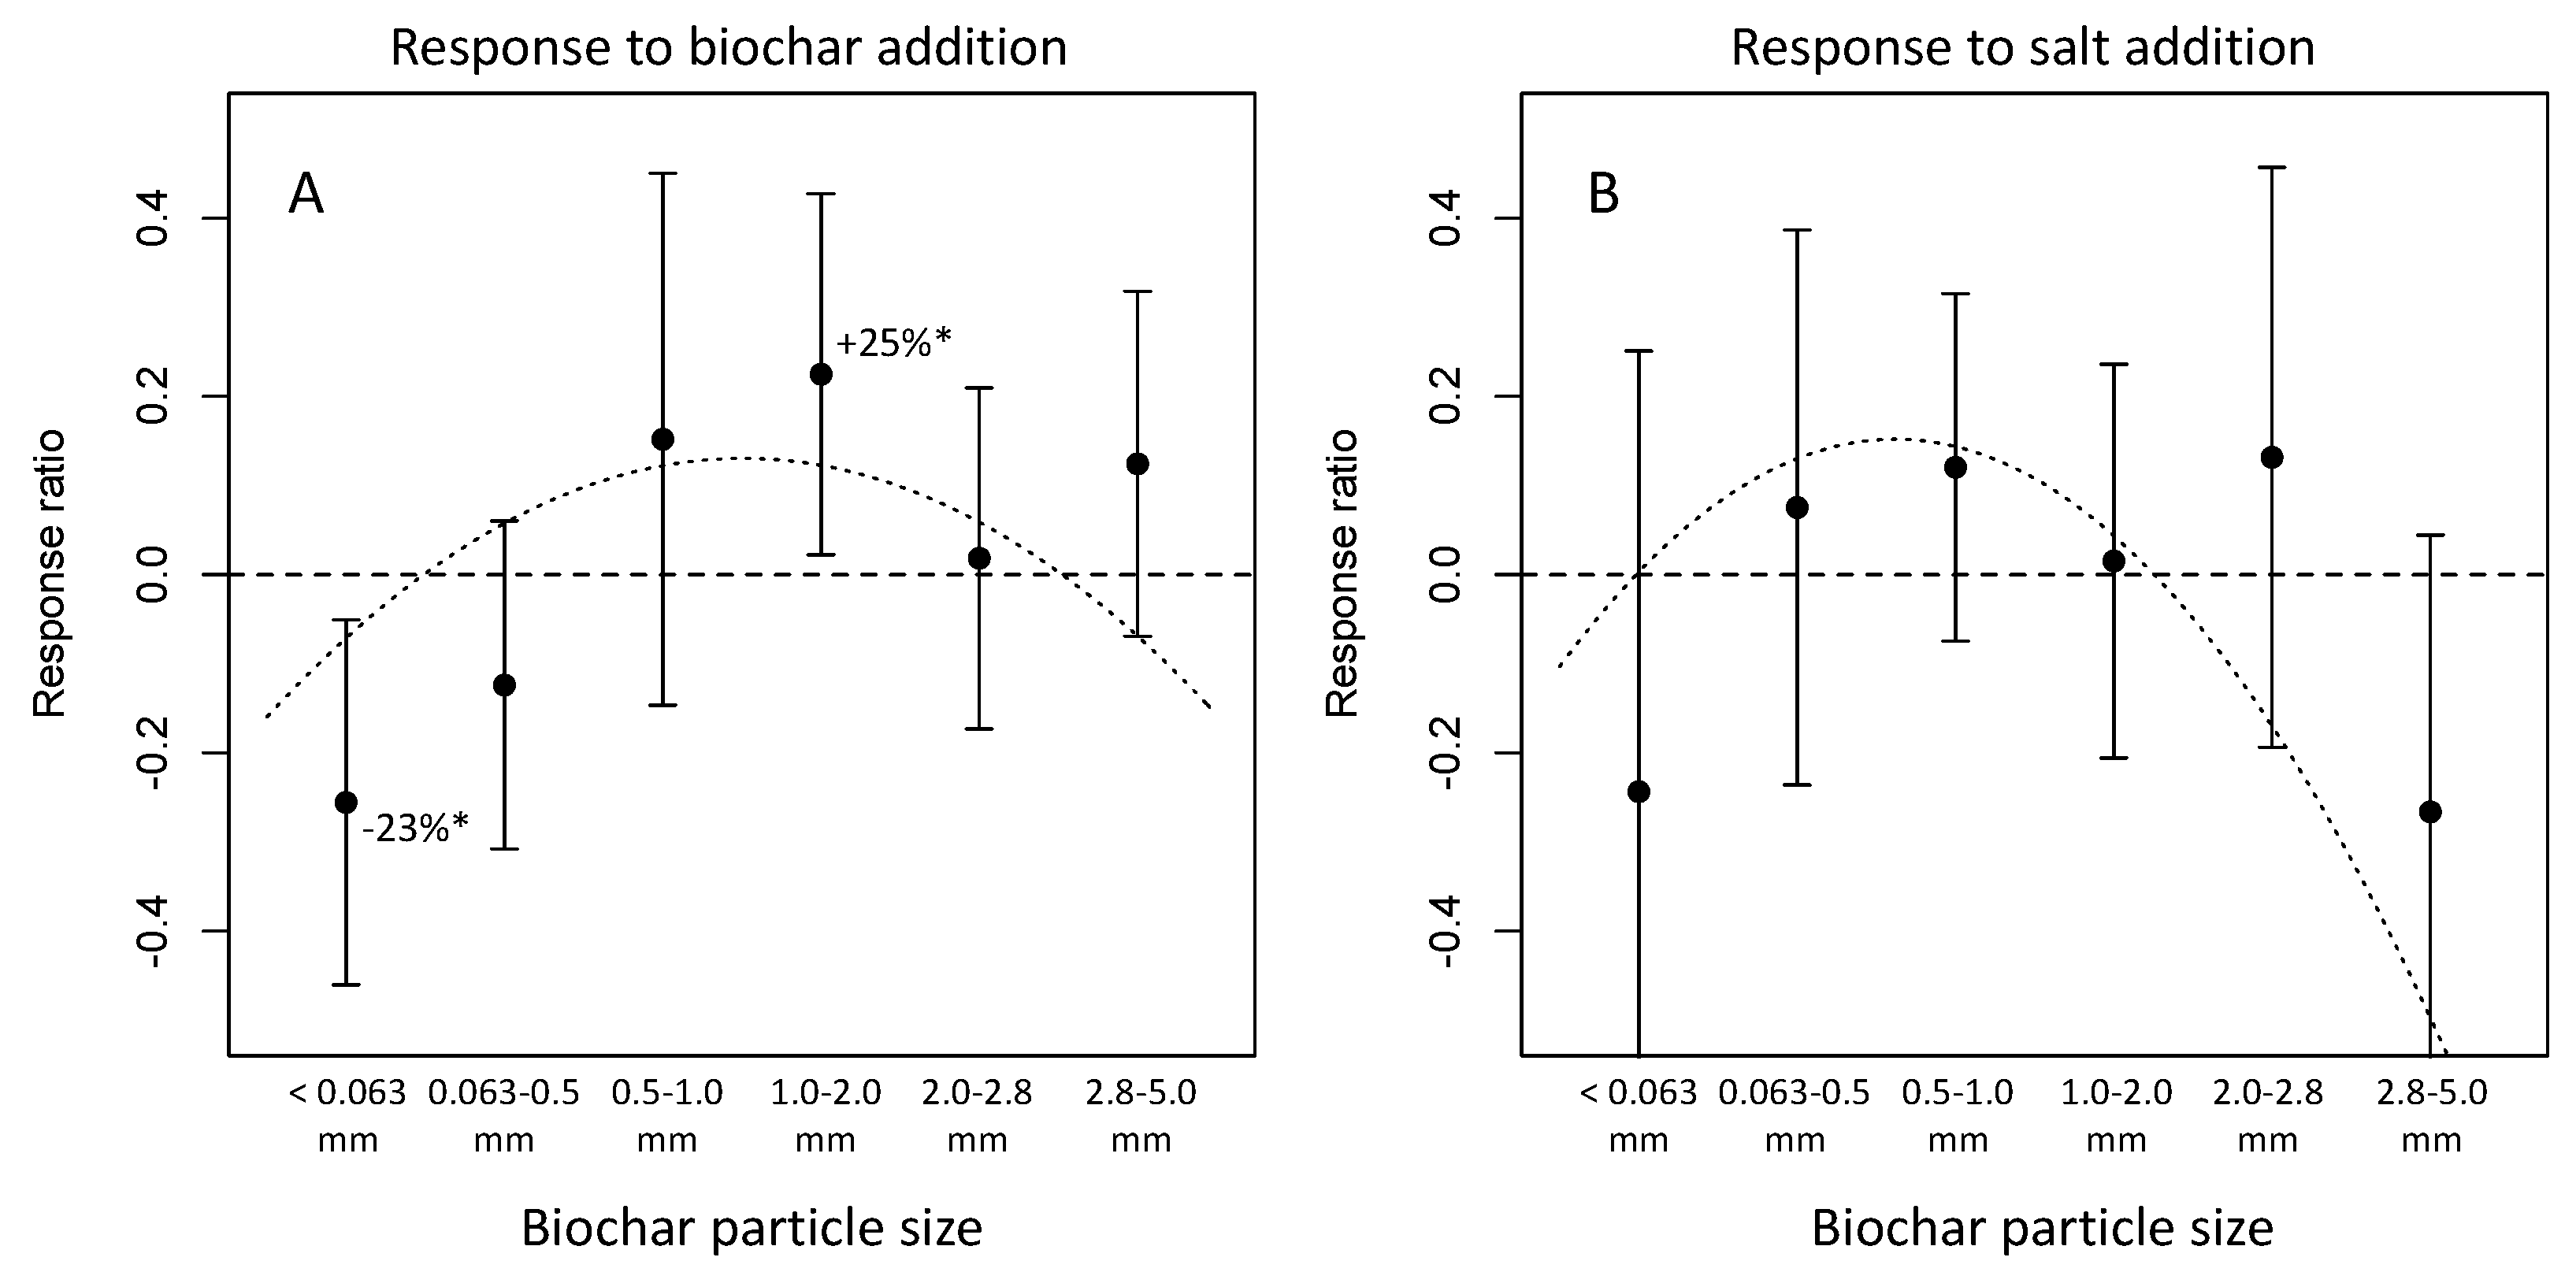
Meta-analysis was used to conduct species-pooled analyses for the experiment, with results supporting peak performance at intermediate biochar particle sizes (Figure 4). The pooled response ratio for the biomass response to biochar addition was negative for the smallest biochar size category (< 0.063 mm), and positive for the 1-2 mm size category (Figure 4A). The overall test for effects of moderators was significant (p = 0.008). The 1st-order term for the polynomial meta-regression was significant (p = 0.014), and the 2nd-order term significant (p = 0.067) with the peak falling between the 0.5-1.0 mm and 1-2 mm size categories (Figure 4A). The pooled response ratio for the biomass response to salt addition did not deviate from zero for any biochar size category (Figure 4B), and the test for effects of moderators was not significant (p = 0.135). However, both the 1st and 2nd-order meta-regression terms were significant in this case (p = 0.038 and p = 0.041, respectively), with the peak falling between the 0.063-0.5 mm and 0.5-1.0 mm size categories (Figure 4B).

3.4. Physiological responses

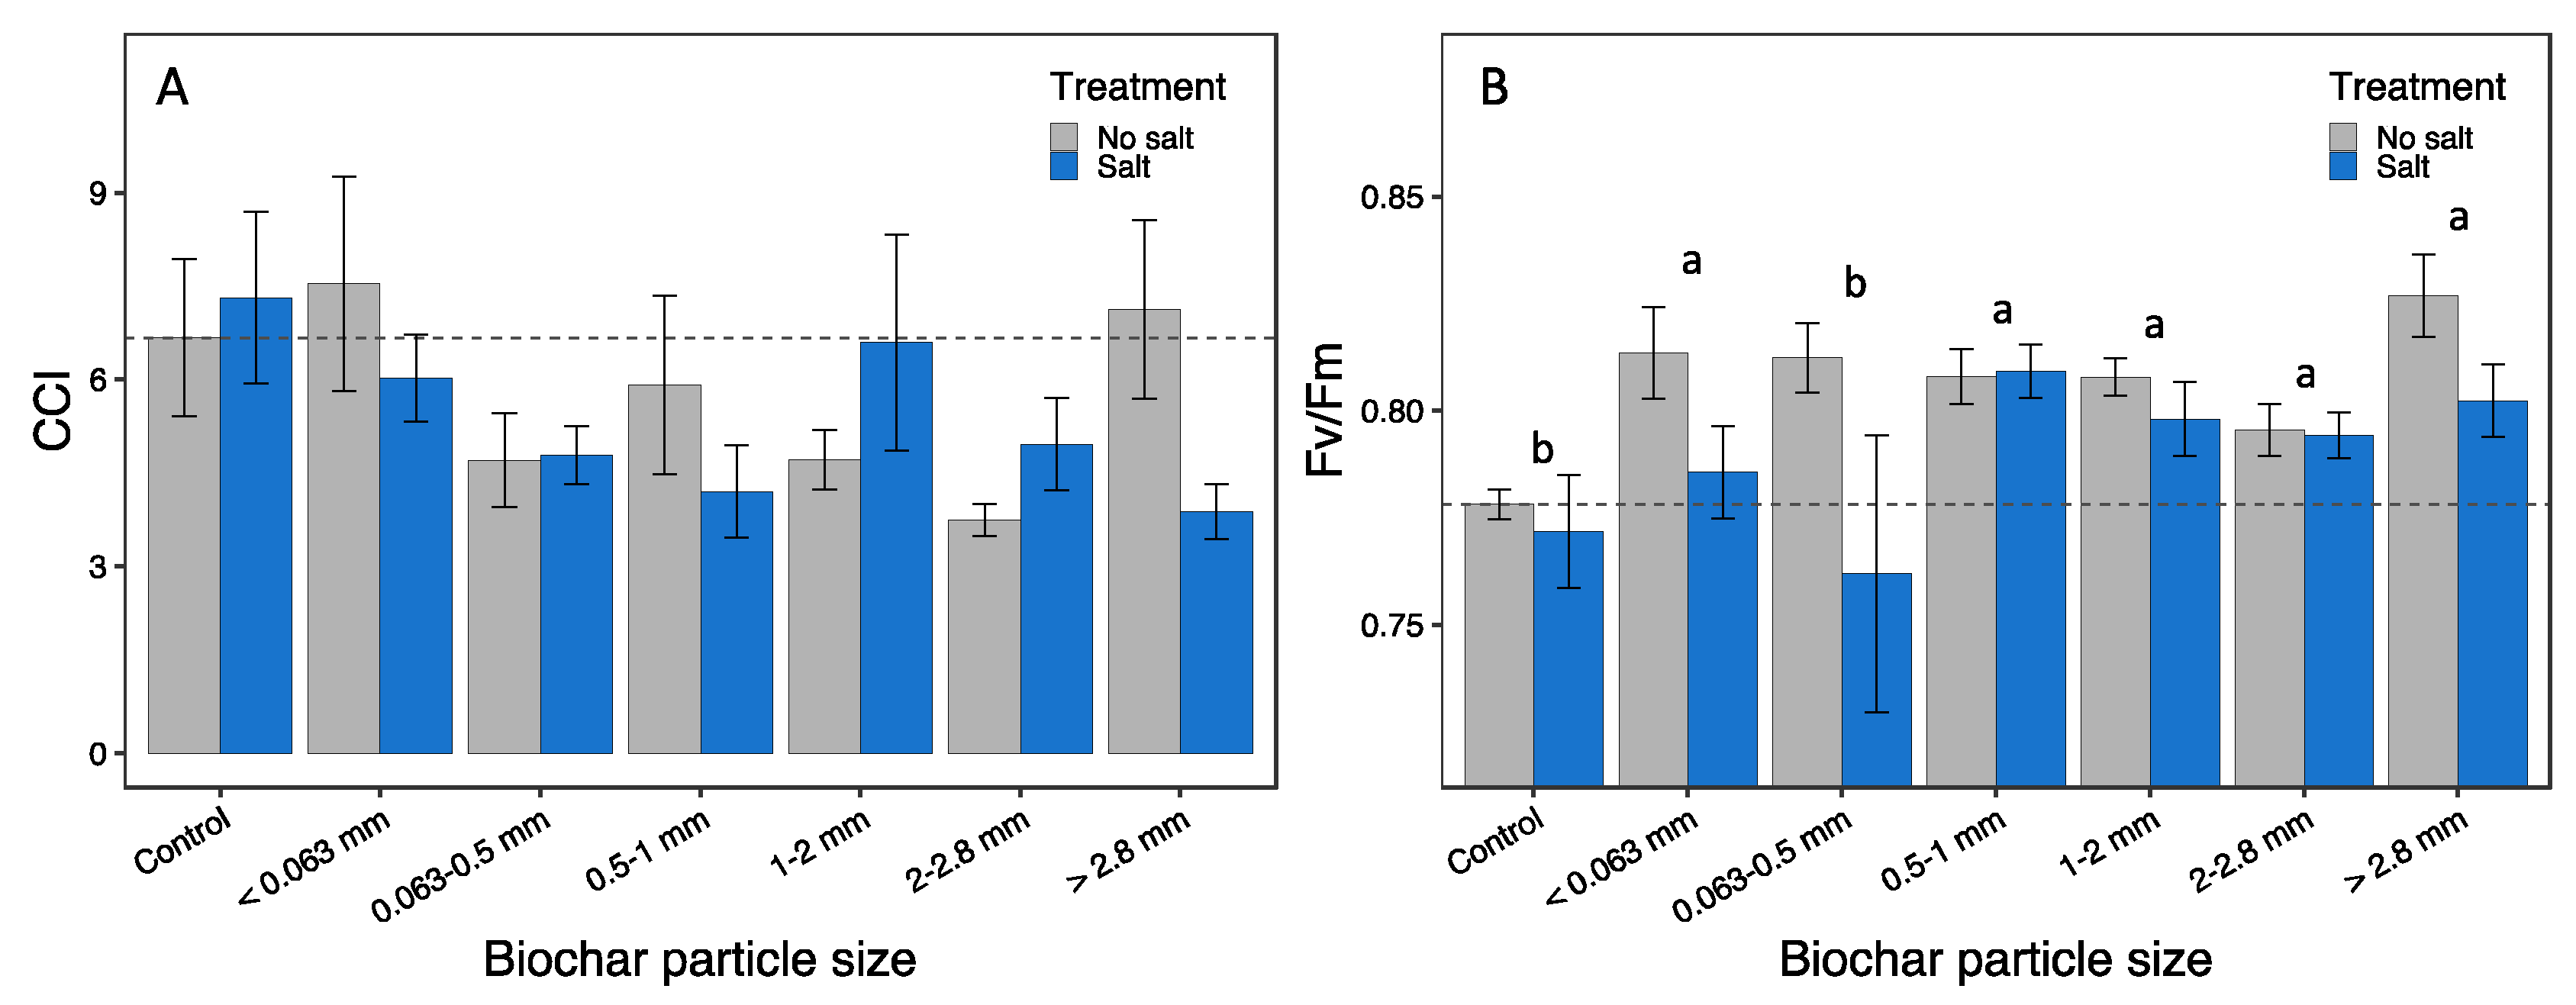
Treatment effects on chlorophyll content index (CCI) values were not detected (Figure 5A; Table 2). Both biochar particle size and salt treatments significantly affect chlorophyll fluorescence (Fv/Fm) (p = 0.027 and p = 0.008, respectively), with positive effects of most biochar treatments and negative effects of salt addition (Figure 5B; Table 2). Increases in Fv/Fm relative to controls were particularly pronounced for biochar particles > 0.5 mm (Figure 5B).
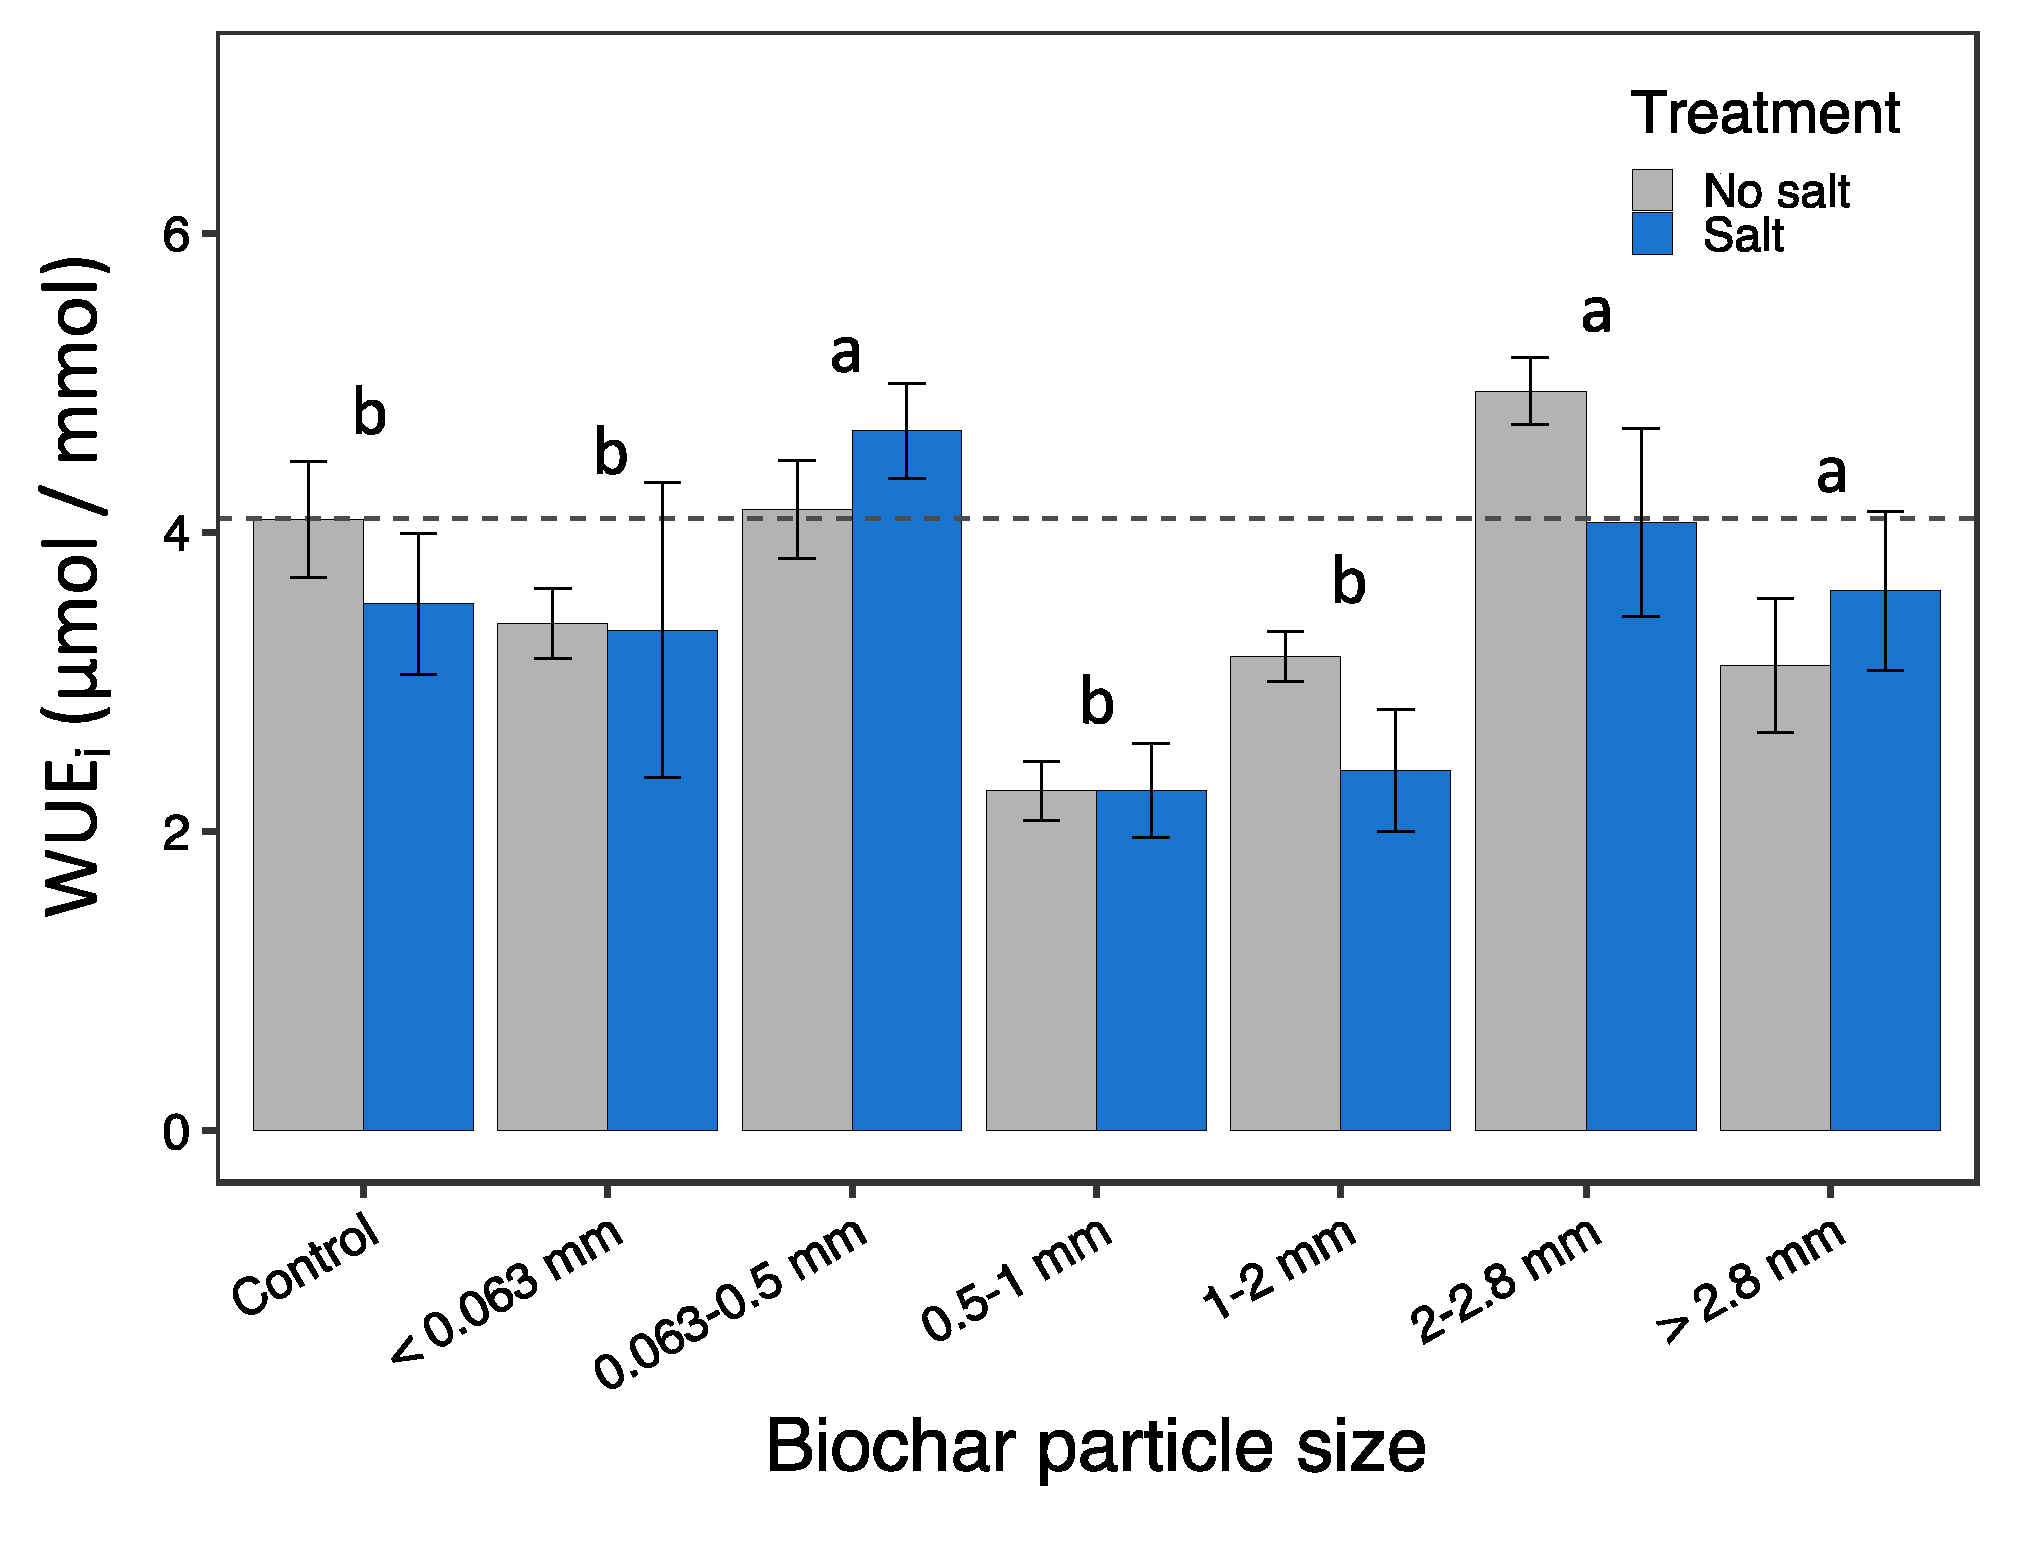
No significant biochar particle size or salt effects were observed on light-saturated photosynthesis (Amax) or stomatal conductance (gs;) (Table 2); however, leaf-level instantaneous water-use efficiency (WUEi) was significantly reduced relative to controls at intermediate biochar particles size (0.5-2 mm) (Table 2; Figure 6).

4. Discussion

Our results support the hypothesis that an optimal biochar particle size for enhancing plant growth and stress tolerance exists. Intermediate biochar particle sizes (0.5-2.0 mm) better enhanced plant growth and better mitigated salt effects than either smaller or large biochar particles. At the same application dosage (10 t/ha), the smallest biochar size (< 0.063 mm) generally suppressed plant growth, while the intermediate particle size categories (0.5-2.0 mm) generally enhanced growth relative to controls, even in the case of saline soil conditions.
Biochar particle size “benefits” have been quantified in a variety of ways, including soil biota responses [55,56], metal toxicity mitigation [57,58], and in terms of soil hydraulic properties, such as water retention capacity [40,59], and permanent wilting point [60]. Prior results on particle size effects on plant growth have been mixed in individual studies. Stem growth of Salix viminalis on a contaminated technosol was greatest at a biochar size of 0.2-0.4 mm [61], while lentil (Lens culinaris) had a reduced biomass improvement or even a decrease with particle sizes of < 2 mm compared to 5-10 mm in a silt loam agricultural soil [62]. Brassica chinensis showed no biochar particle size effects among three size categories (< 0.5 mm, 0.5-2 mm and 2-5 mm) on a contaminated yellow ferralsol [57], and Hordeum vulgare responded well to both sizes tested (< 0.15 mm or > 0.15 mm) in a commercial garden soil [42]. There is also evidence that plant growth responses to biochar particle size can vary among plant species [40]. However, a key limitation of these prior studies is that not more than three biochar particle size categories have been included, making detection of any optimum point unlikely.
Our results suggesting a clear optimum biochar size are consistent with recent meta-analyses. Thomas [38] pooled data from 23 studies (involving 112 comparisons) and concluded that a biochar particle size of 0.5-1.0 mm generally resulted in an optimal plant growth response regardless of soil type or texture. Edeh et al. [63] suggest a size <2 mm is best for sandy soil because this size category best improves soil hydrological properties. Albert et al. [58] found that a biochar size of 0.9-2 mm better reduced Pb and Cd concentrations in plants compared to a size of 2-5 mm. In all cases results are consistent in supporting an optimum biochar particle size in the range of 0.5-2 mm.
Prior work also indicates that different biochar particle sizes have distinctive physiochemical properties [39,64]. Soil bulk density increases as biochar particle size decreases in sandy, silt loam and clay soils; small particle sizes (< 0.5 mm) also generally show higher volumetric plant-available water content [65]. However, very fine biochar (< 0.063 mm) is commonly hydrophobic and alters soil structure by increasing micropore and reducing macropore volume [66]. Biochar also interacts with soil and modifies the soil pore structure, with both intrapores and interpores influencing soil hydraulic properties [66]. In the present study, scanning electron microscopy images show that the smallest size category (<0.063 mm) had a visually disrupted macropore structure (Figure 1). Only this size fraction showed visual pooling of surface water during the experiment (personal observations), consistent with low hydraulic conductivity.
NaCl is highly soluble in water, such that leaching can reduce soil salt concentrations [5]. Biochar can thus alter Na+ and Cl- concentrations by sorption as well as soil hydraulic conductivity effects, and drainage can be critical in mitigating salt effects. The soil EC for cowpea with biochar size < 0.063 mm was substantially (~200%) higher than the control (Figure 2A). A likely mechanism for this difference is that fine biochar physically fills the pore space between soil particles and decreases porosity [44], acting together with the water-repelling properties to hinder water movement and reduce ion leaching. However, elevated EC at small biochar particle sizes was not observed in the case of velvetleaf (Figure 2B). Prior studies have observed that biochar can increase EC at high application rates (e.g., [31,67,68,69]). The inconsistent effects on EC observed here may thus be due to a balance of ion sorption and ion leaching by biochars. In spite of this variability, there is a clear pattern of intermediate biochar particle sizes (in the 0.5-2.0 mm range) acting to better mitigate salt effects on plant growth (Figure 4B).
Many urban soils are alkaline, and further increases in pH induced by biochar could be problematic. Here we found only slight but detectable effects of biochar addition on soil pH in the context of a typical urban topsoil mix, with pH remaining within an optimal range (7.2-7.4). This result is consistent with the few prior studies examining biochar effects on pH of neutral to alkaline urban soils, which also report only slight liming effects [70,71,72], or no detectable effect [73], at least for low to moderate dosages.
This short-duration greenhouse experiment is unlikely to reflect long-term field conditions. The aging of biochar will likely change its hydraulic properties [74] and impact its ability to facilitate leaching in the root zone. Biochar weathers and fragments into smaller particles naturally and these small biochar fragments may be transported into deeper soil layers over time [75]. This suggests a strategy of adding biochar of particle sizes somewhat larger than optimal, which has additional advantages in terms of minimizing worker and public exposure to suspended biochar dust and minimizing wind erosion losses at the time of application. Our results suggest that very fine biochar is unsuitable for direct application, consistent with goals of avoiding potential human health [76] and environmental risks [77]. Along these lines, use of granulated or pelletized biochar products may be particularly advantageous in urban environments and similar settings [40,72]. Additional research, particularly in the form of field trials, is essential to develop workable models for optimized applications that fully realize the potential benefits of biochar use in saline soils and in an urban context.

Supplementary Materials

The following supporting information can be downloaded at the website of this paper posted on Preprints.org. original data files.

Author Contributions

Conceptualization and methodology, E.T., W.L. and S.C.T.; formal analysis, E.T. and S.C.T.; investigation, E.T.; resources, S.C.T.; data curation, E.T.; writing—original draft preparation, E.T.; writing—review and editing, W.L. and S.C.T.; visualization, E.T. and S.C.T.; supervision, project administration, and funding acquisition, S.C.T. All authors have read and agreed to the published version of the manuscript.

Funding

This research was funded by grants Canadian Natural Sciences and Engineering Research Council.

Data Availability Statement

Original data files are available as Supplementary Information.

Acknowledgments

We thank Melanie Sifton for input on biocontrol and greenhouse management. We also thank Audrey Chong for her advice and support on SEM imaging and Burt’s Greenhouse and LessMess Soil for donating the biochar and soil used, respectively.

Conflicts of Interest

The authors declare no conflict of interest. The funders had no role in the design of the study; in the collection, analyses, or interpretation of data; in the writing of the manuscript; or in the decision to publish the results.

References

  1. Li, J.; Pu, L.; Han, M.; Zhu, M.; Zhang, R.; Xiang, Y. Soil salinization research in China: advances and prospects. J Geogr Sci 2014, 24, 943–960. [Google Scholar] [CrossRef]
  2. Shahid, S.A.; Zaman, M.; Heng, L. Soil salinity: historical perspectives and a world overview of the problem. In Guideline for salinity assessment, mitigation and adaptation using nuclear and related techniques; Cham: Springer International Publishing, 2018; pp. 43–53. [Google Scholar] [CrossRef]
  3. FAO Global map of salt-affected soils; Rome, Italy. 2021. Available from: https://www.fao.org/3/cb7247en/cb7247en.pdf.
  4. Hillel, D. Salinity management for sustainable irrigation: integrating science, environment, and economics; World Bank Publications, 2000; p. 102. [Google Scholar] [CrossRef]
  5. Bohn, H.; McNeal, B.; O’Conner, G. Soil chemistry; Wiley: New York, USA, 1985; pp. 217–246. [Google Scholar]
  6. Li, Z.; Liang, Y.; Zhou, J.; Sun, X. Impacts of de-icing salt pollution on urban road greenspace: a case study of Beijing. Front Environ Sci Eng 2014, 8, 747–756. [Google Scholar] [CrossRef]
  7. Kaushal, S.S. Increased salinization decreases safe drinking water. Environ Sci Technol 2016, 50, 2765–2766. [Google Scholar] [CrossRef]
  8. Corsi, S.R.; Graczyk, D.J.; Geis, S.W.; Booth, N.L.; Richards, K.D. A fresh look at road salt: aquatic toxicity and water-quality impacts on local, regional, and national scales. Environ Sci Technol 2010, 44, 7376–7382. [Google Scholar] [CrossRef]
  9. Shannon, T.P.; Ahler, S.J.; Mathers, A.; Ziter, C.D.; Dugan, H.A. Road salt impact on soil electrical conductivity across an urban landscape. J Urban Ecol 2020, 6, juaa006. [Google Scholar] [CrossRef]
  10. Williams, D.D.; Williams, N.E.; Cao, Y. Road salt contamination of groundwater in a major metropolitan area and development of a biological index to monitor its impact. Water Res 2000, 34, 127–138. [Google Scholar] [CrossRef]
  11. Jamshidi, A.; Goodarzi, A.R.; Razmara, P. Long-term impacts of road salt application on the groundwater contamination in urban environments. Environ Sci Pollut Res 2020, 27, 30162–30177. [Google Scholar] [CrossRef] [PubMed]
  12. Green, S.M.; Machin, R.; Cresser, M.S. Effect of long-term changes in soil chemistry induced by road salt applications on N-transformations in roadside soils. Environ Pollut 2008, 152, 20–31. [Google Scholar] [CrossRef] [PubMed]
  13. Van Meter, R.J.; Swan, C.M.; Leips, J.; Snodgrass, J.W. Road salt stress induces novel food web structure and interactions. Wetlands 2011, 31, 843–851. [Google Scholar] [CrossRef]
  14. Tiwari, A.; Rachlin, J.W. A review of road salt ecological impacts. Northeast Nat 2018, 25, 123–142. [Google Scholar] [CrossRef]
  15. Miklovic, S.; Galatowitsch, S.M. Effect of NaCl and Typha angustifolia L. on marsh community establishment: a greenhouse study. Wetlands 2005, 25, 420–429. [Google Scholar] [CrossRef]
  16. Mineau, P.; Brownlee, L.J. Road salts and birds: an assessment of the risk with particular emphasis on winter finch mortality. Wildl Soc Bull 2005, 33, 835–841. [Google Scholar] [CrossRef]
  17. Dirr, M. Selection of trees for tolerance to salt injury. Arboric Urban For 1976, 2, 209–216. https://www.nswooa.ca/uploads/5/9/6/9/59690537/salt-tolerant-trees.pdf. [CrossRef]
  18. Geilfus, C. Chloride: from nutrient to toxicant. Plant Cell Physiol 2018, 59, 877–886. [Google Scholar] [CrossRef] [PubMed]
  19. Dmuchowski, W.; Baczewska-Dąbrowska, A.; Gozdowski, D.; Brągoszewska, P.; Gworek, B.; Suwara, I.; Chojnaki, T.; Jóźwiak, A.; Swiezewska, E. Effect of salt stress in urban conditions on two Acer species with different sensitivity. PeerJ 2021, 9, e10577. [Google Scholar] [CrossRef] [PubMed]
  20. Tavakkoli, E.; Rengasamy, P.; McDonald, G.K. High concentrations of Na+ and Cl ions in soil solution have simultaneous detrimental effects on growth of faba bean under salinity stress. J Exp Bot 2010, 61, 4449–4459. [Google Scholar] [CrossRef]
  21. Terry, L.G.; Conaway, K.; Rebar, J.; Graettinger, A.J. Alternative deicers for winter road maintenance—a review. Water Air Soil Pollut 2020, 231, 394. [Google Scholar] [CrossRef]
  22. Lehmann, J.; Joseph, S. Biochar for Environmental Management: Science, Technology and Implementation; Routledge: Oxon, USA, 2015; https://www.taylorfrancis.com/books/9781134489534.
  23. Atkinson, C.J.; Fitzgerald, J.D.; Hipps, N.A. Potential mechanisms for achieving agricultural benefits from biochar application to temperate soils: a review. Plant Soil 2010, 337, 1–18. [Google Scholar] [CrossRef]
  24. Liu, X.; Zhang, A.; Ji, C.; Joseph, S.; Bian, R.; Li, L.; Pan, G.; Paz-Ferreiro, J. Biochar’s effect on crop productivity and the dependence on experimental conditions—a meta-analysis of literature data. Plant Soil 2013, 373, 583–594. [Google Scholar] [CrossRef]
  25. Woolf, D.; Amonette, J.E.; Street-Perrott, F.A.; Lehmann, J.; Joseph, S. Sustainable biochar to mitigate global climate change. Nat Commun 2010, 1, 56. [Google Scholar] [CrossRef]
  26. Smith, P. Soil carbon sequestration and biochar as negative emission technologies. Glob Change Biol 2016, 22, 1315–1324. [Google Scholar] [CrossRef] [PubMed]
  27. Thomas, S.C.; Gale, N. Biochar and forest restoration: a review and meta-analysis of tree growth responses. New For 2015, 46, 931–946. [Google Scholar] [CrossRef]
  28. Inyang, M.; Dickenson, E. The potential role of biochar in the removal of organic and microbial contaminants from potable and reuse water: A review. Chemosphere 2015, 134, 232–240. [Google Scholar] [CrossRef] [PubMed]
  29. Zhang, X.; Wang, H.; He, L.; Lu, K.; Sarmah, A.; Li, J.; Bolan, N.S.; Pei, J.; Huang, H. Using biochar for remediation of soils contaminated with heavy metals and organic pollutants. Environ Sci Pollut Res 2013, 20, 8472–8483. [Google Scholar] [CrossRef] [PubMed]
  30. O’Connor, D.; Peng, T.; Zhang, J.; Tsang, D.C.W.; Alessi, D.S.; Shen, Z.; Bolan, N.S.; Hou, D. Biochar application for the remediation of heavy metal polluted land: a review of in situ field trials. Sci Total Environ 2018, 619–620, 815–826. [Google Scholar] [CrossRef]
  31. Thomas, S.C.; Frye, S.; Gale, N.; Garmon, M.; Launchbury, R.; Machado, N.; Melamed, S.; Murray, J.; Petroff, A. Biochar mitigates negative effects of salt additions on two herbaceous plant species. J Environ Manage 2013, 129, 62–68. [Google Scholar] [CrossRef]
  32. Gunarathne, V.; Senadeera, A.; Gunarathne, U.; Biswas, J.K.; Almaroai, Y.A.; Vithanage, M. Potential of biochar and organic amendments for reclamation of coastal acidic-salt affected soil. Biochar 2020, 2, 107–120. [Google Scholar] [CrossRef]
  33. Akhtar, S.S.; Andersen, M.N.; Liu, F. Biochar mitigates salinity stress in potato. J Agron Crop Sci 2015, 201, 368–378. [Google Scholar] [CrossRef]
  34. Akhtar, S.S.; Andersen, M.N.; Liu, F. Residual effects of biochar on improving growth, physiology and yield of wheat under salt stress. Agric Water Manag 2015, 158, 61–68. [Google Scholar] [CrossRef]
  35. Liang, B.; Lehmann, J.; Solomon, D.; Kinyangi, J.; Grossman, J.; O’Neill, B.; Skjemstad, J.O.; Luizão, F.J.; Petersen, J.; Naves, F.G. Black carbon increases cation exchange capacity in soils. Soil Sci Soc Am J 2006, 70, 1719–1730. [Google Scholar] [CrossRef]
  36. Karhu, K.; Mattila, T.; Bergström, I.; Regina, K. Biochar addition to agricultural soil increased CH4 uptake and water holding capacity – results from a short-term pilot field study. Agric Ecosyst Environ. 2011, 140, 309–313. [Google Scholar] [CrossRef]
  37. Ippolito, J.A.; Cui, L.; Kammann, C.; Wrage-Mönnig, N.; Estavillo, J.M.; Fuertes-Mendizabal, T.; Cayuela, M.L.; Sigua, G.; Novak, J.; Spokas, K. Feedstock choice, pyrolysis temperature and type influence biochar characteristics: a comprehensive meta-data analysis review. Biochar 2020, 2, 421–438. [Google Scholar] [CrossRef]
  38. Thomas, S.C. Post-processing of biochars to enhance plant growth responses: a review and meta-analysis. Biochar 2021, 3, 437–455. [Google Scholar] [CrossRef]
  39. Sangani, M.; Abrishamkesh, S.; Owens, G. Physicochemical characteristics of biochars can be beneficially manipulated using post-pyrolyzed particle size modification. Bioresour Technol 2020, 306, 123157. [Google Scholar] [CrossRef]
  40. Liao, W.; Thomas, S.C. Biochar particle size and post-pyrolysis mechanical processing affect soil pH, water retention capacity, and plant performance. Soil Syst 2019, 3, 14. [Google Scholar] [CrossRef]
  41. Gale, N.V.; Sackett, T.E.; Thomas, S.C. Thermal treatment and leaching of biochar alleviates plant growth inhibition from mobile organic compounds. PeerJ 2016, 4, e2385. [Google Scholar] [CrossRef] [PubMed]
  42. Blatt-Janmaat, K.L.; MacQuarrie, S.L.; Sit, C.S. Does size matter? An investigation into the impact of coarse and fine ground inoculated biochar on Hordeum vulgare (barley) growth and yield. Rhizosphere 2020, 13, 100184. [Google Scholar] [CrossRef]
  43. Lim, T.J.; Spokas, K.A.; Feyereisen, G.W.; Weis, R.; Koskinen, W.C. Influence of biochar particle size and shape on soil hydraulic properties. J Environ Sci Eng Technol 2017, 5, 8–15. https://www.ars.usda.gov/ARSUserFiles/39868/Updates/2017_Lim_InfluenceofBiochar.pdf. [CrossRef]
  44. Liu, Z.; Dugan, B.; Masiello, C.A.; Gonnermann, H.M. Biochar particle size, shape, and porosity act together to influence soil water properties. PLoSone 2017, 12, e0179079. [Google Scholar] [CrossRef]
  45. Ehlers, J.D.; Hall, A.E. Cowpea (Vigna unguiculata L. Walp.). Field Crops Res 1997, 53, 187–204. [Google Scholar] [CrossRef]
  46. Spencer, N.R. Velvetleaf, Abutilon theophrasti (malvaceae), history and economic impact in the United States. Econ Bot 1984, 38, 407–16. [Google Scholar] [CrossRef]
  47. Denyes, M.; Matovic, D.; Zeeb, B.; Rutter, A. Report on the production and characterization of biochar produced at Burt’s Greenhouses (Odessa, ON, Canada). 2013. http://burtsgh.com/wpr/wp-content/uploads/2013/12/Report_on_the_Production_and_Characterization_Biochar_Produced_at_BurtsGreenhouses_Final_O1.pdf.
  48. Gale, N.V.; Thomas, S.C. Dose-dependence of growth and ecophysiological responses of plants to biochar. Sci Total Environ 2019, 658, 1344–1354. [Google Scholar] [CrossRef] [PubMed]
  49. Kuttner, B.G.; Thomas, S.C. Interactive effects of biochar and an organic dust suppressant for revegetation and erosion control with herbaceous seed mixtures and willow cuttings: biochar, erosion control, and revegetation. Restor Ecol 2017, 25, 367–375. [Google Scholar] [CrossRef]
  50. Williams, J.M.; Thomas, S.C. Effects of high-carbon wood ash biochar on volunteer vegetation establishment and community composition on metal mine tailings. Restor Ecol 2023, e13861. [Google Scholar] [CrossRef]
  51. ASTM D1762-84; ASTM Standard test method for chemical analysis of wood charcoal. ASTM International: West Conshohocken, PA, 2007.
  52. Scott, A.J.; Knott, M. A cluster analysis method for grouping means in the analysis of variance. Biometrics 1974, 30, 507. [Google Scholar] [CrossRef]
  53. Jelihovschi, E.; Faria, J.C.; Allaman, I.B. ScottKnott: A package for performing the Scott-Knott clustering algorithm in R. TEMA São Carlos 2014, 15, 003. [Google Scholar] [CrossRef]
  54. Viechtbauer, W. Conducting meta-analyses in R with the metafor Package. J Stat Softw 2010, 36, 3. [Google Scholar] [CrossRef]
  55. Prodana M, Silva C, Gravato C, Verheijen FGA, Keizer JJ, Soares AMVM, Loureriro S, Bastos AC. Influence of biochar particle size on biota responses. Ecotoxicol Environ Saf 2019, 174, 120–128. [Google Scholar] [CrossRef]
  56. He, M.; Xiong, X.; Wang, L.; Hou, D.; Bolan, N.S.; Ok, Y.S.; Rinklebe, J.; Tsang, D.C.W. A critical review on performance indicators for evaluating soil biota and soil health of biochar-amended soils. J Hazard Mater 2021, 414, 125378. [Google Scholar] [CrossRef]
  57. Zheng, R.; Li, C.; Sun, G.; Xie, Z.; Chen, J.; Wu, J.; Wang, Q. The influence of particle size and feedstock of biochar on the accumulation of Cd, Zn, Pb, and As by Brassica chinensis L. Environ Sci Pollut Res 2017, 24, 22340–22352. [Google Scholar] [CrossRef]
  58. Albert, H.A.; Li, X.; Jeyakumar, P.; Wei, L.; Huang, L.; Huang, Q.; Kamran, M.; Shaheen, S.M.; Hou, D.; Rinklebe, J.; Lin, Z.; Wang, H. Influence of biochar and soil properties on soil and plant tissue concentrations of Cd and Pb: a meta-analysis. Sci Total Environ 2021, 755, 142582. [Google Scholar] [CrossRef] [PubMed]
  59. de Jesus Duarte, S.; Glaser, B.; Pellegrino Cerri, C. Effect of biochar particle size on physical, hydrological and chemical properties of loamy and sandy tropical soils. Agronomy 2019, 9, 165. [Google Scholar] [CrossRef]
  60. Werdin, J.; Conn, R.; Fletcher, T.D.; Rayner, J.P.; Williams, N.S.G.; Farrell, C. Biochar particle size and amendment rate are more important for water retention and weight of green roof substrates than differences in feedstock type. Ecol Eng 2021, 171, 106391. [Google Scholar] [CrossRef]
  61. Lebrun, M.; Miard, F.; Nandillon, R.; Hattab-Hambli, N.; Scippa, G.S.; Bourgerie, S.; Morabito, D. Eco-restoration of a mine technosol according to biochar particle size and dose application: study of soil physico-chemical properties and phytostabilization capacities of Salix viminalis. J Soils Sediments 2018, 18, 2188–2202. [Google Scholar] [CrossRef]
  62. Billah, M.M.; Ahmad, W.; Ali, M. Biochar particle size and Rhizobia strains effect on the uptake and efficiency of nitrogen in lentils. J Plant Nutr 2019, 42, 1709–1725. [Google Scholar] [CrossRef]
  63. Edeh, I.G.; Mašek, O.; Buss, W. A meta-analysis on biochar’s effects on soil water properties – new insights and future research challenges. Sci Total Environ 2020, 714, 136857. [Google Scholar] [CrossRef]
  64. He, P.; Liu, Y.; Shao, L.; Zhang, H.; Lü, F. Particle size dependence of the physicochemical properties of biochar. Chemosphere 2018, 212, 385–392. [Google Scholar] [CrossRef]
  65. Zhang, J.; Amonette, J.E.; Flury, M. Effect of biochar and biochar particle size on plant-available water of sand, silt loam, and clay soil. Soil Tillage Res 2021, 212, 104992. [Google Scholar] [CrossRef]
  66. Edeh, I.G.; Mašek, O. The role of biochar particle size and hydrophobicity in improving soil hydraulic properties. Eur J Soil Sci 2022, 73, e13138. [Google Scholar] [CrossRef]
  67. Wu, Y.; Xu, G.; Shao, H.B. Furfural and its biochar improve the general properties of a saline soil. Solid Earth 2014, 5, 665–671. [Google Scholar] [CrossRef]
  68. Abbas, T.; Rizwan, M.; Ali, S.; Adrees, M.; Zia-ur-Rehman, M.; Qayyum, M.F.; Ok, Y.S.; Murtaza, G. Effect of biochar on alleviation of cadmium toxicity in wheat (Triticum aestivum L.) grown on Cd-contaminated saline soil. Environ Sci Pollut Res 2018, 25, 25668–25680. [Google Scholar] [CrossRef] [PubMed]
  69. She, D.; Sun, X.; Gamareldawla, A.H.D.; Nazar, E.A.; Hu, W.; Edith, K.; Yu, S. Benefits of soil biochar amendments to tomato growth under saline water irrigation. Sci Rep 2018, 8, 14743. [Google Scholar] [CrossRef] [PubMed]
  70. Kargar, M.; Clark, O.G.; Hendershot, W.H.; Jutras, P.; Prasher, S.O. Immobilization of trace metals in contaminated urban soil amended with compost and biochar. Water Air Soil Pollut 2015, 226, 191. [Google Scholar] [CrossRef]
  71. Shen, Y.; Song, S.; Thian, B.W.Y.; Fong, S.L.; Ee, A.W.L.; Arora, S.; Ghosh, S.; Li, S.F.Y.; Tan, H.T.W.; Dai, Y.; Wang, C. Impacts of biochar concentration on the growth performance of a leafy vegetable in a tropical city and its global warming potential. J Clean Prod 2020, 264, 121678. [Google Scholar] [CrossRef]
  72. Sifton, M.A.; Lim, P.; Smith, S.M.; Thomas, S.C. Interactive effects of biochar and N-fixing companion plants on growth and physiology of Acer saccharinum. Urban For Urban Green 2022, 74, 127652. [Google Scholar] [CrossRef]
  73. Scharenbroch, B.C.; Meza, E.N.; Catania, M.; Fite, K. Biochar and biosolids increase tree growth and improve soil quality for urban landscapes. J Environ Qual 2013, 42, 1372–1385. [Google Scholar] [CrossRef] [PubMed]
  74. Joseph, S.; Cowie, A.L.; Van Zwieten, L.; Bolan, N.; Budai, A.; Buss, W.; Cayuela, M.L.; Grber, E.R.; Ippolito, J.A.; Kuzyakov, Y.; Luo, Y.; Ok, Y.S.; Palansooriya, K.N.; Shephard, J.; Stephens, S.; Weng, Z.; Lehmann, J. How biochar works, and when it doesn’t: a review of mechanisms controlling soil and plant responses to biochar. GCB Bioenergy 2021, 13, 1731–1764. [Google Scholar] [CrossRef]
  75. Rumpel, C.; Leifeld, F.; Santin, C.; Doerr, S. Movement of biochar in the environment. In Biochar for environmental management science, technology and implementation; Routledge: Oxon, USA, 2015; pp. 283–299. [Google Scholar]
  76. Gelardi, D.L.; Li, C.; Parikh, S.J. An emerging environmental concern: biochar-induced dust emissions and their potentially toxic properties. Sci Total Environ 2019, 678, 813–820. [Google Scholar] [CrossRef]
  77. Ravi, S.; Sharratt, B.S.; Li, J.; Olshevski, S.; Meng, Z.; Zhang, J. Particulate matter emissions from biochar-amended soils as a potential tradeoff to the negative emission potential. Sci Rep 2016, 6, 35984. [Google Scholar] [CrossRef]
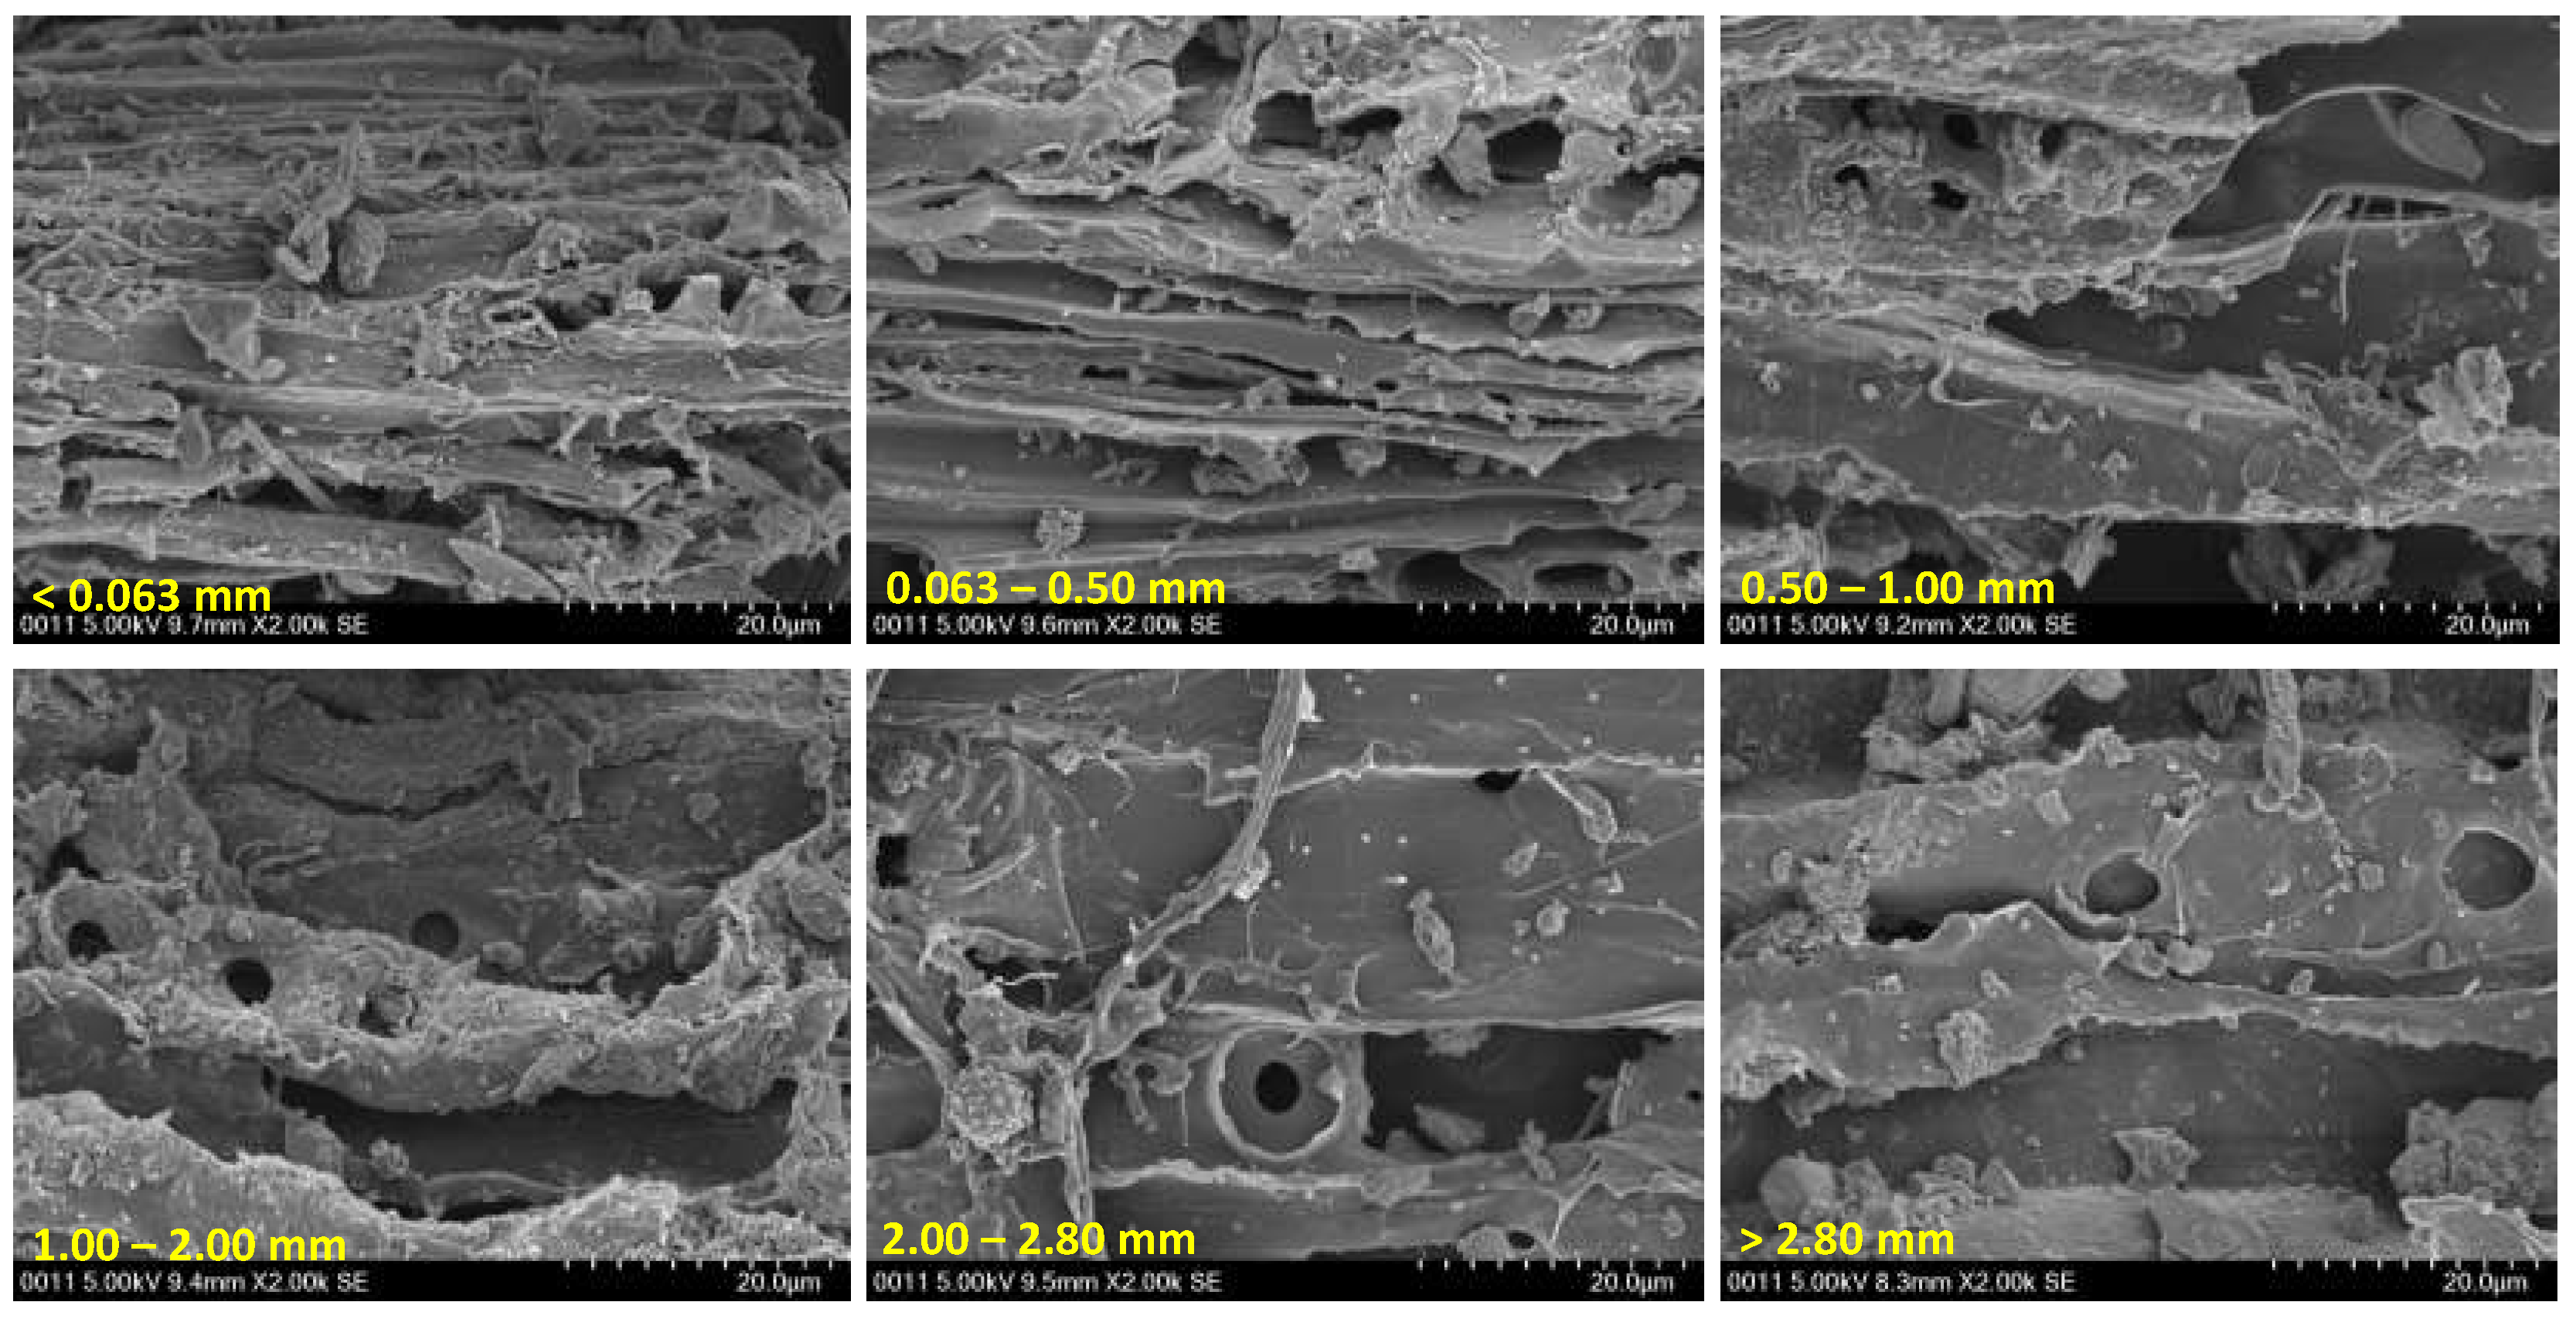
Figure 1. Representative SEM images of biochar by particle size fraction.
Preprints 71048 g001
Figure 2. Biochar particle size and salt addition effects on soil EC in cowpea (A) and velvetleaf (B). Means are plotted ±1 SE. The dashed line in each panel indicates the control with no salt. ANOVA results indicate significant salt effects in both cases, and a significant biochar particle size effect in the case of cowpea (Table 2). Letters indicate differences among biochar particle size treatments (p < 0.05) according to Scott-Knott post-hoc test clustering algorithm. Asterisks indicate significance of salt treatments within a biochar particle size class: *, p < 0.05 and **, p < 0.01.
Preprints 71048 g002
Figure 3. Biochar particle size and salt addition effects on biomass production at harvest (at 67 days) in cowpea (A) and velvetleaf (B). Means are plotted ±1 SE. ANOVA results indicate significant biochar particle size effects in both cases (Table 2). The dashed line in each panel indicates the control with no salt. Letters indicate differences among biochar particle size treatments (p < 0.05) according to Scott-Knott post-hoc test clustering algorithm.
Preprints 71048 g003
Figure 4. Meta-analyses (combining results for both species) of total plant biomass responses to biochar(A) and plant biomass responses to salt addition (B) in relation to biochar particle size. Response ratio metrics are plotted ± 95% confidence limits; polynomial response curves are shown fitted using meta-regression analysis with biochar particle size categories treated as nominal ranked categories. Percent changes indicated are back-transformed from the log response ratio statistic.
Preprints 71048 g004
Figure 5. Biochar particle size and salt addition effects on leaf chlorophyll concentration index (CCI) (A), and chlorophyll fluorescence (Fv/Fm) (B) in cowpea evaluated prior to harvest. Means are plotted ±1 SE. ANOVA results indicate significant biochar particle size and salt effects for Fv/Fm but not CCI (Table 2). The dashed line in each panel indicates the control with no salt. Letters indicate differences among biochar particle size treatments (p < 0.05) according to Scott-Knott post-hoc test clustering algorithm.
Preprints 71048 g005
Figure 6. Biochar particle size and salt addition effects on instantaneous water-use efficiency (WUEi) of cowpea measured using photosynthetic gas-exchange. The dashed line in each panel indicates the control with no salt. Letters indicate differences among biochar particle size treatments (p < 0.05) according to Scott-Knott post-hoc test clustering algorithm.
Preprints 71048 g006
Table 1. Selected physicochemical properties of biochar by particle size fraction and of the soil used. Standard errors are given in brackets (for triplicate measurements where available).
Biochar size (mm)
Size category: 0 1 2 3 4 5
Attribute < 0.063 0.063-0.50 0.50-1.00 1.00-2.00 2.00-2.80 > 2.8 Soil
pH 9.1 (0.04) 9.0 (0.03) 9.0 (0.01) 9.0 (0.02) 9.2 (0.02) 9.5 (0.05) 7.5
EC (mS/cm) 1.70 (0.01) 1.47 (0.03) 1.21 (0.02) 0.83 (0.00) 0.96 (0.06) 0.89 (0.04) 1.00 (0.04)
Bulk density (g/cm3) 0.31 (0.01) 0.25 (0.01) 0.17 (0.01) 0.14 (0.00) 0.11 (0.00) 0.12 (0.00) 0.44 (0.01)
Tap density (g/cm3) 0.38 (0.01) 0.33 (0.01) 0.20 (0.00) 0.15 (0.01) 0.13 (0.00) 0.14 (0.01) 0.49 (0.03)
Compression ratio 1.23 (0.08) 1.33 (0.04) 1.17 (0.03) 1.07 (0.01) 1.23 (0.04) 1.23 (0.01) 1.13 (0.04)
Table 2. ANOVA results for greenhouse experiment examining effects of biochar particle size and salt additions on soil properties and plant performance. Numerator degrees of freedom are 6 for biochar effects, 1 for salt effects, and 6 for the biochar x salt interaction, with 83 degrees of freedom for the denominator. Values for p < 0.05 are given in bold. Significance of the biochar size effect in an ANOVA omitting the control (no biochar) treatment is also indicated: *: p<0.05; **: p<0.01; ***: p<0.001.
Biochar size Salt Size x Salt Scott-Knott clusters*
Attribute F p F p F p (for biochar size)
Cowpea
Soil pH 5.63 <0.001*** 0.09 0.760 1.09 0.370 (c,1,3) (0,2,4,5)
Soil EC (µS/cm) 2.84 0.015 7.06 0.009 1.69 0.134 (c,1,2) (0,3,4,5)
Early leaf area (cm2) 3.11 0.004** 0.22 0.612 2.83 0.015 (c,0,1,2) (3,4,5)
Total biomass (g) 3.03 0.010** 0.02 0.871 1.84 0.101 (0,1) (c,2-5)
Aboveground biomass (g) 3.07 0.009** 0.01 0.918 1.49 0.191 (0,1) (c,2-5)
Belowground biomass (g) 2.62 0.022* 0.52 0.471 2.56 0.025 (0,1,5) (c,2-4)
Root fraction 2.47 0.030* 0.93 0.337 1.22 0.306 (5) (c,0-4)
Final leaf area (cm2) 1.46 0.204 0.00 0.978 0.87 0.522 -
LMA (g/cm2) 1.32 0.255 1.03 0.313 1.14 0.348 -
CCI 1.67 0.140 0.46 0.499 1.46 0.201 -
Fv/Fm 2.52 0.027 7.49 0.008 1.25 0.289 (c,1) (0,2-5)
Amax (µmol m-2 s-1) 0.29 0.939 0.59 0.445 0.235 0.964 -
gs (mmol m-2 s-1) 0.55 0.772 0.19 0.667 0.56 0.758 -
WUEi 2.87 0.015 1.72 0.194 0.47 0.827 (c,0,2,3) (1,4,5)
Velvetleaf
Soil pH 2.61 0.027* 1.64 0.203 1.11 0.364 (c,1,4,5) (0,2,3)
Soil EC (µS/cm) 1.28 0.275 14.95 <0.001 0.59 0.740 -
Early leaf area (cm2) 1.04 0.408 0.29 0.593 0.67 0.672 -
Total biomass (g) 3.89 0.002** 0.29 0.591 0.60 0.727 (c,0,1,4,5) (2,3)
Aboveground biomass (g) 3.97 0.002** 0.26 0.610 0.60 0.730 (c,0,1,4,5) (2,3)
Belowground biomass (g) 3.44 0.004** 0.36 0.548 0.62 0.714 (c,0,1,4,5) (2,3)
Root fraction 3.81 0.002** 0.745 0.391 0.67 0.676 (1-5) (c,0)
Final leaf area (cm2) 3.15 0.008** 2.19 0.143 0.73 0.627 (c,0,1,4,5) (2,3)
LMA (g/cm2) 1.83 0.103 1.57 0.214 1.59 0.161 -
* Clusters among biochar particle size treatments as determined by the Scott-Knott algorithm for post-hoc tests at p < 0.05, listed in ascending order (c: control; 0: <0.063 mm; 1: 0.063-0.5 mm; 2: 0.5-1 mm; 3: 1-2 mm; 4: 2-2.8 mm; 5: >2.8 mm).
Disclaimer/Publisher’s Note: The statements, opinions and data contained in all publications are solely those of the individual author(s) and contributor(s) and not of MDPI and/or the editor(s). MDPI and/or the editor(s) disclaim responsibility for any injury to people or property resulting from any ideas, methods, instructions or products referred to in the content.
Copyright: This open access article is published under a Creative Commons CC BY 4.0 license, which permit the free download, distribution, and reuse, provided that the author and preprint are cited in any reuse.
Prerpints.org logo

Preprints.org is a free preprint server supported by MDPI in Basel, Switzerland.

Subscribe

© 2024 MDPI (Basel, Switzerland) unless otherwise stated