1. Introduction
Motivated by the demands for clean energy in the context of ongoing climate change, offshore wind farms (OWFs) grow rapidly in lots of coastal countries. [
1]. The present development shows the advantages of offshore wind farms, for example, delivering secure, affordable, and clean energy while fostering industrial development and job creation. Based on the annual report from the Global Wind Energy Council, 2021 becomes the best year in the offshore wind industry, in which 21.1GW of offshore wind capacity was commissioned, bringing global offshore wind capacity reach to 56 GW, three times more than in 2020. GWEC Market Intelligence forecasts that 260 GW of new offshore wind capacity could be added in 2022-2030 under the current positive policies, bringing total global offshore wind installations to grow from 23% in 2021 to at least 30% by 2031. In the year 2021, China constructed 80% of new offshore installations worldwide becoming the world’s largest offshore market [
2].
However, this trend of increasing numbers of offshore wind farms puts pressure on local water traffic management. For example, the newly added obstacles increase difficulties of navigation for passing vessels [
3] and improve the difficulties of Search and Rescue (SAR). Once an accident happens, it results in water pollution, significant damage of facilities and other catastrophic causalities and economic losses. In 2021 year, the Global Offshore Wind Health & Safety Organisation (G+) report pointed out there were a total of 204 high-potential incidents and injuries recorded [
4]. Recently, some collision accidents were also reported in the UK, China, and the Netherlands, leading to shipping hull and turbine damage, and electric power loss, especially for construction and fishing ships. For instance, On January 31, 2021, the drifting bulk carrier Julietta D collied a transformer platform in the Hollandse Kust Zuid wind farm, which is under construction period. On July 2, 2022, a dragging accident in southern waters leads to 25 causalities and a vessel sunk. Thereby, monitoring vessels in the offshore wind farm waters and detecting potential hazards becomes an urgent question for stakeholders of offshore wind farms.
The current monitoring system for water traffic is Vessel Traffic Services (VTS), which uses Automatic Identification System (AIS), radar and other detection sensors to show the water traffic situation dynamically. The VTS has been studied on the topic of technology developing, information collection, communication, and system design. However, its limitations of using in offshore wind farms waters are noted due to trespasses and turning off the AIS deliberately. Developing a reliable monitoring system can aid the safety of navigation of passing vessels, as well as in offshore wind farms. In the previous studies, several novel methodologies have been proposed to develop a reliable monitoring model. This might include other maritime activities in different waters. For instance, Priakanth
et al. proposed a hybrid system by using wireless and IoT technology to avoid boundary invasions [
5]. Ouelmokhtar
et al. suggest using Unmanned Surface Vehicles (USV) to monitor waters, in which an on-board LiDAR is used to detect the targets. [
6]. Nyman discussed the possibility of using satellites to monitor, which allows for the visual surveillance of a large area [
7]. The relatively low cost of data acquisition makes the use of satellites appealing. But some prior theory or knowledge is needed to sort through the vast collection of satellite data and images. Although these studies show their advantages, these technologies may typically focus on large waters, increasing the financial burden for offshore wind farms. Thereby, low-cost, high efficiency and reliable systems are still needed. As a low cost of equipment, video surveillance technologies become a possible way to monitor the water traffic at a close distance. However, original video surveillance requires human supervision to achieve continuous monitoring, consuming a large number of human resources. Moreover, the challenges that the offshore wind farm operators and managers face within the settings and high workload of their daily work leads to error-prone and tedious. Nowadays, automated surveillance systems observing the environment utilizing cameras are widely used. These automatic systems can accomplish a multitude of tasks which include, detection, interpretation, understanding, recording, and creating alarms based on the analysis. They are widely used in different areas, for instance, in road traffic, Pawar and Attar get detection and localization of road accidents from traffic surveillance videos [
8]. Vieira
et al. and Thallinger
et al. quantitatively evaluate the safety of traffic by the application of utilization of security cameras [
1,
9]. A video surveillance-based system that can detect the pre-events, with an automatic alarm generated in the control room was proposed for improving road safety [
10].
Motivated by the above-mentioned difficulties and superiorities, this study aims to pioneer the use of machine vision technologies to aid traffic monitoring in offshore wind farm waters. Specifically, a vision-based monitoring system is developed for OWFs to improve the reliability and efficiency of ship traffic detection and tracking. The system trains a “YOLOv3” machine visual model using automatic identification system (AIS) data. The fine-trained model can identify the passing ship in OWF waters, not only provide the identified target, but also the degree of confidence during the monitoring process. Then a stereo vision algorithm is applied in the model to locate and track positions of the passing ships. So that the dynamic information (e.g., speed, course and position) for each target can be provided by the system. In addition, the proposed system is validated by comparing the provided dynamic information with AIS data to ensure the reliability of the results. The contributions of this work are highlighted as follows. The study pioneers the uses of machine visual to aid traffic monitoring in the offshore wind farm waters, covers the gap for current VTS system and provide a novel way for offshore water traffic management. In addition, the model can prove more efficient and reliable dynamic data for individual and overall traffic, so that can be expanded for ship risk early warning and accident prevent. The main contributions of this work are summarized as follows:
(1) The performance of three state-of-the-art attention modules for ship detection with YOLOv3 is evaluated in offshore wind farm water to aid traffic monitoring, demonstrates its superiorities of accuracy and high update frequency for ship position tracking.
(2) An optimization strategy for training visual based identification model is presented. The study collects hybrid data sources (e.g., AIS data, images) to develop the model training database, and validated the model by comparing the positions between AIS data and detecting results. So that ensures the performance of continuous target detection targets with significant accuracy.
(3) The proposed target identification system is further tested in an offshore case. By using an embedded device, the inference time reached real-time performance (less than 0.1 s) and the overall processing time for one frame 0.76s, proves it possibility of implications in real-time ship traffic monitoring.
The remainder of this paper is organized as follows:
Section 2 outlines a review of related research. In
Section 3, the framework of the system is introduced in detail. The experimental data and the test results are reported in
Section 4. The obtained results are discussed in
Section 5. Finally, conclusions are draw in
Section 6.
2. Literature review
This study can be categorized into three groups based on the method of the studies: the ship monitoring, machine vision in target detections and machine vision in target tracking respectively.
2.1. Ship monitoring technology
Implemented to promote safe and efficient marine traffic, VTS are typically the widely used technology for ship supervision. It is a shoreside service within a country’s territorial waters by detecting and tracking the ship, aiming to monitor the traffic, assist the traffic control and manage in navigational matters, provide support, and required information for passing ships. The VTS collects the dynamic data via two sensors, the radar and AIS. However, both have their limitations. For instance, the radar echo can be interfered under an environment with external noise of RF interference and clutter, which create potentially dangerous situations and decrease VTS functionality. In this matter, Root proposed high-frequency radar ship detection through the form of clutter elimination [
11]. Dzvonkovskaya
et al. pioneered a new detection algorithm in ship detection and tracking but ignored the external influences position [
12]. Another question is the limitations of detecting small ships in the coastal waters (e.g., offshore wind farm water). For this point of view, Margarit
et al. proposes a ship operation monitoring system based on SAR image processing to achieve inferred ship monitoring and classification information, which to further improve the SAR from the new sensor data [
13]. Moreover, radar is unable to provide sufficient static information such as ship type and size, which means other systems (e.g. AIS) are need. AIS is another important piece of information for ship monitoring, which can compensate for the shortages of radar. It achieves the automatic exchange of ship information and navigation status between ships and shore. As a type of reliable data source, AIS data has been widely used in lots of studies to analyze the ship traffic, makes it important for water traffic management. For instance, Brekke
et al. combined AIS data with satellite SAR images to detect ship dynamic information (e.g., speed, course) [
14]. To improve the reliability of radar, Stateczny collects sets of data from AIS and radar, then applies numerical model to compare the covariance between two types of data [
15]. Pan and Deng propose a real-time monitoring system for shore-based ships traffic monitoring [
16]. Although the AIS data are valuable for ship traffic management, several questions are remaining. For instance, the AIS can be closed manually. AIS is not mandatory for some small ships such as dinghies and fishing boats [
17].
In coastal waters, the offshore wind farm is relative new installations that influencing the existing ship traffics, not only occupied the navigable waters, but also creating blind areas by sheltering the radio signals, reducing the ability of detecting and tracking small targets. Relevant studies using traditional data sources (e.g., AIS, radar) including Yu
et, al. use AIS to analyse the characteristics of the ship traffic in the vicinity of the offshore wind farms [
18] and then developed models to assess the risk for individual ship [
19] or for the ship traffic flows [
20].With the development of the information technologies, which is capable of meeting the current needs for ship detection and tracking in offshore wind farms, new vision-based technologies are constantly being applied to enhance the maritime target detection, making video based monitoring becomes a viable way for maritime target identification and tracking. For instance, to overcome the difficulty of remote ship control and monitor in harsh traffic waters, Liu
et al. designed a portable integrated ship monitoring and commanding system [
21]. To test the data availability, Shao
et al. used images data captured from surveillance cameras to achieve target detection [
22]. To improve the function of the target automatic monitoring and tracking, Chen
et al. proposed a mean-shift ship monitoring and tracking system [
23], which showing possibility of using machine visual technologies for water traffic monitoring. In this study, yolov3 detection is relatively fast and real-time.
2.2. Applications of machine vision in target detections
Machine vision technology enables the machine with a visual perception system, with aids of hardware (e.g., camera, infrared thermal imager, night vision device) and software program. It has the ability to recognize and manipulate the activities and perform image-based process control and surveillance for traffic monitoring, manufacture inspection, autopilot and other scene perception usages [
24,
25]. A widely used applications of machine vision is Tesla driverless system, which equipped with the hardware needed for Autopilot and the software program to realise Full Self-Driving.
One of the cores for machine vision is the target recognition and detection algorithms,
Figure 1 shows the development of recognition and detection algorithms that used for object detection. The early studies of machine vision come up with Scale Invariant Feature Transform, which involved five steps to match the similarity of two images and to detect targets [
26]. Then SIFT has been upgraded to Viola-Jones detection algorithm [
27], histogram of oriented gradients (HOG) [
28], Data Management Platform (DMP), and so on.
However, the above-mentioned algorithms extract target features manually, can only perform well when they are guaranteed to extract sufficiently accurate features, so that inapplicable for a large number of targets existed. They are replaced by applying deep learning approaches to detect targets. The deep learning-based detection algorithms have their advantages of extracting features in complex images. The deep learning-based methods can be grouped into two categories based on the way they extract target features extraction: the anchor-based methods (i.e., Convolutional Neural Network (CNN) methods and You Only Look Once (YOLO) methods) and the anchor-free methods (e.g., adaptively spatial feature fusion methods [
29], CornerNet methods [
30]). The Anchor-based algorithms are further classified into single-stage detection and two-stage detection. Due to stability and accuracy, anchor-based methods become more popular in recent years. Typical methods include YOLOv1- v5 [
11,
31,
32], single shot multibox detector [
33], and Region CNN etc. For instance, Girshick
et al. [
34] proposed a novel method of R-CNN for target detection. The method uses image segmentation combining region and CNNs to improve accuracy. However, it requires a larger dataset to train the detection model, which reduces the detection speed. To improve detection speed, Meng
et al. develop an improved Mask R-CNN, which ignores the RolAlign layer in the R-CNN [
35]. Zhao
et al. suggest enhancing the relationship among non-local features and refine the information on different feature maps to improve the detection performance of R-CNN [
36]. Redmon and Farhadi proposed a joint training method to improve the traditional YOLOv1 model [
37]. The upgraded YOLOv3 model use binary cross-entropy loss and scale prediction to improve the accuracy of the model, while ensure the detection speed of detection [
11]. The YOLOv3 model is adopted in vision detection studies include Gong
et al [
38]; Li
et al [
39] and etc, which prove its fast speed in convergence and detection process. The applications of vision detection have been done on various domain, as well as the water traffic management. To design a deep learning-based detector for ship detection, Li
et al. apply Faster-CNN algorithm to train the ship target detection model, which achieves higher accuracy [
40]. To address the shortcomings of the region proposal computation, Ren
et al. introduce a region proposal network (RPN) by sharing the convolutional features of Fast R-CNN and RPN to further merge the two into one network [
41]. However, the accuracy of binocular vision positioning is not high enough.
2.3. Applications of machine vision in target tracking
Machine vision methods used for target tracking can be categorized as monocular vision and binocular vision based on the tracking mechanism [
42,
43]. Monocular vision was first proposed by Davison [
44], who used overall decomposition sampling to solve the challenge of real-time feature initialization. The core of monocular vision systems is the simultaneous localization and mapping (SLAM) method, which calculates the distance of the target within the camera's field of view. Although monocular visual localization is simple to operate and does not require feature point matching, it is less accurate and only suitable for specific environments. Therefore, it is not suitable for use in complex environments such as maritime target localization and tracking. To solve these problems, binocular vision positioning has been proposed and is widely used in many fields. However, binocular vision pre-localization only works on a flat surface and cannot accurately localize objects, so scholars have extended binocular vision to stereoscopic vision [
45,
46].
Binocular stereo vision technology can simulate the human eye to perceive the surrounding environment in three dimensions, making it widely used in various fields [
47,
48,
49,
50]. To reduce errors in the localization part of binocular stereo vision systems due to interference from complex environments, Zou
et al. proposed a binocular stereo vision system based on a virtual manipulator and the localization principle [
51]. They designed a binocular stereo vision measurement system to achieve accurate estimation of target object positions. Zuo
et al. used binoculars to capture point and line features and selected orthogonality as the minimum parameter for feature extraction, which solved the problem of unreliability of binocular stereo vision in detecting objects [
52]. Thereby, compared to monocular vision techniques, binocular stereo vision is a more effective technique for target tracking. It is more accurate, simpler to operate, and suitable for dynamic environments, making binocular vision systems more appropriate for ship supervision in offshore wind farms than monocular vision systems. Video tracking allows for continuous monitoring of the ship, which is very helpful.
3. Methods
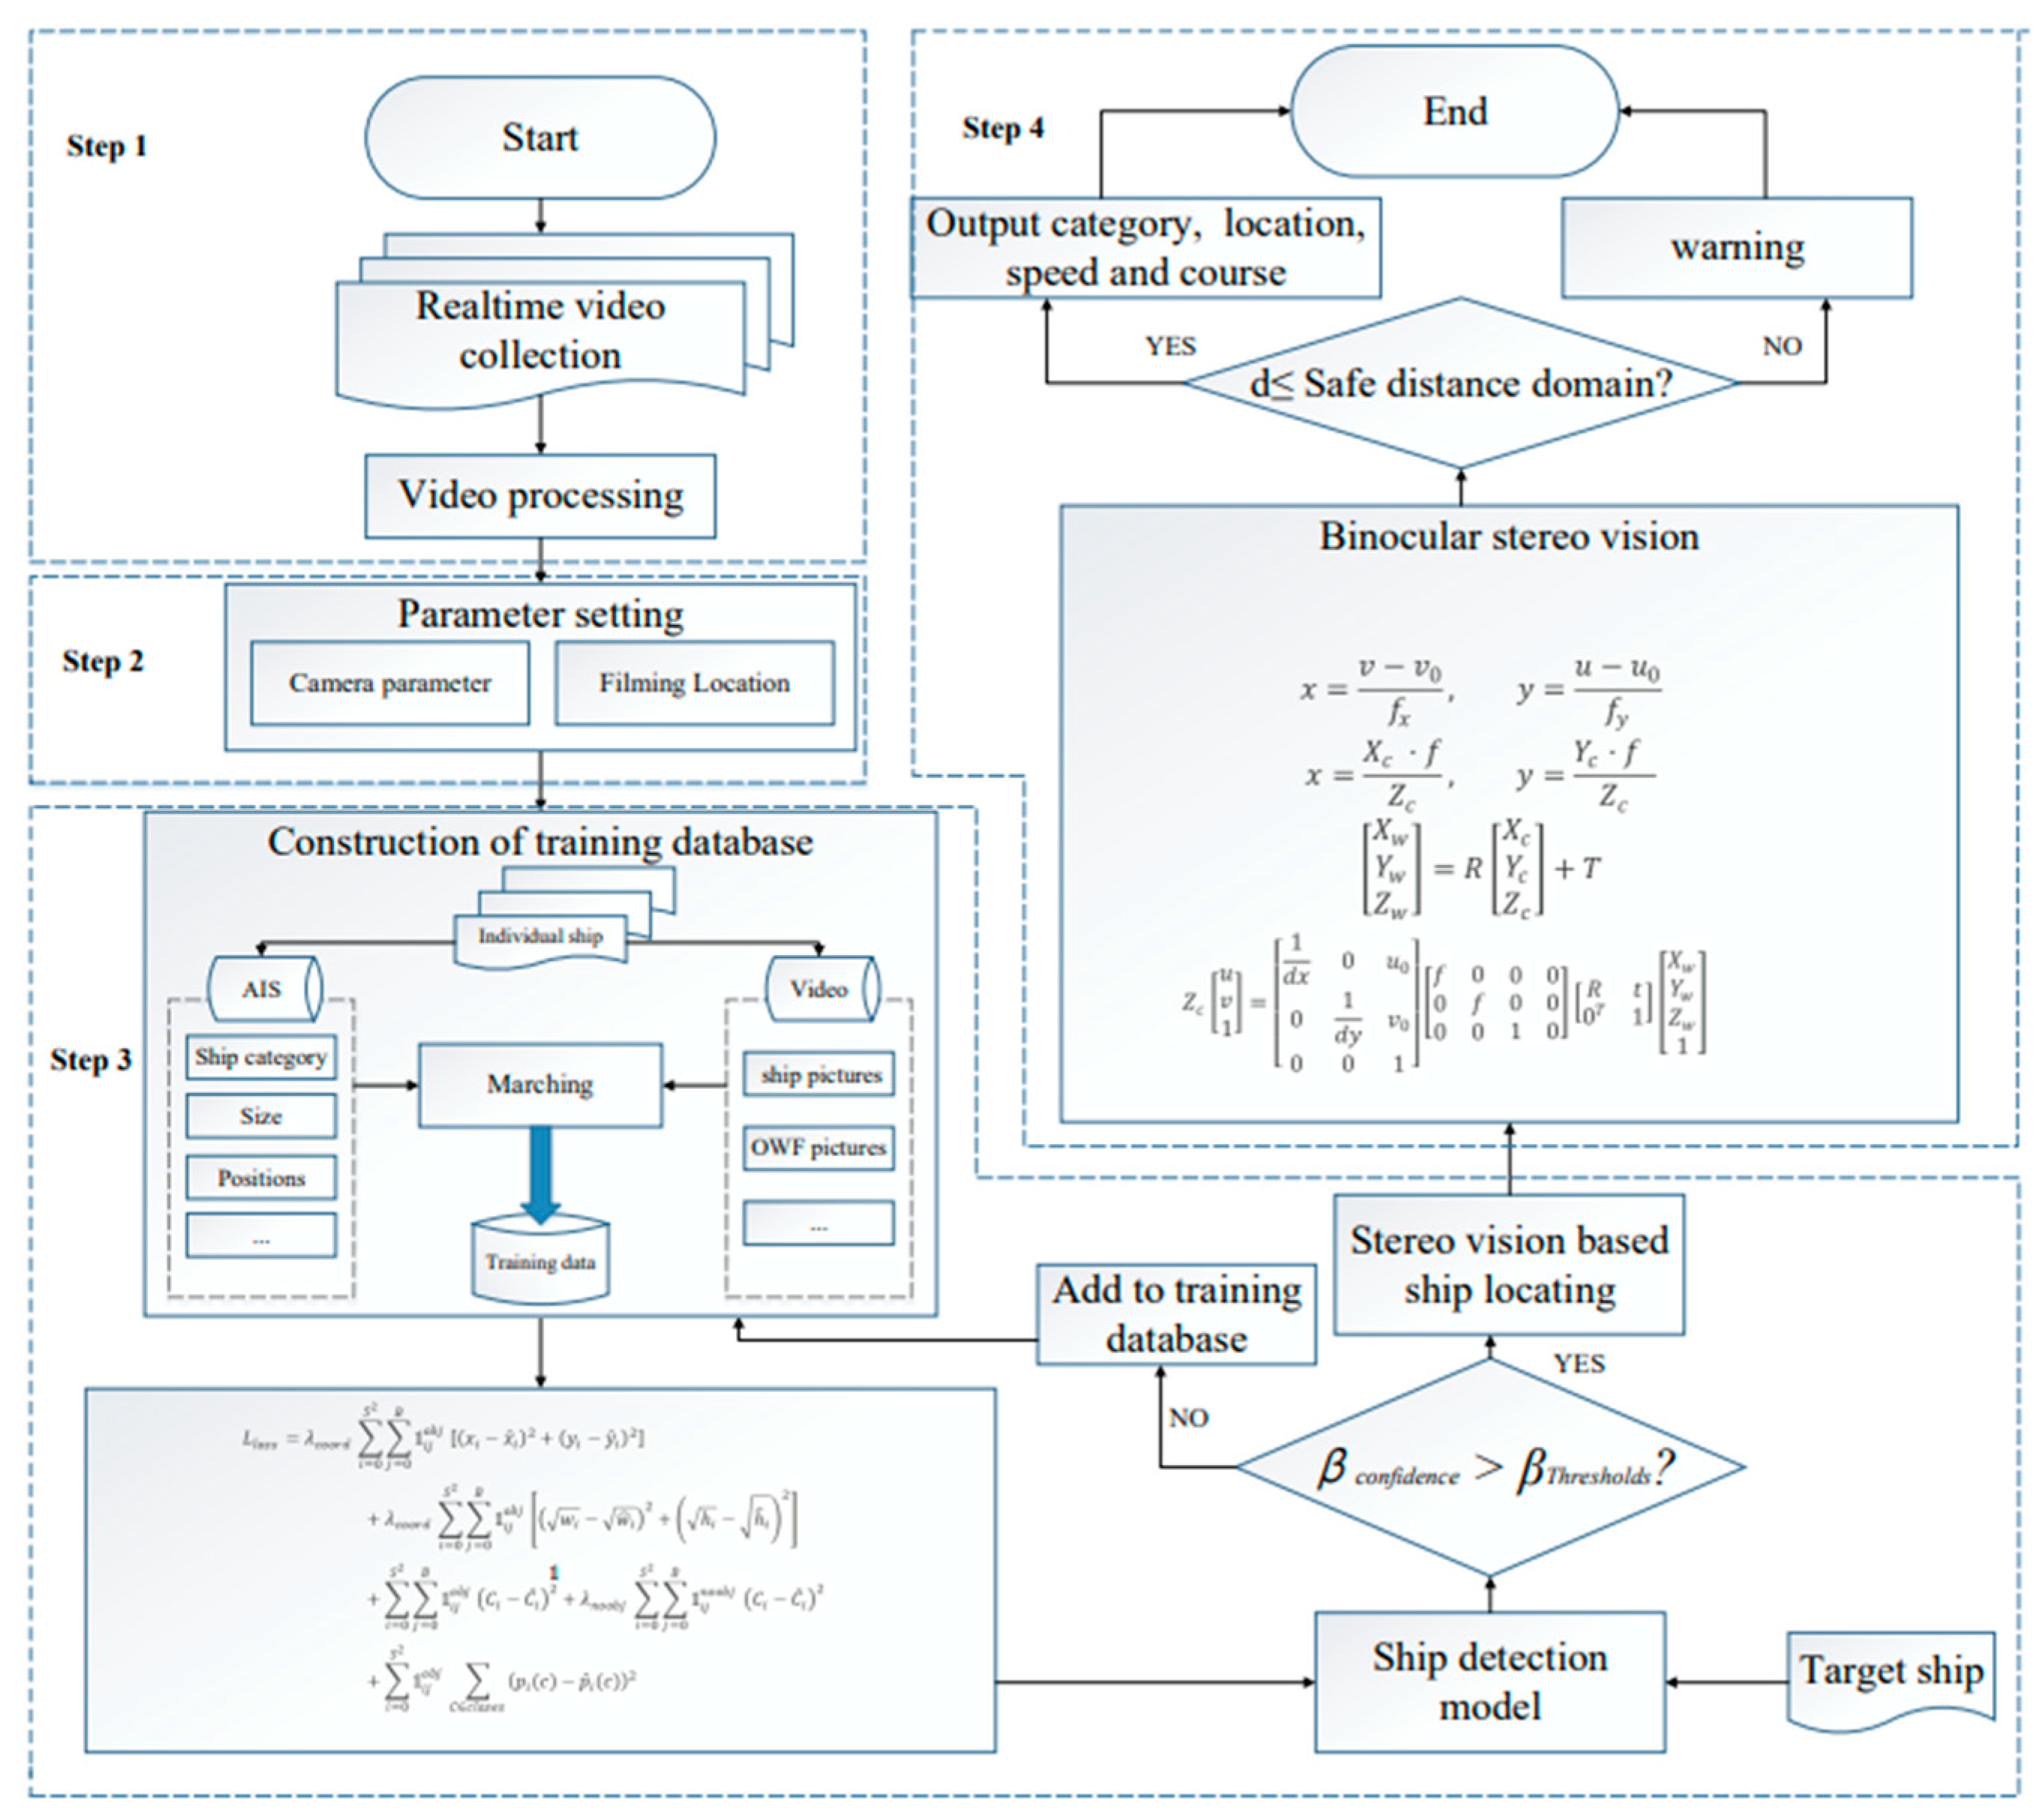
This section proposes a framework to implement a study aimed at protecting the safety of ships in the waters near the OWFs. The YOLOv3 algorithm is applied as a key component to detect ships in dynamic situations, while binocular stereo vision is applied to track the ships. The ship's dynamic parameters such as speed and course can be produced based on the proposed model. The framework structure is shown in
Figure 2.
The system consists of seven steps. 1) to collect real-time ship video from the waters in the vicinity of the OWFs; 2) to processes the collected ship video and picture information; 3) to set the relevant parameters; 4) to construct the training database from the collected video and AIS data; 5) to train the ship detection model using the YOLOv3 approach; 6) to map the ship location from videos into the physical world with the aid of binocular stereo vision and 7) to validates and outputs the results. The details of those steps are introduced as follows.
Step 1: To train the ship classifier in the detection model, it is necessary to collect images of various types of ships as samples. Live videos of ships can be captured at OWFs for ship labeling purposes. Then target ships used for training were selected from the video, and five samples were taken every second to form the raw database. Additionally, AIS data of the corresponding target was collected during the time of photographing to provide valuable information, such as the ship's type and position, for subsequent ship marking.
Step 2: Deep training and hyper-parameter settings significantly affect the performance of YOLOv3. Therefore, this step involves setting up the required parameters that are used in the YOLOv3 deep learning system. The camera's parameters are necessary for ship positioning. The internal parameter transforms the ship's position from pixel coordinates to camera coordinates, and the external parameter transforms the ship's position from camera coordinates to world coordinates. The internal and external camera parameters are obtained by simultaneously calibrating the left and right cameras.
In addition, three parameters are used to evaluate the performance of learning: learning rate, momentum, and decay. The learning rate determines how quickly the parameters move towards the optimal value and affects the model's effective tolerance capability. Momentum calculates the sliding average of the parameters continuously during training to maintain stability. Decay is set to prevent overfitting.
Step 3: Establish the initial training samples for YOLO model training, which is used to obtain the object imaging size in the port videos (i.e., generate a bounding box for each ship in the video). Before training, the ship pictures need to be processed through annotation using an image annotation tool. In this study, each ship in the picture is selected, and the corresponding AIS data is input to develop the database. The database includes the position coordinates of the corners of the ship's box, as well as the width and height of the ship in the picture. In the training process, standard techniques such as multi-scale training, data augmentation, and batch normalization are used to train the ship detector.
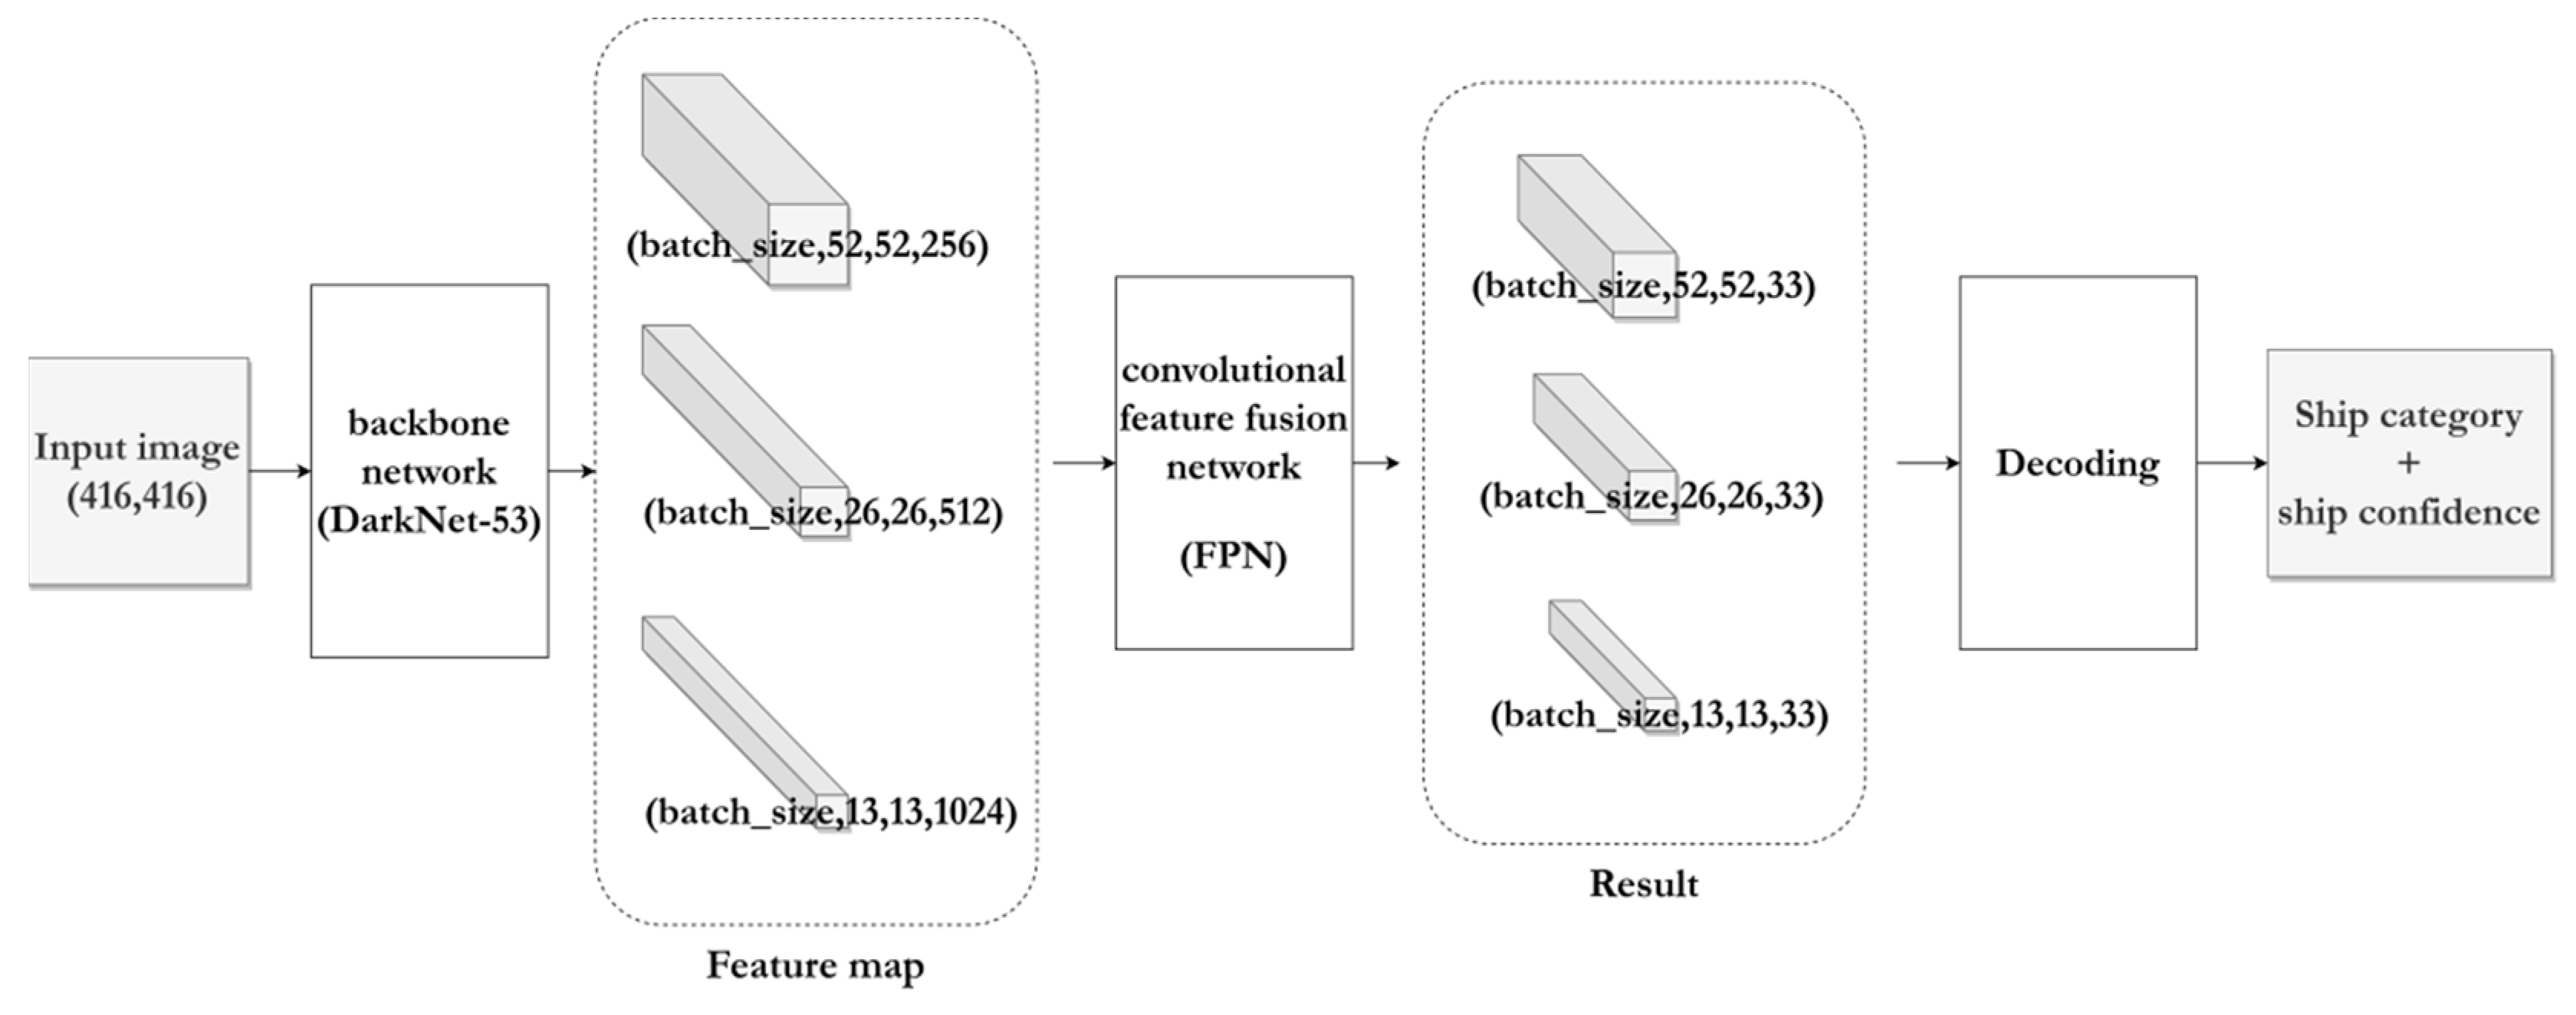
Figure 3 shows the training process of the YOLOv3 model, which consists of the backbone network, a convolutional feature fusion network, and the decoding processing.
As shown in
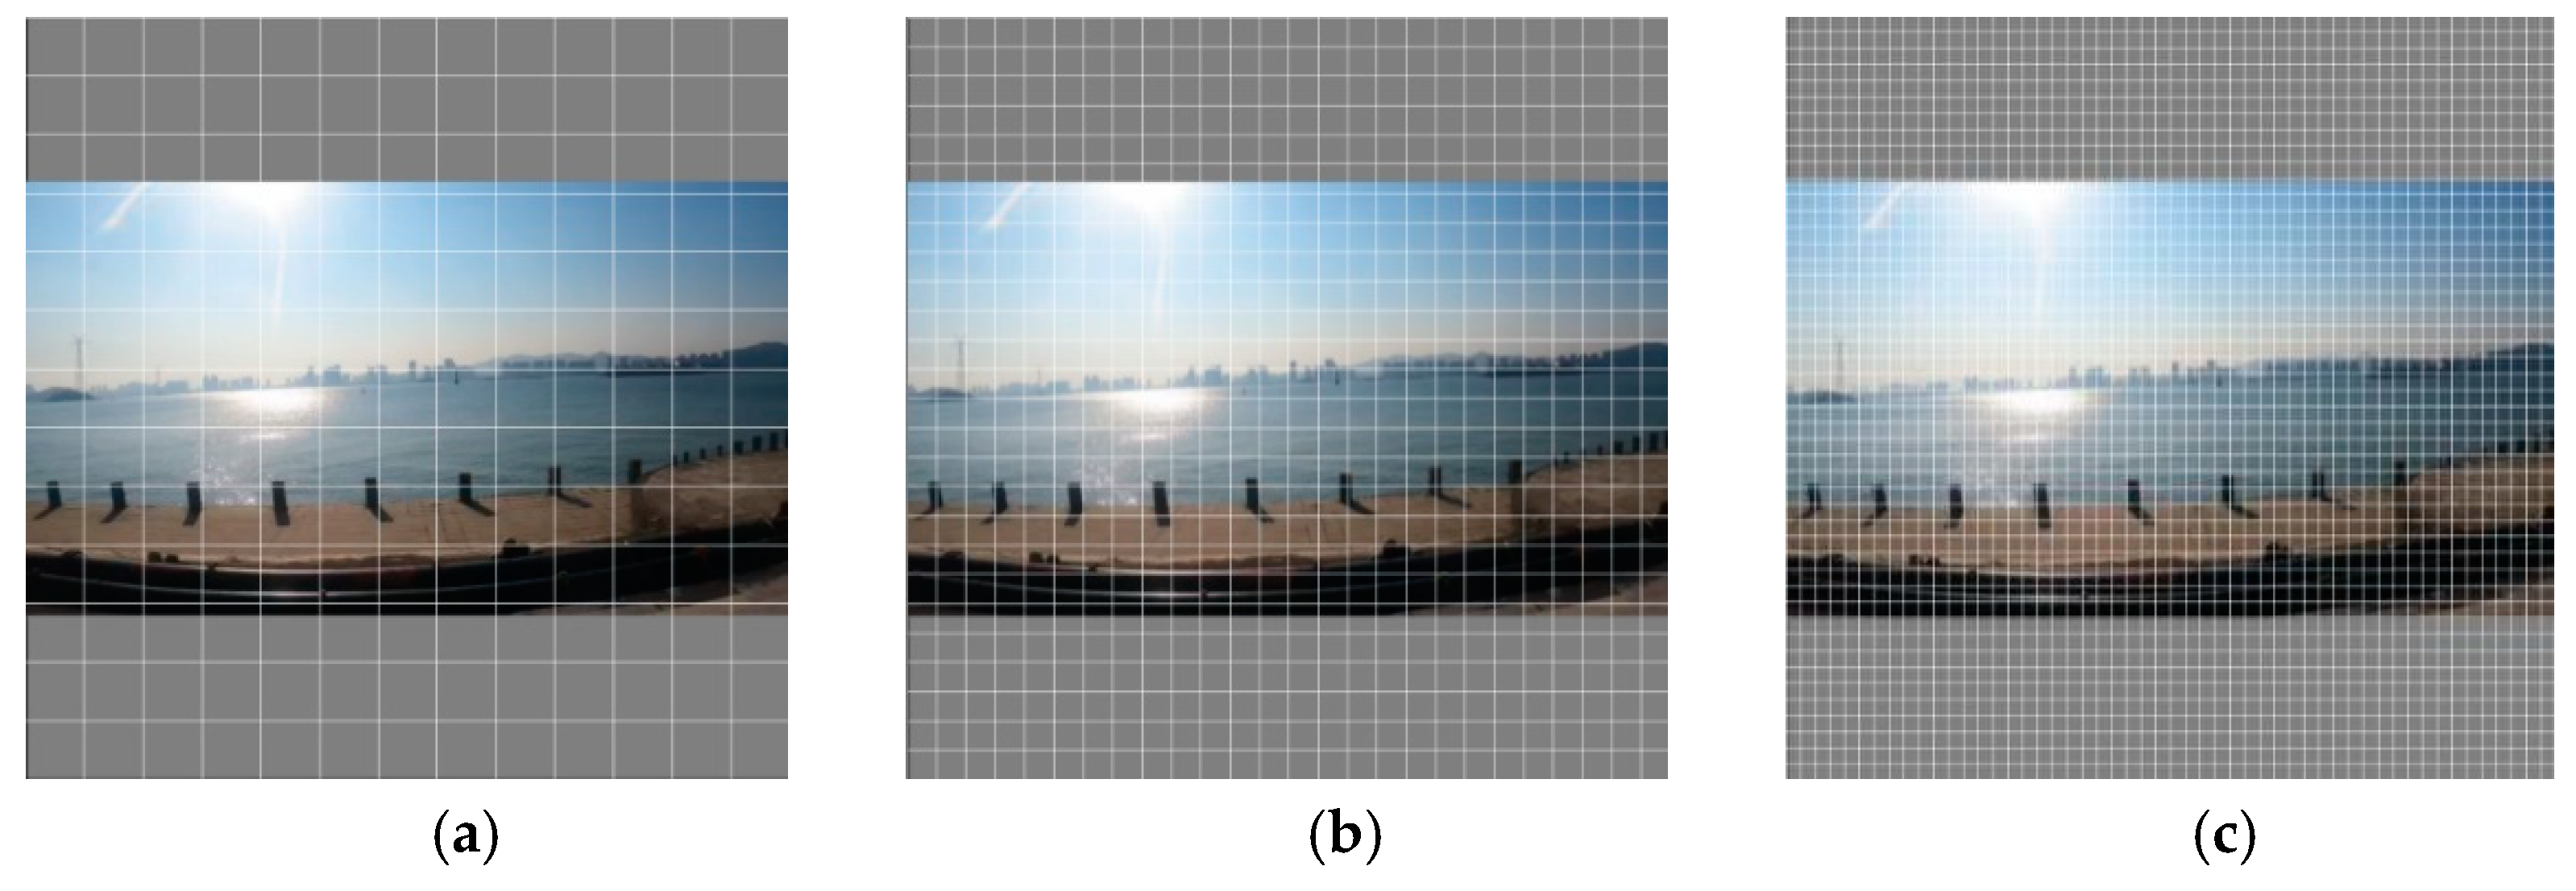
Figure 3, YOLOv3 uses DarkNet-53 networks for feature extraction. The algorithm includes 53 convolutional layers and 5 residual modules to extract the shallow features and semantic features of ship targets. In addition, to solve the gradient disappearance or explosion caused by the deep network structure, YOLOv3 uses deeper feature extraction layers to extract feature information. Then, a convolutional Feature fusion network (FPN) uses to enhance the sensitivity of small targets. At last, this study divides the input image into three grid scales to detecting targets. a large scale of 13 row ×13 columns for big target detection, a middle scale of 26 row×26 columns to detect middle target and a small scale of 52 row×52 columns to detect small target. An example is given in
Figure 4. As prediction result, the YOLOv3 output the pixel coordinates of the detected ships, their category (e.g., general cargo ship, container ship), and confidence level (how likely the detection is correct). This information is used to track and analyze the movement of ships in the video frames.
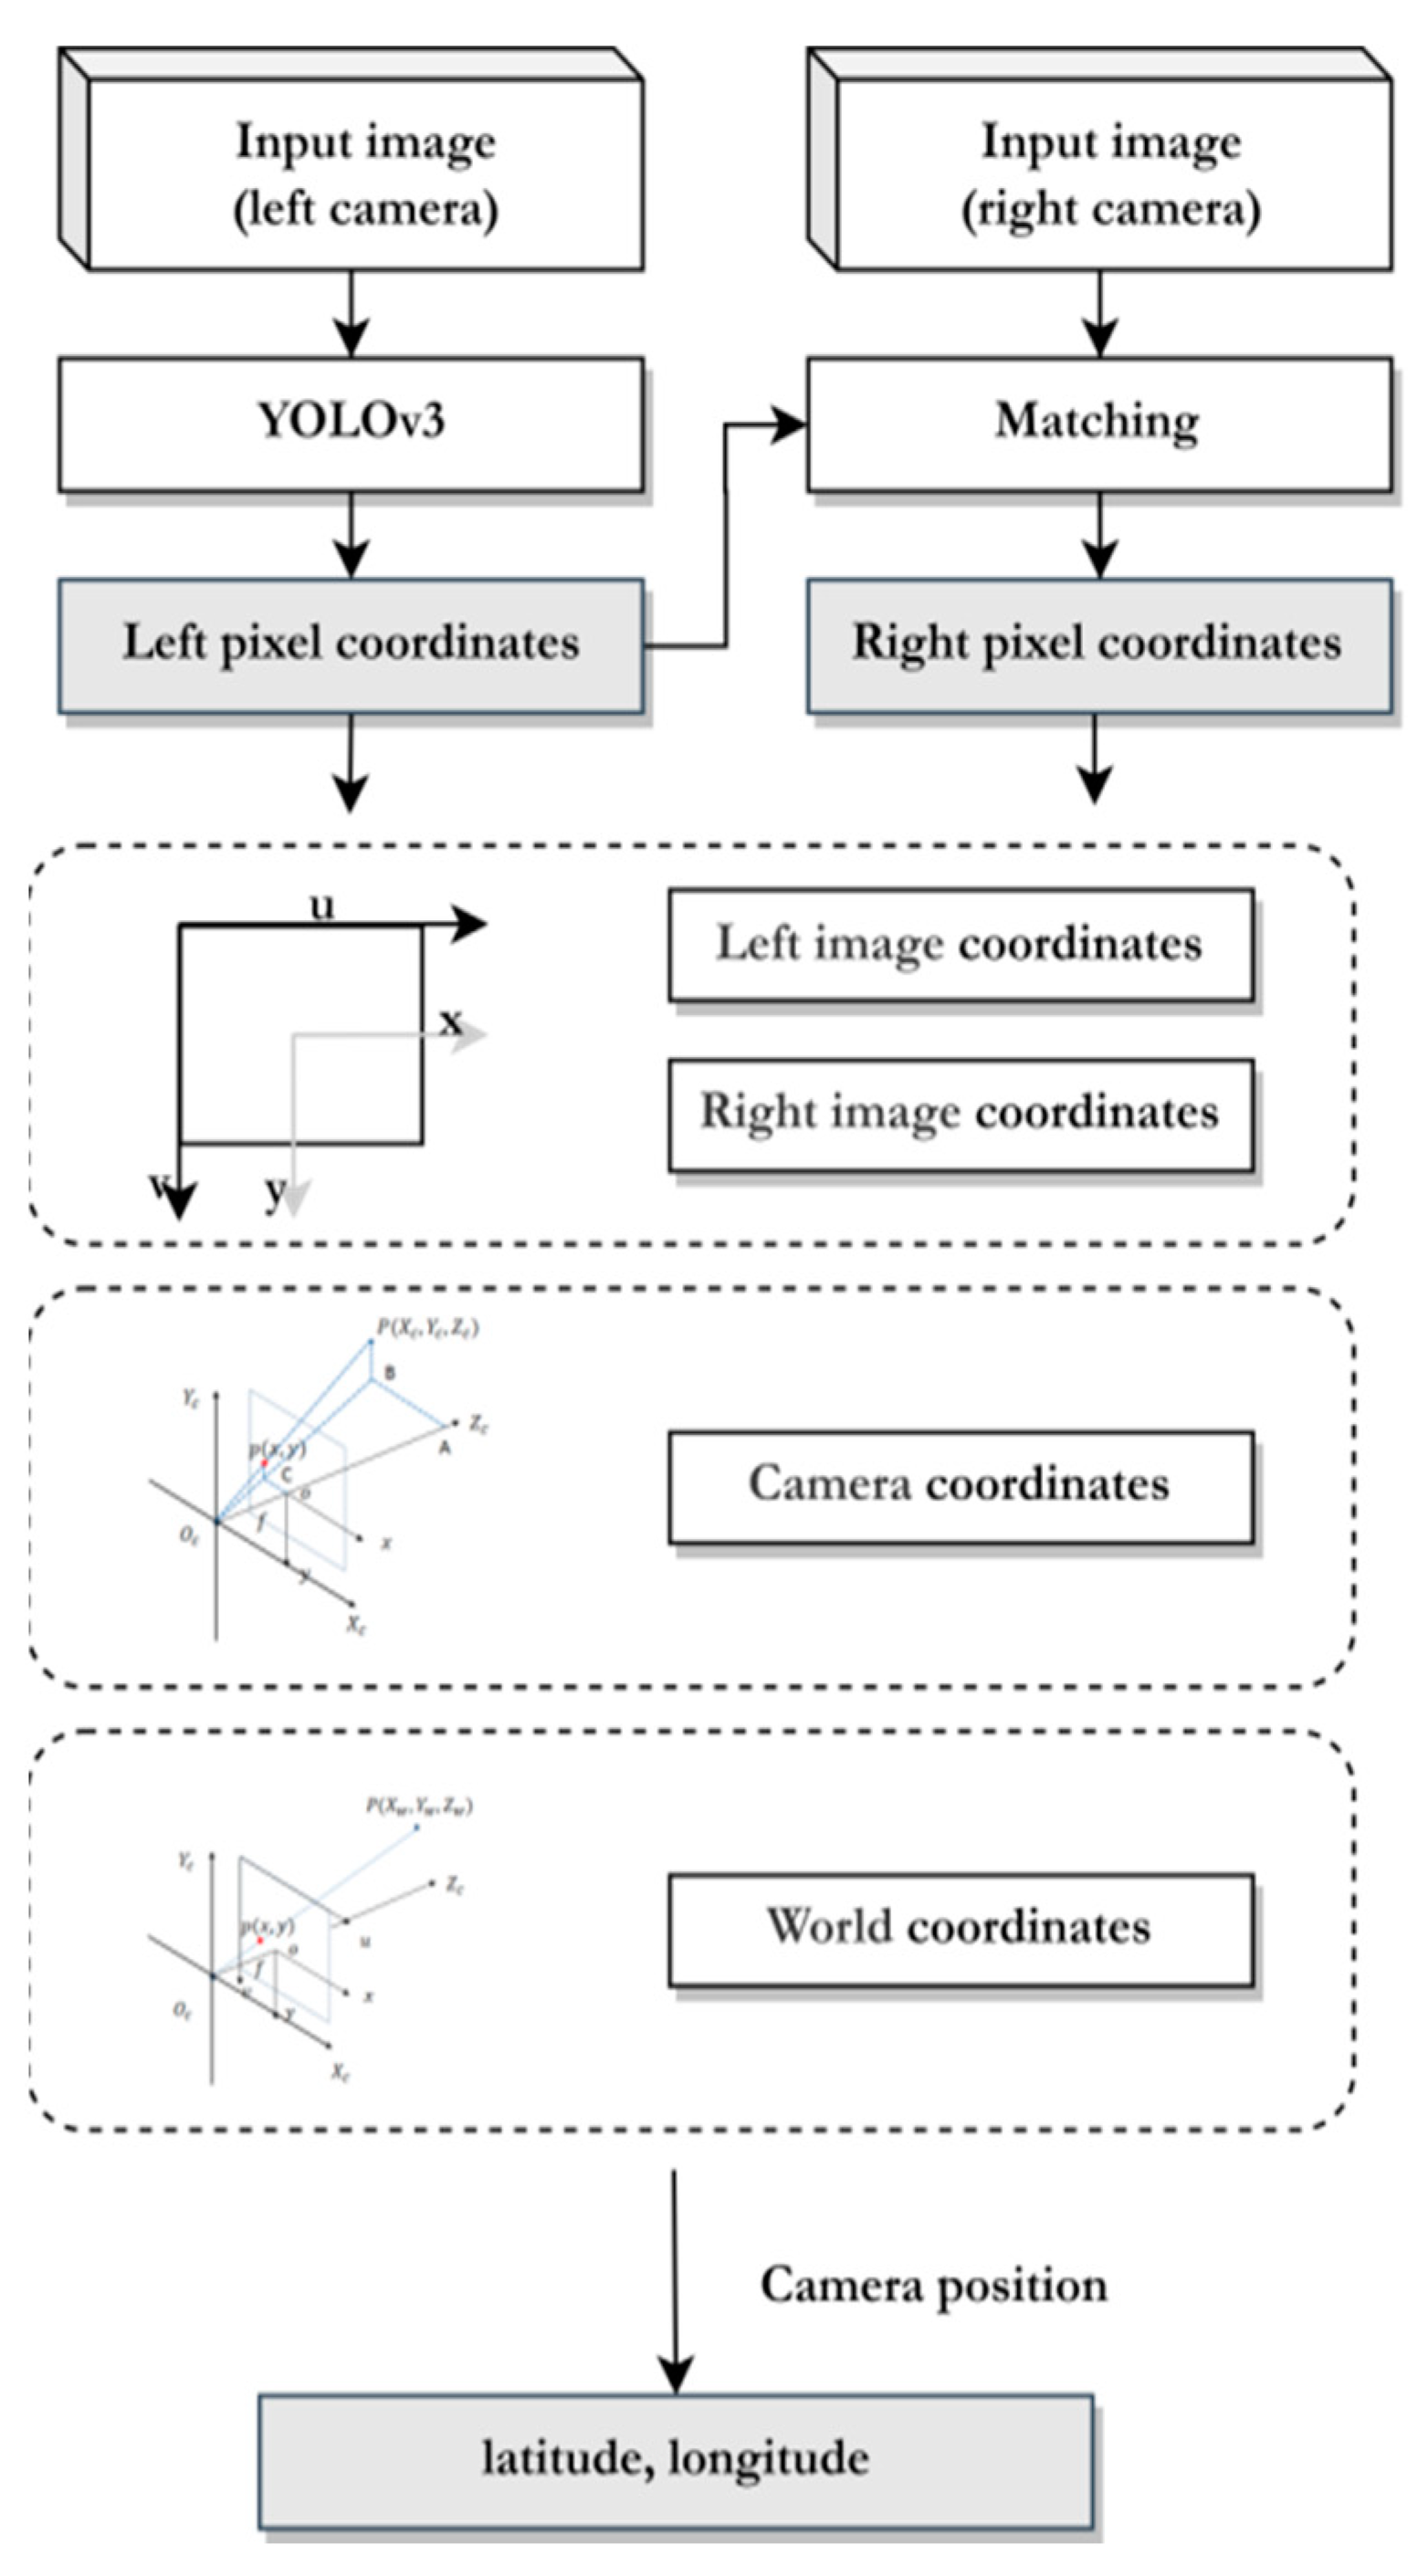
Step 4: This research utilizes stereo vision technology to achieve ship positioning. Stereo vision is a technique that involves detecting objects using two or more images. By simultaneously calibrating the left and right cameras, the internal and external parameters of both cameras can be determined. To obtain the position of the ship, the target coordinates are mapped from the video to the physical world using imaging principles. This involves transforming the ship position from pixel coordinates to world coordinates, see
Figure 5.
This research realizes ship positioning with the help of stereo vision technology, the whole structure is shown in
Figure 5. The stereo vision is employed to infer objects from two or more images. By calibrating the left and right cameras simultaneously, the internal and external parameters of the two cameras can be obtained. In order to capture the position of the ship, the target coordinate is mapped from video into physical world with the support of imaging principles (i.e., transformed ship position from pixel coordinate to world coordinate).
In the proposed system, the left pixel coordinate is obtained after input image captured by the left camera into YOLOv3. Meanwhile, the right pixel coordinate is obtained after matching image captured by right camera and left camera.
The pixel point is denoted by
. The world point is denoted by
. We use
to denote the augmented vector by adding 1 as the last element:
,
. The relationship between the world point
and its pixel projection
is given by.
Where is an arbitrary scale factor, the extrinsic parameters is the rotation and translation which related the world coordinate system to the camera coordinate system, and is the camera intrinsic matrix, with the coordinates of the principal point, and the scale factors in and axes, and the parameter describing the skew of the two axes.
In order to obtain the relative position relations between any two coordinate systems, the rotation
R and translation
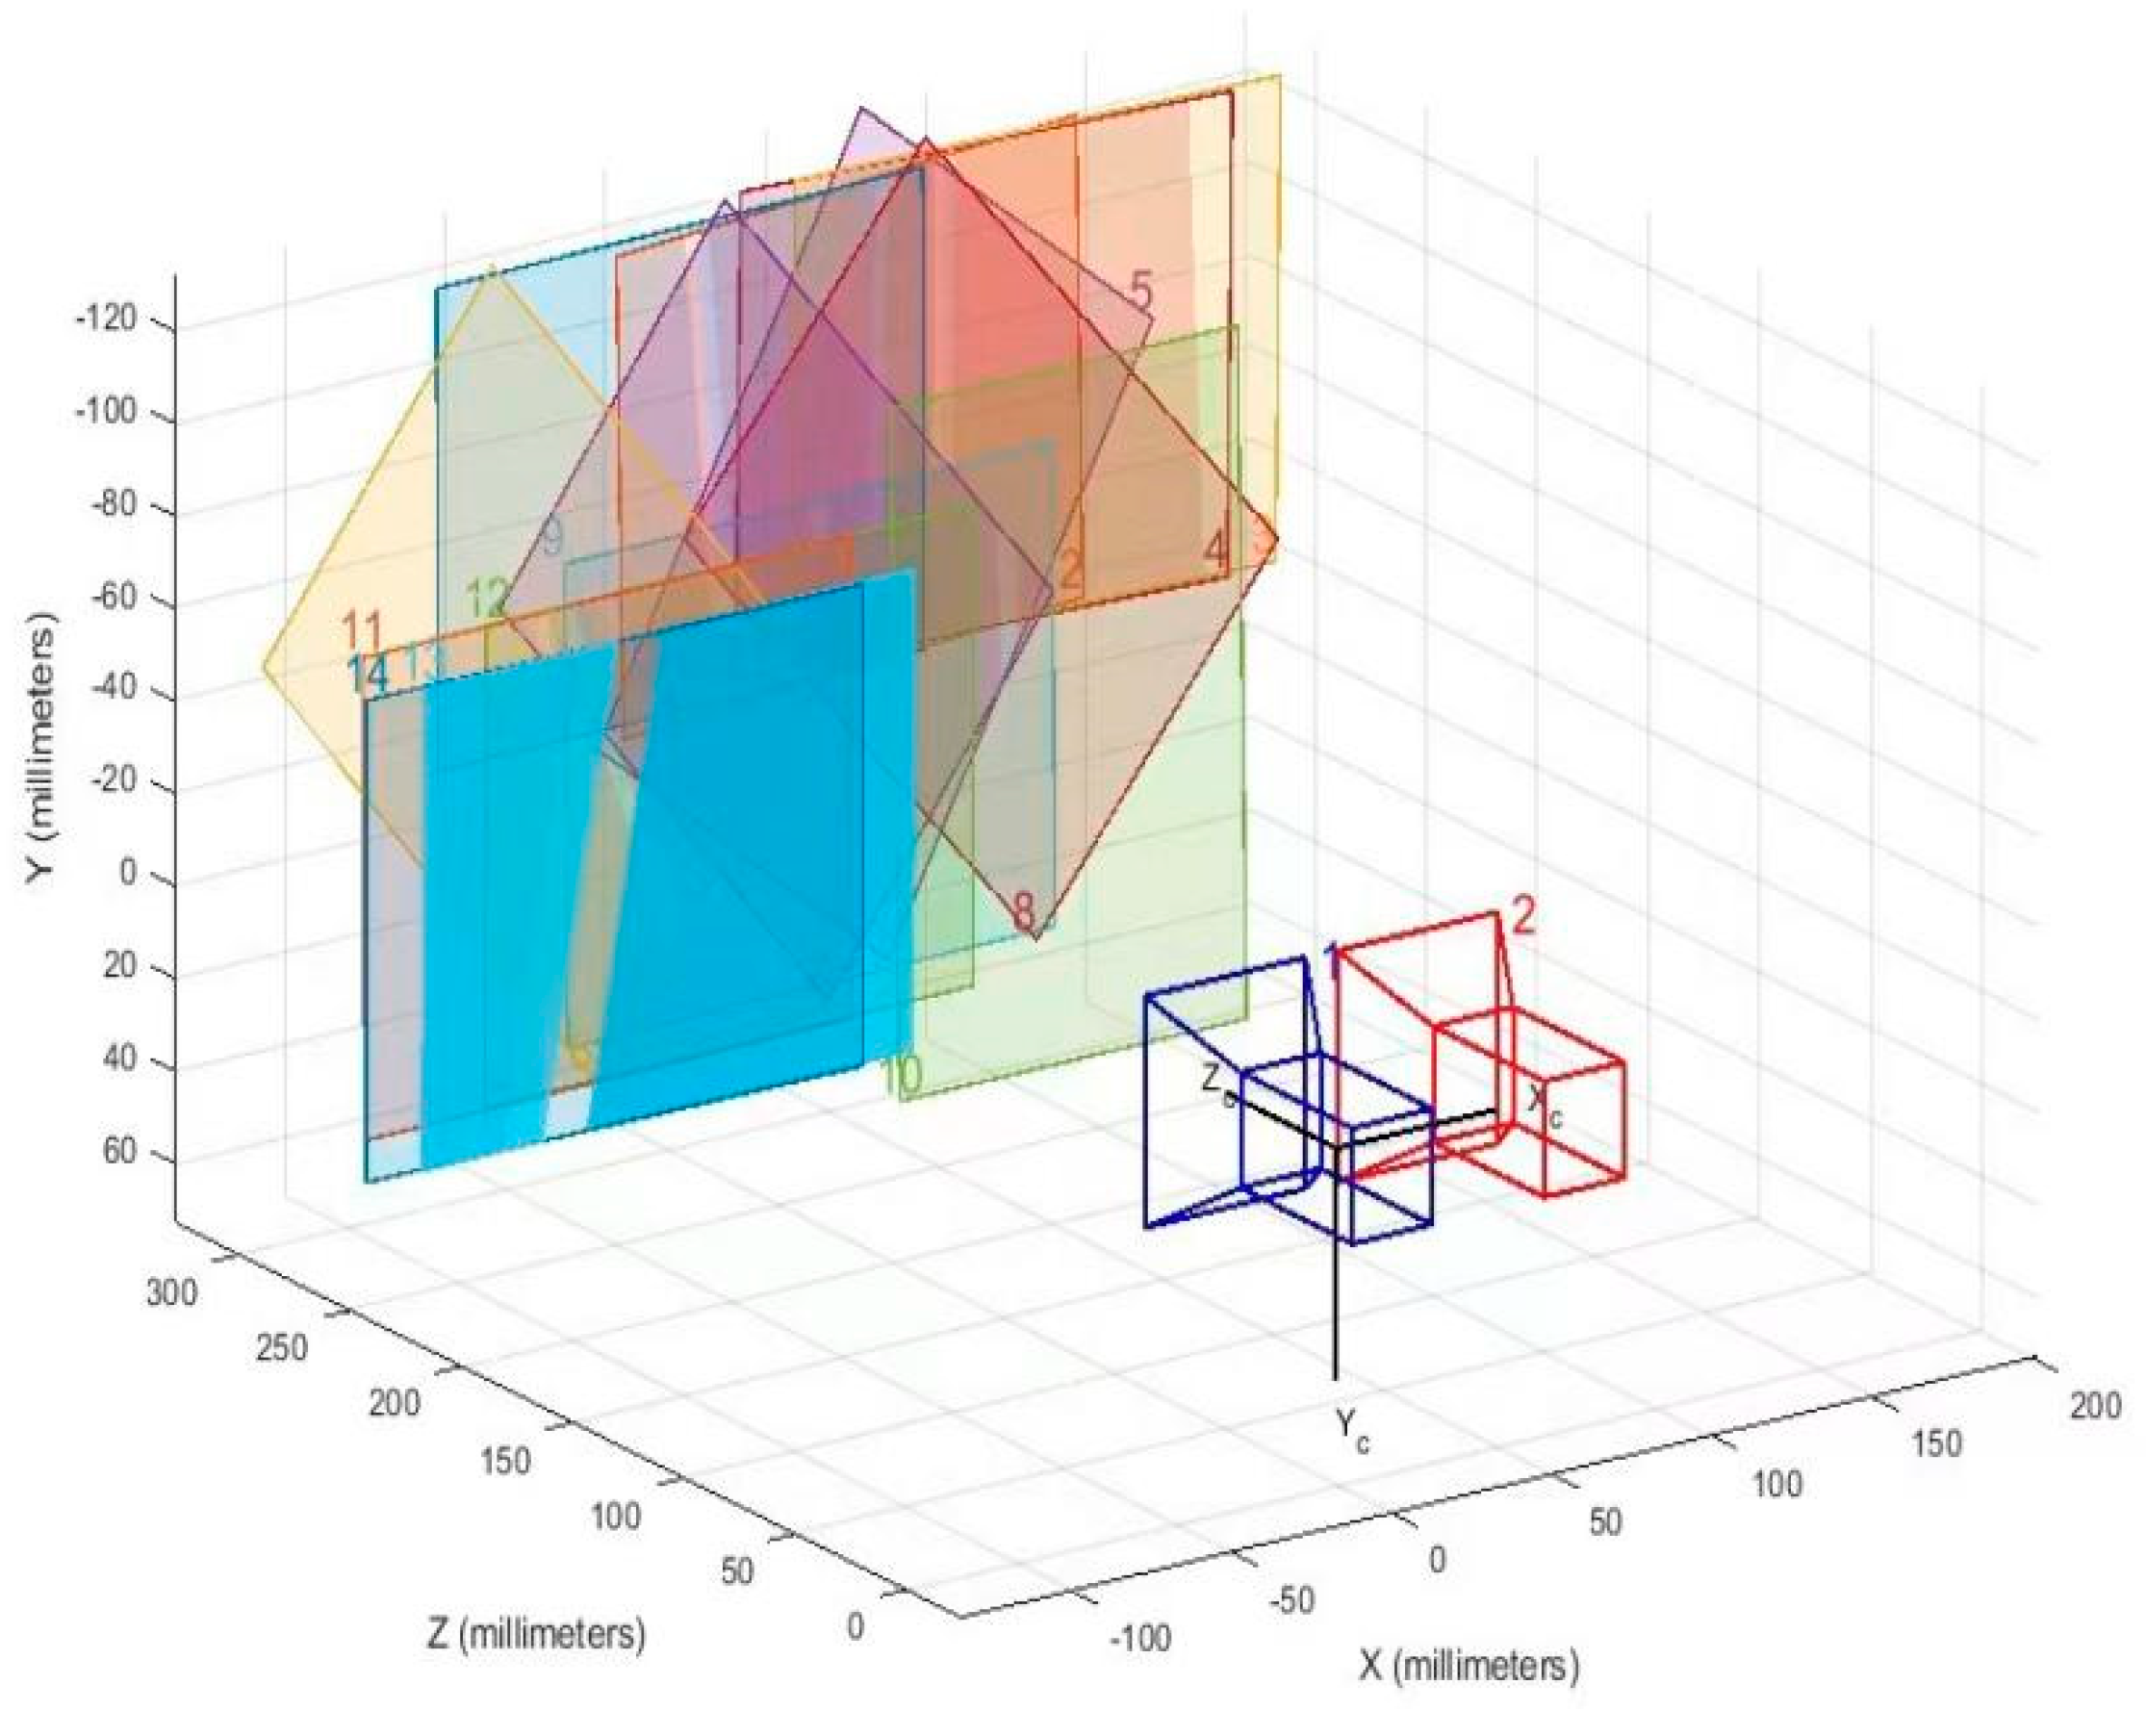
T need to be acquired by calibrating the left and right cameras, simultaneously. This calibration process involves capturing images of a checkerboard pattern at different orientations, as shown in
Figure 6. The images are then processed using the "Stereo Camera Calibrator" tool in MATLAB to obtain the camera parameters, including the rotation and translation matrices.
As a result, the world coordinate
of the ship is obtained. The latitude-longitude coordinate of the ship is denoted by
can be formulated as follows:
Where is the latitude-longitude coordinate of the camera.
4. Case study
4.1. Dataset and processing
In this experiment, our team collected a total of 1000 images of inland ships to form the MYSHIP dataset
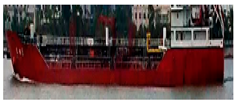
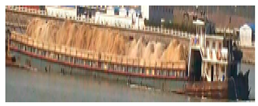
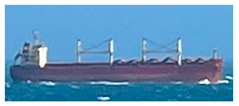
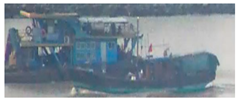
1. The images were captured at Bay Park, Xiamen Bridge, and Gao Qi Wharf in Xiamen City, Fujian Province, and had a resolution of either 1920×1080 or 2840×2160. Since training a convolutional neural network requires a considerable number of samples, we also added the SEASHIP dataset to our dataset. The SEASHIP dataset consists of a total of 7000 images with a resolution of 1920×1080. As shown in
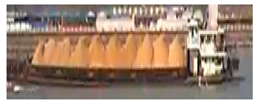
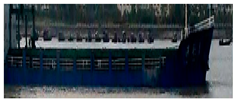
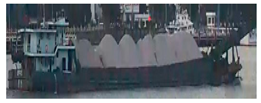
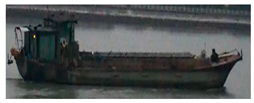
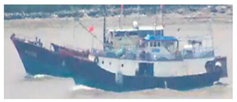
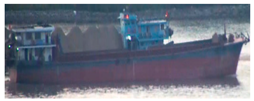
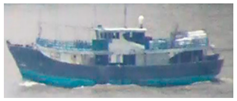
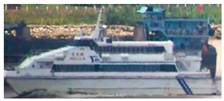
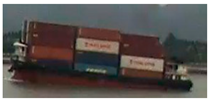
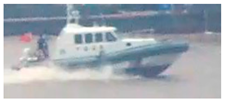
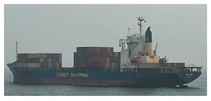
Table 1, the dataset is divided into six categories of ship: ore carriers, bulk cargo carriers, general cargo ships, container ships, fishing boats, and passenger ships.
We divide the dataset into 3 parts: the training set, the validation set and the test set in the proportion 6:2:2. The division of the dataset is shown in
Table 2.
4.2. Parameter setting
In this experiment, gopro camera is used to capture ship video and image data. The hardware parameters of the camera are shown in the
Table 3.
The internal and external parameters of the two cameras are shown in the
Table 4.
The experiments are carried out on a platform configured with 64G memory, an Intel Core i9-12900kF CPU and a NVIDIA GeForce RTX 3090 Ti GPU for training and testing. The system of the experiment platform is Windows 10.
The training parameters of our model are set as follows: an asynchronous stochastic gradient descent with a momentum term of 0.9 is used, the initial learning rate of the weight is 0.001, the learning change epochs is 0.0005, the epoch is 1000.
4.3. Construction of training database
In this paper, we use the image annotation tool Labelimg to manually annotate the boxes of each ship in the images (https: //github.com/tzutalin/labelimg). Labelimg is the most widely used image annotation tool for creating custom datasets. Once the images are annotated, a .xml file is generated that contains the category of the ship, the position of the corners of the ship's box, as well as the width and height of the ship. An example of the labeling process for the ship's boxes is shown in
Figure 7.
To prevent overfitting and improve target detection accuracy, data augmentation strategies were applied to the images in the dataset, which increased sample diversity and improved the robustness of the model. In the experiment, we use several augmentation techniques such as horizontal flipping, vertical flipping, random rotation, Mosaic, or cutout to enrich the training samples.
4.4. Detection
Four video clips were collected to detect the effect of the model, and details for the video clips are shown in
Table 5.
Video #1 shows a container ship in motion, with a frame rate of 30 per second (fps) and a duration of 150 seconds. The image resolution for video #1 is 720×1280.
Video #2 and #3 were taken under similar conditions as video #1. Video #2 shows a static bulk cargo ship, while video #3 shows a static passenger ship. Both videos have a frame rate of 30 fps, with video #2 having a duration of 60 seconds and video #3 having a duration of 480 seconds. The image resolution for video #2 and #3 is 2160×3840.
Video #4 involves a passenger ship in motion and a static fishing boat. It has a frame rate of 30 per second (fps) and a duration of 60 seconds. The image resolution for video #1 is 2160×3840.
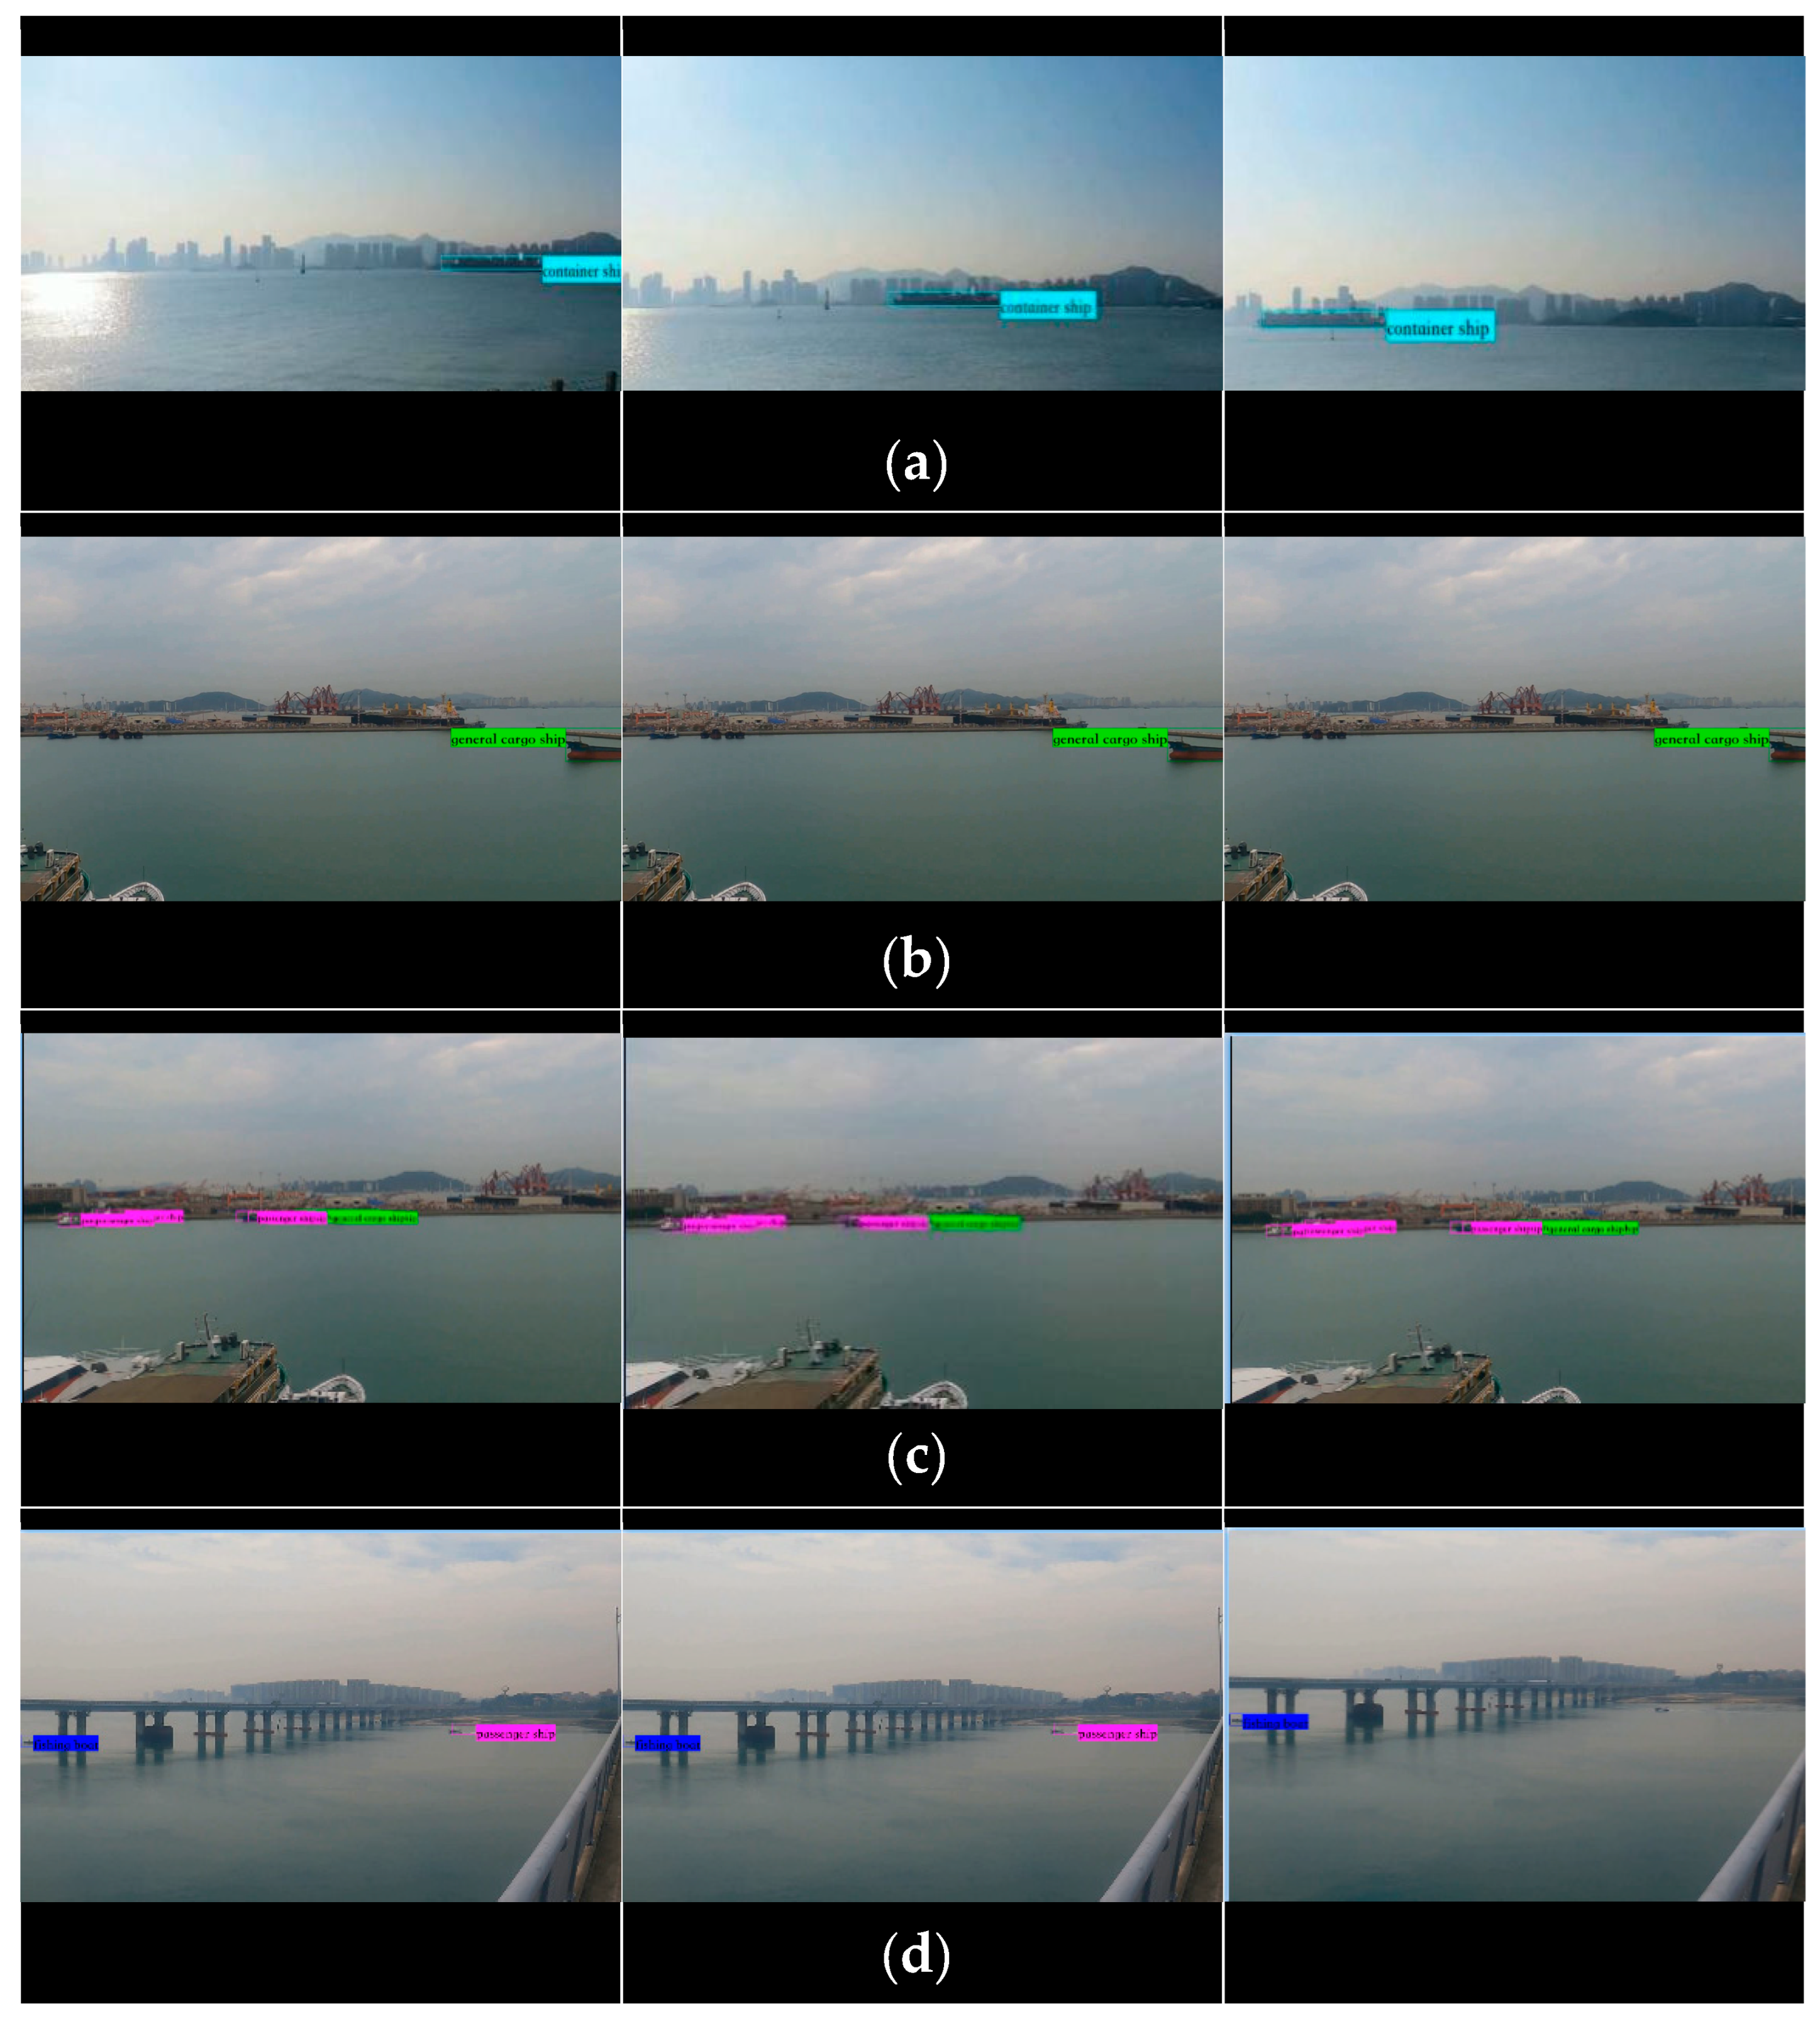
Typical samples for each video clip are shown in
Figure 8.
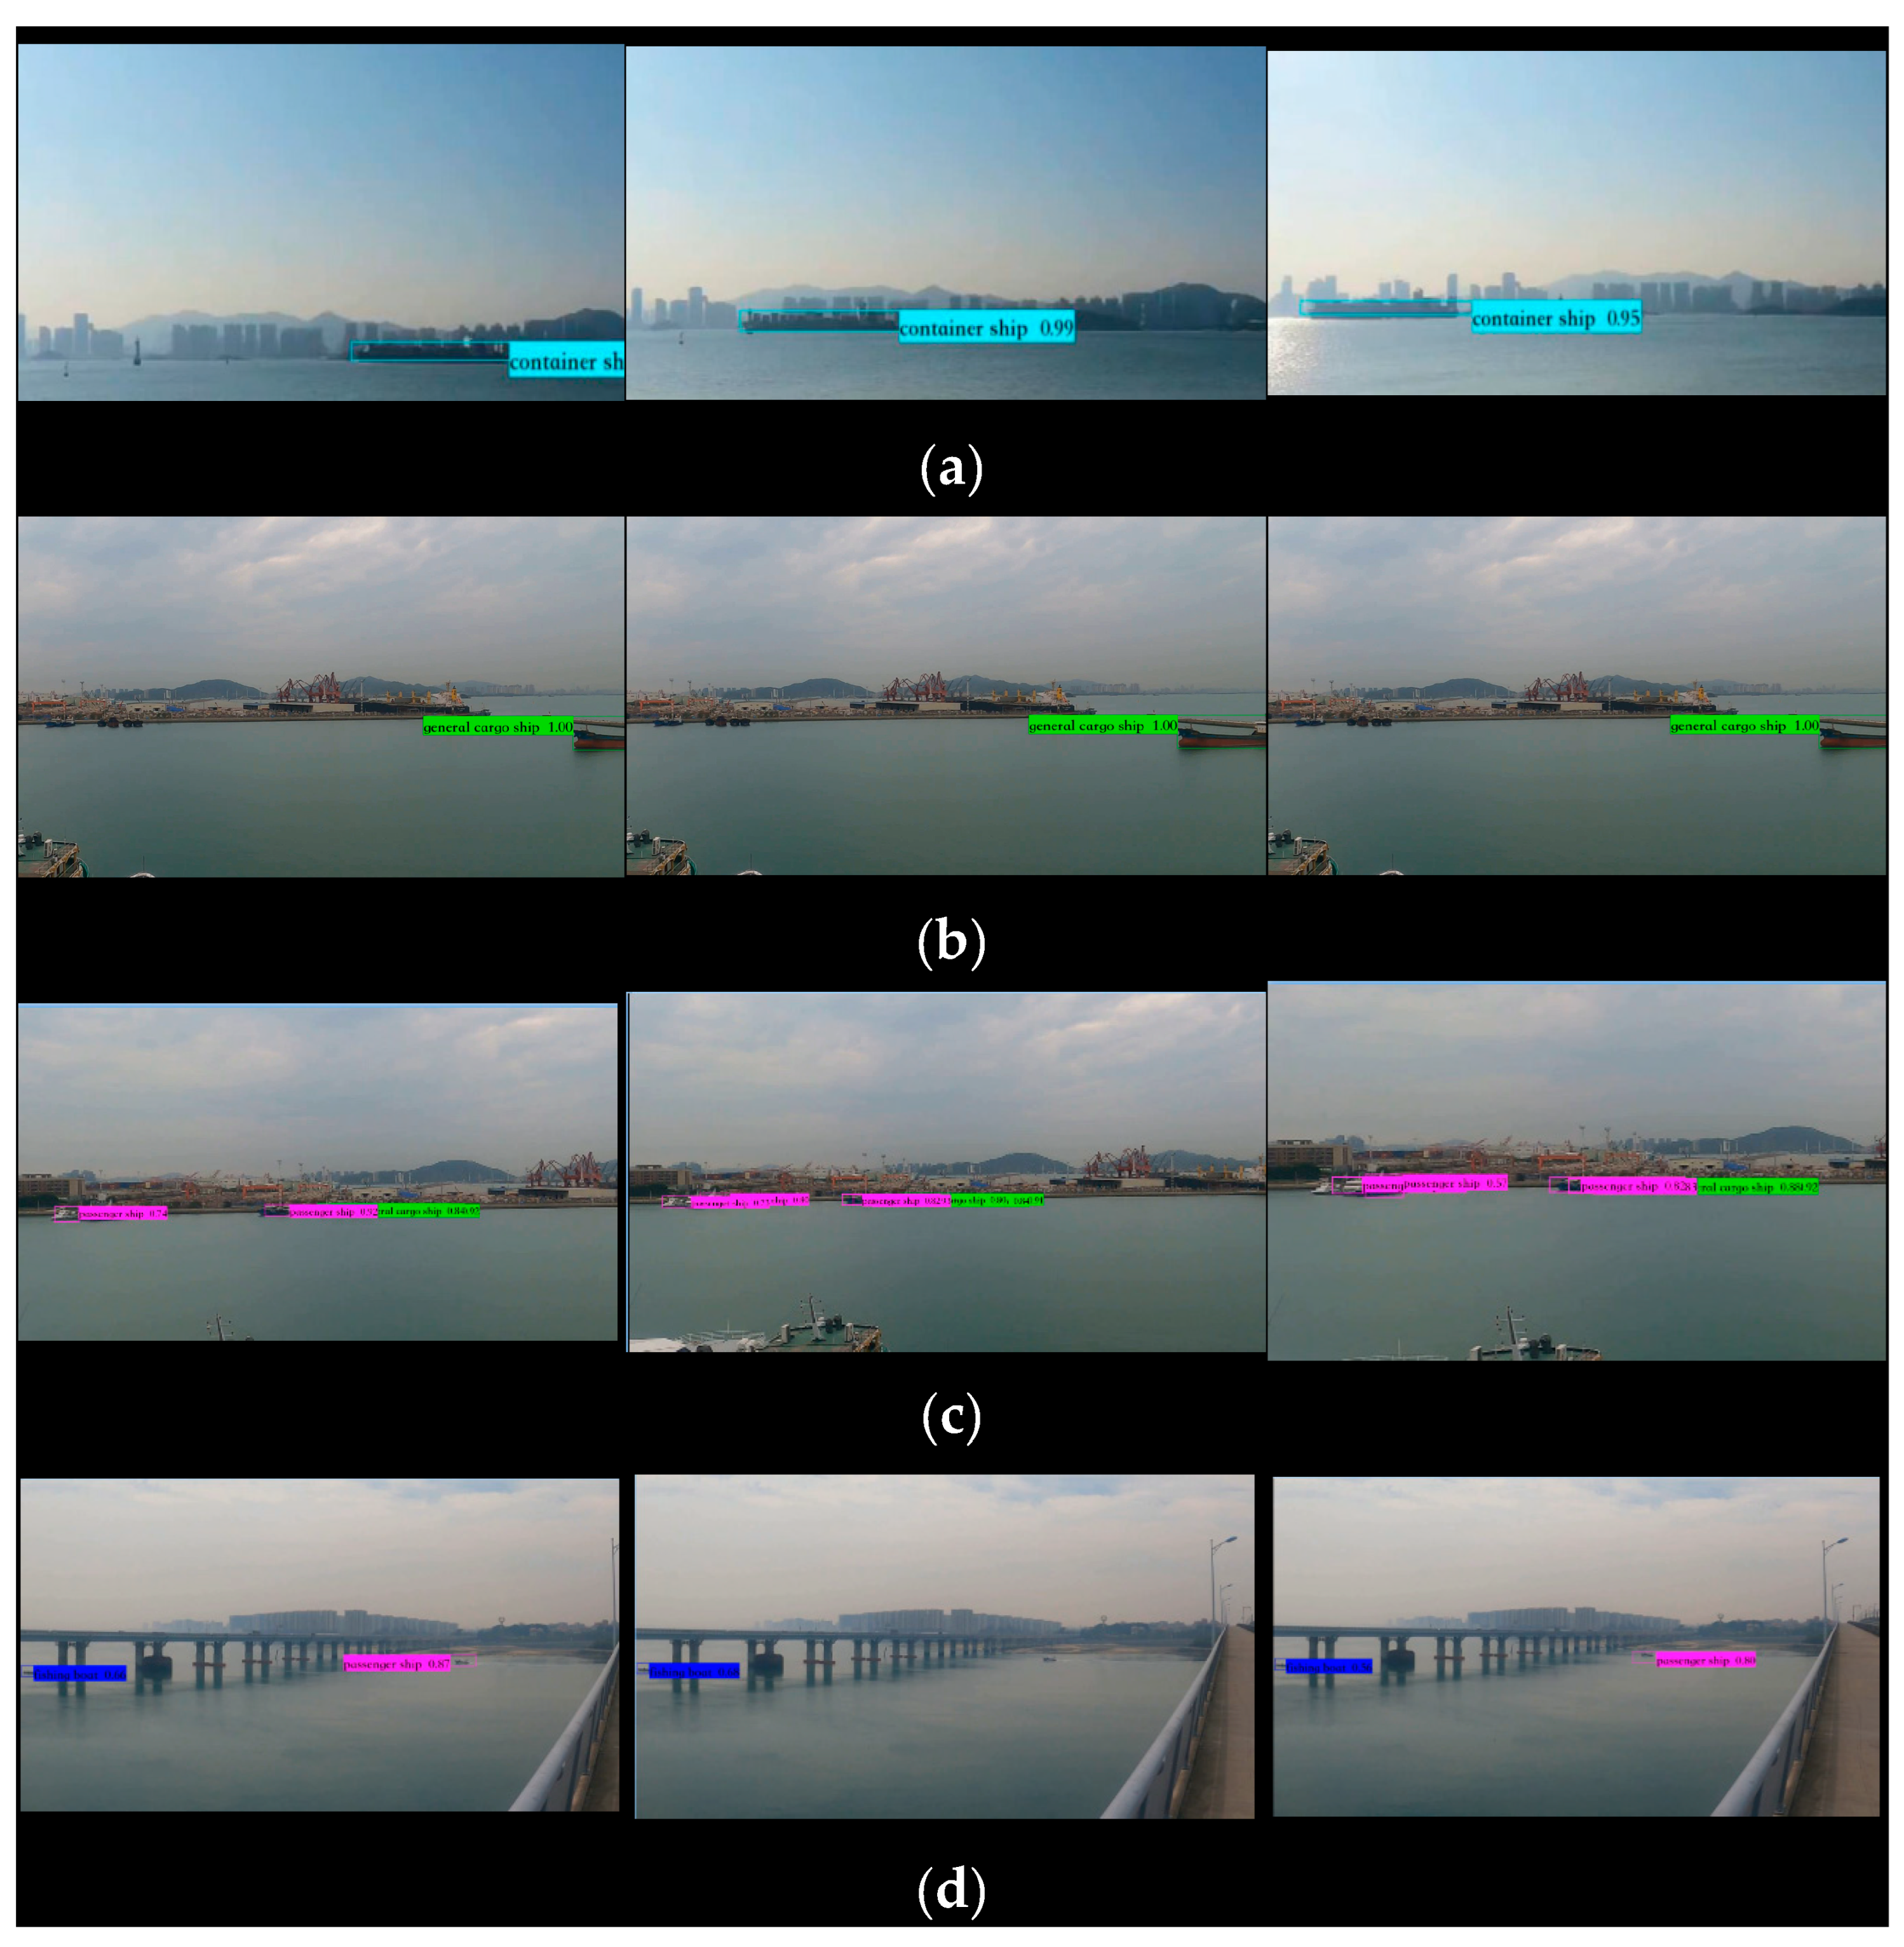
Figure 9 shows typical object detection results and the confidence of the results for each video. Specifically,
Figure 9(a) to 9(d) demonstrate results for videos #1, #2, #3, and #4, respectively.
In most cases, the detection results given by proposed system are accurate. However, noted that the ships in the lower left corner of
Figure 9c have not been detected, and the small ships in the distance in video#4(c) have not been detected.
The details of the confidence level of ship detection are shown in the
Table 6.
In video #3, the minimum confidence level for detecting a ship is 0.50, while the maximum confidence level is 1.00 in videos #1 and #2. The average confidence level for ship detection across all videos is 0.72. The proposed system provided bounding box sizes (i.e., object detection results) that were close to the actual object sizes in most cases, demonstrating satisfactory detection performance. As such, we believe that the proposed system is capable of successfully detecting target objects in a typical offshore wind farm.
4.5. Location
Figure 10 shows typical object location results for each video, with
Figure 10(a) to
10(d) demonstrating results for videos #1, #2, #3, and #4, respectively. The figure may need to be partially enlarged to clearly see the accompanying text.
Figure 10.
(a)This is a figure describing the typical detection and location result of the collected video #1.
Figure 10.
(a)This is a figure describing the typical detection and location result of the collected video #1.
Figure 10.
(b)This is a figure describing the typical detection and location result of the collected video #2.
Figure 10.
(b)This is a figure describing the typical detection and location result of the collected video #2.
Figure 10.
(c)This is a figure describing the typical detection and location result of the collected video #3.
Figure 10.
(c)This is a figure describing the typical detection and location result of the collected video #3.
Figure 10.
(d)This is a figure describing the typical detection and location result of the collected video #4.
Figure 10.
(d)This is a figure describing the typical detection and location result of the collected video #4.
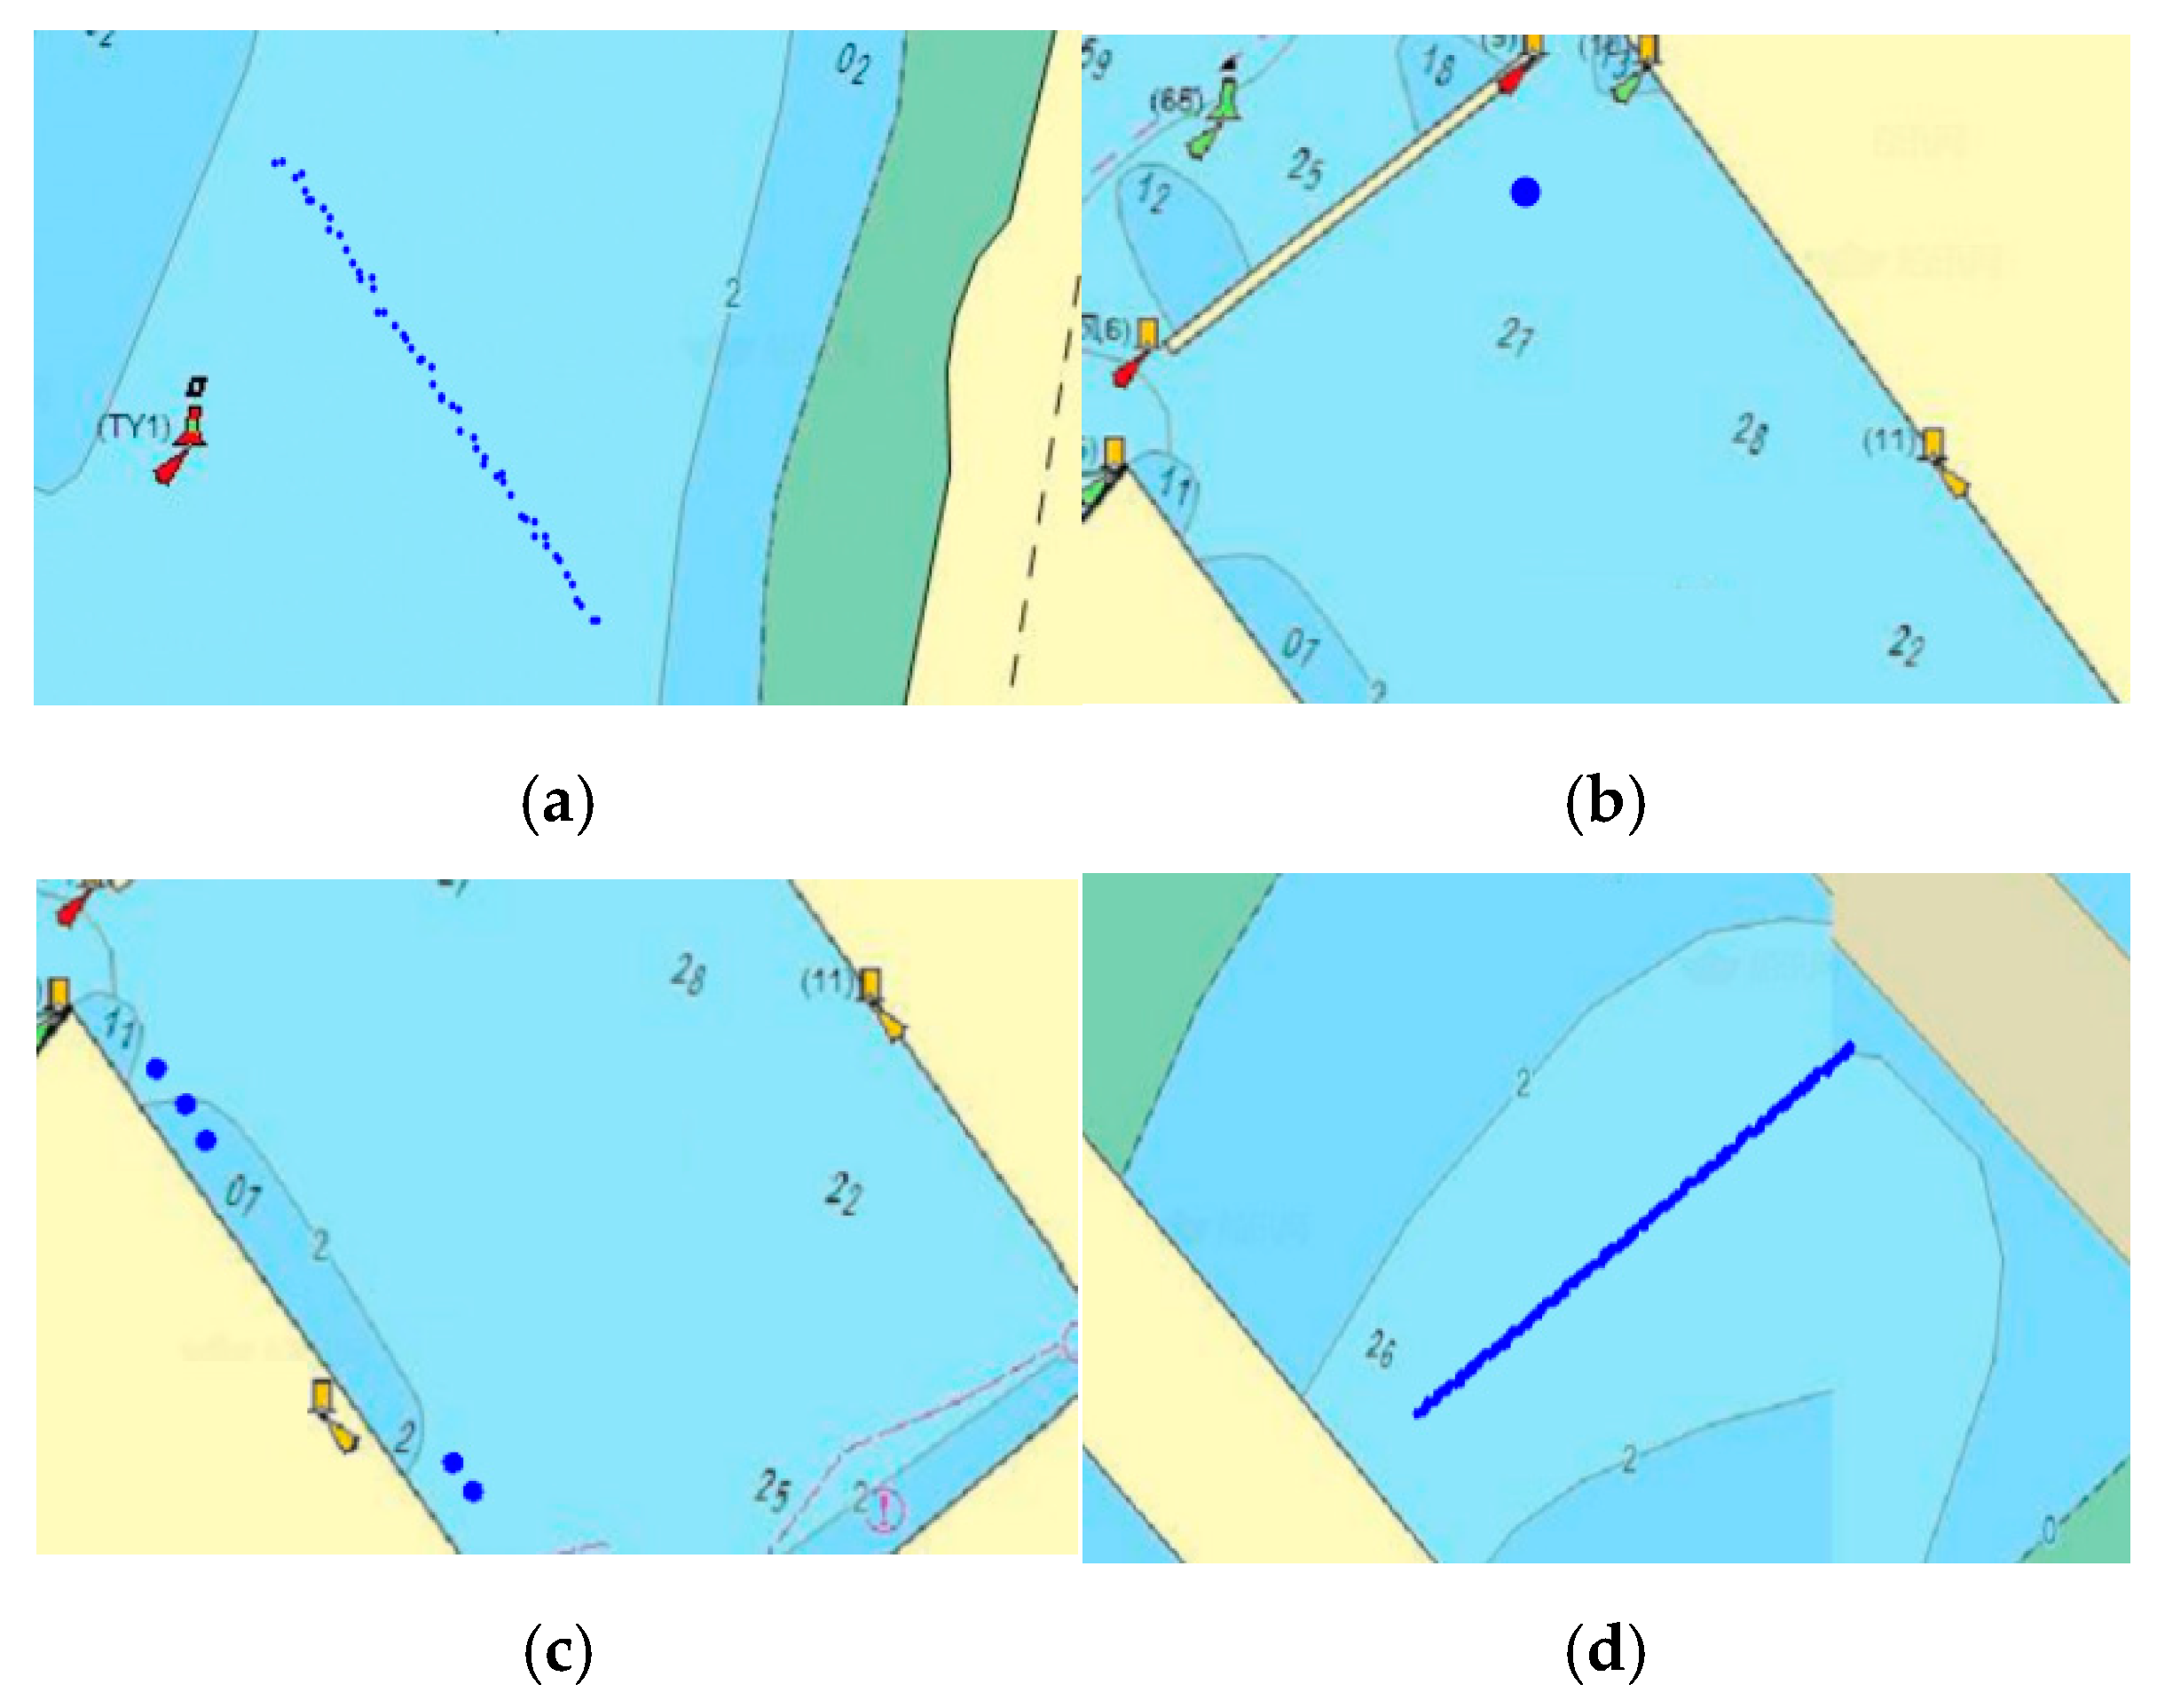
The position distribution of the ships in the world coordinates were shown in
Figure 11.
Figure 11 depicts the real-world ship movement, represented by the blue point in each subplot. The curve is formed by connecting the points that correspond to the ship's position in the video.
5. Validation
5.1. Detection validation
The experiment uses the YOLOv3 model to train and verify the two datasets, MYSHIP and SEASHIP, and considers the detection capabilities of the model from the multiple evaluation indexes. To effectively evaluate the performance of the network model, we selected the accuracy rate (P), recall rate (R), false alarm rate (F), miss alarm rate (M), and average precision (AP) to assess the model's detection capability. The formulas for these metrics are as follows:
where:
True Positive (TP): correctly predicts positive samples as positive samples;
True Negative (TN): correctly predicts negative samples as negative samples;
False Positive (FP): incorrectly predicts negative samples as positive samples;
False Negative (FN): incorrectly predicts positive samples as negative samples;
We use these metrics to calculate the following performance metrics:
Accuracy rate (P): proportion of samples that are correctly detected in all test results.
Recall rate (R): proportion of actual positive samples that are correctly detected;
False alarm rate (F): proportion of negative samples that are incorrectly detected as positive samples;
Miss alarm rate (M): proportion of actual positive samples that are incorrectly detected as negative samples;
Average precision (AP): the integral value of the Precision Rate-Recall rate curve (P-R curve);
By using these metrics, we can comprehensively evaluate the detection capability of the network model. The performance of the model on the MYSHIP and SEASHIP dataset are shown in
Table 7.
Table 7 shows that the evaluation metrics of the YOLOv3 model are better on the SEASHIP dataset than on the MYSHIP dataset. This suggests that the model performs better in identifying ships in the SEASHIP dataset. It's worth noting that the system has high recognition accuracy and precision for ships in general. The MYSHIP dataset includes more distant and overlapping ships, making identification more challenging. To validate the accuracy of the model's predictions, we collected AIS data for the ships in the videos used for training and testing. This data provided accurate information about the ship types and positions.
Table 8 displays the ship categories predicted by the proposed system and the corresponding AIS data. By comparing the two datasets, we can evaluate the accuracy of the model's predictions and determine any areas for improvement.
Comparison with the AIS data indicates that the proposed system has a high accuracy in ship identification in actual scenes. The system can even detect some ships that do not have AIS equipment, such as the passenger ships in video #3 and the fishing boat in video #4. However, there are still some ships that the system fails to detect or misclassifies.
These results suggest that the proposed system has good potential for use in real-world scenarios. However, further improvements are needed to increase the accuracy of ship detection and classification. By analyzing the errors made by the system, we can identify areas for improvement and refine the model to improve its overall performance.
5.2. Location validation
The AIS terminal of the ship transmits the position at a slower rate, typically once every 10 seconds or every 2 minutes, while the proposed system detects the ship at a frequency of 30 times per second. To evaluate the accuracy of the proposed system's predictions, we extracted data for ships with AIS equipment from four videos and compared their positioning results with the corresponding AIS data. By comparing the position differences and analyzing the residual distribution, we can evaluate the accuracy of the proposed system's predictions and identify any areas for improvement.
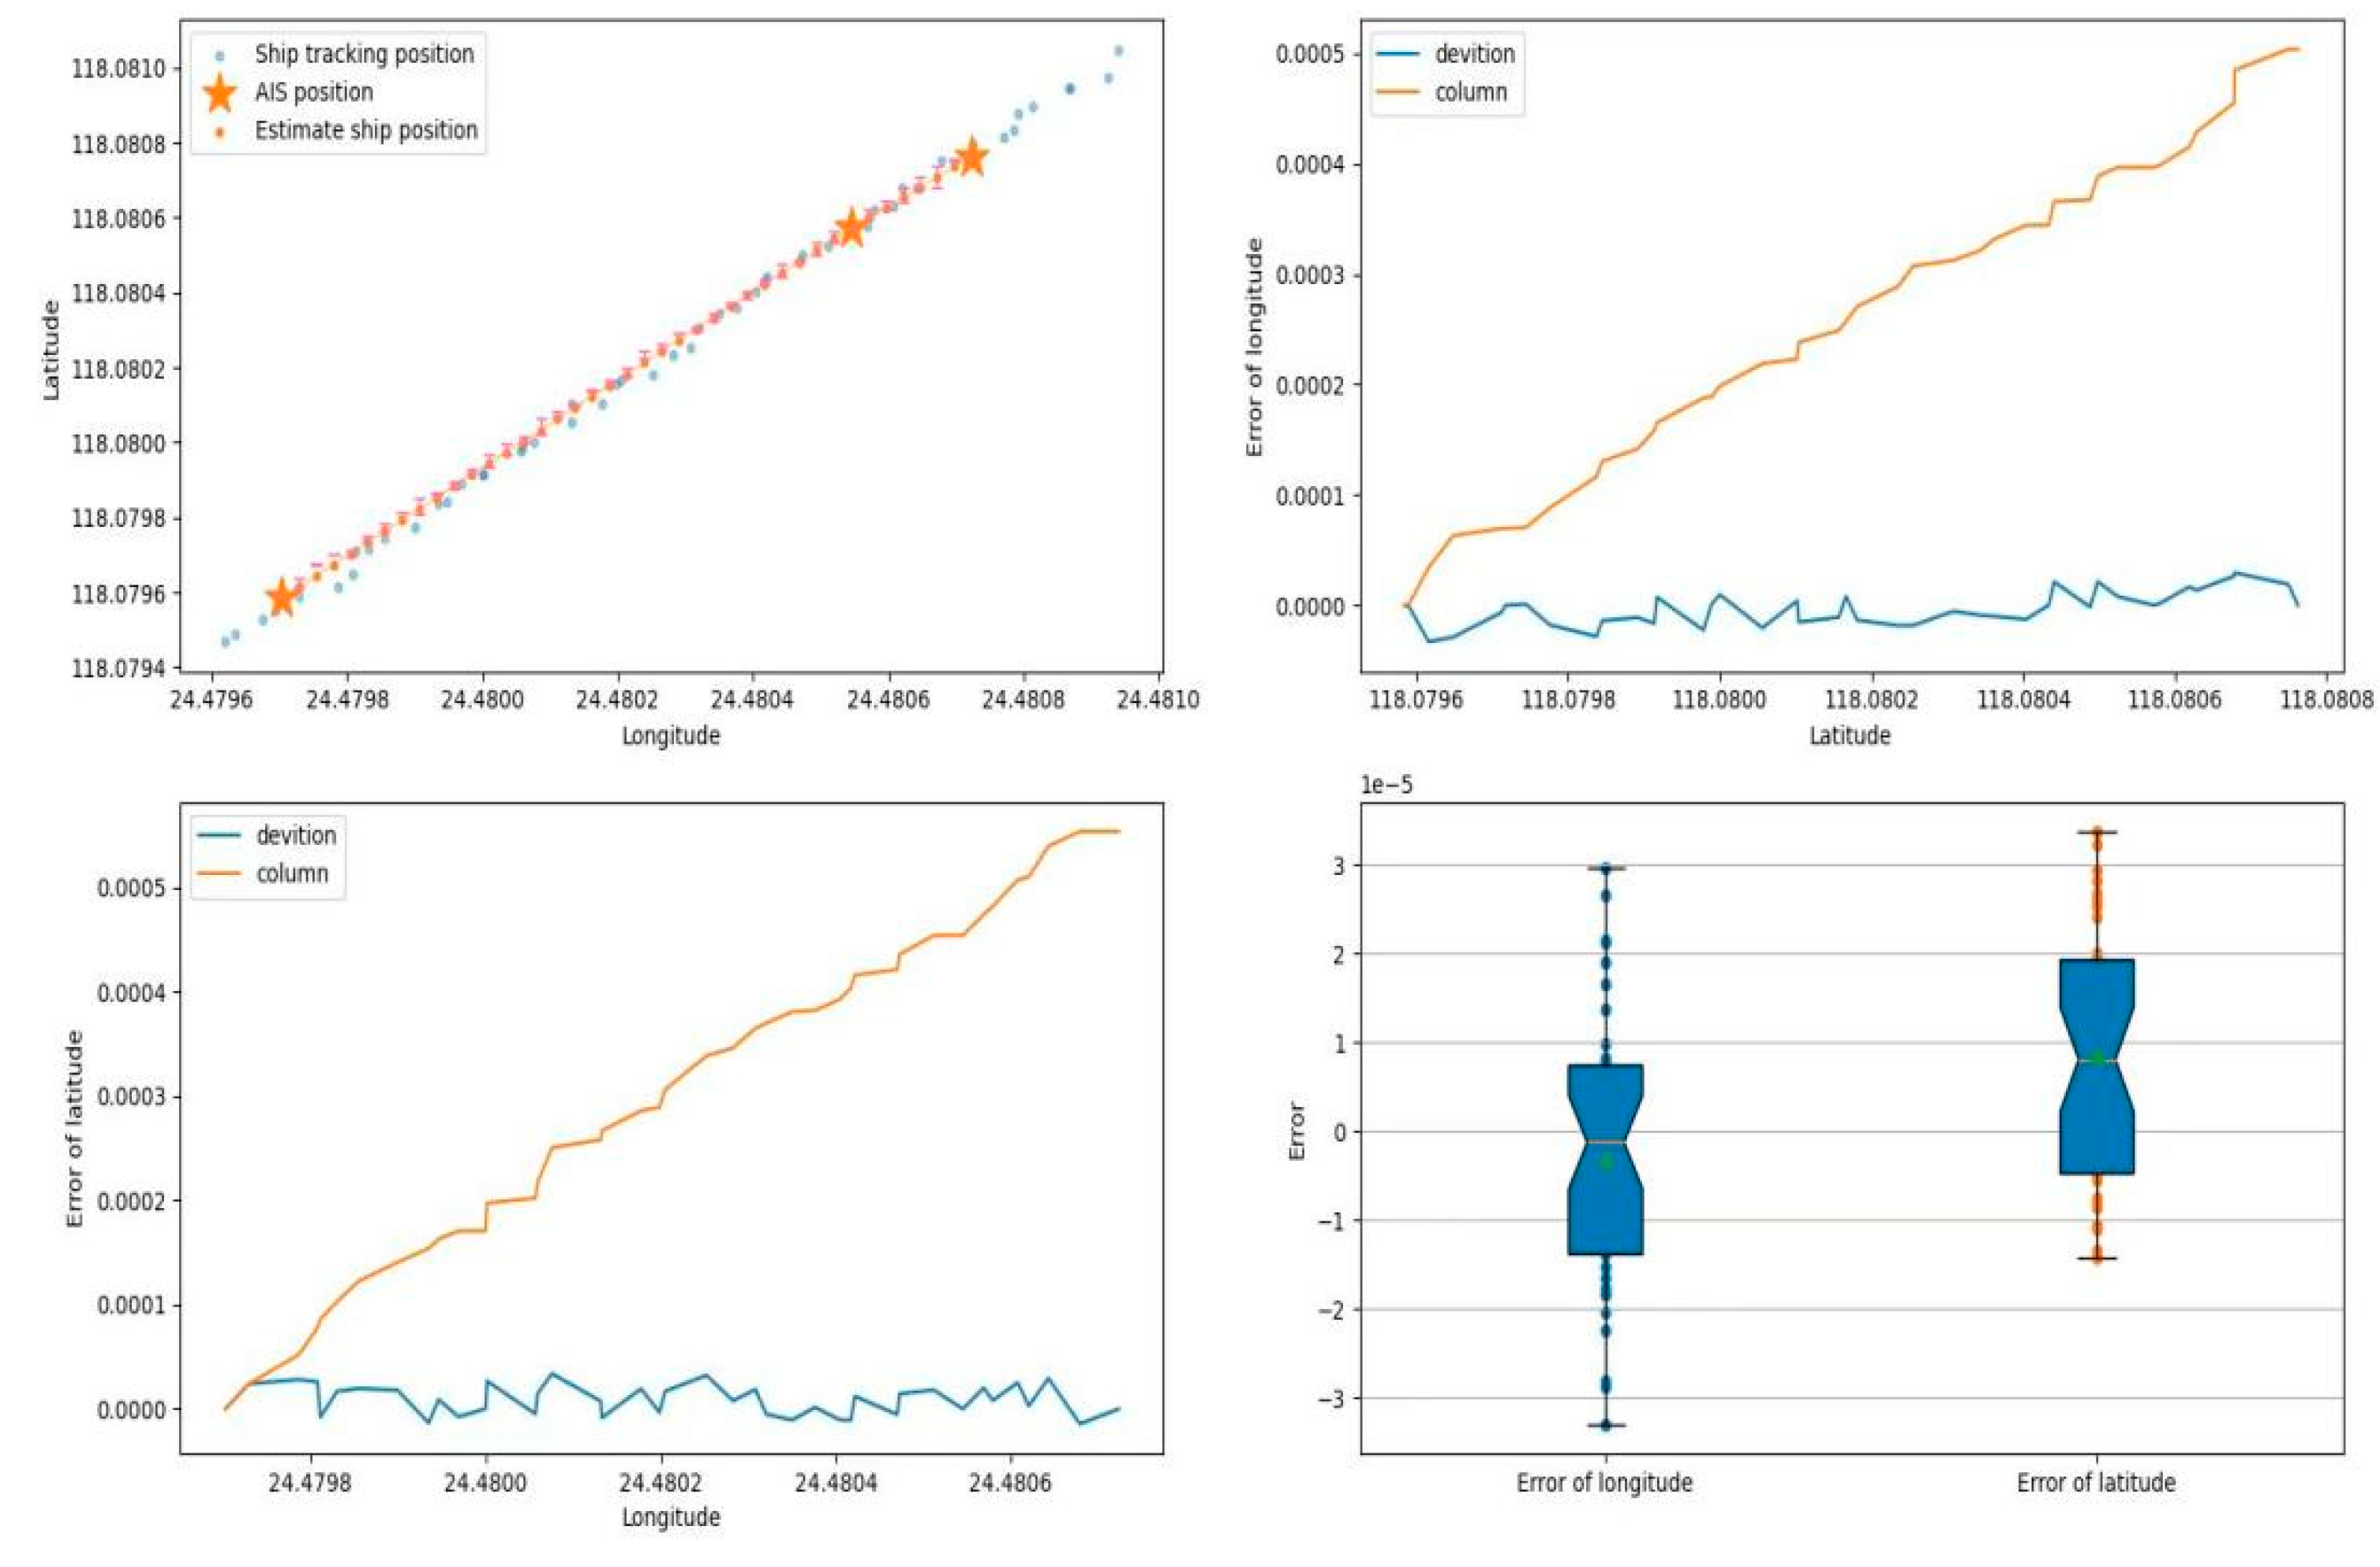
Figure 12 includes four subplots that compare the ship position distributions of the AIS data and the proposed system's output results in video #1. The first subplot compares the ship positions predicted by the system with the ais positions mentioned in the ais data. Due to the low frequency of ais, the data points obtained are significantly less than the data provided by our system, in order to compare the error between the two more obviously, we connect the ais data points and take the points on the connecting line to compare with the ship position predicted by our system. The second subplot and the third subplot are the longitude and latitude errors of the two comparisons, respectively, and the orange line represents the finite difference. The fourth subplot is a box plot of the longitude and latitude errors. Notably, the route formed by the continuous positioning of the system in the figure closely matches the driving route connected by the ship's AIS data. The residual distributions between the two indicate that the positioning accuracy of the system is con-trolled at about 1/10000 of longitude and latitude.
Table 9 provides the typical locations of ships in the four videos that the proposed system analyzed, along with their corresponding AIS data and the error between them. This data provides additional insights into the accuracy of the proposed system's predictions and can be used to further refine the model.
Based on the comparison between the system positioning and AIS positioning in the four videos, it is evident that the system positioning accuracy is relatively high, the proposed system can achieve continuous tracking with an accuracy of ±0. 0001°.
6. Discussion
A ship detection and positioning system based on machine vision is proposed to monitor and identify ships around the waters of offshore wind farms. As mentioned in Chapter 4, the proposed system has a high frequency, reaching 10fps. In terms of positioning accuracy, the results obtained by the proposed system can be accurate to 0. 0001°. Thus, the system can be used to prevent of collisions between ships and OWFs. In addition, achieving 24-hour detection and positioning of ships can reduce labor and management costs.
Compared with AIS, which is the most popular transmission detection method so far, the proposed system detects in more scenarios because small fishing boats are not obliged to install the AIS system, and AIS can be shut off. However, the proposed system is installed in the 24-hour monitoring camera outside the waters of the offshore wind farm, which will not be closed due to ships. As mentioned in Chapter 4, compared with the AIS system, the proposed system has a higher frequency, reaching 10fps. In terms of positioning accuracy, the results obtained by the proposed system can be accurate to 10 meters.
However, the proposed system above also has shortcomings. Some ships may not be recognized due to their position and orientation. When the ship drives independently and laterally, it is easy to be detected by the system. However, when the ship is longitudinal and multiple ships overlap, the system may regard these ships as obstacles and ignore them. For example, the ship in the video #3 has the lowest confidence, because among the ships detected by the system, the ship with lower confidence is characterized by a longitudinal face to the camera. This orientation makes the characteristics of the ship less obvious, so it is easy to be ignored by the system.
The solution is to add the labeled samples of each position and attitude of the ship to the training set. We will collect more data to enrich the system database and train better classifiers in the following research.
7. Conclusions
This paper proposed a ship detection and positioning system based on the YOLOv3 algorithm and stereo vision technologies, in which the framework and detailed methods used in this system are introduced. In addition, this study suggests a novel concept of using AIS data as the training resource for model training, which ensure the feasibility of using YOLOv3 and stereo vision algorithms in ship detection and tracking. By applying the proposed model in a real ship case study validates the possibility of using the YOLOv3 algorithm to track and identify ships, while the stereo vision algorithm is applied to locate ship positions. The benefit of the proposed system is that it can detect vessels automatically, achieve real-time tracking and positioning. In future work, the accuracy of ship detection and locating will be verified and the images of the ships in the MYSHIP dataset will be enriched to improve the training effect, for instance, using AIS data. The proposed system not only eases the workload of OWF operators during CCTV monitoring but also provides a possible way for ship traffic management in the water in the vicinity of OWFs. Moreover, the novel system shares the idea of using machine vision technology for ship allision prevention. Based on the analysis of the proposed system, further study can investigate applying the proposed system in ships to achieve situation forecasting.
Author Contributions
Conceptualization, validation, writing, original draft, methodology and formal analysis—H.J., X.L. and Y. H., writing, review and editing, supervision, funding acquisition—Q.Y. and M.Z. All authors have read and agreed to the published version of the manuscript.
Funding
This work is supported by National Natural Science Foundation of China under grant 52201412, Natural Science Foundation of Fujian Province under grant No. 2022J05067 and Fund of Hubei Key Laboratory of Inland Shipping Technology (NO. NHHY2021001).
Institutional Review Board Statement
Not applicable.
Informed Consent Statement
Not applicable.
Data Availability Statement
Not applicable.
Conflicts of Interest
The authors declare no conflict of interest.
References
- Vieira, M.; Henriques, E.; Snyder, B.; Reis, L. Insights on the impact of structural health monitoring systems on the operation and maintenance of offshore wind support structures. Structural Safety 2022, 94, 102154.
- Musial, W.; Spitsen, P.; Duffy, P.; Beiter, P.; Marquis, M.; Hammond, R.; Shields, M. Offshore Wind Market Report: 2022 Edition; National Renewable Energy Lab.(NREL), Golden, CO (United States): 2022.
- Torres-Rincón, S.; Bastidas-Arteaga, E.; Sánchez-Silva, M. A flexibility-based approach for the design and management of floating offshore wind farms. Renewable Energy 2021, 175, 910-925.
- Brady, R.L. Offshore Wind Industry Interorganizational Collaboration Strategies in Emergency Management. Walden University, 2022.
- Priakanth, P.; Thangamani, M.; Ganthimathi, M. WITHDRAWN: Design and development of IOT Based Maritime Monitoring Scheme for fishermen in India. Elsevier: 2021.
- Ouelmokhtar, H.; Benmoussa, Y.; Benazzouz, D.; Ait-Chikh, M.A.; Lemarchand, L. Energy-based USV maritime monitoring using multi-objective evolutionary algorithms. Ocean Engineering 2022, 253, 111182.
- Nyman, E. Techno-optimism and ocean governance: New trends in maritime monitoring. Marine Policy 2019, 99, 30-33.
- Pawar, K.; Attar, V. Deep learning based detection and localization of road accidents from traffic surveillance videos. ICT Express 2022, 8, 379-387.
- Thallinger, G.; Krebs, F.; Kolla, E.; Vertal, P.; Kasanický, G.; Neuschmied, H.; Ambrosch, K.-E. Near-miss accidents–classification and automatic detection. In Proceedings of Intelligent Transport Systems–From Research and Development to the Market Uptake: First International Conference, INTSYS 2017, Hyvinkää, Finland, November 29-30, 2017, Proceedings 1; pp. 144-152.
- Pramanik, A.; Sarkar, S.; Maiti, J. A real-time video surveillance system for traffic pre-events detection. Accident Analysis & Prevention 2021, 154, 106019.
- Root, B. HF radar ship detection through clutter cancellation. In Proceedings of Proceedings of the 1998 IEEE Radar Conference, RADARCON'98. Challenges in Radar Systems and Solutions (Cat. No. 98CH36197); pp. 281-286.
- Dzvonkovskaya, A.; Gurgel, K.-W.; Rohling, H.; Schlick, T. Low power high frequency surface wave radar application for ship detection and tracking. In Proceedings of 2008 International Conference on Radar; pp. 627-632.
- Margarit, G.; Barba Milanés, J.; Tabasco, A. Operational Ship Monitoring System Based on Synthetic Aperture Radar Processing. Remote Sensing 2009, 1, 375-392, doi:10.3390/rs1030375.
- Brekke, C. Automatic ship detection based on satellite SAR. 2008.
- Kazimierski, W.; Stateczny, A. Fusion of Data from AIS and Tracking Radar for the Needs of ECDIS. In Proceedings of 2013 Signal Processing Symposium (SPS); pp. 1-6.
- Pan, Z.; Deng, S. Vessel Real-Time Monitoring System Based on AIS Temporal Database. In Proceedings of 2009 International Conference on Information Management, Innovation Management and Industrial Engineering; pp. 611-614.
- Lin, B.; Huang, C.-H. Comparison between Arpa Radar and Ais Characteristics for Vessel Traffic Services. Journal of Marine Science and Technology 2006, 14, doi:10.51400/2709-6998.2072.
- Yu, Q.; Liu, K.; Chang, C.-H.; Yang, Z. Realising advanced risk assessment of vessel traffic flows near offshore wind farms. Reliability Engineering & System Safety 2020, 203, 107086.
- Chang, C.-H.; Kontovas, C.; Yu, Q.; Yang, Z. Risk assessment of the operations of maritime autonomous surface ships. Reliability Engineering & System Safety 2021, 207, 107324.
- Yu, Q.; Liu, K.; Teixeira, A.; Soares, C.G. Assessment of the influence of offshore wind farms on ship traffic flow based on AIS data. The Journal of Navigation 2020, 73, 131-148.
- Liu, Y.; Su, H.; Zeng, C.; Li, X. A Robust Thermal Infrared Vehicle and Pedestrian Detection Method in Complex Scenes. Sensors (Basel) 2021, 21, doi:10.3390/s21041240.
- Shao, Z.; Wang, L.; Wang, Z.; Du, W.; Wu, W. Saliency-aware convolution neural network for ship detection in surveillance video. IEEE Transactions on Circuits and Systems for Video Technology 2019, 30, 781-794.
- Chen, Z.; Li, B.; Tian, L.F.; Chao, D. Automatic detection and tracking of ship based on mean shift in corrected video sequences. In Proceedings of 2017 2nd International Conference on Image, Vision and Computing (ICIVC); pp. 449-453.
- Rahmatov, N.; Paul, A.; Saeed, F.; Hong, W.-H.; Seo, H.; Kim, J. Machine learning–based automated image processing for quality management in industrial Internet of Things. International Journal of Distributed Sensor Networks 2019, 15, 1550147719883551.
- Chávez Heras, D.; Blanke, T. On machine vision and photographic imagination. Ai & Society 2020, 36, 1153-1165.
- Cho, S.; Kwon, J. Abnormal event detection by variation matching. Machine Vision and Applications 2021, 32, doi:10.1007/s00138-021-01205-6.
- Lowe, D.G. Object recognition from local scale-invariant features. In Proceedings of Proceedings of the seventh IEEE international conference on computer vision; pp. 1150-1157.
- Orr, G.B.; Müller, K.-R. Neural networks: tricks of the trade; Springer: 1998.
- Qi, S.; Ma, J.; Lin, J.; Li, Y.; Tian, J. Unsupervised ship detection based on saliency and S-HOG descriptor from optical satellite images. IEEE geoscience and remote sensing letters 2015, 12, 1451-1455.
- Zhu, C.; He, Y.; Savvides, M. Feature selective anchor-free module for single-shot object detection. In Proceedings of Proceedings of the IEEE/CVF conference on computer vision and pattern recognition; pp. 840-849.
- Law, H.; Deng, J. Cornernet: Detecting objects as paired keypoints. In Proceedings of Proceedings of the European conference on computer vision (ECCV); pp. 734-750.
- Bochkovskiy, A.; Wang, C.-Y.; Liao, H.-Y.M. Yolov4: Optimal speed and accuracy of object detection. arXiv preprint arXiv:2004.10934 2020.
- Liu, W.; Anguelov, D.; Erhan, D.; Szegedy, C.; Reed, S.; Fu, C.-Y.; Berg, A.C. Ssd: Single shot multibox detector. In Proceedings of Computer Vision–ECCV 2016: 14th European Conference, Amsterdam, The Netherlands, October 11–14, 2016, Proceedings, Part I 14; pp. 21-37.
- Girshick, R.; Donahue, J.; Darrell, T.; Malik, J. Rich feature hierarchies for accurate object detection and semantic segmentation. In Proceedings of Proceedings of the IEEE conference on computer vision and pattern recognition; pp. 580-587.
- Meng, C.; Bao, H.; Ma, Y.; Xu, X.; Li, Y. Visual Meterstick: Preceding Vehicle Ranging Using Monocular Vision Based on the Fitting Method. Symmetry 2019, 11, doi:10.3390/sym11091081.
- Zhao, Y.; Zhao, L.; Xiong, B.; Kuang, G. Attention receptive pyramid network for ship detection in SAR images. IEEE Journal of Selected Topics in Applied Earth Observations and Remote Sensing 2020, 13, 2738-2756.
- Redmon, J.; Divvala, S.; Girshick, R.; Farhadi, A. You only look once: Unified, real-time object detection. In Proceedings of Proceedings of the IEEE conference on computer vision and pattern recognition; pp. 779-788.
- Gong, H.; Li, H.; Xu, K.; Zhang, Y. Object detection based on improved YOLOv3-tiny. In Proceedings of 2019 Chinese automation congress (CAC); pp. 3240-3245.
- Li, J.; Qu, C.; Shao, J. Ship detection in SAR images based on an improved faster R-CNN. In Proceedings of 2017 SAR in Big Data Era: Models, Methods and Applications (BIGSARDATA); pp. 1-6.
- Li, Y.; Rong, L.; Li, R.; Xu, Y. Fire Object Detection Algorithm Based on Improved YOLOv3-tiny. In Proceedings of 2022 7th International Conference on Cloud Computing and Big Data Analytics (ICCCBDA); pp. 264-269.
- Ren, S.; He, K.; Girshick, R.; Sun, J. Faster r-cnn: Towards real-time object detection with region proposal networks. Advances in neural information processing systems 2015, 28.
- Campbell, J.; Sukthankar, R.; Nourbakhsh, I.; Pahwa, A. A robust visual odometry and precipice detection system using consumer-grade monocular vision. In Proceedings of Proceedings of the 2005 IEEE International Conference on robotics and automation; pp. 3421-3427.
- Matthies, L.; Shafer, S. Error modeling in stereo navigation. IEEE Journal on Robotics and Automation 1987, 3, 239-248.
- Davison, A.J. Real-time simultaneous localisation and mapping with a single camera. In Proceedings of Computer Vision, IEEE International Conference on; pp. 1403-1403.
- Schwartzkroin, P.A. Neural Mechanisms: Synaptic Plasticity. Molecular, Cellular, and Functional Aspects. Michel Baudry, Richard F. Thompson, and Joel L. Davis, Eds. MIT Press, Cambridge, MA, 1993. xiv, 263 pp., illus. $50 or£ 44.95. Science 1994, 264, 1179-1180.
- Howard, I.P.; Rogers, B.J. Binocular vision and stereopsis; Oxford University Press, USA: 1995.
- Xu, Y.; Zhao, Y.; Wu, F.; Yang, K. Error analysis of calibration parameters estimation for binocular stereo vision system. In Proceedings of 2013 IEEE International Conference on Imaging Systems and Techniques (IST); pp. 317-320.
- Yu, Y.; Tingting, W.; Long, C.; Weiwei, Z. Stereo vision based obstacle avoidance strategy for quadcopter UAV. In Proceedings of 2018 Chinese Control And Decision Conference (CCDC); pp. 490-494.
- Sun, X.; Jiang, Y.; Ji, Y.; Fu, W.; Yan, S.; Chen, Q.; Yu, B.; Gan, X. Distance measurement system based on binocular stereo vision. In Proceedings of IOP Conference Series: Earth and Environmental Science; p. 052051.
- Wang, C.; Zou, X.; Tang, Y.; Luo, L.; Feng, W. Localisation of litchi in an unstructured environment using binocular stereo vision. Biosystems Engineering 2016, 145, 39-51, doi:10.1016/j.biosystemseng.2016.02.004.
- Zou, X.; Zou, H.; Lu, J. Virtual manipulator-based binocular stereo vision positioning system and errors modelling. Machine Vision and Applications 2012, 23, 43-63.
- Zuo, X.; Xie, X.; Liu, Y.; Huang, G. Robust visual SLAM with point and line features. In Proceedings of 2017 IEEE/RSJ International Conference on Intelligent Robots and Systems (IROS); pp. 1775-1782.
| 1 |
1000 images of inland ships were captured at Bay Park, Xiamen Bridge, and Gao Qi Wharf in Xiamen City, Fujian Province |
Figure 1.
Development of machine vision for object detection.
Figure 1.
Development of machine vision for object detection.
Figure 2.
The framework and the sub-model for the monitoring system.
Figure 2.
The framework and the sub-model for the monitoring system.
Figure 3.
This is a figure describing the structure of the YOLOv3 model.
Figure 3.
This is a figure describing the structure of the YOLOv3 model.
Figure 4.
(a) This is a figure describing the prediction result of 13×13 scale; (b) This is a figure describing the prediction result of 26×26 scale; (c) This is a figure describing the prediction result of 52×52 scale.
Figure 4.
(a) This is a figure describing the prediction result of 13×13 scale; (b) This is a figure describing the prediction result of 26×26 scale; (c) This is a figure describing the prediction result of 52×52 scale.
Figure 5.
This is a figure describing the structure of the locating model.
Figure 5.
This is a figure describing the structure of the locating model.
Figure 6.
This is a figure describing the checkerboard calibration.
Figure 6.
This is a figure describing the checkerboard calibration.
Figure 7.
(a) This is a figure describing the labeling of video; (b) This is a figure describing the labeling of video.
Figure 7.
(a) This is a figure describing the labeling of video; (b) This is a figure describing the labeling of video.
Figure 8.
(a)This is a figure describing the typical detection results of ship category on the collected video #1; (b)This is a figure describing the typical detection results of ship category on the collected video #2; (c)This is a figure describing the typical detection results of ship category on the collected video #3; (d)This is a figure describing the typical detection results of ship category on the collected video #4.
Figure 9.
(a)This is a figure describing the typical detection result of ship category and confidence of the collected video #1; (b)This is a figure describing the typical detection result of ship category and confidence of the collected video #2; (c)This is a figure describing the typical detection result of ship category and confidence of the collected video #3; (d)This is a figure describing the typical detection result of ship category and confidence of the collected video #4;.
Figure 11.
(a)This is a figure shows the ship position distributions in world coordinates of the collected video #1; (b)This is a figure shows the ship position distributions in world coordinates of the collected video #2; (c)This is a figure shows the ship position distributions in world coordinates of the collected video #3; (d)This is a figure shows the ship position distributions in world coordinates of the collected video #4.
Figure 12.
The comparison between the AIS data and the system output result.
Figure 12.
The comparison between the AIS data and the system output result.
Table 1.
This is a table shows the six typical ships in the sample set.
Table 2.
This is a table shows the division of the dataset.
Table 2.
This is a table shows the division of the dataset.
| Dataset |
Number of samples |
Number of ships |
| MYSHIP |
SEASHIP |
MYSHIP |
SEASHIP |
| Training set |
600 |
4200 |
1334 |
4934 |
| Validation set |
200 |
1400 |
444 |
1610 |
| Test set |
200 |
1400 |
446 |
1669 |
| Total |
1000 |
7000 |
2224 |
8213 |
Table 3.
This is a table shows the hardware parameters of the camera.
Table 3.
This is a table shows the hardware parameters of the camera.
| Parameter name |
Parameter |
Unit |
| wide-angle |
135 |
° |
| Focal-length |
534.31 |
1/mm |
| Principal-point |
(342.64,234.42) |
mm |
Table 4.
This is a table shows the calibration parameters.
Table 4.
This is a table shows the calibration parameters.
|
Setting
|
Intrinsic Matrix
|
Rotation
|
Translation
|
Distortion
|
|
pixel
|
m
|
m
|
m
|
|
Left camera
|
|
|
|
|
|
Right camera
|
|
|
|
|
Table 5.
This is a table shows the details for the collected video clips.
Table 5.
This is a table shows the details for the collected video clips.
| No. |
Frame rate(fps) |
Image resolution |
Duration(s) |
Category |
Ship status |
| video#1 |
30 |
720×1280 |
150 |
Container ship |
Moving |
| video#2 |
30 |
2160×3840 |
60 |
Bulk cargo carrier |
Static |
| video#3 |
30 |
2160×3840 |
480 |
Passenger ship |
Static |
| video#4 |
30 |
2160×3840 |
60 |
Passenger ship
Fishing boat |
Moving
Static |
Table 6.
This is a table shows the confidence results for the four videos.
Table 6.
This is a table shows the confidence results for the four videos.
| No. |
Minimum confidence |
Maximum confidence |
Average confidence |
| Video#1 |
0.95 |
1.00 |
0.97 |
| Video#2 |
0.99 |
1.00 |
0.99 |
| Video#3 |
0.50 |
0.94 |
0.76 |
| Video#4 |
0.53 |
0.84 |
0.72 |
Table 7.
This is a table shows the performance of the YOLOv3 model on the dataset.
Table 7.
This is a table shows the performance of the YOLOv3 model on the dataset.
| Dataset |
Precision/% |
False/% |
Miss/% |
AP/% |
| MYSHIP |
87.64 |
12.36 |
15.7 |
81.24 |
| SEASHIP |
89.23 |
10.77 |
10.07 |
89.67 |
Table 8.
This is a table shows the ship category of proposed system results and AIS data.
Table 8.
This is a table shows the ship category of proposed system results and AIS data.
| |
Video #1 |
Video #2 |
Video #3 |
Video #4 |
| System result |
Container ship |
General cargo ship |
Passenger ship×5
General cargo ship×2 |
Fishing boat
Passenger ship |
| AIS data |
Container ship |
General cargo ship |
Passenger ship×2 |
Passenger ship |
Table 9.
This is a table shows the comparison between the AIS data and the system output result.
Table 9.
This is a table shows the comparison between the AIS data and the system output result.
| |
|
Sample#1 |
Sample#2 |
Sample#3 |
Sample#4 |
| System output |
Longitude |
118.0796 E |
118.1074 E |
118.1081 E |
118.1117E |
| Latitude |
24.4806 N |
24.5521 N |
24.5466 N |
24.5579N |
| AIS data(°) |
Longitude |
118.07962 E |
118.10737 E |
118.10814 E |
118.11169E |
| Latitude |
24.48064 N |
24.55212 N |
24.54661 N |
24.55791N |
| Error(°) |
Longitude |
0.00002 |
-0.00003 |
0.00004 |
-0.00001 |
| Latitude |
0.00004 |
0.00002 |
0.00001 |
0.00001 |
|
Disclaimer/Publisher’s Note: The statements, opinions and data contained in all publications are solely those of the individual author(s) and contributor(s) and not of MDPI and/or the editor(s). MDPI and/or the editor(s) disclaim responsibility for any injury to people or property resulting from any ideas, methods, instructions or products referred to in the content. |
© 2023 by the authors. Licensee MDPI, Basel, Switzerland. This article is an open access article distributed under the terms and conditions of the Creative Commons Attribution (CC BY) license (https://creativecommons.org/licenses/by/4.0/).


