Submitted:
17 April 2023
Posted:
17 April 2023
You are already at the latest version
Abstract
Keywords:
1. Introduction
2. Materials and Methods
2.1. Reagents and materials
2.2. The detection of the fluorescence
2.3. The one single tube reaction
2.4. Method validation
2.5. The real plasma samples
3. Result and discussion
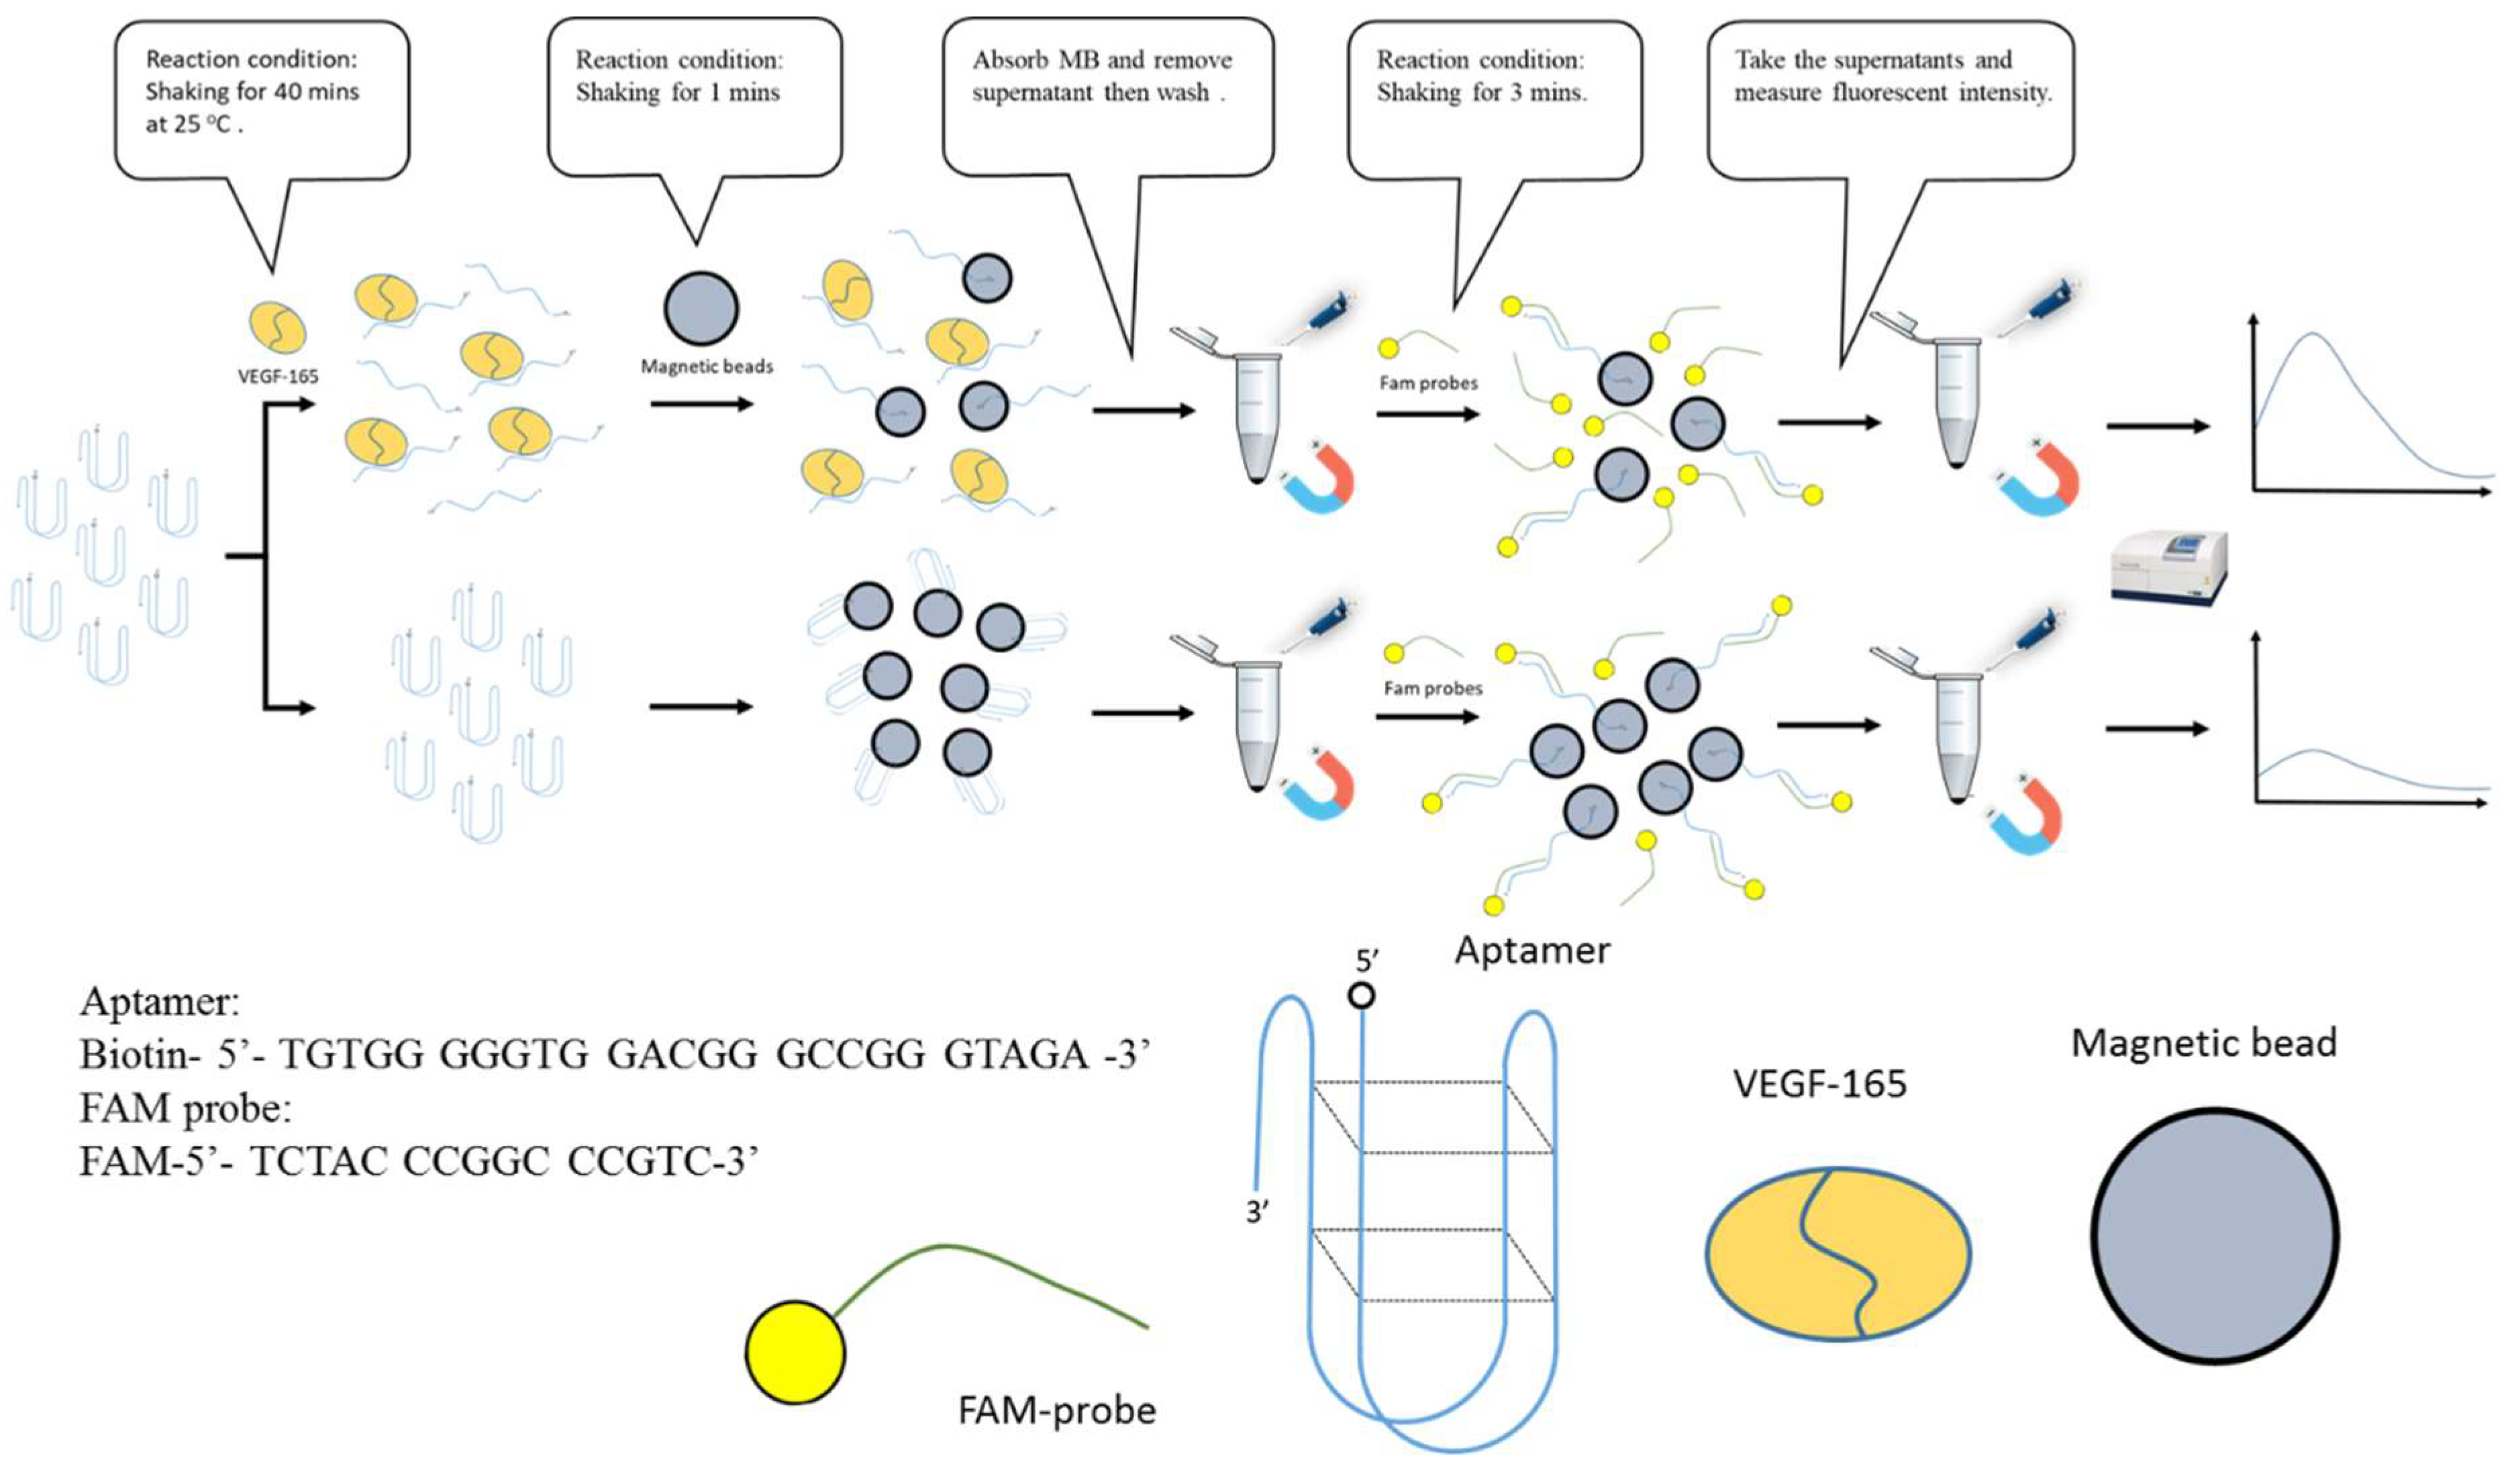
3.1. The mechanism of one single tube reaction of aptasensor-based magnetic sensing system
3.2. The method optimization
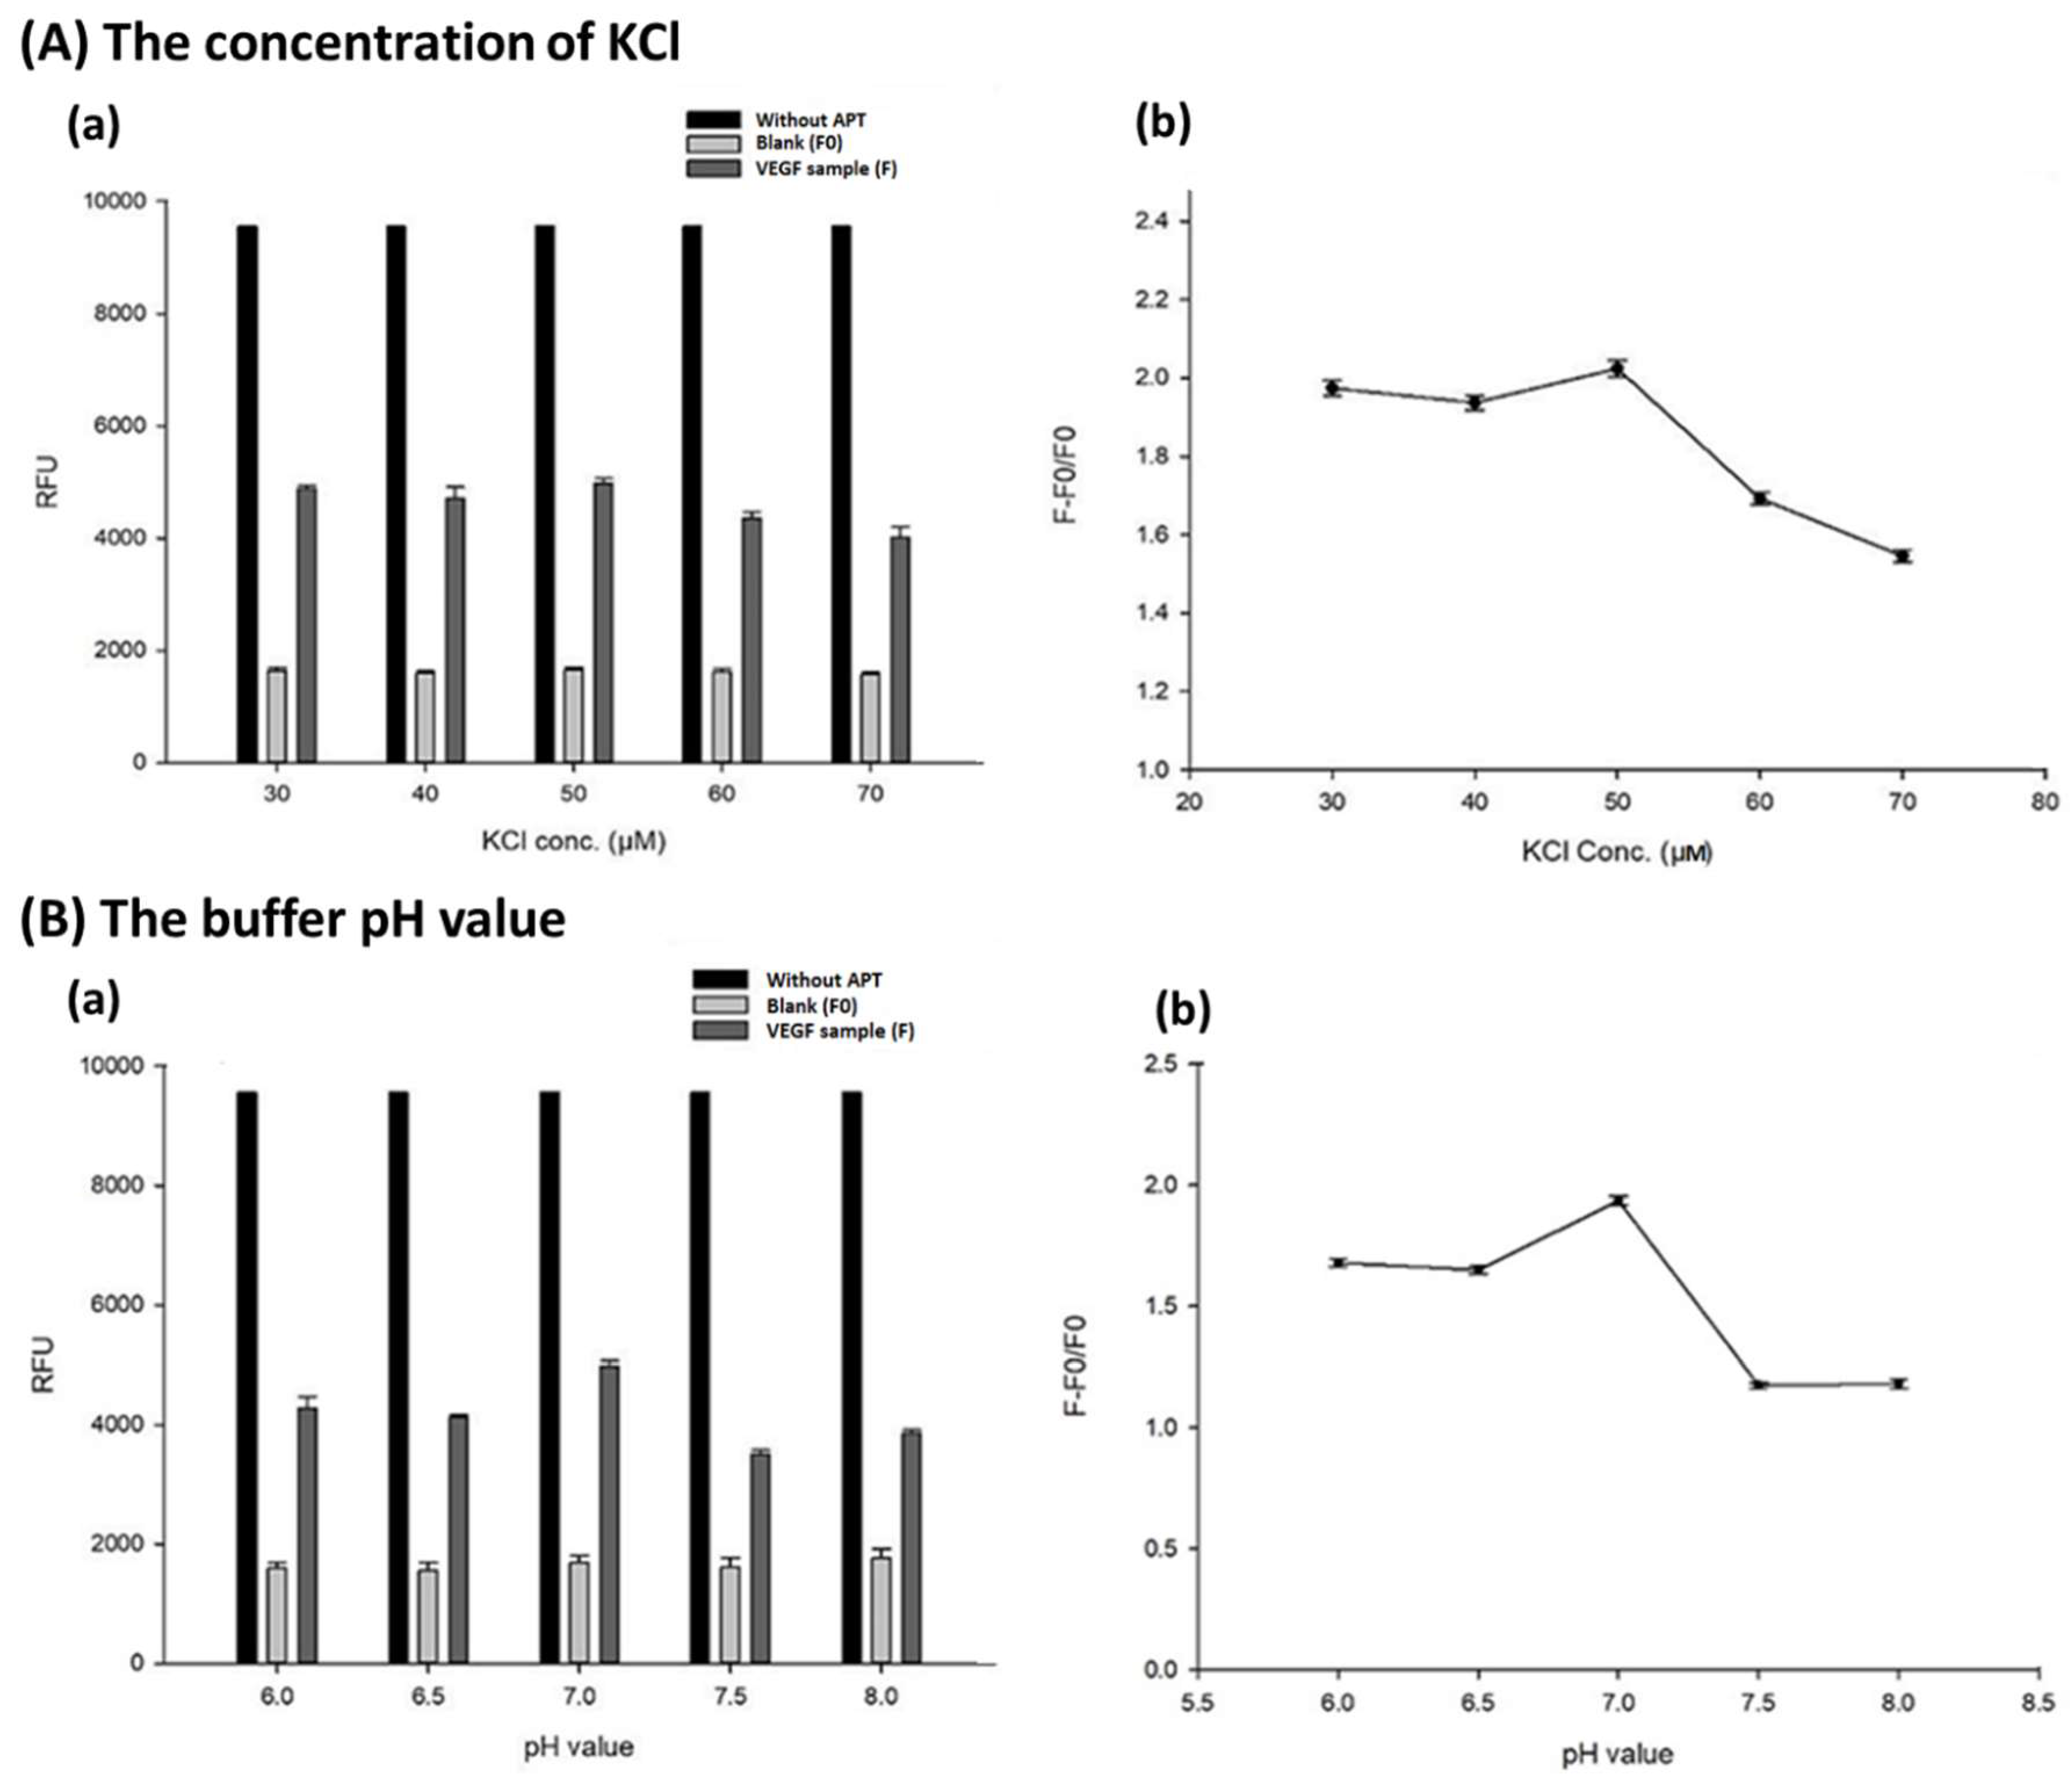
3.2.1. The concentration of KCl and the buffer pH value
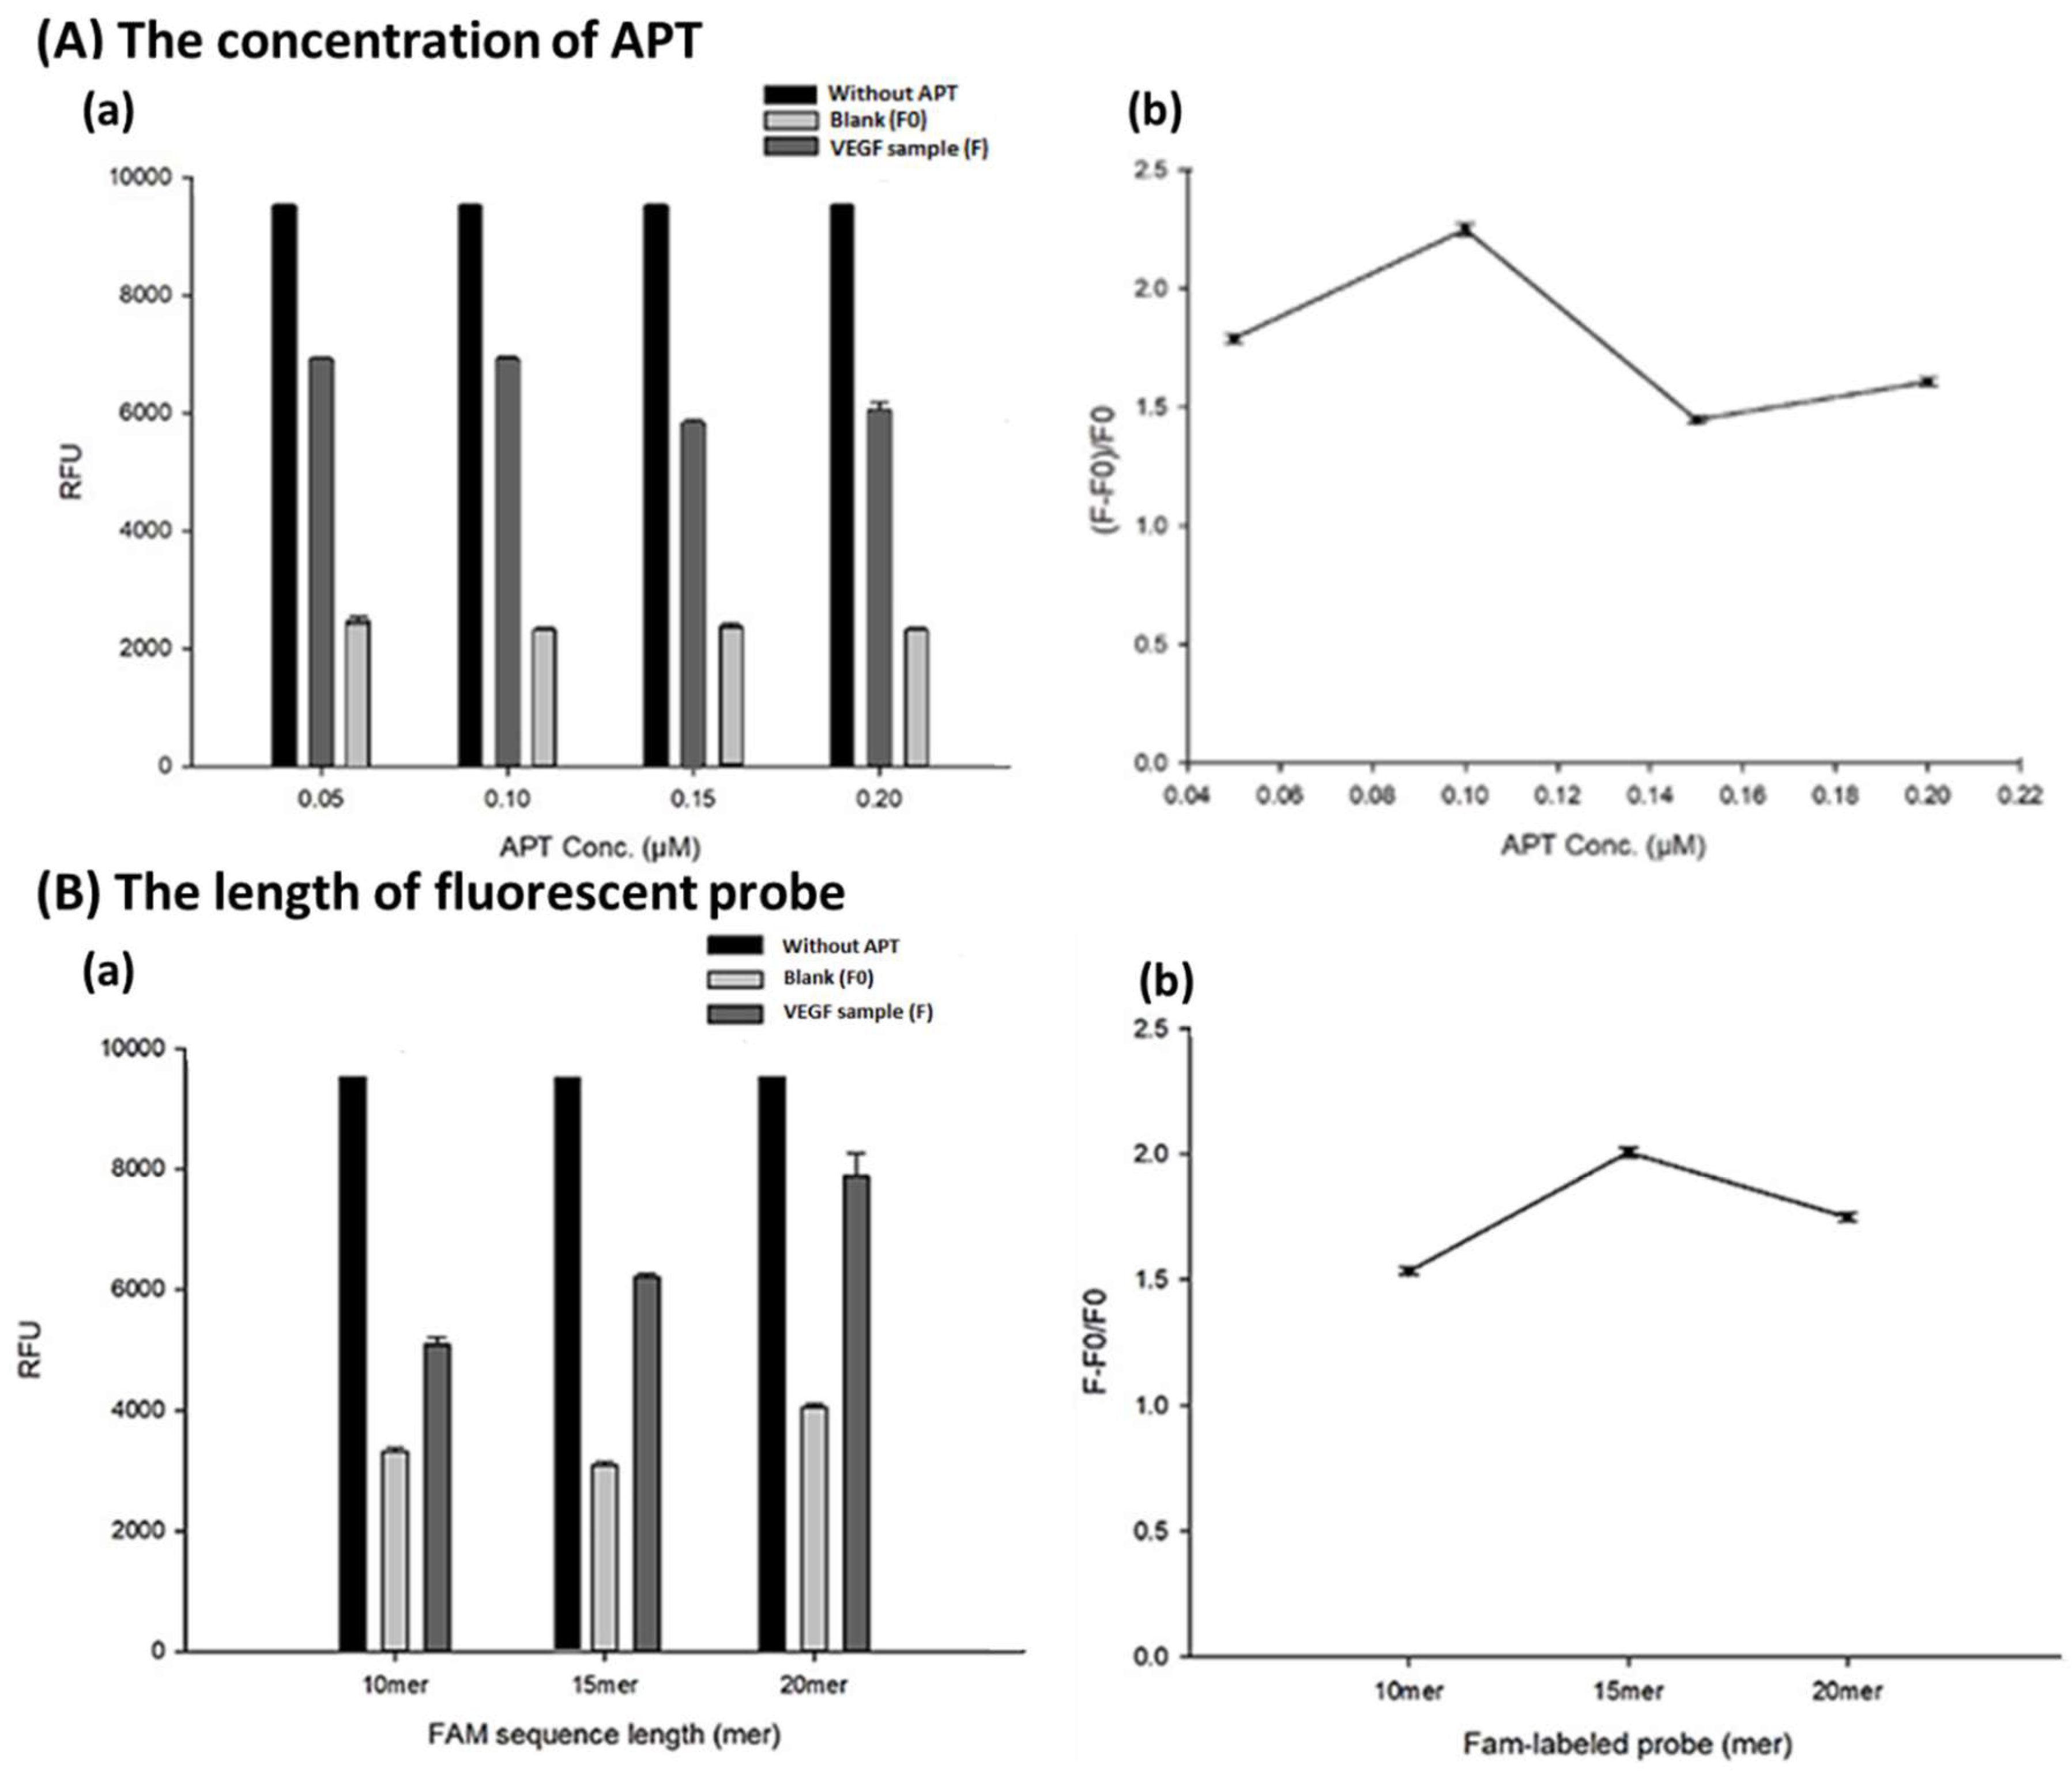
3.2.2. The concentration of APT and the length of fluorescent probe
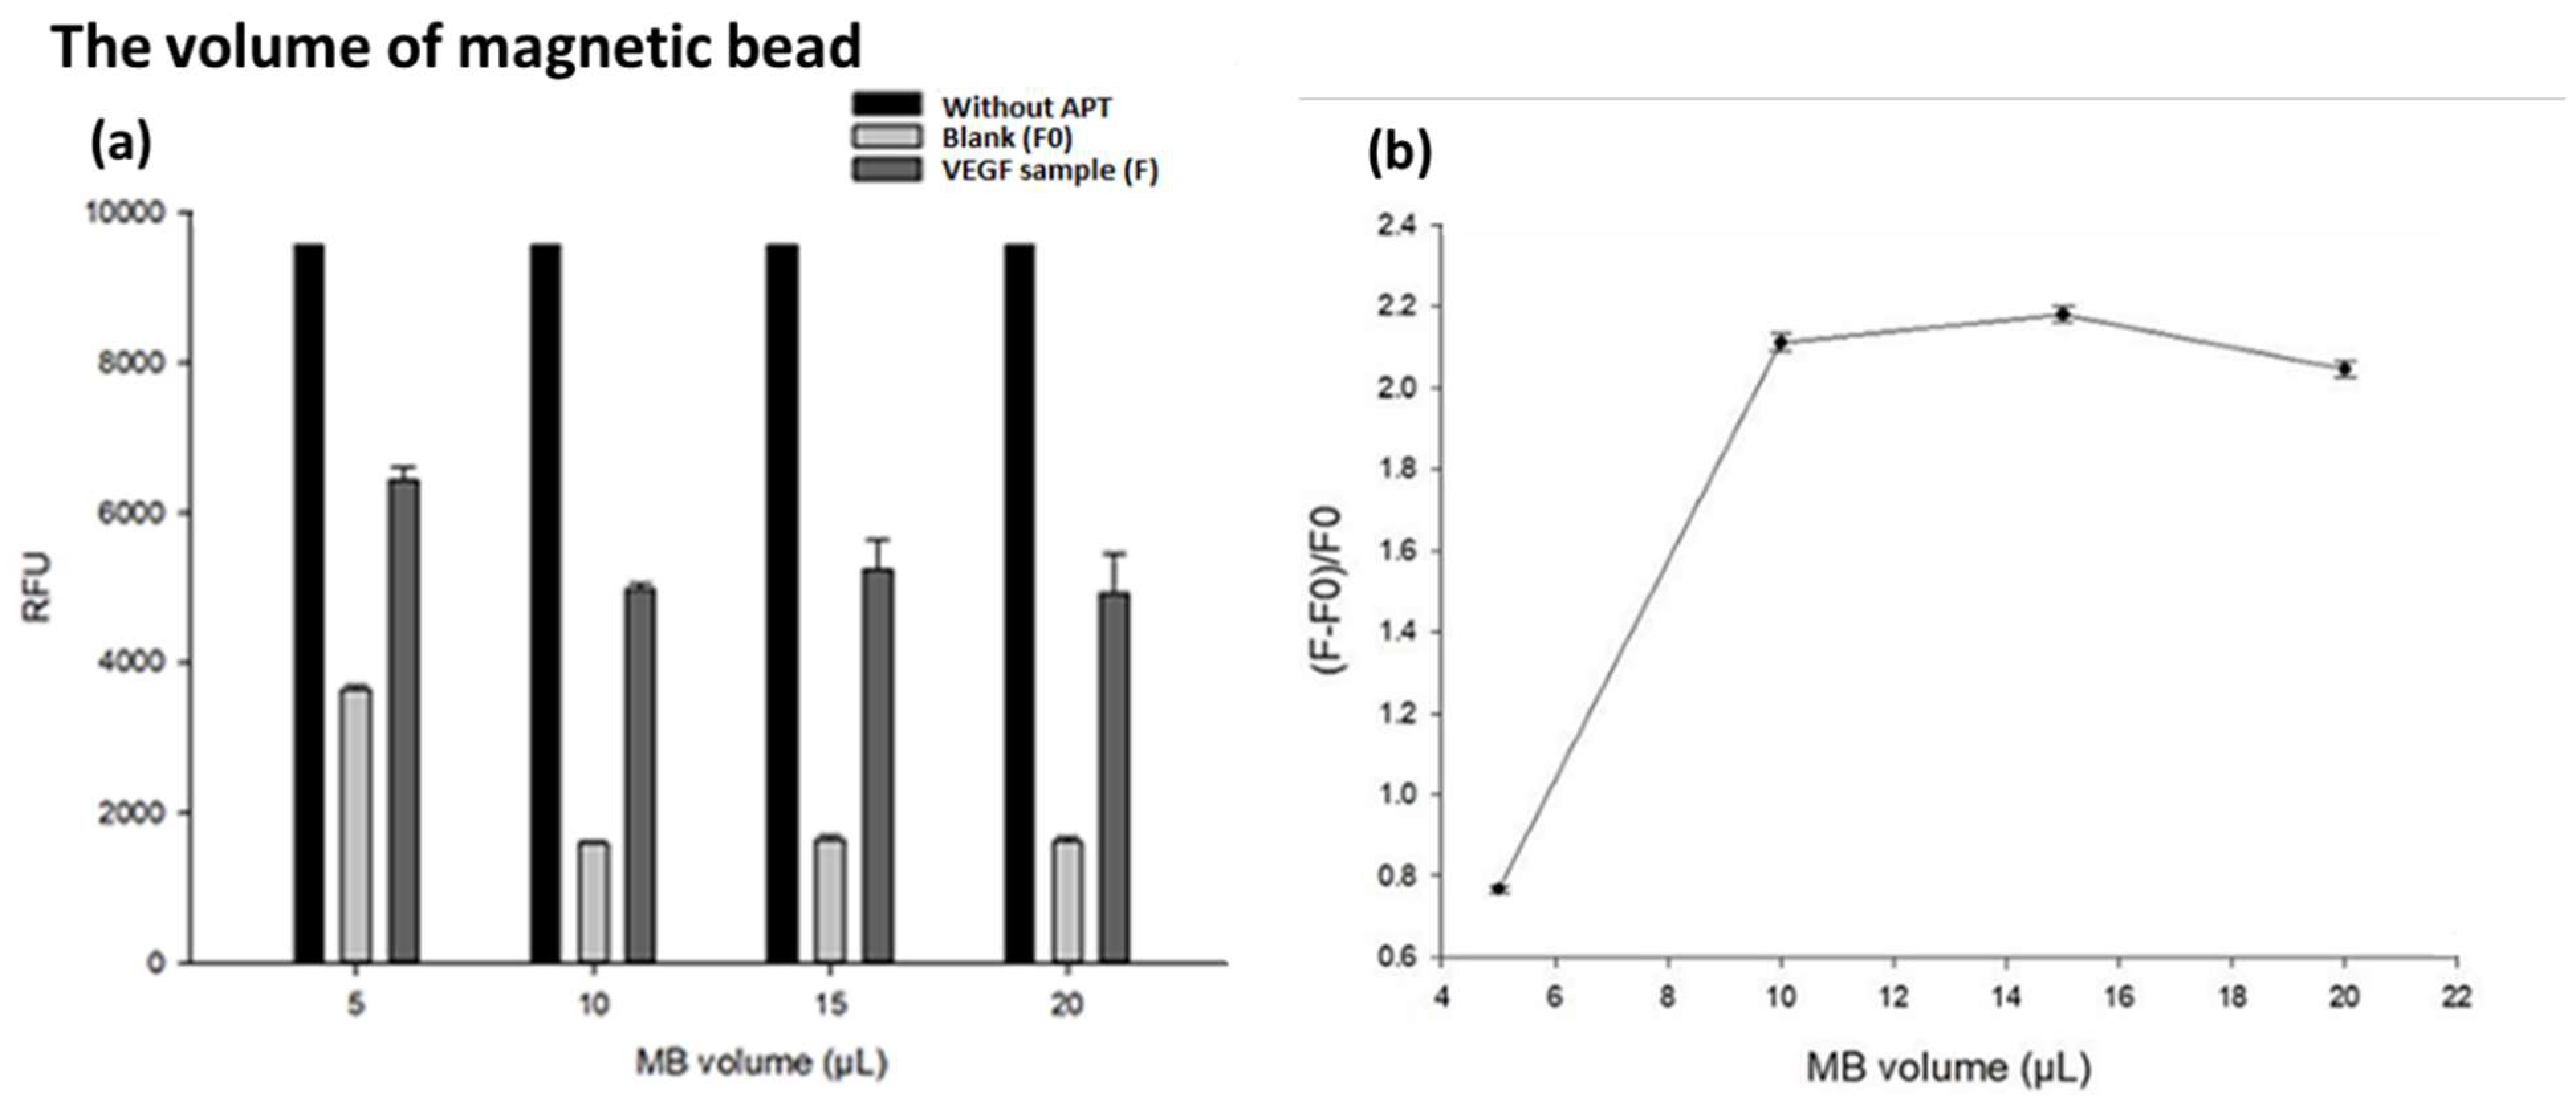
3.2.3. The volume of magnetic bead (MBs)
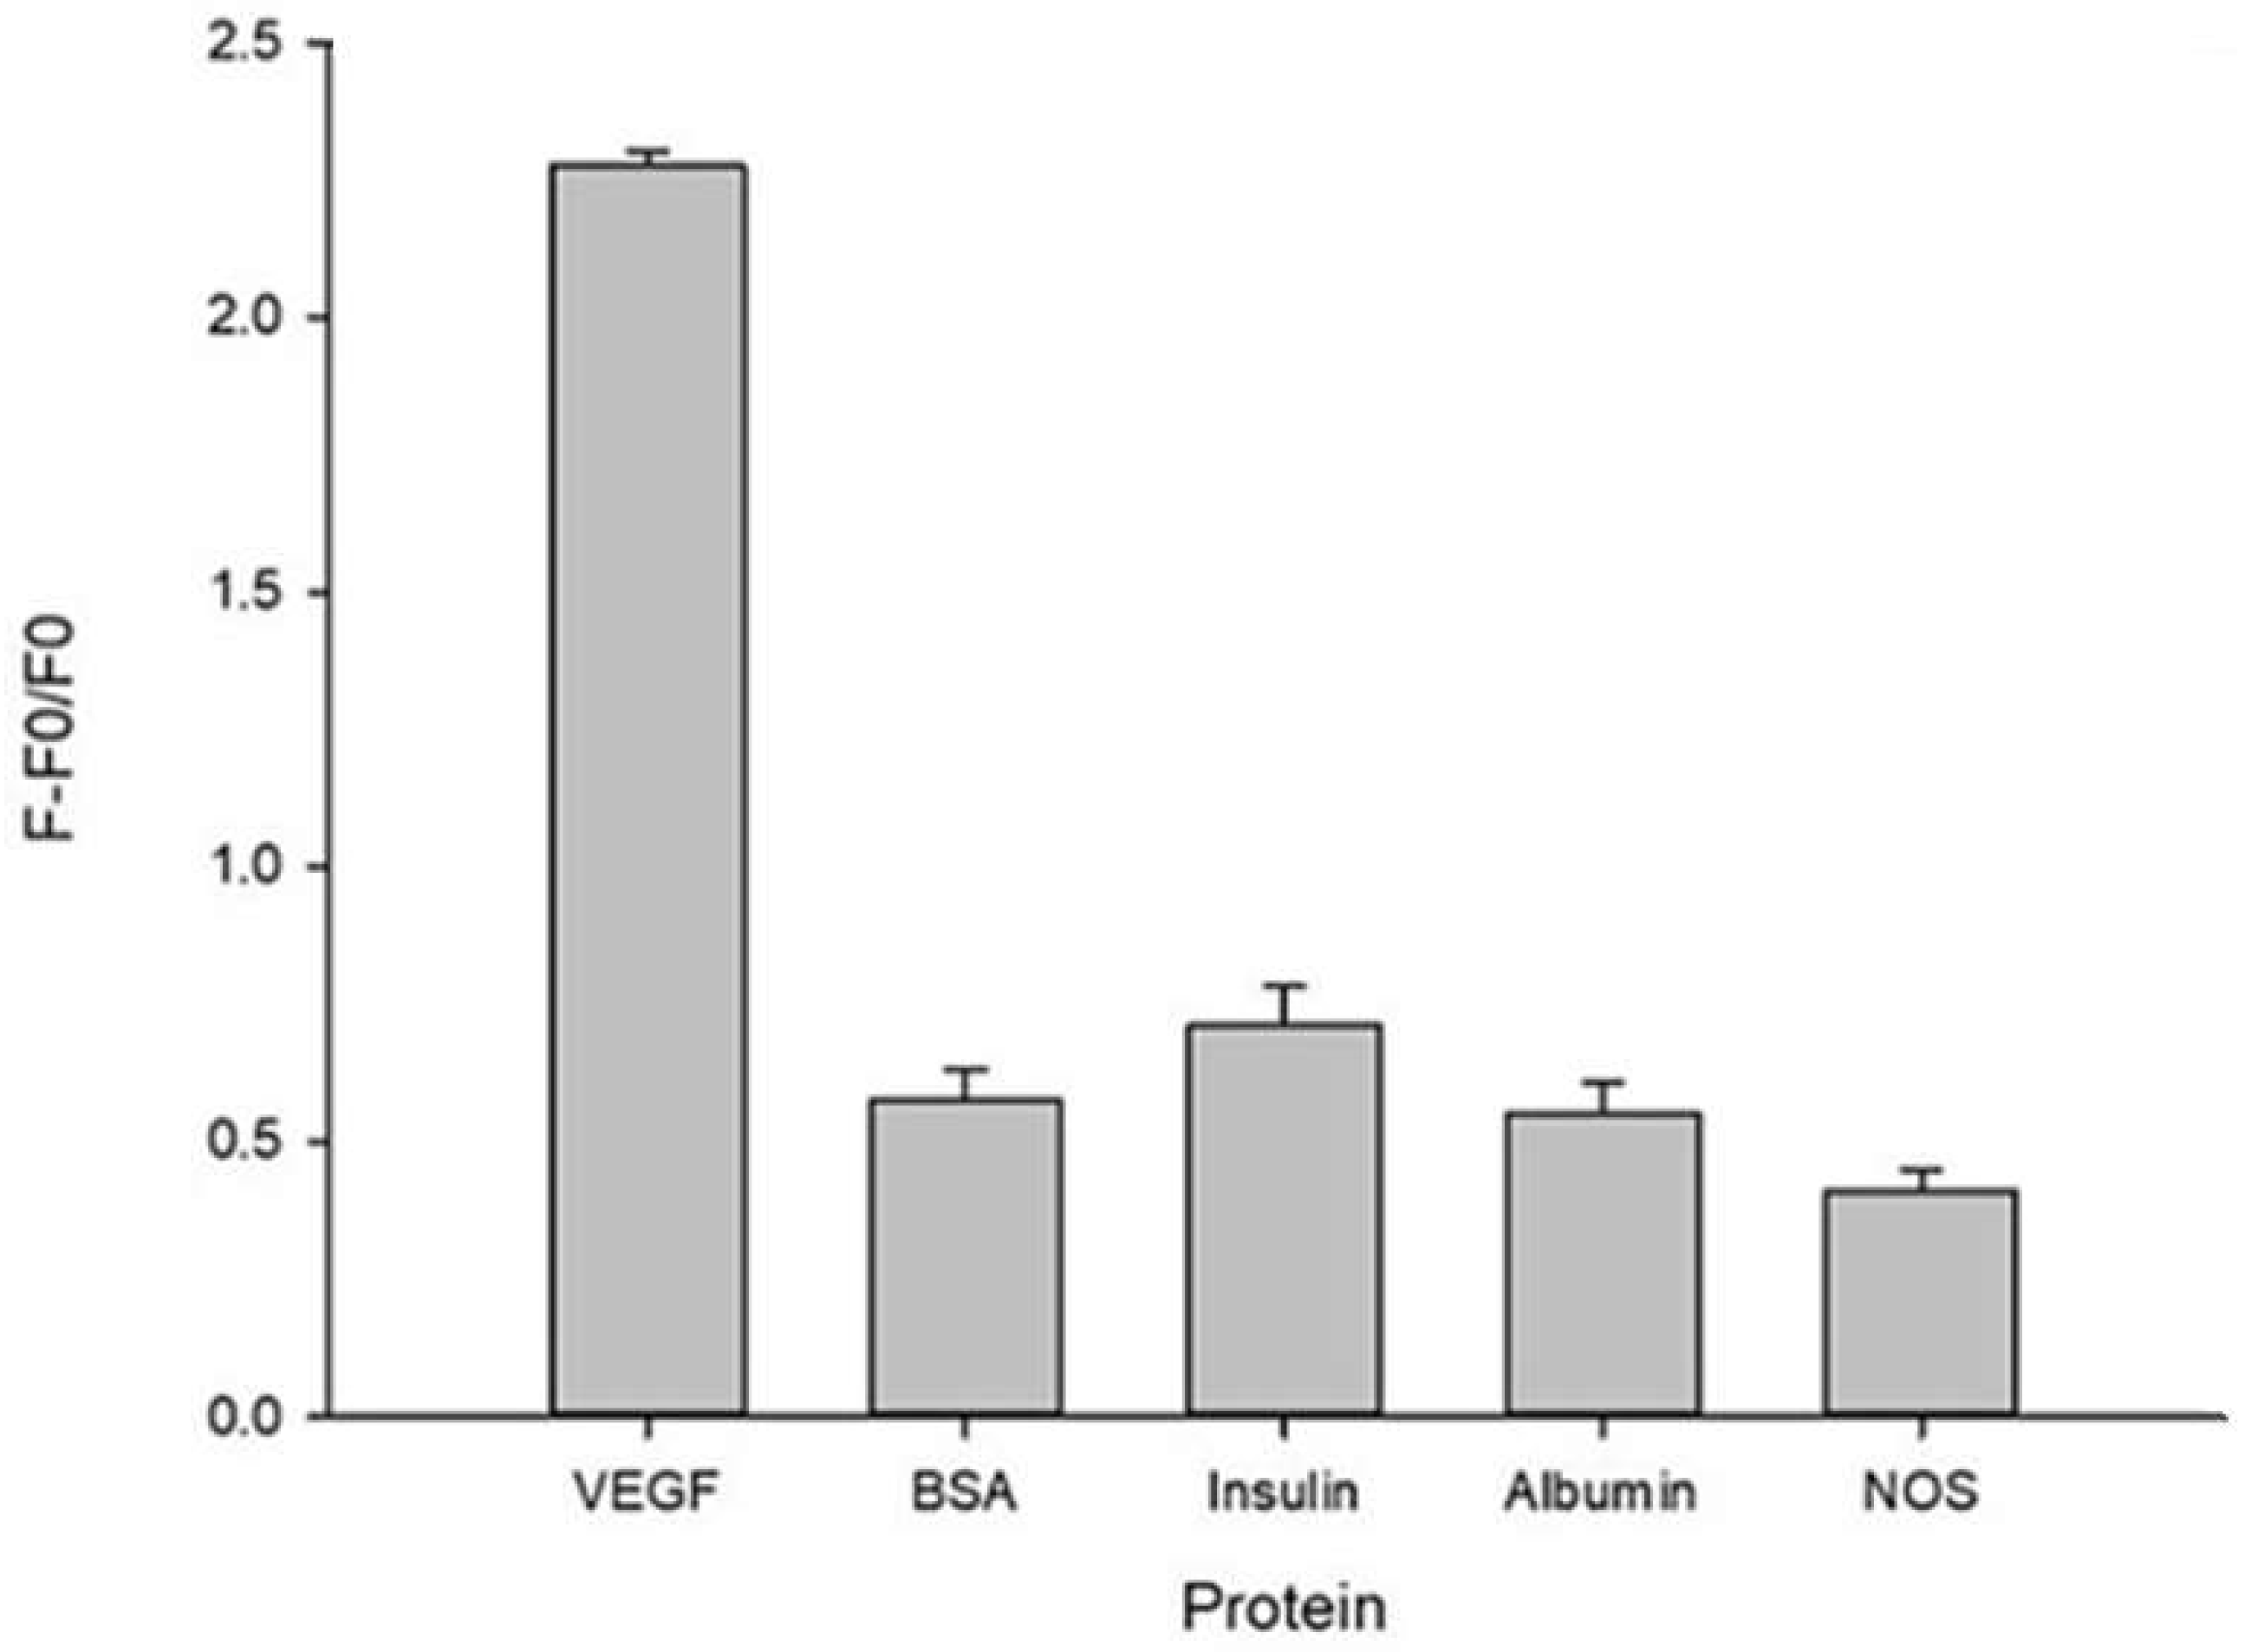
3.3. The specificity test of the aptasensor system
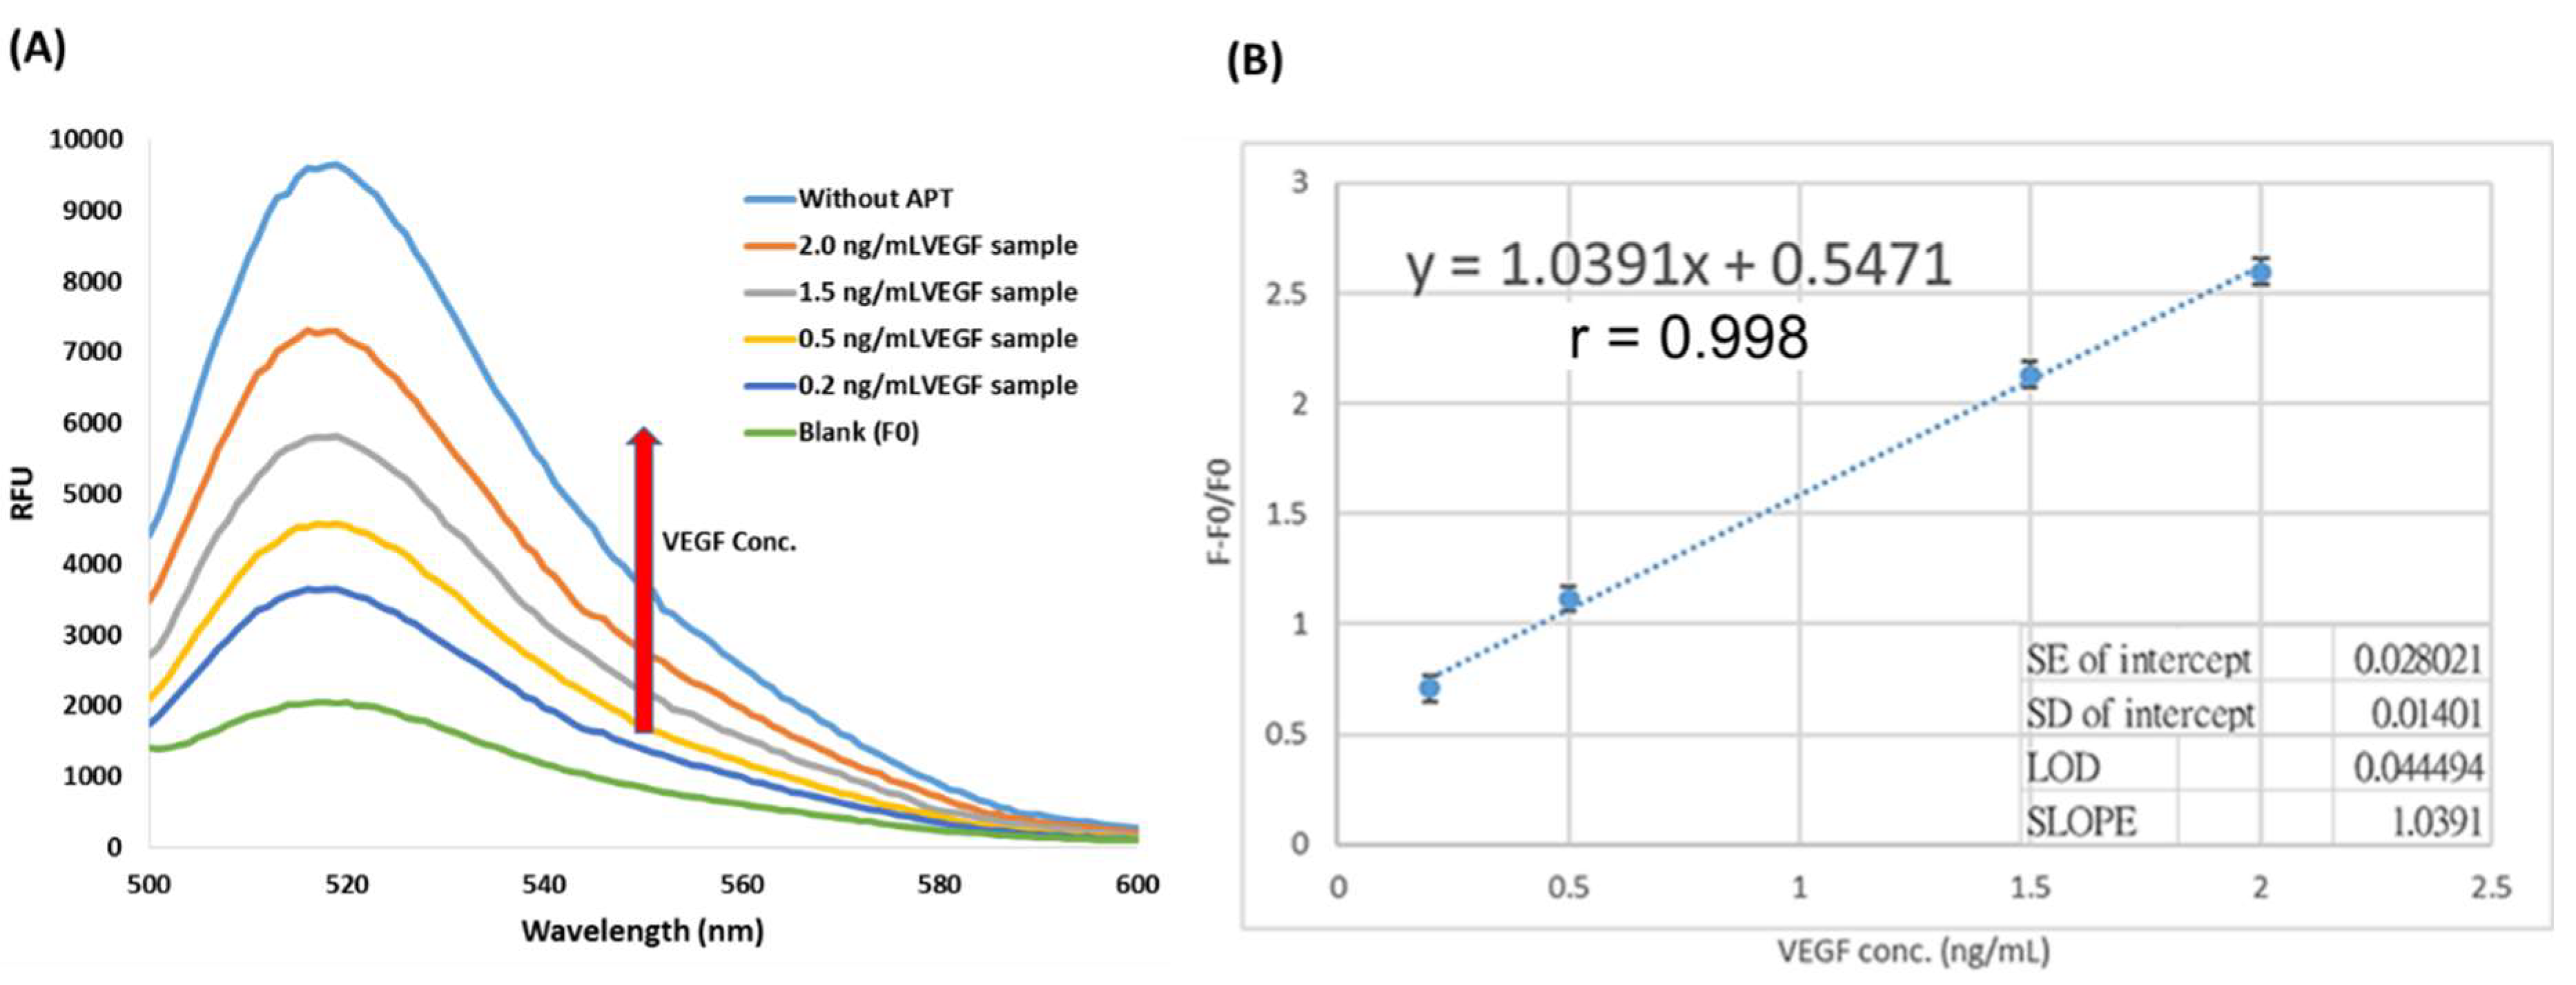
3.4. The application for real plasma samples
4. Conclusions
Author Contributions
Institutional Review Board Statement
Informed Consent Statement
Data Availability Statement
Acknowledgments
Conflicts of Interest
References
- Haukanes, B.-I.; Kvam, C. Application of magnetic beads in bioassays. Biotechnology 1993, 11, 60–63. [Google Scholar] [CrossRef] [PubMed]
- Wilson, R. Preparation of single-stranded DNA from PCR products with streptavidin magnetic beads. Nucleic Acid Ther. 2011, 21, 437–440. [Google Scholar] [CrossRef] [PubMed]
- Tu, S.I.; Uknalis, J.; Irwin, P.; Yu, L.S. The use of streptavidin coated magnetic beads for detecting pathogenic bacteria by light addressable potentiometric sensor (LAPS). J. rapid methods autom. micribiol. 2000, 8, 95–109. [Google Scholar] [CrossRef]
- Bruno, J.G.; Kiel, J.L. Use of magnetic beads in selection and detection of biotoxin aptamers by electrochemiluminescence and enzymatic methods. BioTechniques 2002, 32, 178–183. [Google Scholar] [CrossRef] [PubMed]
- Zhang, H.; Yu, D.; Zhao, Y.; Fan, A. Turn-on chemiluminescent sensing platform for label-free protease detection using streptavidin-modified magnetic beads. Biosens. Bioelectron. 2014, 61, 45–50. [Google Scholar] [CrossRef] [PubMed]
- Ohara, R.; Ohara, O. A new solid-phase chemical DNA sequencing method which uses streptavidin-coated magnetic beads. DNA Research 1995, 2, 123–128. [Google Scholar] [CrossRef] [PubMed]
- Wang, C.; Yang, G.; Luo, Z.; Ding, H. In vitro selection of high-affinity DNA aptamers for streptavidin. Acta Biochim. Biophys. Sin. 2009, 41, 335–340. [Google Scholar] [CrossRef]
- BelBruno, J.J. Molecularly Imprinted Polymers. Chem. Rev. 2019, 1, 94–119. [Google Scholar] [CrossRef]
- Toh, S.Y.; Citartan, M.; Gopinath, S.C.; Tang, T.-H. Aptamers as a replacement for antibodies in enzyme-linked immunosorbent assay. Biosens. Bioelectron. 2015, 64, 392–403. [Google Scholar] [CrossRef]
- Chen, A.; Yang, S. Replacing antibodies with aptamers in lateral flow immunoassay. Biosens. Bioelectron. 2015, 71, 230–242. [Google Scholar] [CrossRef]
- Nezlin, R. Use of aptamers in immunoassays. Mol. Immunol. 2016, 70, 149–154. [Google Scholar] [CrossRef] [PubMed]
- Dunn, M.R.; Jimenez, R.M.; Chaput, J.C. Analysis of aptamer discovery and technology. Nat. Rev. Chem. 2017, 1, 1–16. [Google Scholar] [CrossRef]
- Koide, H.; Yoshimatsu, K.; Hoshino, Y.; Lee, S.-H.; Okajima, A.; Ariizumi, S.; Narita, Y.; Yonamine, Y.; Weisman, A.C.; Nishimura, Y. A polymer nanoparticle with engineered affinity for a vascular endothelial growth factor (VEGF 165). Nat. Chem. 2017, 9, 715–722. [Google Scholar] [CrossRef] [PubMed]
- Song, S.; Wang, L.; Li, J.; Fan, C.; Zhao, J. Aptamer-based biosensors. TrAC, Trends Anal. Chem. 2008, 27, 108-117.
- Iliuk, A.B.; Hu, L.; Tao, W.A. Aptamer in bioanalytical applications. Anal. Chem. 2011, 83, 4440–4452. [Google Scholar] [CrossRef] [PubMed]
- Sullivan, R.; Adams, M.C.; Naik, R.R.; Milam, V.T. Analyzing secondary structure patterns in DNA aptamers identified via CompELS. Molecules 2019, 24, 1572. [Google Scholar] [CrossRef] [PubMed]
- Afanasyeva, A.; Nagao, C.; Mizuguchi, K. Prediction of the secondary structure of short DNA. Biophysics and physicobiology 2019, 16, 287–294. [Google Scholar] [CrossRef] [PubMed]
- Nezlin, R. Use of aptamers in immunoassays. Mol. Immunol. 2016, 70, 149–154. [Google Scholar] [CrossRef]
- Huang, J.; Chen, X.; Fu, X.; Li, Z.; Huang, Y.; Liang, C. Advances in aptamer-based biomarker discovery. Front. Cell Dev. Biol. 2021, 9, 571. [Google Scholar] [CrossRef]
- Yang, M.; Jiang, G.; Li, W.; Qiu, K.; Zhang, M.; Carter, C.M.; Al-Quran, S.Z.; Li, Y. Developing aptamer probes for acute myelogenous leukemia detection and surface protein biomarker discovery. J. Hematol. Oncol. 2014, 7, 1–14. [Google Scholar] [CrossRef]
- Shibuya, M. Vascular Endothelial Growth Factor (VEGF) and Its Receptor (VEGFR) Signaling in Angiogenesis. Genes Cancer 2011, 2, 1097–1105. [Google Scholar] [CrossRef]
- Mansoori, B.; Mohammadi, A.; Davudian, S.; Shirjang, S.; Baradaran, B. The different mechanisms of cancer drug resistance: a brief review. Adv. Pharm. Bull. 2017, 7, 339. [Google Scholar] [CrossRef] [PubMed]
- Gottesman, M.M. Mechanisms of cancer drug resistance. Annu. Rev. Med. 2002, 53, 615–627. [Google Scholar] [CrossRef] [PubMed]
- Housman, G.; Byler, S.; Heerboth, S.; Lapinska, K.; Longacre, M.; Snyder, N.; Sarkar, S. Drug resistance in cancer: an overview. Cancers 2014, 6, 1769–1792. [Google Scholar] [CrossRef] [PubMed]
- Shibuya, M. Structure and function of VEGF/VEGF-receptor system involved in angiogenesis. Cell Struct. Funct. 2001, 26, 25–35. [Google Scholar] [CrossRef] [PubMed]
- Li, T.; Kang, G.; Wang, T.; Huang, H. Tumor angiogenesis and anti-angiogenic gene therapy for cancer. Oncol. Lett. 2018, 16, 687–702. [Google Scholar] [CrossRef]
- Carmeliet, P.; Jain, R.K. Angiogenesis in cancer and other diseases. Nature 2000, 407, 249–257. [Google Scholar] [CrossRef] [PubMed]
- Tamura, M.; Ohta, Y.; Kajita, T.; Kimura, K.; Go, T.; Oda, M.; Nakamura, H.; Watanabe, G. Plasma VEGF concentration can predict the tumor angiogenic capacity in non-small cell lung cancer. Oncol. Rep. 2001, 8, 1097–1102. [Google Scholar] [CrossRef]
- Kopeć, M.; Abramczyk, H. Angiogenesis-a crucial step in breast cancer growth, progression and dissemination by Raman imaging. Spectrochim. Acta A Mol. Biomol. Spectrosc. 2018, 198, 338–345. [Google Scholar] [CrossRef]
- Kut, C.; Mac Gabhann, F.; Popel, A. Where is VEGF in the body? A meta-analysis of VEGF distribution in cancer. Br. J. Cancer 2007, 97, 978–985. [Google Scholar] [CrossRef]
- Parveen, A.; Subedi, L.; Kim, H.W.; Khan, Z.; Zahra, Z.; Farooqi, M.Q.; Kim, S.Y. Phytochemicals targeting VEGF and VEGF-related multifactors as anticancer therapy. J. Clin. Med. 2019, 8, 350. [Google Scholar] [CrossRef]
- Zhang, M.; Liu, J.; Liu, G.; Xing, Z.; Jia, Z.; Li, J.; Wang, W.; Wang, J.; Qin, L.; Wang, X. Anti-vascular endothelial growth factor therapy in breast cancer: Molecular pathway, potential targets, and current treatment strategies. Cancer Lett. 2021, 520, 422–433. [Google Scholar] [CrossRef] [PubMed]
- Hsu, M.-Y.; Yang, C.-Y.; Hsu, W.-H.; Lin, K.-H.; Wang, C.-Y.; Shen, Y.-C.; Chen, Y.-C.; Chau, S.-F.; Tsai, H.-Y.; Cheng, C.-M. Monitoring the VEGF level in aqueous humor of patients with ophthalmologically relevant diseases via ultrahigh sensitive paper-based ELISA. Biomaterials 2014, 35, 3729–3735. [Google Scholar] [CrossRef] [PubMed]
- Mineta, H.; Miura, K.; Ogino, T.; Takebayashi, S.; Misawa, K.; Ueda, Y.; Suzuki, I.; Dictor, M.; Borg, Å.; Wennerberg, J. Prognostic value of vascular endothelial growth factor (VEGF) in head and neck squamous cell carcinomas. Br. J. Cancer 2000, 83, 775–781. [Google Scholar] [CrossRef] [PubMed]
- Vasala, A.; Nair, H.; Rao, T.S.; Murthy, S.S.; Tagore, R.; Ahmed, F. Role of angiogenesis in colorectal carcinomas using VEGF and BCl2: an IHC study. Ann. Diagn. Pathol. 2017, 31, 41–44. [Google Scholar] [CrossRef] [PubMed]
- Anthony, F.; Evans, P.; Wheeler, T.; Wood, P. Variation in detection of VEGF in maternal serum by immunoassay and the possible influence of binding proteins. Ann. Clin. Biochem. 1997, 34, 276–280. [Google Scholar] [CrossRef] [PubMed]
- Sumner, G.; Georgaros, C.; Rafique, A.; DiCioccio, T.; Martin, J.; Papadopoulos, N.; Daly, T.; Torri, A. Anti-VEGF drug interference with VEGF quantitation in the R&D systems human quantikine VEGF ELISA kit. Bioanalysis 2019, 11, 381–392. [Google Scholar] [CrossRef] [PubMed]
- Lin, X.; Leung, K.-H.; Lin, L.; Lin, L.; Lin, S.; Leung, C.-H.; Ma, D.-L.; Lin, J.-M. Determination of cell metabolite VEGF165 and dynamic analysis of protein–DNA interactions by combination of microfluidic technique and luminescent switch-on probe. Biosens. Bioelectron. 2016, 79, 41–47. [Google Scholar] [CrossRef]
- Pasquardini, L.; Pancheri, L.; Potrich, C.; Ferri, A.; Piemonte, C.; Lunelli, L.; Napione, L.; Comunanza, V.; Alvaro, M.; Vanzetti, L. SPAD aptasensor for the detection of circulating protein biomarkers. Biosens. Bioelectron. 2015, 68, 500–507. [Google Scholar] [CrossRef]
- Li, J.; Sun, K.; Chen, Z.; Shi, J.; Zhou, D.; Xie, G. A fluorescence biosensor for VEGF detection based on DNA assembly structure switching and isothermal amplification. Biosens. Bioelectron. 2017, 89, 964–969. [Google Scholar] [CrossRef]
- Chattaraj, R.; Mohan, P.; Livingston, C.M.; Besmer, J.D.; Kumar, K.; Goodwin, A.P. Mutually-reactive, fluorogenic hydrocyanine/quinone reporter pairs for in-solution biosensing via nanodroplet association. ACS Appl. Mater. Interfaces 2016, 8, 802–808. [Google Scholar] [CrossRef]
- Zhang, H.; Peng, L.; Li, M.; Ma, J.; Qi, S.; Chen, H.; Zhou, L.; Chen, X. A label-free colorimetric biosensor for sensitive detection of vascular endothelial growth factor-165. Analyst 2017, 142, 2419–2425. [Google Scholar] [CrossRef] [PubMed]
- Li, Y.; Lee, H.J.; Corn, R.M. Detection of protein biomarkers using RNA aptamer microarrays and enzymatically amplified surface plasmon resonance imaging. Anal. Chem. 2007, 79, 1082–1088. [Google Scholar] [CrossRef] [PubMed]
- Cennamo, N.; Pesavento, M.; Lunelli, L.; Vanzetti, L.; Pederzolli, C.; Zeni, L.; Pasquardini, L. An easy way to realize SPR aptasensor: A multimode plastic optical fiber platform for cancer biomarkers detection. Talanta 2015, 140, 88–95. [Google Scholar] [CrossRef] [PubMed]
- Chen, H.; Hou, Y.; Qi, F.; Zhang, J.; Koh, K.; Shen, Z.; Li, G. Detection of vascular endothelial growth factor based on rolling circle amplification as a means of signal enhancement in surface plasmon resonance. Biosens. Bioelectron. 2014, 61, 83–87. [Google Scholar] [CrossRef] [PubMed]
- Lee, J.-H.; Canny, M.D.; De Erkenez, A.; Krilleke, D.; Ng, Y.-S.; Shima, D.T.; Pardi, A.; Jucker, F. A therapeutic aptamer inhibits angiogenesis by specifically targeting the heparin binding domain of VEGF165. Proc. Natl. Acad. Sci. U.S.A. 2005, 102, 18902–18907. [Google Scholar] [CrossRef] [PubMed]
- Cao, J.; Zhao, X.P.; Younis, M.R.; Li, Z.Q.; Xia, X.H.; Wang, C. Ultrasensitive Capture, Detection, and Release of Circulating Tumor Cells Using a Nanochannel-Ion Channel Hybrid Coupled with Electrochemical Detection Technique. Anal Chem. 2017, 89, 10957–10964. [Google Scholar] [CrossRef] [PubMed]
- Cai, W.; Fan, Y.; Jiang, Z.; Yao, J. A highly sensitive and selective resonance scattering spectral assay for potassium ion based on aptamer and nanosilver aggregation reactions. Talanta 2010, 81, 1810–1815. [Google Scholar] [CrossRef]
- Dehghani, S.; Nosrati, R.; Yousefi, M.; Nezami, A.; Soltani, F.; Taghdisi, S.M., Abnous, K.; Alibolandi, M.; Ramezani, M. Aptamer-based biosensors and nanosensors for the detection of vascular endothelial growth factor (VEGF): A review. Biosens. Bioelectron. 2018, 110, 23-37. [CrossRef]
| Label | Sequence | Length (mer) |
|---|---|---|
| VEGF aptamer | 5′-TGTGG GGGTG GACGG GCCGG GTAGA TTTTT TTT-3′-Biotin | 33 |
| 10 mer-probe | 5′-CACCC CCACA-3′-FAM | 10 |
| 15 mer-probe | 5′-CCGTC CACCC CCACA-3′-FAM | 15 |
| 20 mer-probe | 5′-CCGGC CCGTC CACCC CCACA-3′-FAM | 20 |
| Original VEGF (ng/mL) | Add VEGF (ng/mL) | Concentration Found (ng/mL) | Recovery (%) | RSD (%) |
|---|---|---|---|---|
| 0.20 | 0.80 | 1.13±0.03 | 116.71±2.32 | 1.9 |
| 0.20 | 1.60 | 1.84±0.06 | 102.50±3.41 | 3.3 |
Disclaimer/Publisher’s Note: The statements, opinions and data contained in all publications are solely those of the individual author(s) and contributor(s) and not of MDPI and/or the editor(s). MDPI and/or the editor(s) disclaim responsibility for any injury to people or property resulting from any ideas, methods, instructions or products referred to in the content. |
© 2023 by the authors. Licensee MDPI, Basel, Switzerland. This article is an open access article distributed under the terms and conditions of the Creative Commons Attribution (CC BY) license (http://creativecommons.org/licenses/by/4.0/).


