Submitted:
16 April 2023
Posted:
17 April 2023
You are already at the latest version
Abstract
Keywords:
1. Introduction
- determining the appropriate size of the PV system,
- installing a battery storage system which can store excess energy produced during the day for later use, increasing SC during non-sunlight hours,
- shifting energy consumption devices (washing machines, dishwashers, dryers or electric vehicles) to daytime hours when energy from solar radiation is being generated,
- installing a smart monitoring system for tracking energy usage patterns and identifying areas for improvement to maximize SC,
- using energy management tools that adjust and optimize in real-time energy consumption and usage,
- skillfully combining PV systems with RES-based electrical equipment, like HP, to produce heat and/or cooling,
2. Materials and Methods
2.1. Location and Meteorological Data
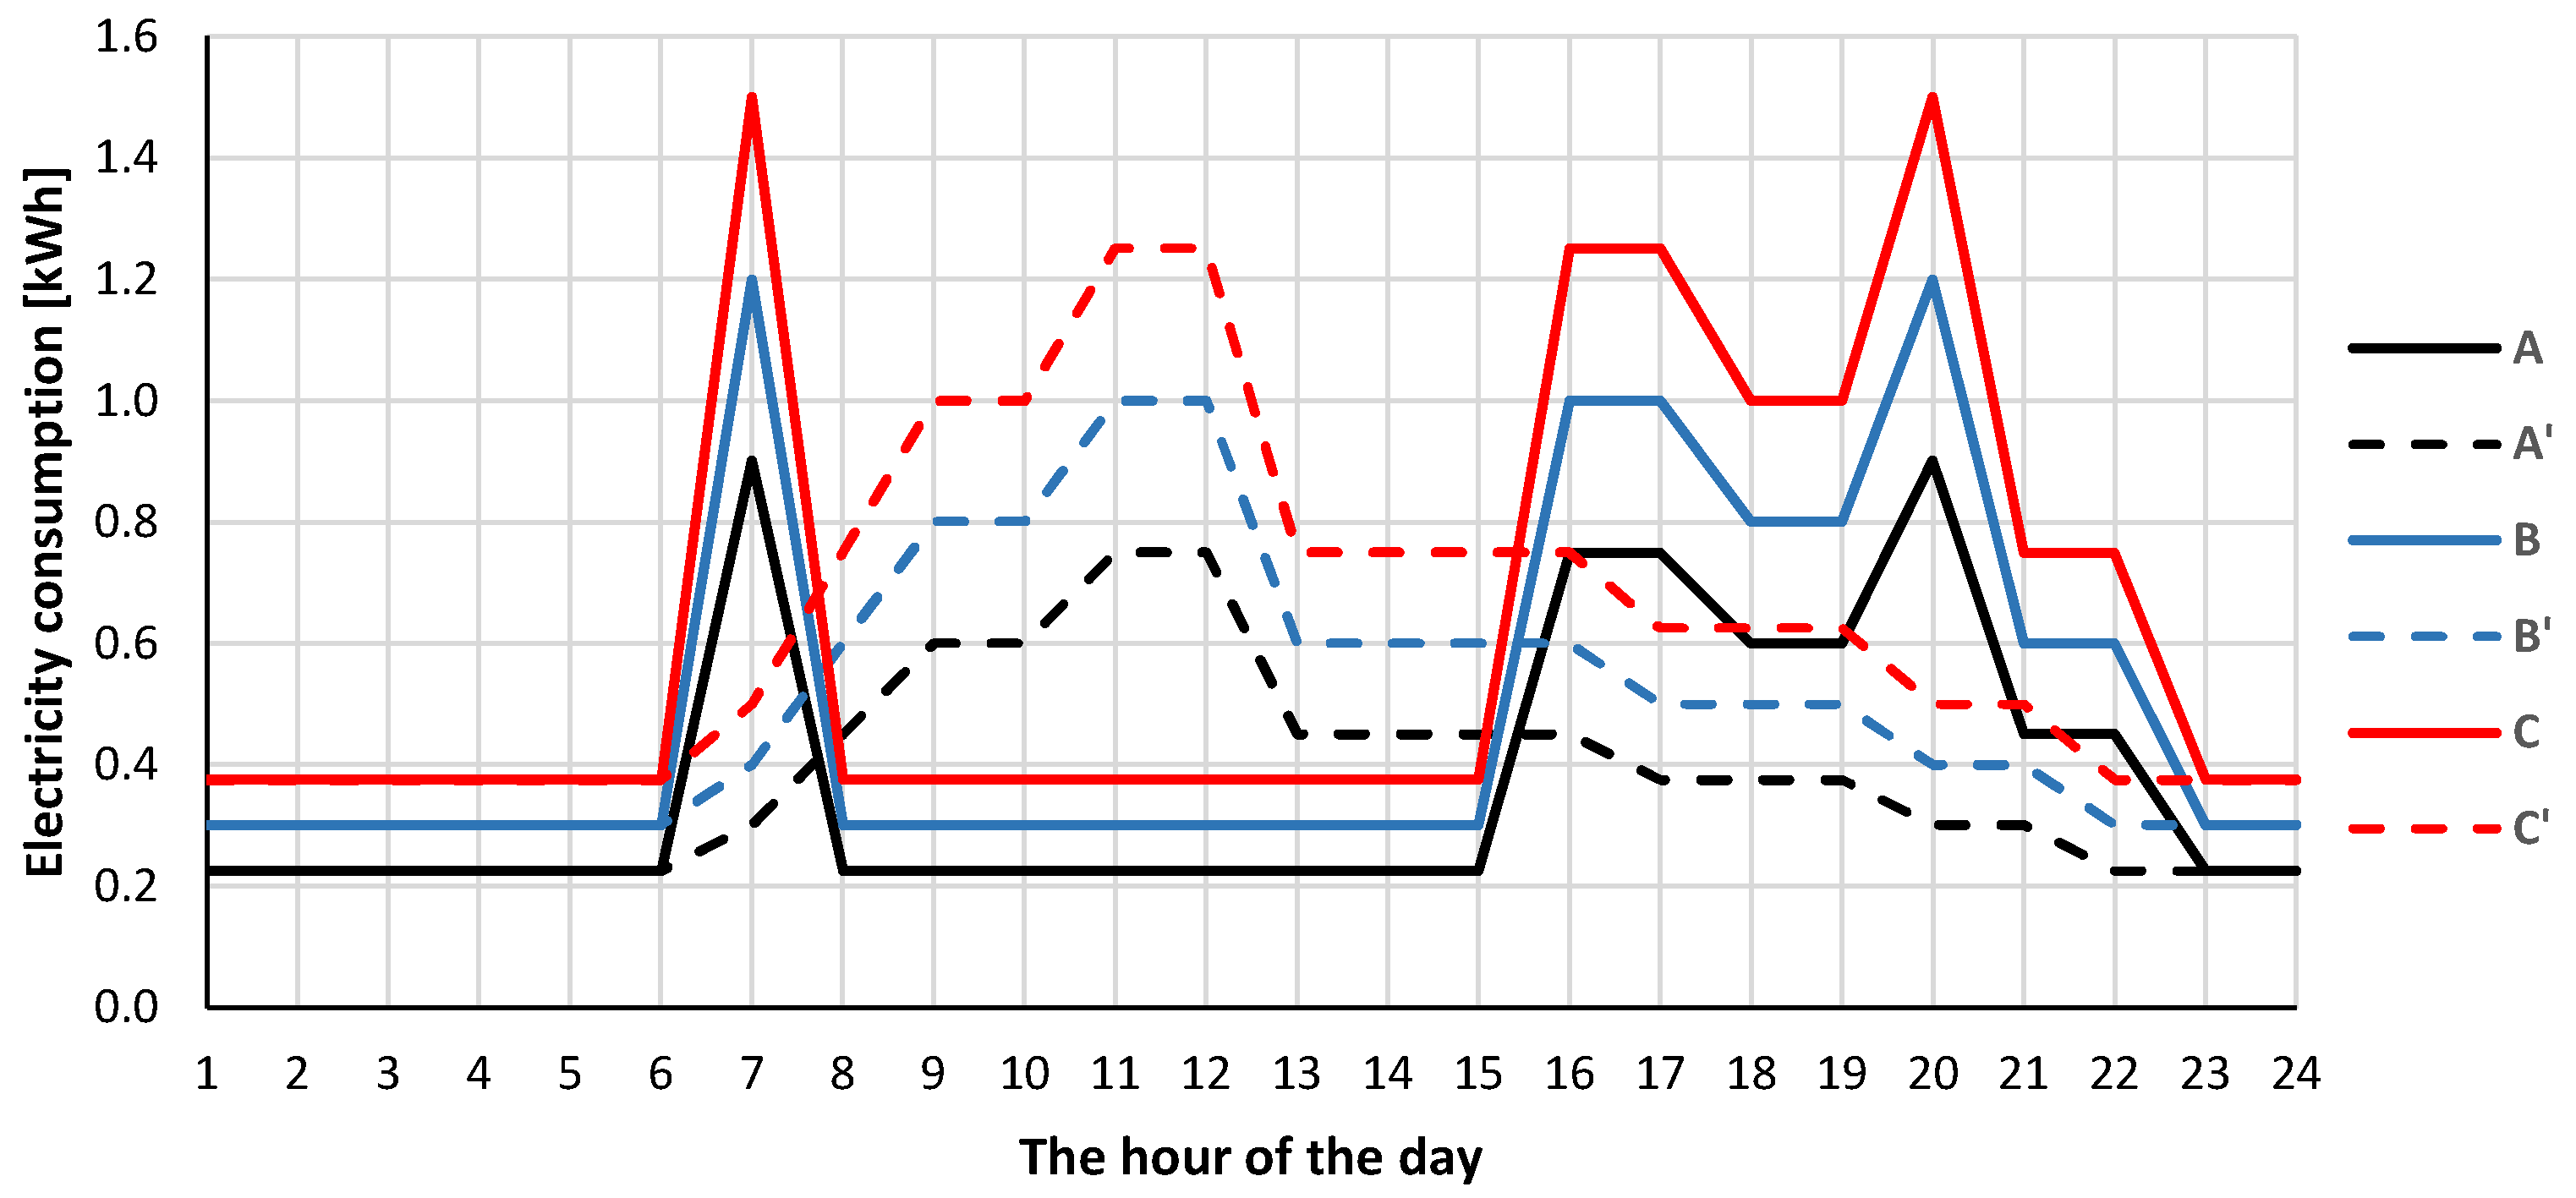
2.2. Energy consumption profiles in analysed household
2.3. PV installations
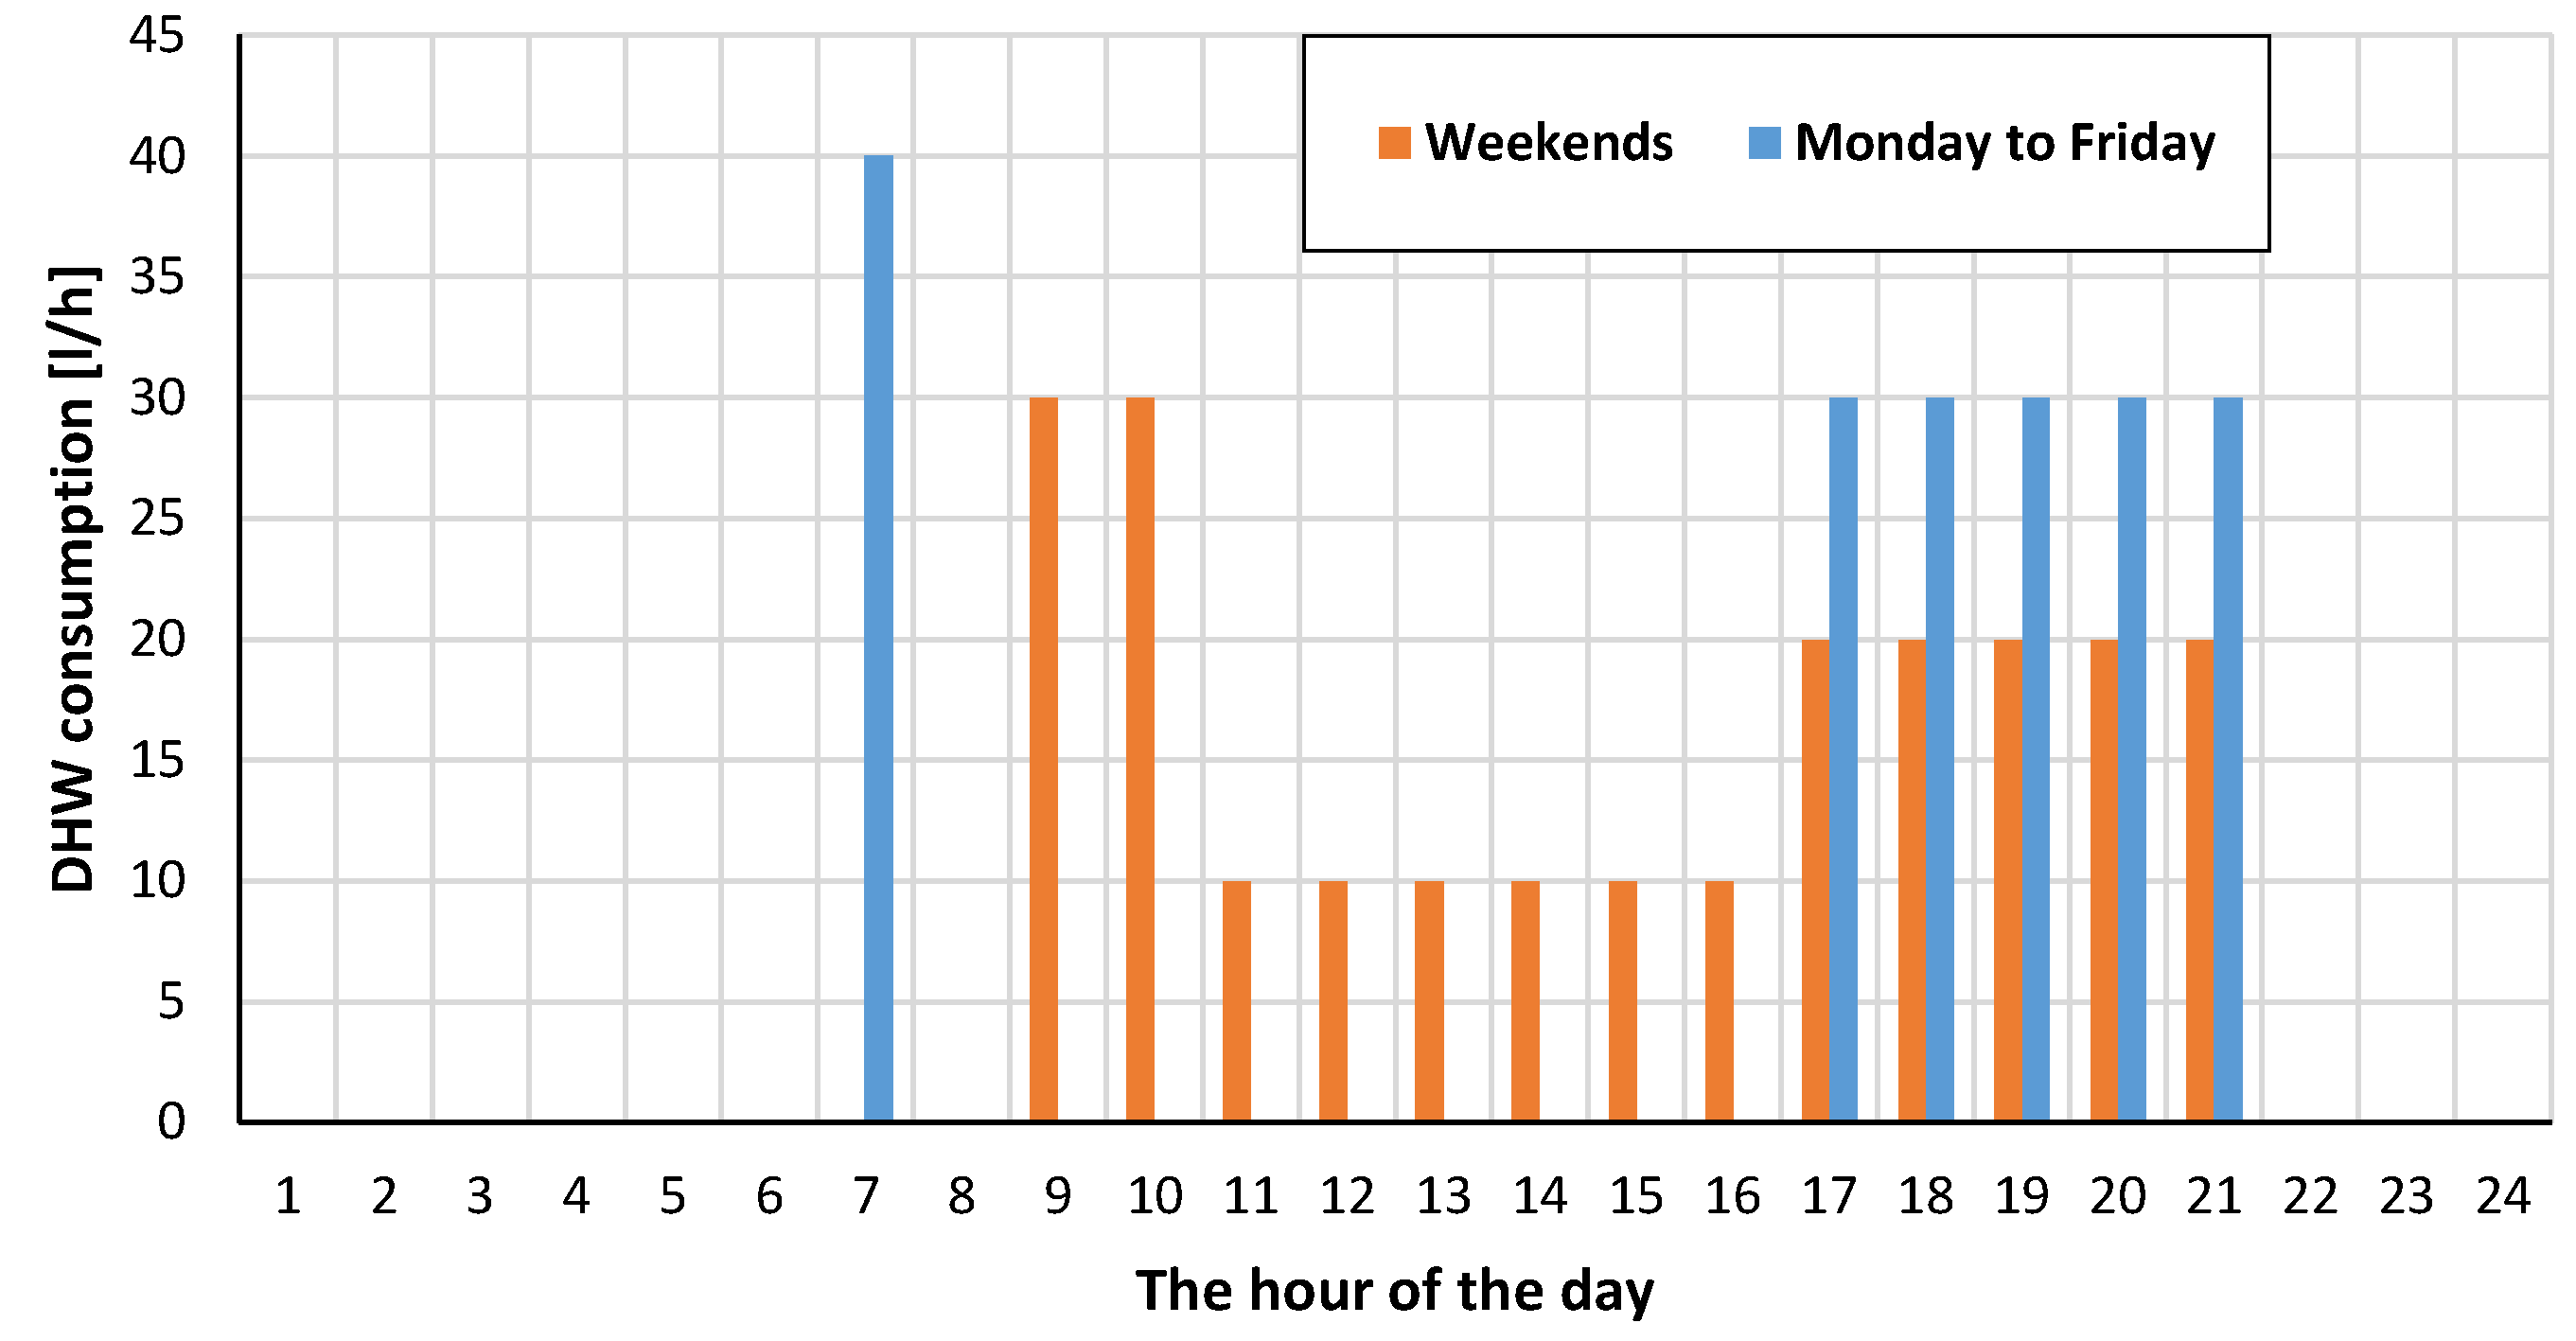
2.4. ASHP for domestic hot water (DHW) preperation
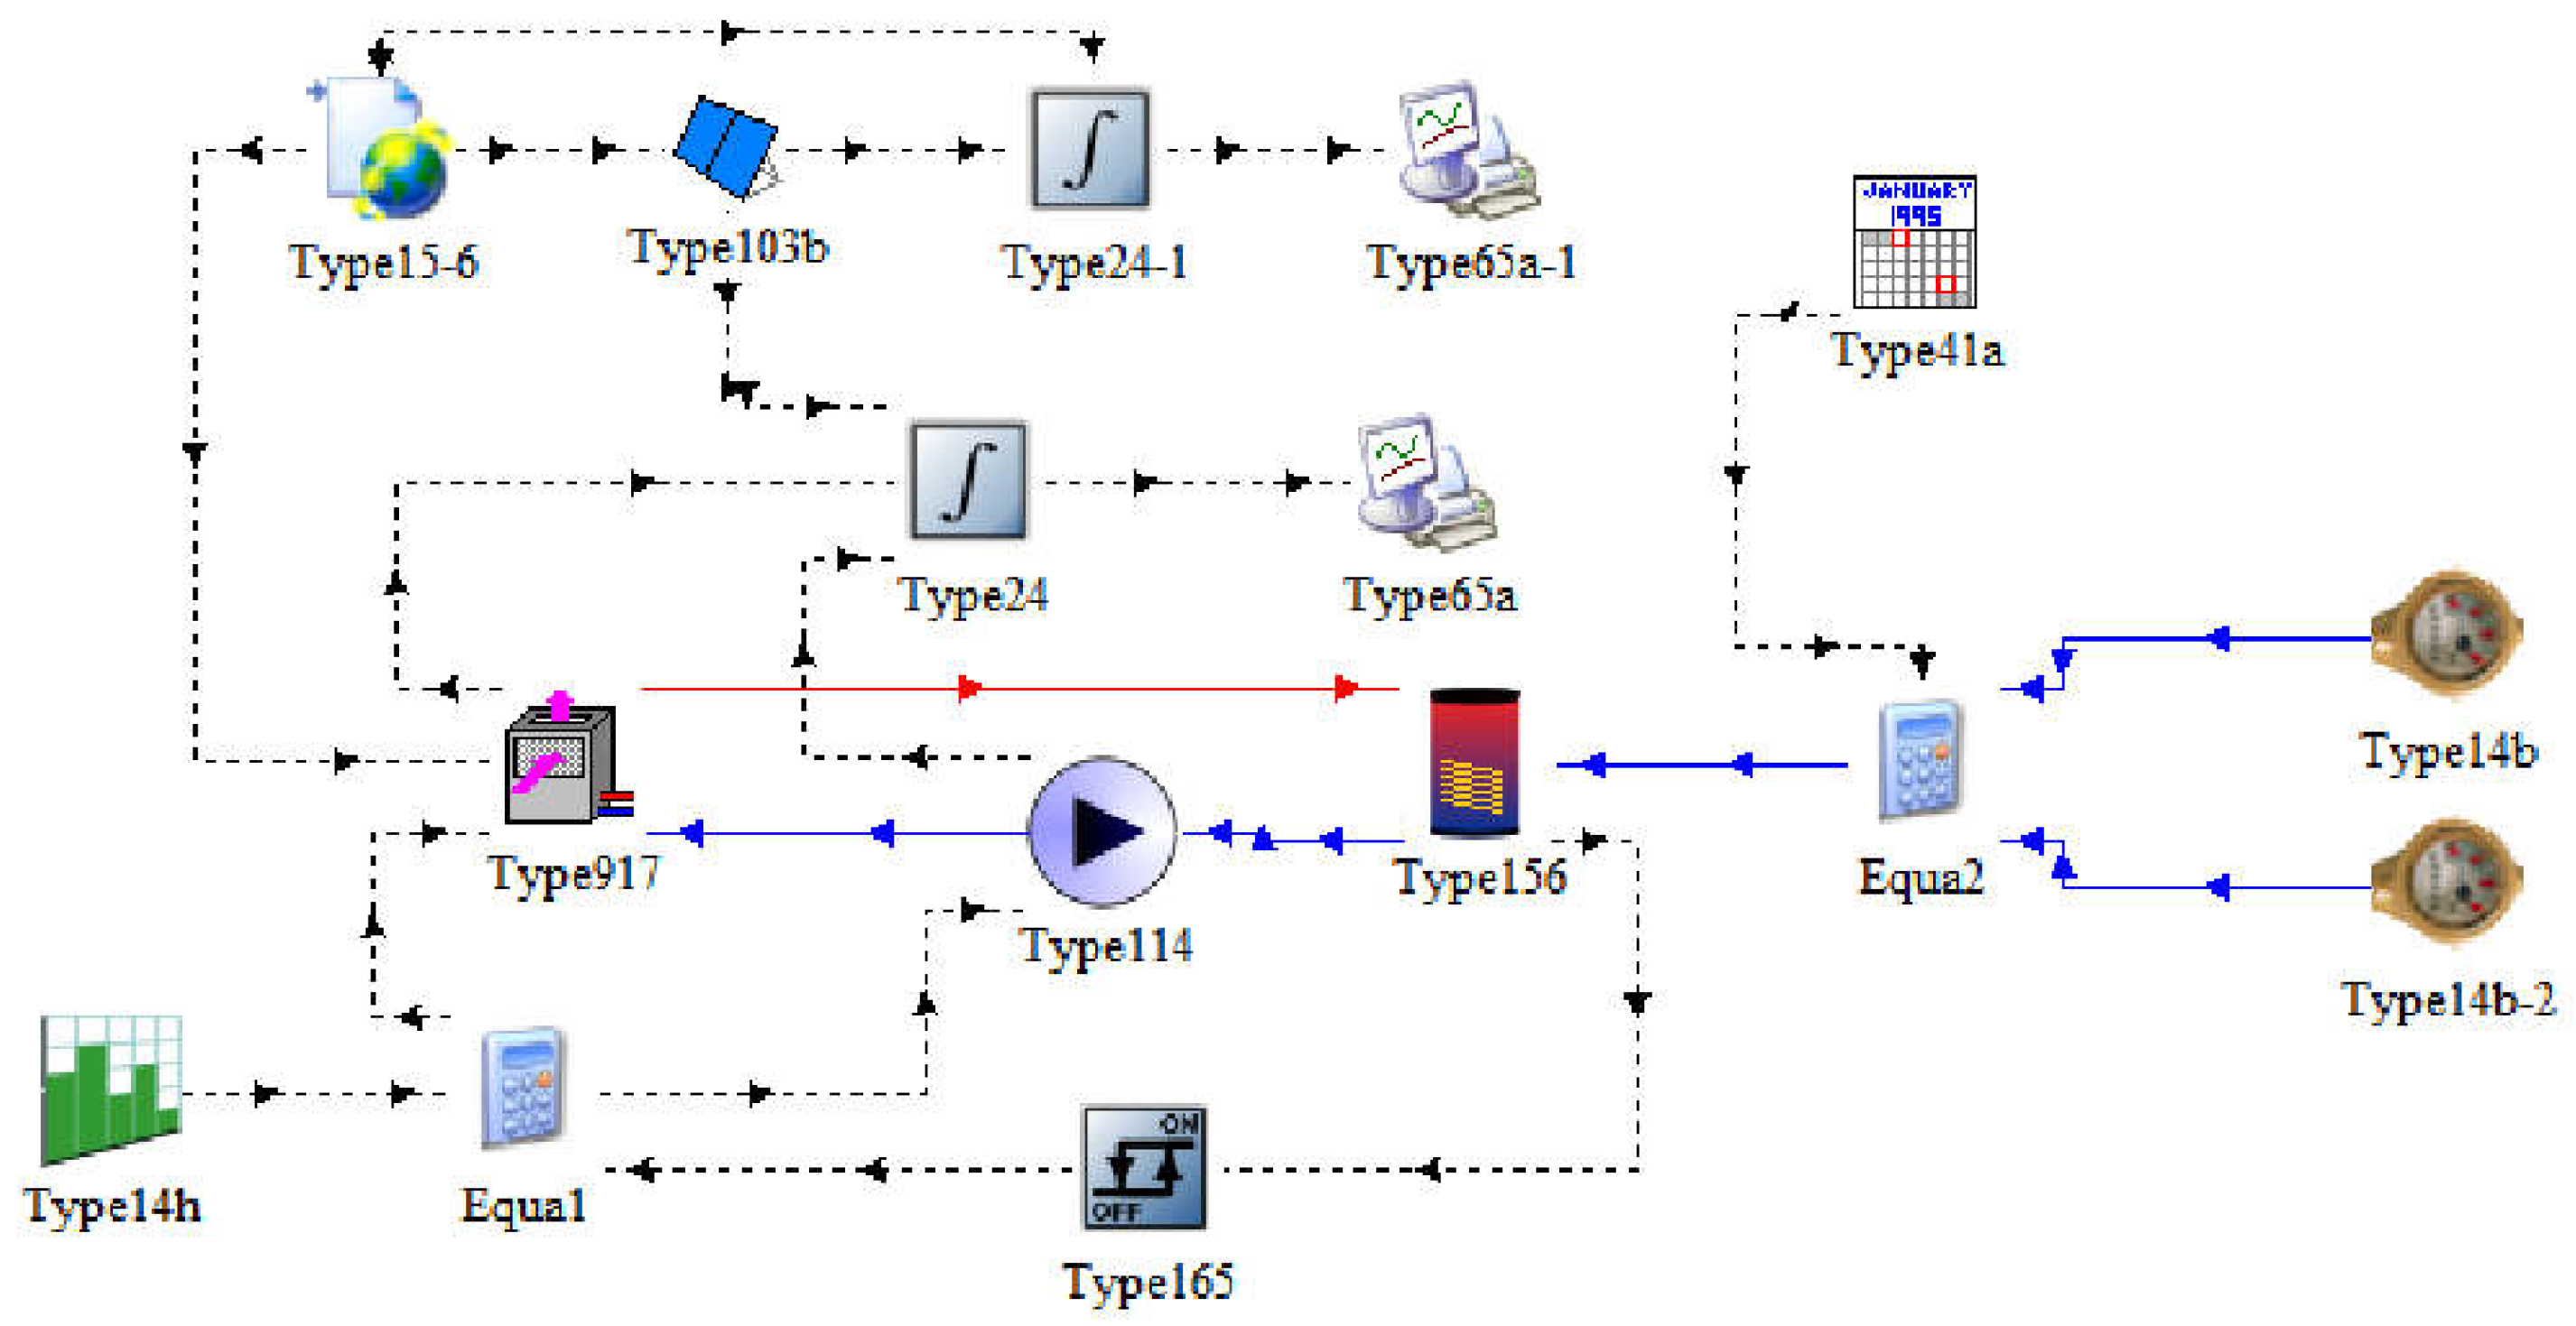
2.5. Transient Model of PV and ASHP hybrid installation
3. Results and Discussion
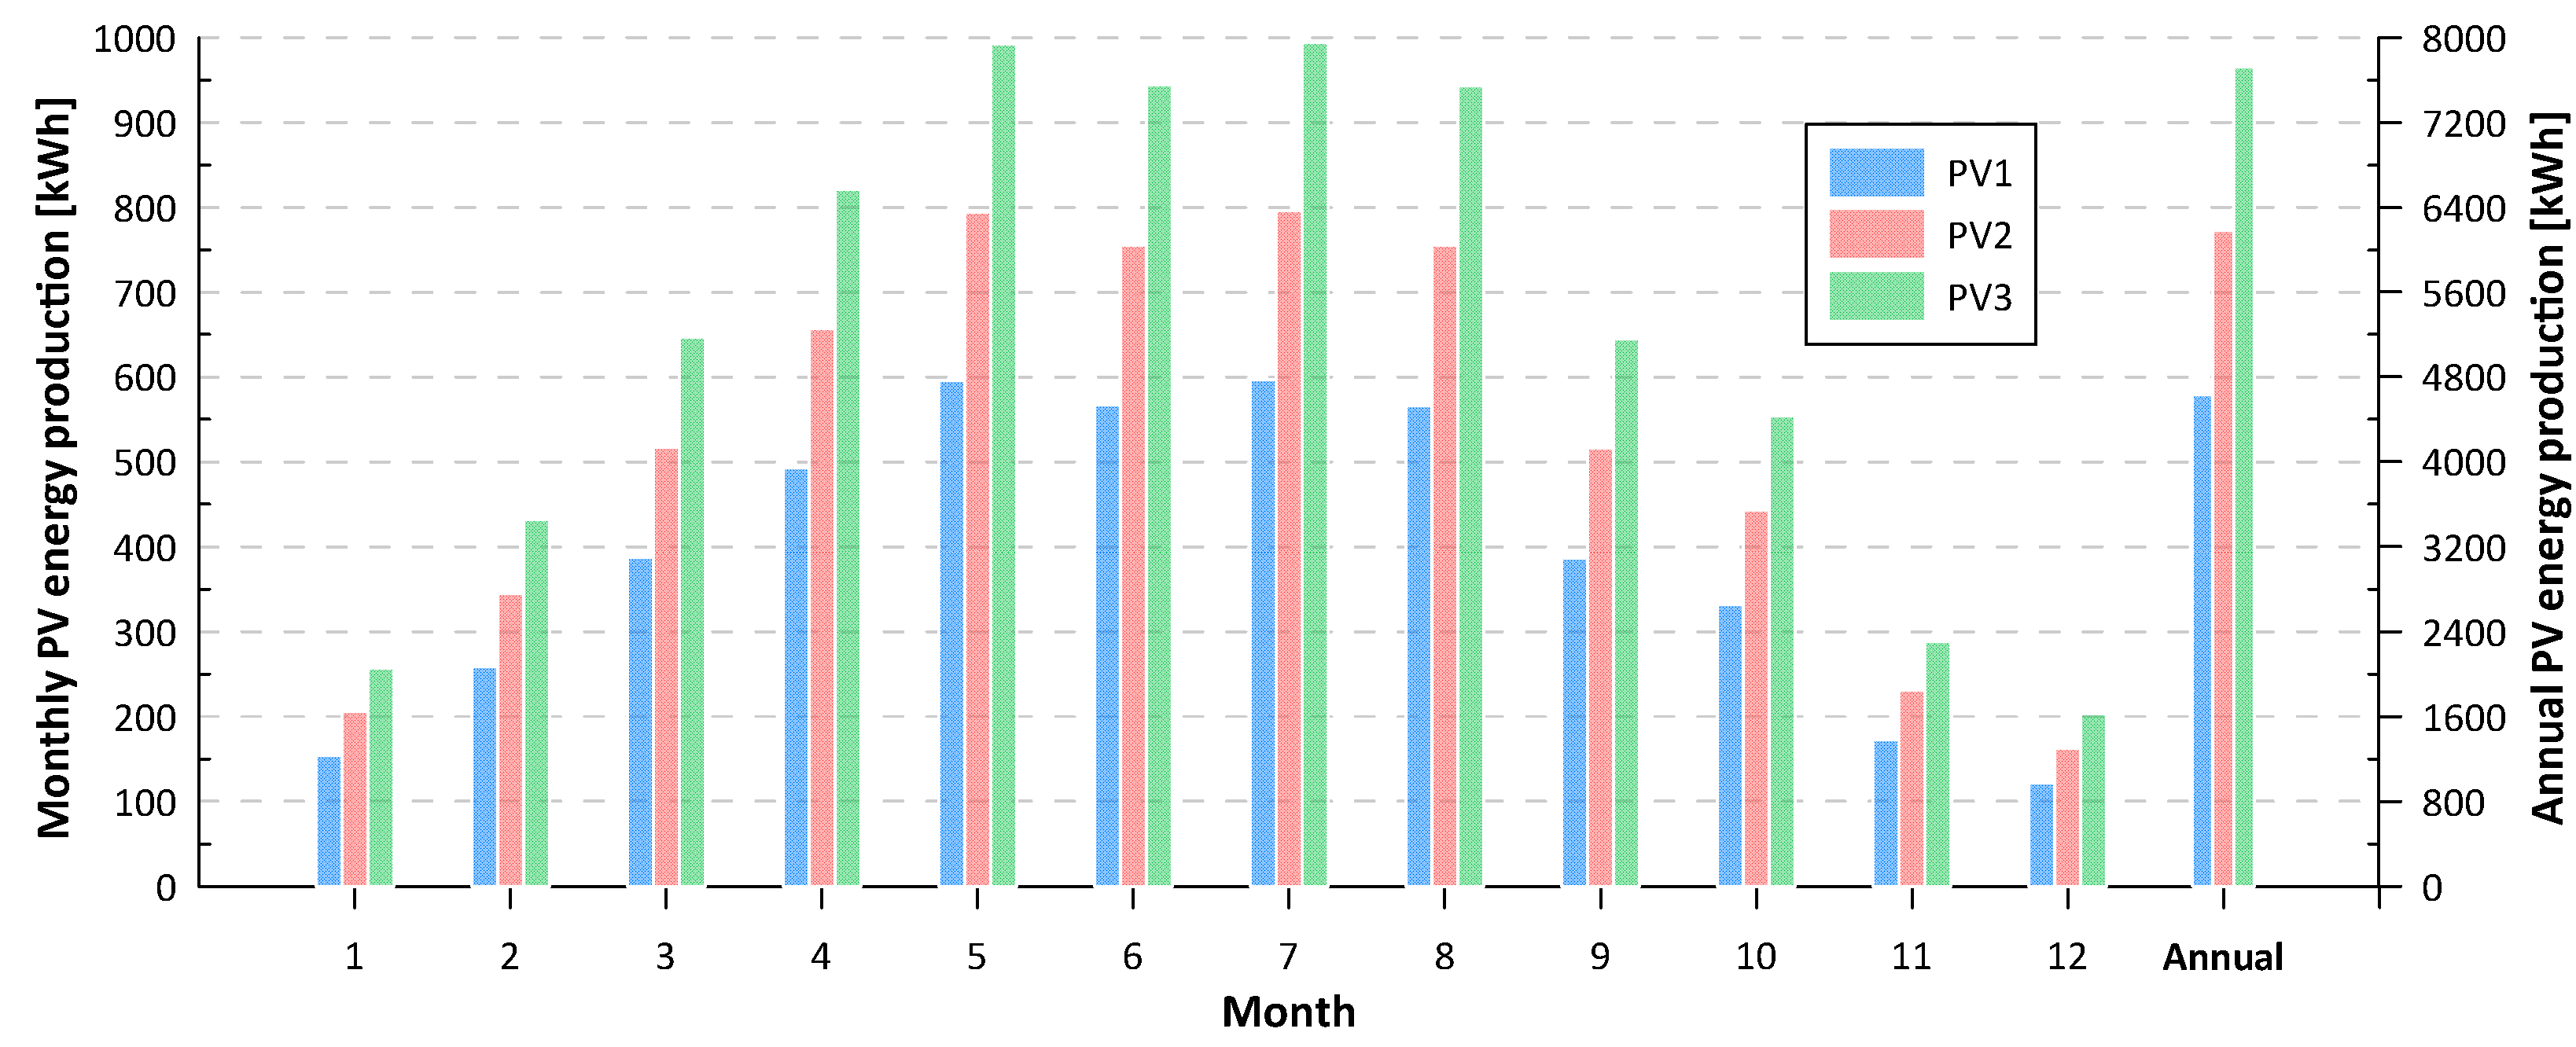
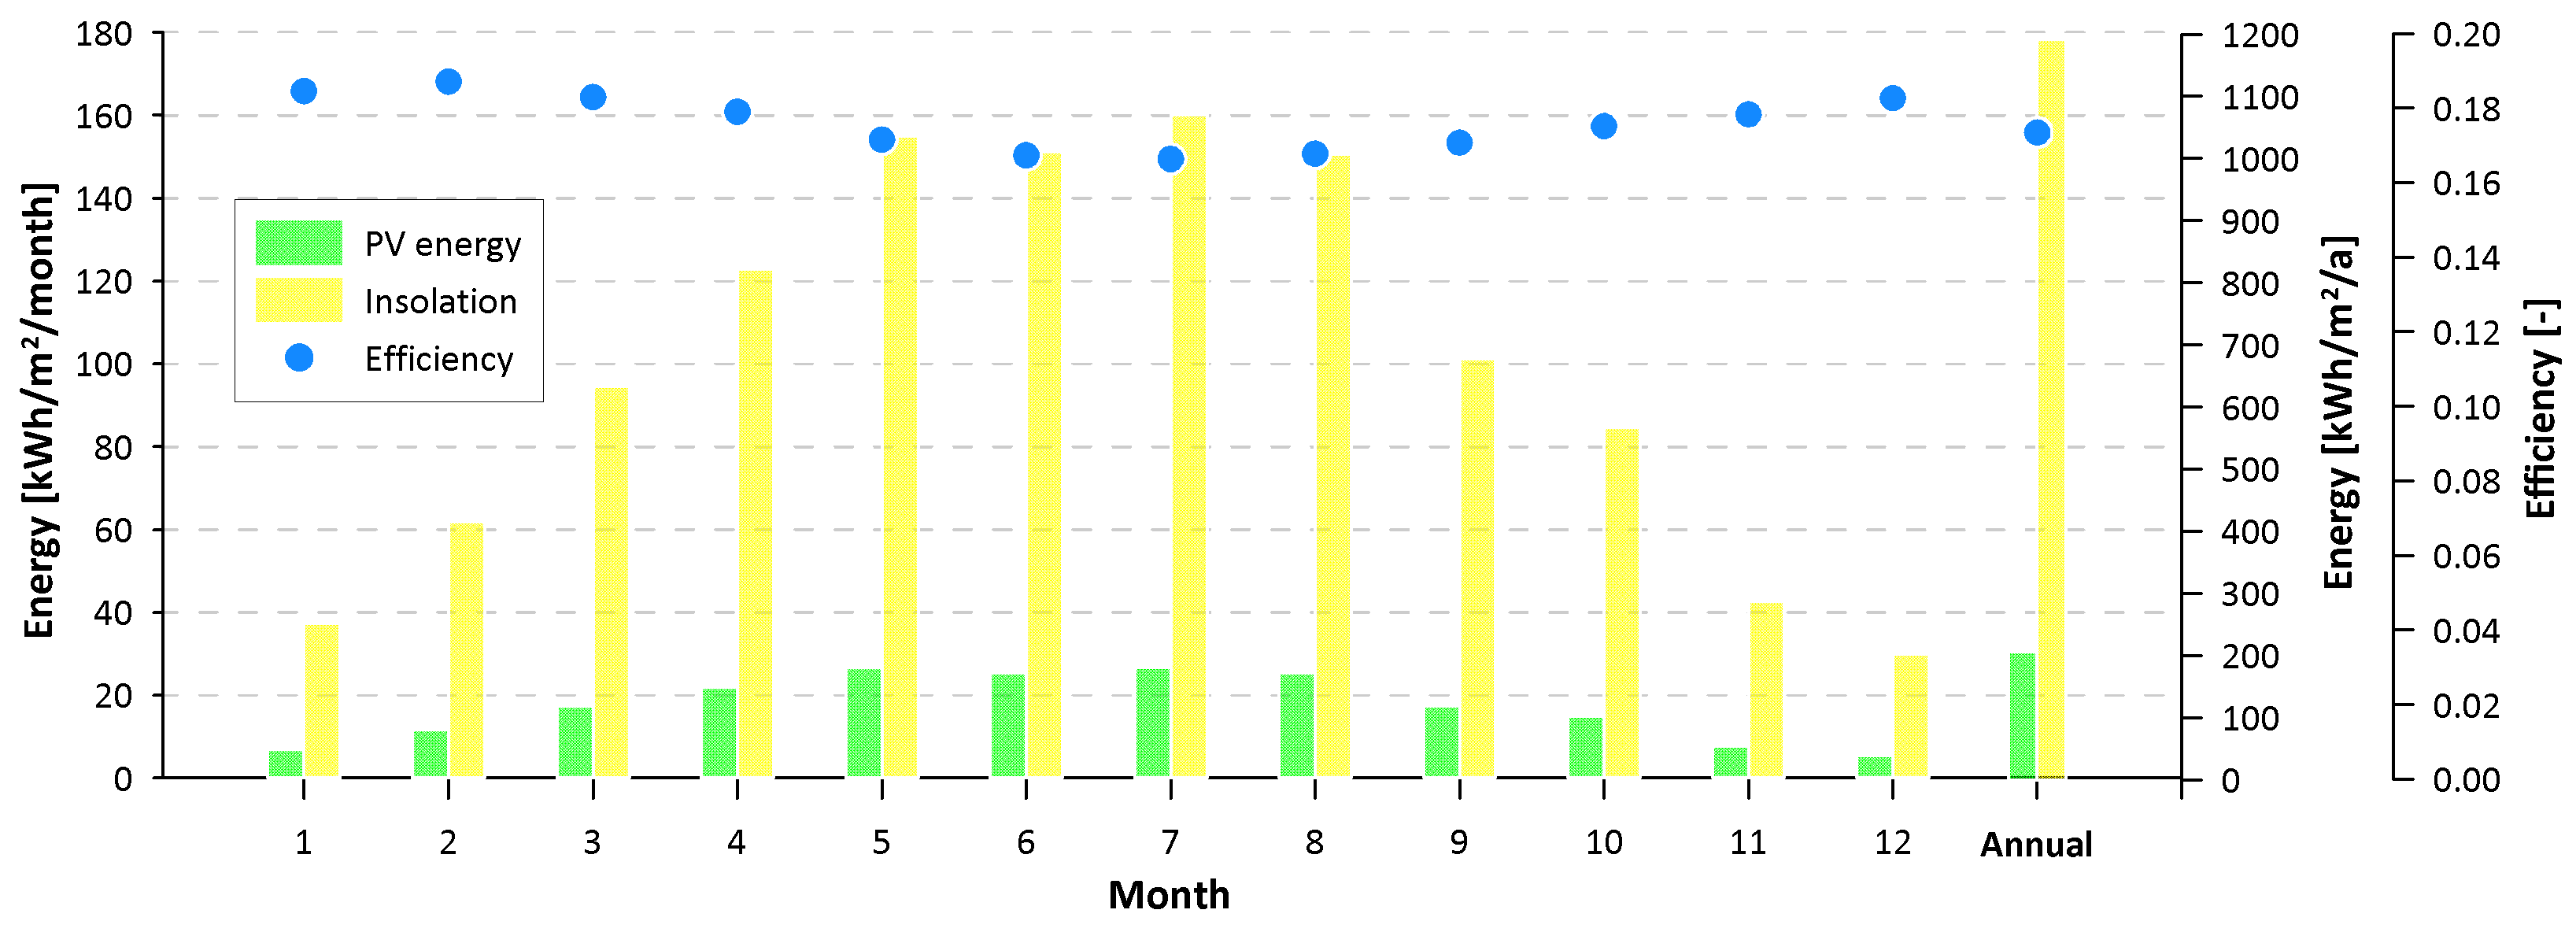
3.1. Energy efficiency of PV panels
3.2. SC parameter in PV systems
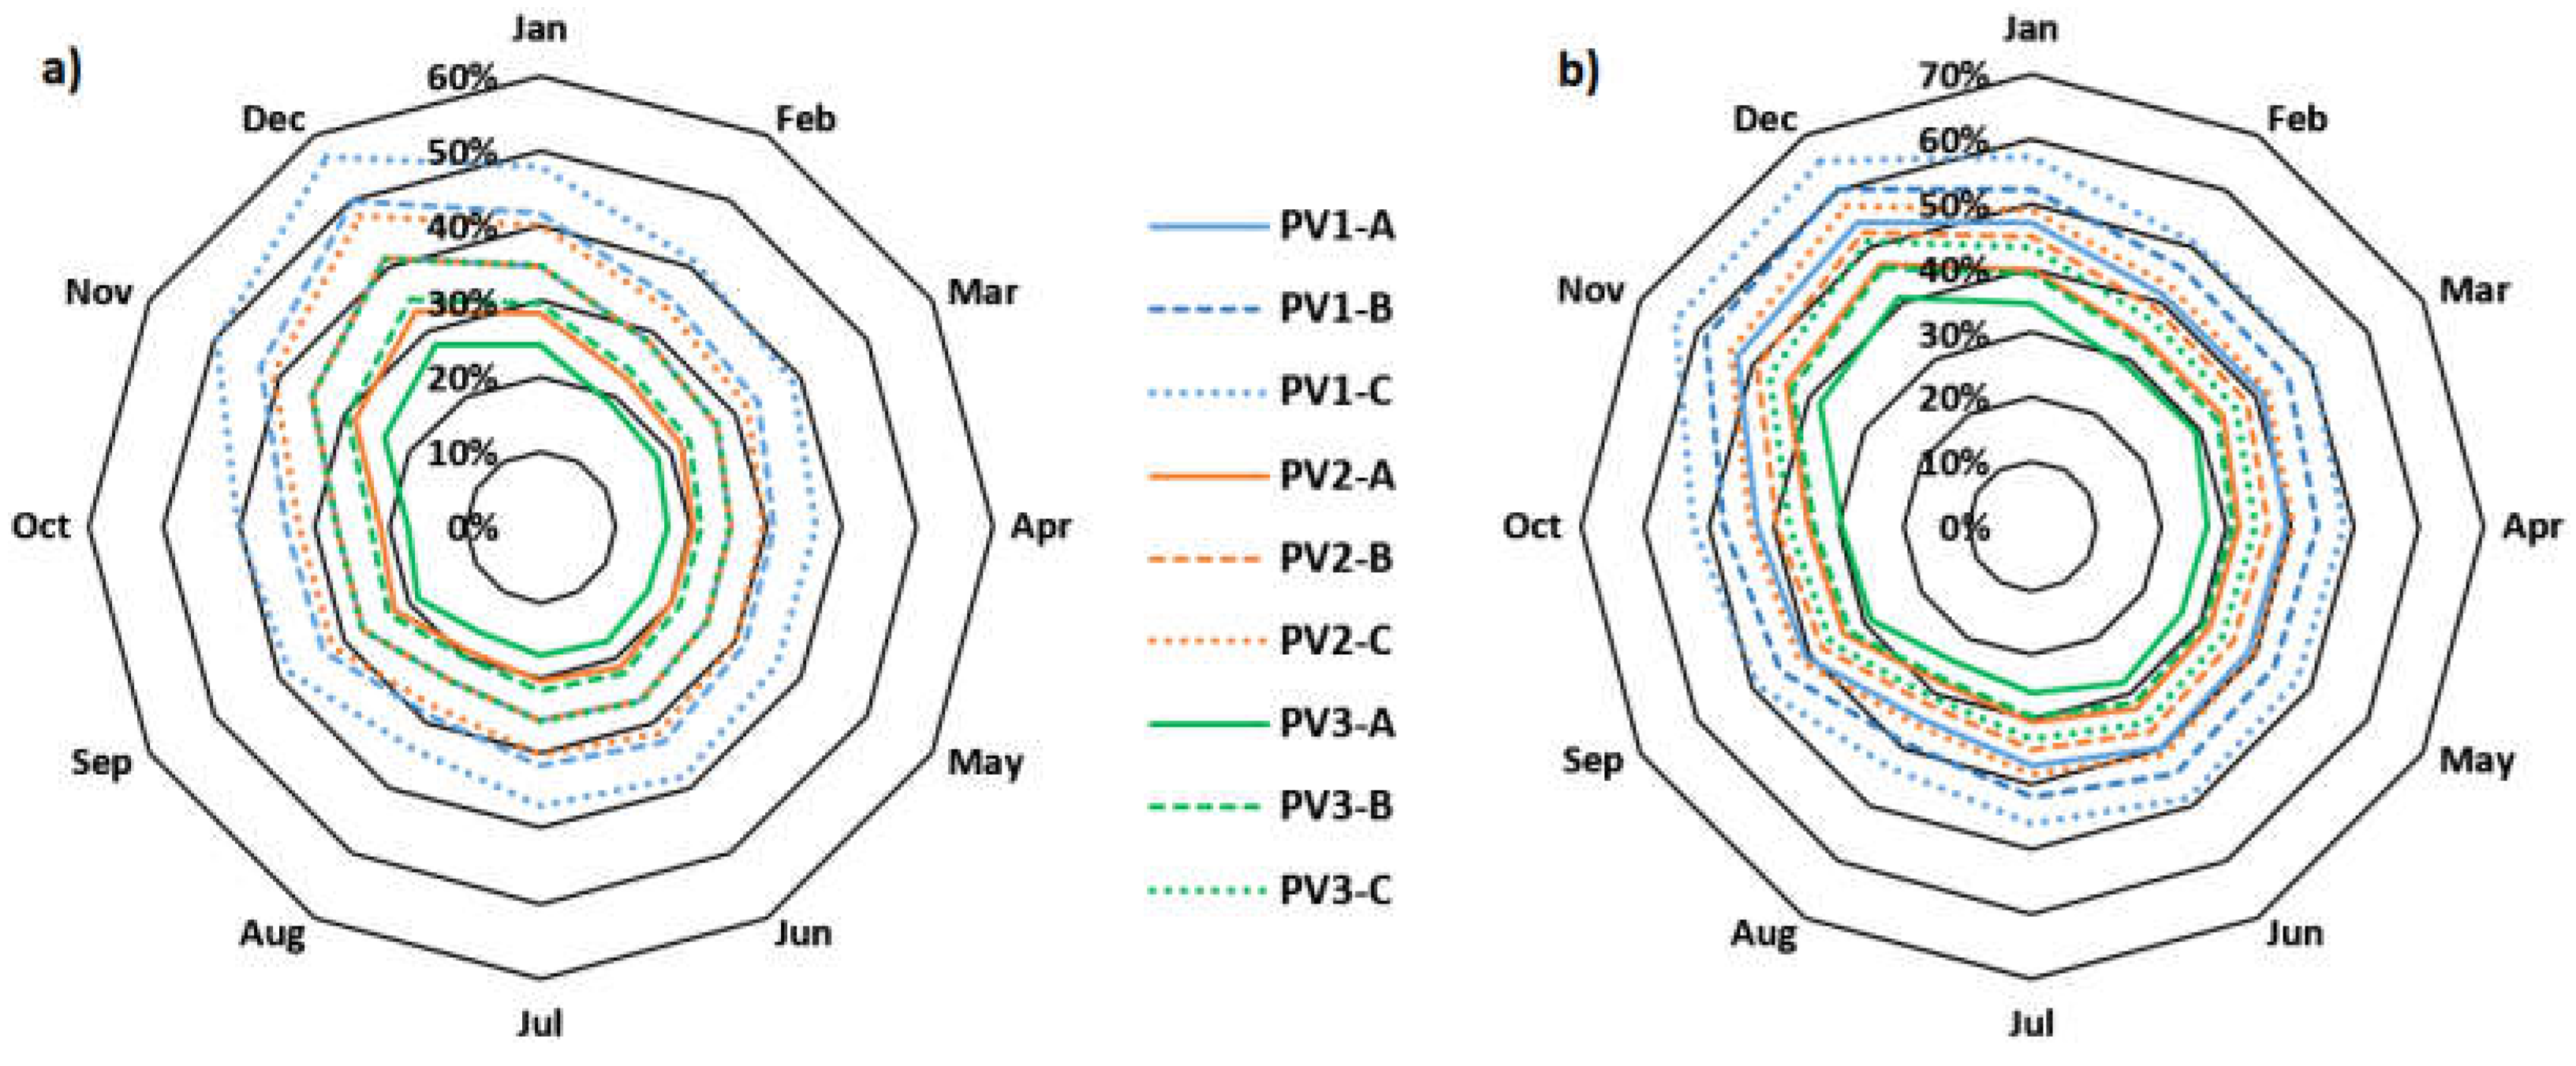
- an increase in the power of PV installations results in a decrease of the SC parameter; this is due to the fact that with greater generation of energy from PV installations, it is more difficult to self-consume this energy;
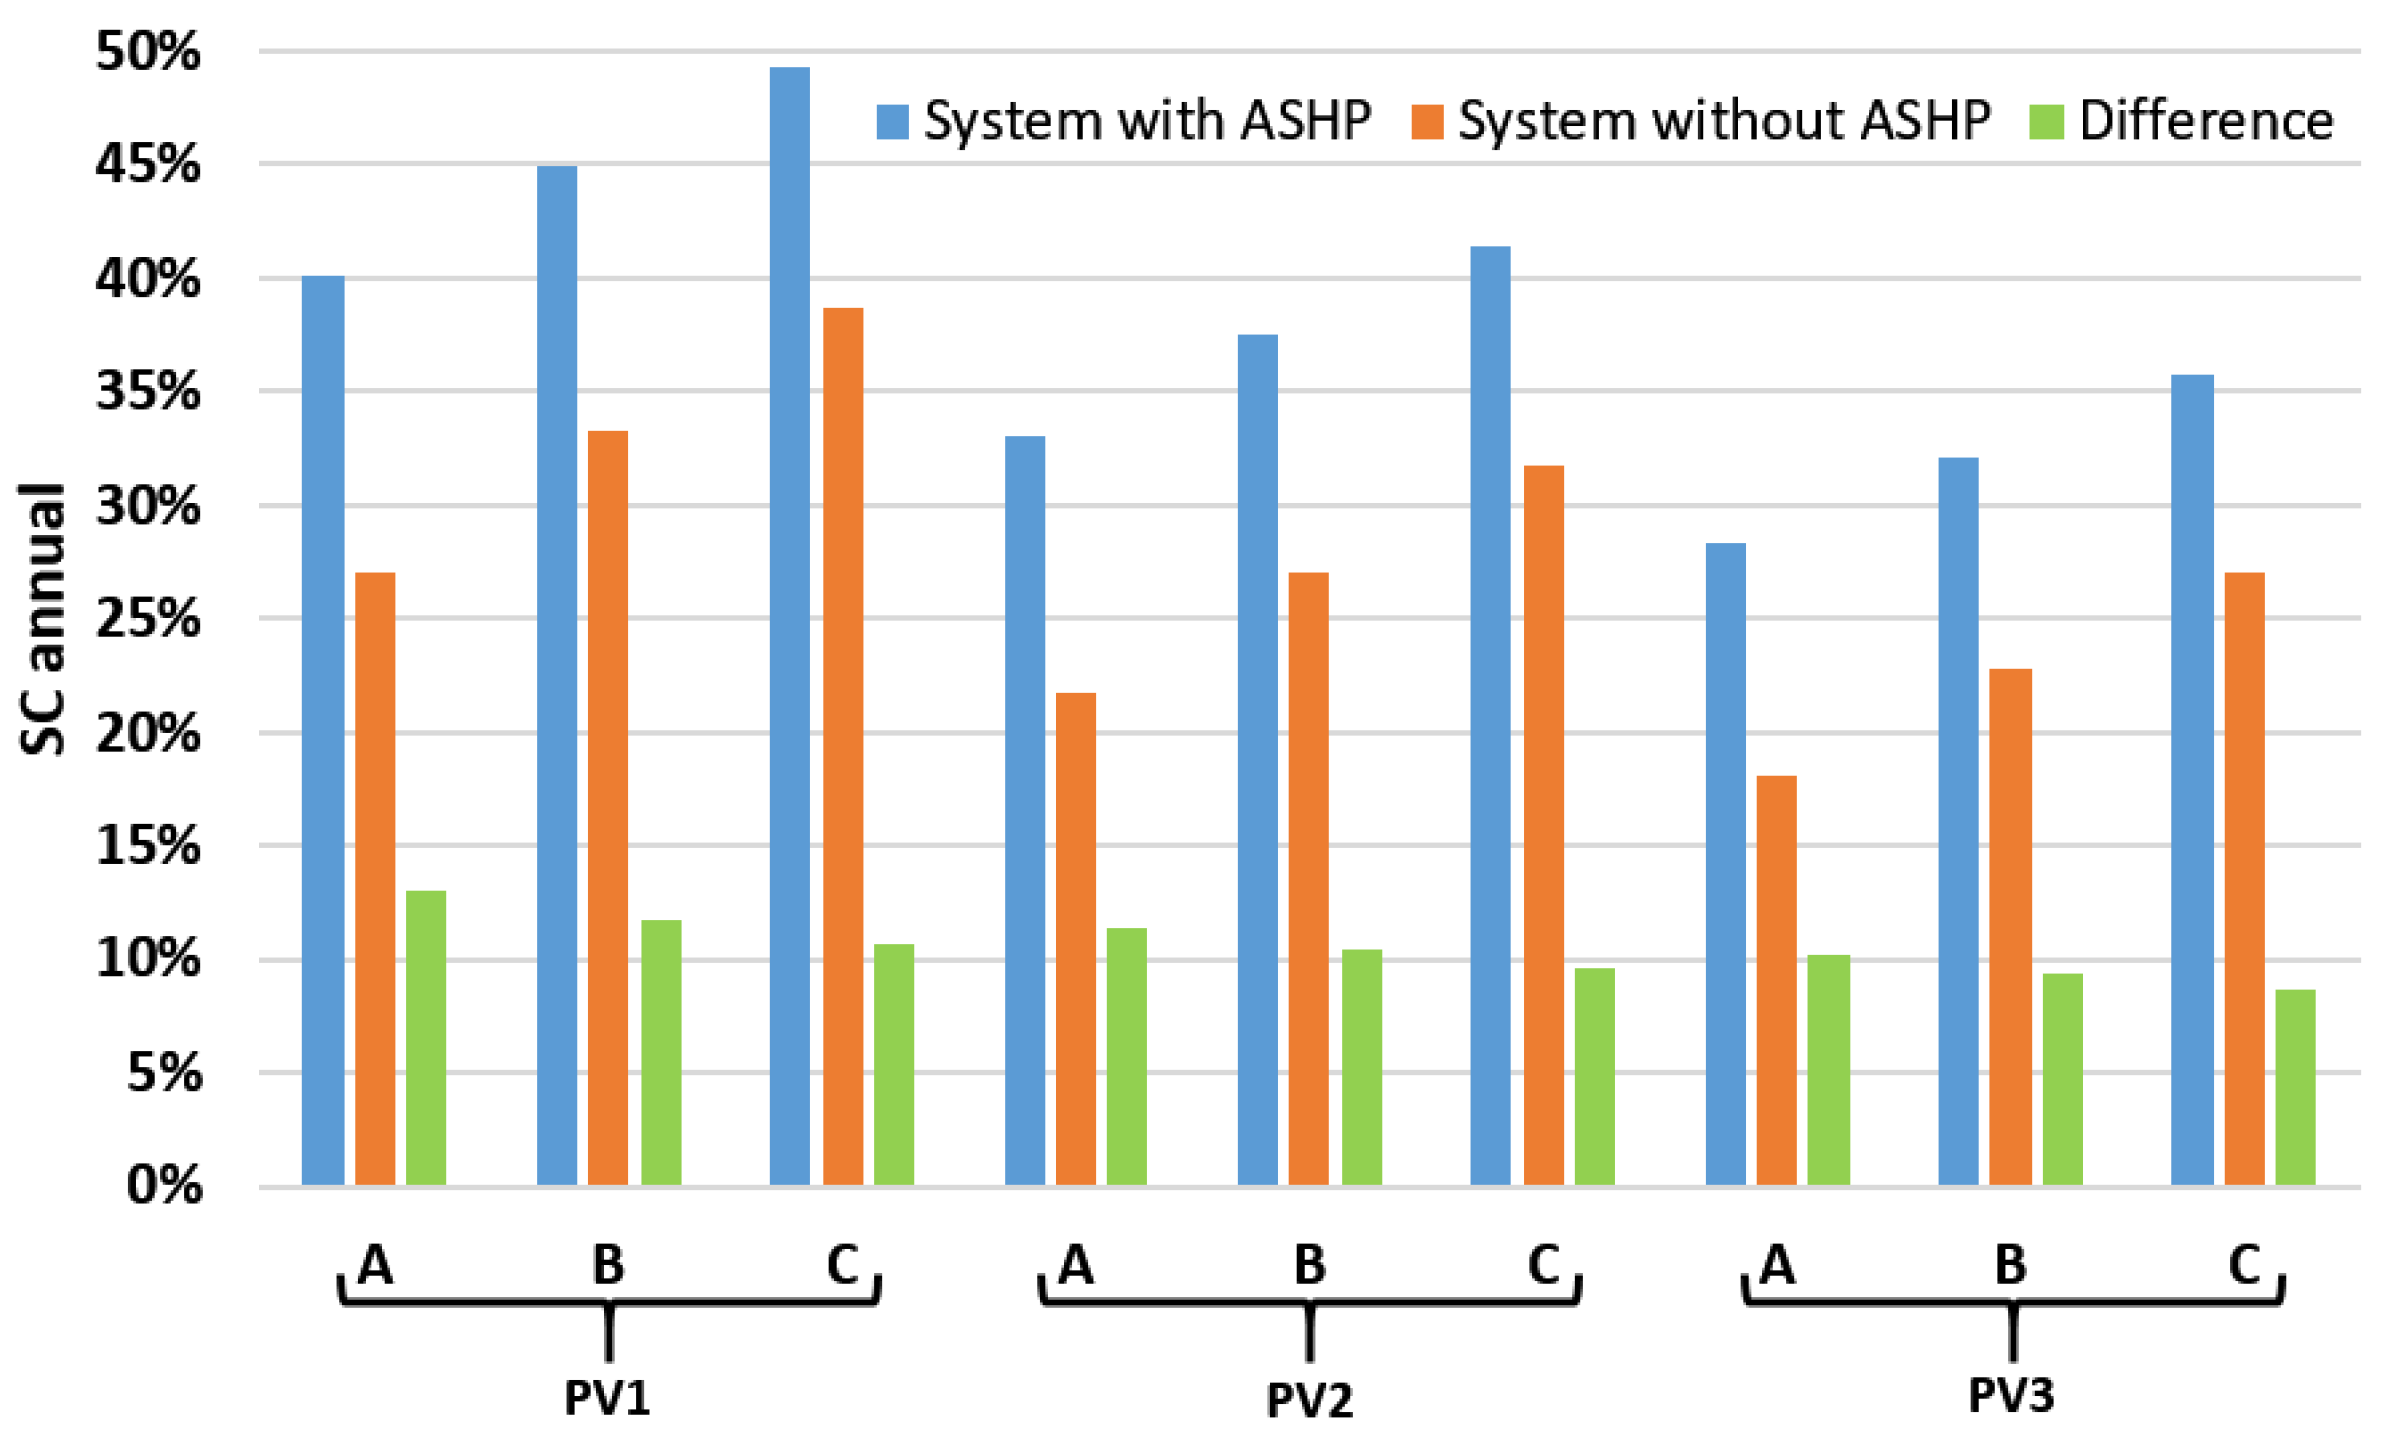
- the higher the energy consumption of the installation (resulting from the change in the energy consumption profile), the higher the SC values can be obtained; between profiles A and C, the differences in SC range from 7.5 to as much as 15.5% for installations without ASHPs and from 7.0 to 11.0% for installations with ASHPs;
- in both installation cases, it can be seen that the highest SC values are obtained during the winter time. This is due to the fact that in this period the generation of energy from PV panels is much smaller, and thus there is a greater possibility of self-consumption of this generated energy to a higher degree. In the winter term, compared to the summer period, the differences in SC range from 14.0 to 20.8% for installations without ASHPs and from 17.0 to 21.5% for installations with ASHPs;
- application of ASHP utilizing energy generated by PV causes an increase in monthly SC values from 7 to 18%.
3.3. The relationship between Egen and the demand for electricity in building
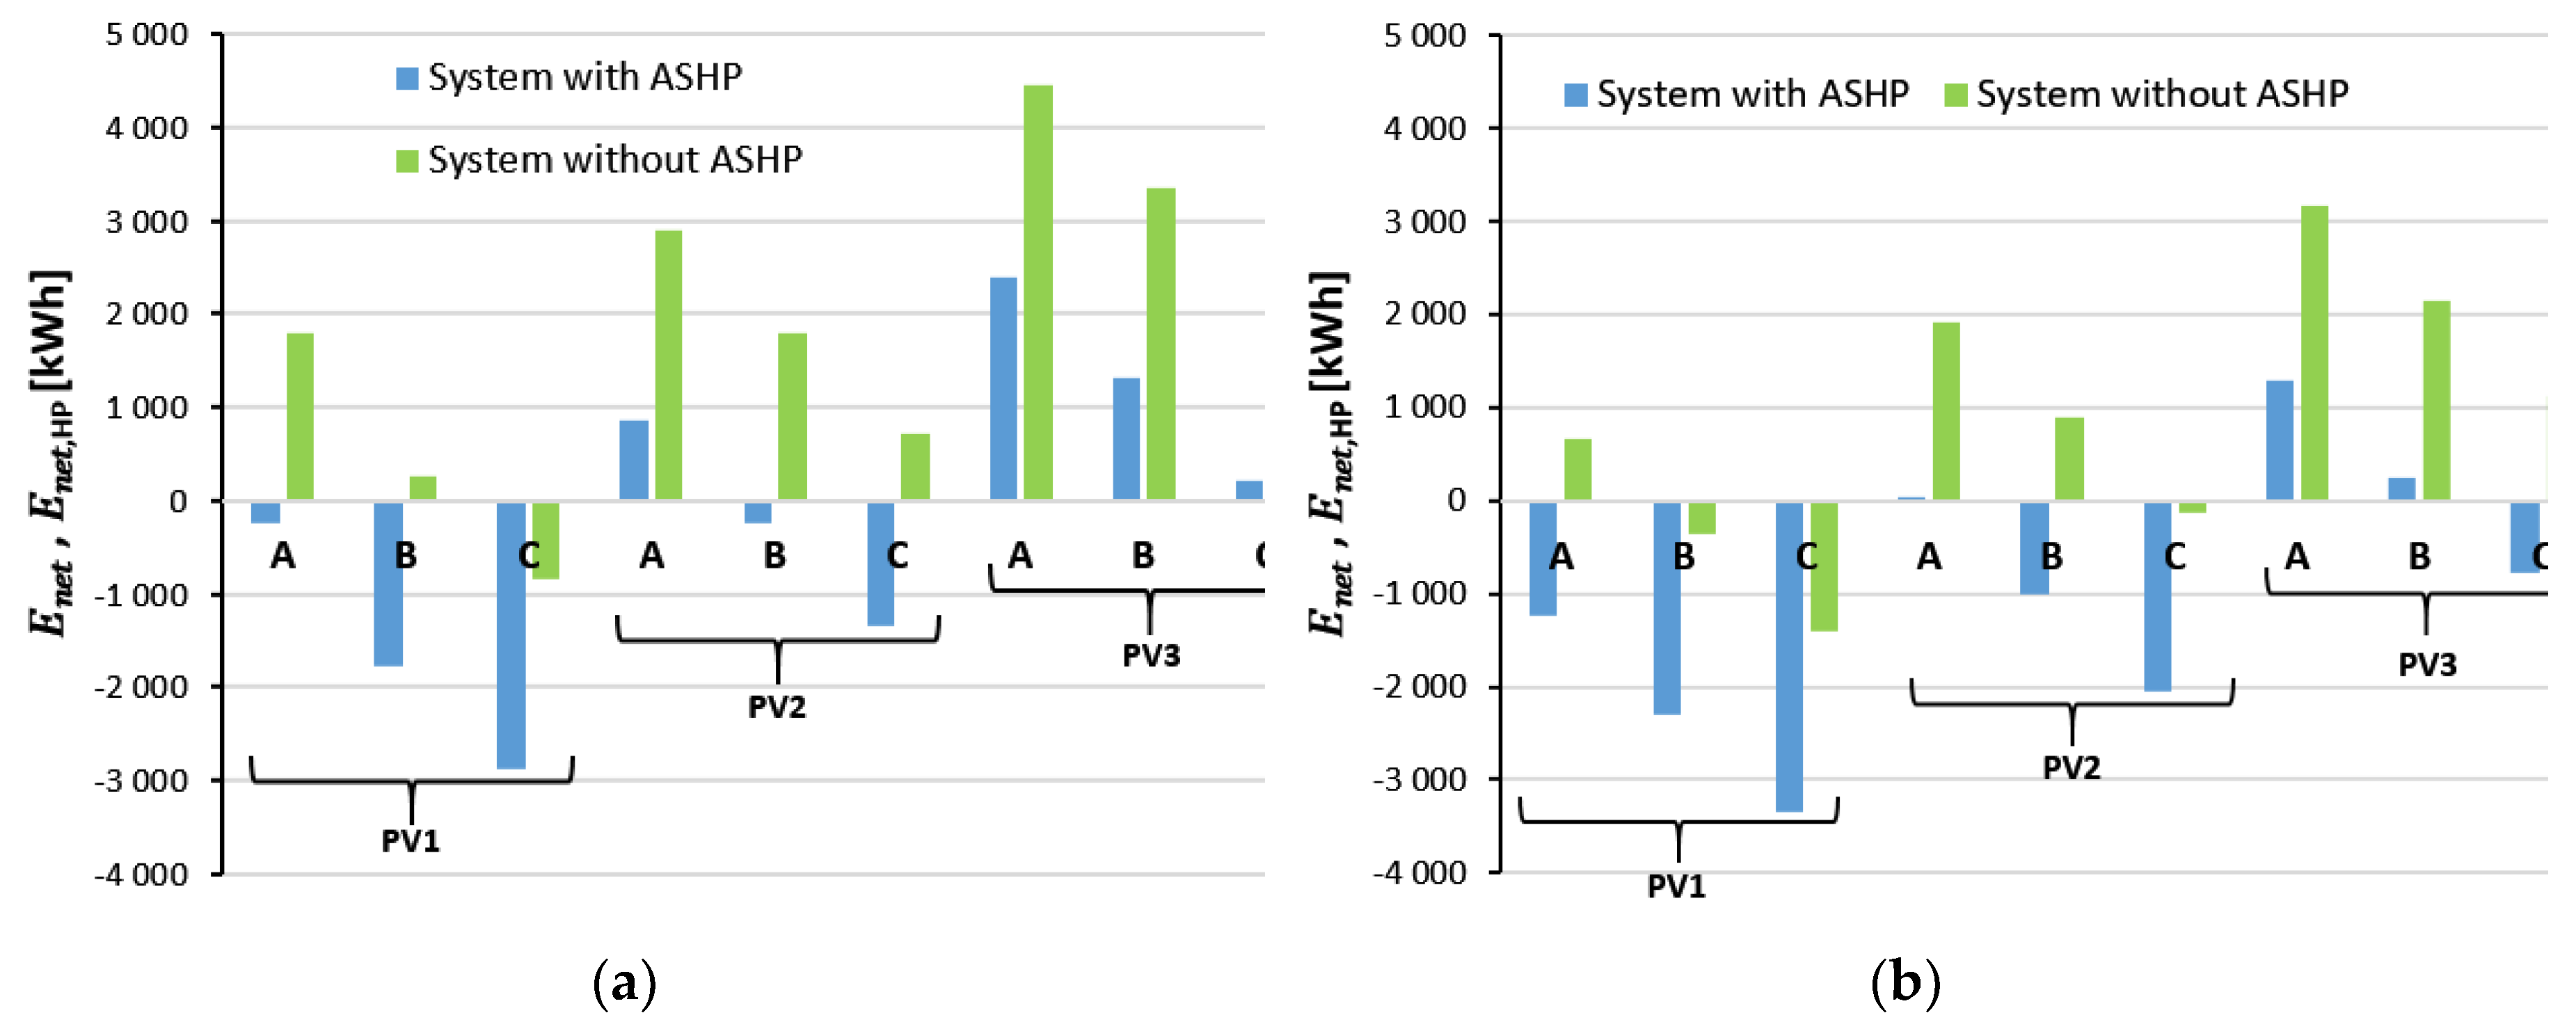
4. Conclusions
- In Polish conditions, due to the increase in ambient temperature, and thus photovoltaic cells, the efficiency of PV panels in the summer is almost 2% lower compared to the winter period.
- Determining the appropriate size of the used PV system depending on whether it is present ASHP in the installation is crucial to increase the value of the SC parameter.
- An increase in the power of PV installations (without changing the energy consumption profile) results in a decrease in the value of the SC parameter.
- In winter (with lower insolation values) compared to summer, the differences in SC values range from 14.0 to 20.8% for installations without ASHP and from 17.0 to 21.5% for installations with ASHP.
- The use of ASHP for DHW production, with specified runtime management using PV-generated energy, results in an increase in monthly SC values from 7 to 18%, and annual SC values up to 13%.
Funding
Data Availability Statement
Conflicts of Interest
Nomenclature
| Nomenclature | Description |
| a | annual |
| AC | Alternating Current |
| ASHP | Air-Source Heat Pump |
| βo | oversizing factor [-] |
| COP | Coefficent Of Performance |
| DC | Direct Current |
| DHW | Domestic Hot Water |
| electricity consumption [kWh] | |
| energy generated [kWh] | |
| E HP,a | the annual amount of electrical energy consumed by ASHP [kWh] |
| Enet | net energy parameter for installations without ASHP [kWh] |
| Enet,HP | net energy parameter for installations with ASHP [kWh] |
| EU | European Union |
| ESC | self-consumed energy [kWh] |
| E SC,a | the annual amount of PV energy self-consumed [kWh] |
| E SC-HP,a | the annual amount of PV energy self-consumed in installation with ASHP [kWh] |
| HP | Heat Pump |
| N | total horizontal solar radiation during year [kWh/m2/a] |
| η PV | efficiency of the PV installation [-] |
| PPV | PV installation power [kWp] |
| PV | Photovoltaic |
| RES | Renewable Energy Sources |
| SC | Self-Consumption |
| TRNSYS | Transient System Simulation |
| φ | grid compensation factor [-] |
References
- Bórawski, P.; Holden, L.; Bełdycka-Bórawska, A. Perspectives of photovoltaic energy market development in the european union. Energy 2023, 270, 126804. [Google Scholar] [CrossRef]
- Kurz, D.; Nowak, A. Analysis of the Impact of the Level of Self-Consumption of Electricity from a Prosumer Photovoltaic Installation on Its Profitability under Different Energy Billing Scenarios in Poland. Energies 2023, 16, 946. [Google Scholar] [CrossRef]
- Grębosz-Krawczyk, M.; Zakrzewska-Bielawska, A.; Glinka, B.; Glińska-Neweś, A. Why Do Consumers Choose Photovoltaic Panels? Identification of the Factors Influencing Consumers’ Choice Behavior regarding Photovoltaic Panel Installations. Energies 2021, 14, 2674. [Google Scholar] [CrossRef]
- Wolniak, R.; Skotnicka-Zasadzień, B. Development of Photovoltaic Energy in EU Countries as an Alternative to Fossil Fuels. Energies 2022, 15. [Google Scholar] [CrossRef]
- Gulkowski, S. Specific Yield Analysis of the Rooftop PV Systems Located in South-Eastern Poland. Energies 2022, 15, 3666. [Google Scholar] [CrossRef]
- Czajkowski, A.; Wajda, A.; Poranek, N.; Bhadoria, S.; Remiorz, L. Prediction of the Market of End-of-Life Photovoltaic Panels in the Context of Common EU Management System. Energies 2022, 16, 284. [Google Scholar] [CrossRef]
- Kulpa, J.; Olczak, P.; Surma, T.; Matuszewska, D. Comparison of Support Programs for the Development of Photovoltaics in Poland: My Electricity Program and the RES Auction System. Energies 2021, 15, 121. [Google Scholar] [CrossRef]
- Rosenow, J.; Gibb, D.; Nowak, T.; Lowes, R. Heating up the global heat pump market. Nat. Energy 2022, 7, 901–904. [Google Scholar] [CrossRef]
- Pater, S. Long-term performance analysis using trnsys software of hybrid systems with pv-t. Energies 2021, 14. [Google Scholar] [CrossRef]
- Luthander, R.; Widén, J.; Nilsson, D.; Palm, J. Photovoltaic self-consumption in buildings: A review. Appl. Energy 2015, 142, 80–94. [Google Scholar] [CrossRef]
- Zhan, S.; Dong, B.; Chong, A. Improving energy flexibility and PV self-consumption for a tropical net zero energy office building. Energy Build. 2023, 278, 112606. [Google Scholar] [CrossRef]
- Ciocia, A.; Amato, A.; Di Leo, P.; Fichera, S.; Malgaroli, G.; Spertino, F.; Tzanova, S. Self-Consumption and Self-Sufficiency in Photovoltaic Systems: Effect of Grid Limitation and Storage Installation. Energies 2021, 14, 1591. [Google Scholar] [CrossRef]
- Karimi, M.; Mokhlis, H.; Naidu, K.; Uddin, S.; Bakar, A.H.A. Photovoltaic penetration issues and impacts in distribution network – A review. Renew. Sustain. Energy Rev. 2016, 53, 594–605. [Google Scholar] [CrossRef]
- Hassan, Q. Evaluate the adequacy of self-consumption for sizing photovoltaic system. Energy Reports 2022, 8, 239–254. [Google Scholar] [CrossRef]
- Hassan, Q.; Abbas, M.K.; Tabar, V.S.; Tohidi, S.; Al-Hitmi, M.; Jaszczur, M.; Sameen, A.Z.; Salman, H.M. Collective self-consumption of solar photovoltaic and batteries for a micro-grid energy system. Results Eng. 2023, 17, 100925. [Google Scholar] [CrossRef]
- Schram, W.L.; Lampropoulos, I.; van Sark, W.G.J.H.M. Photovoltaic systems coupled with batteries that are optimally sized for household self-consumption: Assessment of peak shaving potential. Appl. Energy 2018, 223, 69–81. [Google Scholar] [CrossRef]
- Matute, G.; Yusta, J.M.; Beyza, J.; Monteiro, C. Optimal dispatch model for PV-electrolysis plants in self-consumption regime to produce green hydrogen: A Spanish case study. Int. J. Hydrogen Energy 2022, 47, 25202–25213. [Google Scholar] [CrossRef]
- Cieślak, K.J. Multivariant Analysis of Photovoltaic Performance with Consideration of Self-Consumption. Energies 2022, 15, 6732. [Google Scholar] [CrossRef]
- Koskela, J.; Järventausta, P. Demand Response with Electrical Heating in Detached Houses in Finland and Comparison with BESS for Increasing PV Self-Consumption. Energies 2023, 16, 497. [Google Scholar] [CrossRef]
- Pinamonti, M.; Prada, A.; Baggio, P. Rule-Based Control Strategy to Increase Photovoltaic Self-Consumption of a Modulating Heat Pump Using Water Storages and Building Mass Activation. Energies 2020, 13, 6282. [Google Scholar] [CrossRef]
- Vivian, J.; Chinello, M.; Zarrella, A.; De Carli, M. Investigation on Individual and Collective PV Self-Consumption for a Fifth Generation District Heating Network. Energies 2022, 15, 1022. [Google Scholar] [CrossRef]
- Varo-Martínez, M.; Fernández-Ahumada, L.M.; López-Luque, R.; Ramírez-Faz, J. Simulation of Self-Consumption Photovoltaic Installations: Profitability Thresholds. Appl. Sci. 2021, 11, 6517. [Google Scholar] [CrossRef]
- Domenech, B.; Calleja, G.; Olivella, J. Residential Photovoltaic Profitability with Storage under the New Spanish Regulation: A Multi-Scenario Analysis. Energies 2021, 14, 1987. [Google Scholar] [CrossRef]
- Psimopoulos, E.; Johari, F.; Bales, C.; Widén, J. Impact of boundary conditions on the performance enhancement of advanced control strategies for a residential building with a heat pump and PV system with energy storage. Energies 2020, 13. [Google Scholar] [CrossRef]
- Fachrizal, R.; Munkhammar, J. Improved Photovoltaic Self-Consumption in Residential Buildings with Distributed and Centralized Smart Charging of Electric Vehicles. Energies 2020, 13, 1153. [Google Scholar] [CrossRef]
- Kemmler, T.; Thomas, B. Design of Heat-Pump Systems for Single- and Multi-Family Houses using a Heuristic Scheduling for the Optimization of PV Self-Consumption. Energies 2020, 13, 1118. [Google Scholar] [CrossRef]
- Pater, S. Field measurements and energy performance analysis of renewable energy source devices in a heating and cooling system in a residential building in southern Poland. Energy Build. 2019, 199, 115–125. [Google Scholar] [CrossRef]
- Mazzeo, D.; Matera, N.; De Luca, P.; Baglivo, C.; Maria Congedo, P.; Oliveti, G. Worldwide geographical mapping and optimization of stand-alone and grid-connected hybrid renewable system techno-economic performance across Köppen-Geiger climates. Appl. Energy 2020, 276, 115507. [Google Scholar] [CrossRef]
- Solar Energy Laboratory. Volume 4 Mathematical Reference. In Trnsys 18-a. TRaNsient SYstem Simulation program.; University of Wisconsin-Madison and Thermal Energy System Specialists: Madison, USA, 2017. [Google Scholar]
- Solar Energy Laboratory. Volume 3 Component Library Overview. In Trnsys 18-a. TRaNsient SYstem Simulation program.; University of Wisconsin-Madison and Thermal Energy System Specialists: Madison, USA, 2017. [Google Scholar]
| Profile | Electricity consumption in building (Ec) | |
|---|---|---|
| kWh/year | kWh/day | |
| A (A’ in weekends) | 3 285 | 9 |
| B (B’ in weekends) | 4 380 | 12 |
| C (C’ in weekends) | 5 475 | 15 |
| PV installation | PPV (kWp) from Eq. 2 | Number of PV panels | Selected PPV (kWp) |
|---|---|---|---|
| PV1 | 4.34 | 12 | 4.56 |
| PV2 | 5.78 | 16 | 6.08 |
| PV3 | 7.23 | 20 | 7.60 |
| Parameter | Value |
|---|---|
| Panel area [m2] | 1.868 |
| Nominal maximum panel power [Wp] | 380 |
| Short-circuit current at reference conditions [A] | 11.47 |
| Current at max power point and reference conditions [A] | 10.93 |
| Open-circuit voltage at reference conditions [V] | 41.62 |
| Voltage at max power point and reference conditions [V] | 34.77 |
| Temperature coefficient of Isc [A/K] | 0.045 |
| Temperature coefficient of Voc [V/K] | -0.113 |
| Component | Short Description |
|---|---|
| Equa1, Equa2 | The equations statement; allows variables to be defined as algebraic functions of constants, previously defined variables, and outputs. |
| Type 165 | Differential controller; generates a control function (1 or 0) chosen as a function of the difference between upper and lower temperatures, compared with two dead band temperature differences. |
| Type 14b | The time-dependent forcing function; specifies the value of the water drawn at various times throughout one cycle. |
| Type 14h | Time-dependent forcing function; allows to force device operation in a specific time and repeated pattern. |
| Type 15-6 | Weather data processor; allows reading data at regular time intervals from an external weather data file and making it available to other TRNSYS components. |
| Type 24 | Quantity integrator; this component integrates a series of specified quantities over a specified period of time. |
| Type 41a | Load profile sequencer; allows the user to specify forcing functions for each day of the week that forms an annual schedule. |
| Type 65a | Online graphical plotter with output file; displays chosen system variables during the simulation. |
| Type 114 | Single speed pump; models a single (constant) speed pump that is able to maintain a constant fluid outlet mass flow rate. |
| Type 156 | Cylindrical storage tank with immersed coiled-tube heat exchanger; it simulates a water-filled, vertical, cylindrical, constant volume storage tank. |
| Type 917 | Air-to-water heat pump; this component models a single-stage air source heat pump. |
| PV system | Egen,a [kWh] | Ec,a [kWh] | E HP,a [kWh] | ESC-HP,a [kWh] | ESC,a [kWh] | Egen,a -ESC-HP,a [kWh] | Egen,a – ESC,a [kWh] |
|---|---|---|---|---|---|---|---|
| PV1 | 4634 | 3285 | 2039 | 1858 | 1253 | 2776 | 3381 |
| 4380 | 2085 | 1541 | 2550 | 3093 | |||
| 5475 | 2286 | 1793 | 2348 | 2841 | |||
| PV2 | 6178 | 3285 | 2044 | 1340 | 4135 | 4839 | |
| 4380 | 2315 | 1671 | 3864 | 4508 | |||
| 5475 | 2558 | 1964 | 3621 | 4215 | |||
| PV3 | 7723 | 3285 | 2185 | 1400 | 5538 | 6324 | |
| 4380 | 2482 | 1762 | 5241 | 5962 | |||
| 5475 | 2757 | 2089 | 4966 | 5635 |
Disclaimer/Publisher’s Note: The statements, opinions and data contained in all publications are solely those of the individual author(s) and contributor(s) and not of MDPI and/or the editor(s). MDPI and/or the editor(s) disclaim responsibility for any injury to people or property resulting from any ideas, methods, instructions or products referred to in the content. |
© 2023 by the authors. Licensee MDPI, Basel, Switzerland. This article is an open access article distributed under the terms and conditions of the Creative Commons Attribution (CC BY) license (http://creativecommons.org/licenses/by/4.0/).


