1. Introduction
Ultrasonic atomization (UsA), with a fundamental yet paramount importance of generating a swarm of small droplets (mist) in uniform distribution, requires the prior formation of a fountain or jet of liquid having developed out of initially induced protrusion of the free surface (Tsuchiya et al., 2011; Wang et al., 2022). The most extensively studied in the literature thus involve the droplet size distribution (DSD) of emerging mist (e.g., Kobara et al., 2010; Sekiguchi et al., 2010; Kudo et al., 2017), then followed by the extent of separation/ concentration of solute (or in some cases “targeted” suspension) into the mist, often along with its mechanisms described (e.g., Sato et al., 2001; Nii and Oka, 2014; Naidu et al., 2022). While the dynamic structure of the (general) liquid fountain could be examined visually (e.g., Tsuchiya et al., 2011; Wang and Tsuchiya, 2022), more systematic visual elucidation has been made on the beads-regulated fountain in association with internal cavity and/or (external) droplets bursting (Fujita and Tsuchiya, 2013; Tomita, 2014; Simon et al., 2012, 2015; Wang et al., 2022). Some efforts have been directed towards quantifying the periodic nature, specifically dominant frequencies, exclusive to the fountain-beads—modeled by a series of isolated-drops—oscillations (Shen et al., 2010; Bouwhuis et al., 2013; Watanabe et al., 2018; Wang et al., 2022).
Among those aspects listed above, the UsA’s structural aspect is of the primary concern here; more specifically, it is the present study’s intent to focus on four representative transitions/ demarcations in the acoustic fountain structure and dynamics: 1) the onset of a protrusion on otherwise flat free surface; 2) the appearance of undulation along the growing protuberance; 3) the triggering of emanating beads fountain out of this foundation-like region; and 4) the induction of droplets bursting and/or mist spreading. Prior to providing the relevant literature findings specific to each transitional “state/phase,” the UsA mechanisms—i.e., how the mist generation would occur in association with selective separation into the mist—are reviewed first.
Mechanistic descriptions of UsA: A couple of mechanisms have been proposed for quite a while in the literature, in particular for selective separation of solute including surfactants or suspended particles from a solution: capillary-wave hypothesis supported by, e.g., Qi et al. (2008), Collins et al. (2012), and Blamey et al. (2013); and cavitation hypothesis by, e.g., Neppiras and Noltingk (1951), Kojima et al. (2010), Ramisetty et al. (2013), and Inui et al. (2021). Besides these, Antonevich (1959) claimed for the first time that UsA would be an outcome of a combination of cavitation-bubble collapsing and capillary-wave instability, with the size of emitted droplets determined by their release mechanism; since then this conjunction hypothesis has been supported by, including Boguslavskii and Eknadiosyants (1969), Rozenberg (1973), Barreras et al. (2002), Kirpalani and Toll (2002), Simon et al. (2012, 2015), Tomita (2014), and Zhang et al. (2020).
Some visual evidence supports the capillary-wave hypothesis, suggesting that μm-size droplets are pinched off from the wave crests during surface oscillations prevailing along a perturbed protuberance or a conical fountain (Barreras et al., 2002; Tsuchiya et al., 2011). There is little direct (visual) evidence, however, that mist generation is related to the occurrence of cavitating bubbles within the fountain (Fujita and Tsuchiya, 2013; Tomita, 2014; Simon et al., 2015). In some limited circumstances, the extent of cavitation yield is represented by that of sono[chemical] luminescence (Lee et al., 2008, 2011; Son et al., 2011). As demonstrated by Kojima et al. (2010), sonochemical luminescence could be observed not only in the bulk liquid near the transducer and liquid surface but also in the fountain when UsA occurs.
The following four subsections with paragraph headers are to be described in terms of “stability of the liquid-surface protrusion” or its dynamic “structural variation” by specifying its controlling factors: radiation pressure (or traveling wave) field, anti-resonant pressure (or standing wave) field, induced flow field, and the factors’ thresholds levels.
Protrusion on free surface: The radiation force resulting from the traveling wave will induce a “mound”—as claimed by Simon et al. (2015) for a focused ultrasound wave—on the free surface. This mound of “parabolic” curvature on its tip would in turn provide the interactive field between the “waves incident on and reflected from” the pressure-release (i.e., wave-absorbing) interface (Simon et al., 2015), causing the generation of cavitation bubbles “inside” the protuberance. Alternative insights into the contribution of cavitation to driving the UsA would be gained (Lee et al., 2008, 2011; Son et al., 2011) for a rather flat free surface—thus in the absence of any UsA liquid fountain triggered—yet.
With a properly selected set of three different driving frequencies, 0.17, 0.45 and 0.73 MHz, for a given applied power of 20 W (1.1 W/cm2), Lee et al. (2011) came up with the following distinctive—and possibly inherent—shift in mechanistic trends: the lower frequency (on the order of MHz) would induce a standing- wave field as the wave sets in propagating upwards; the intermediate (∼ -MHz) frequency would result in appreciable attenuation in the acoustic pressure amplitude, developing a traveling-wave field above the transducer vs. the standing wave still prevailing below the free surface; at the higher (∼ -MHz) frequency, with this acoustic energy attenuation becoming significant enough to intensify the energy gradient along the propagating acoustic wave, the predominant mechanism would shift from the radiation pressure associated with the traveling wave to the acoustic streaming.
Orisaki and Kajishima (2022) conducted a direct numerical simulation of the very beginning phase of water surface rising/protruding under 0.5-MHz ultrasound irradiation. Depending on the rising rate of the water surface, its height-increasing process was divided into three phases/stages: increasing slightly, with acceleration and at constant speed. Separate explanations of the protruding mechanisms for the individual stages were provided: 1) The acoustic radiation pressure equals the acoustic kinetic energy density, resulting in a slight rise in the water surface; 2) As the region between the sound source and the free surface turns to resonance, the acoustic radiation pressure acting on the surface will increase profoundly, causing the surface to rise rapidly. Through the entrainment of a fluid via rapid rising of water surface, acoustic streaming is induced towards the risen region; 3) Eventually, the water surface will shift to non-resonance, leading to the acoustic radiation pressure decreasing significantly. In this last phase, the velocity of the acoustic streaming towards the rising is reported to become nearly constant.
Stability of growing protuberance: Realizing the shape and evaluating the height of the acoustic fountain through numerical simulation under different input pressure levels, Xu et al. (2016) claimed that, while the ultrasonic field being an anti-resonant pressure (i.e., standing wave) field, the radiation pressure was minimum and the fountain surface tended to be stable. Their findings, however, are limited to just a mound-like precursory structure. Still an essentially protuberant state of water fountain, Kim et al. (2021) conducted an experimental study, by applying focused ultrasound at two frequencies in a proper range (see above), 0.55 and 1.1 MHz, and using particle image velocimetry (PIV) to map the flow field induced about the “ultrasonic focal spot.” They noted three different regimes—through increasing the pressure level of the transducers—all of which were claimed to have the acoustic radiation force be the predominant driving force.
Aikawa and Kudo (2021) rendered useful insights, in terms of the thresholds in triggering free radical generation and atomization, into a demarcation in structural variation of the free surface. The former phenomenon is an outcome of the cavitation collapsing process; the latter should require the shape transition of free surface (Wang and Tsuchiya, 2022) from a protrusion to a “slender” fountain (of aspect ratio exceeding unity; Aikawa and Kudo, 2021). Upon increasing the transducer input power density, they detected essentially the identical threshold level, 2.5 W/cm2—for all these four [cavitation collapsing—free radical(s) generation—free-surface shape transition: from protuberance to prolate fountain—atomization] phenomena. They further recognized, through focused shadowgraphy, the so-called “spotty-shaped high-intensity nodes”—originating from the pressure-releasing “parabolic mirror” interface (Simon et al., 2015). It is important then to note that its converging effect would promote the cavitation inside the protrusion, and that the prevalence of such cavitation could in turn trigger the “abruptly shape-transitioning” fountain which would lead to the atomization.
Emergence of beads fountain: When the ultrasonic wave has sufficient intensity or acoustic radiation pressure to overcome some threshold limit, a beads fountain—a fountain consisting of a chain (sometimes limited to a doublet or triplet) of beads in contact—will emerge from the foundation-like region, often accompanied by bursting droplets (Fujita and Tsuchiya, 2013; Tomita, 2014; Simon et al., 2012, 2015; Wang et al., 2022). Fujita and Tsuchiya (2013), applying ultrahigh-speed imaging (at 0.25 megaframes/s) with a set of parameters (a flat ultrasound of 2.4 MHz with 2.0 W/cm2 intensity), managed to capture a series of evidential images [reproduced in Wang et al. (2022)] of a cavity—either a single (irregular-shaped) void or tightly clustered (tiny cavitating) bubbles in a group—within a fountain bead. This cavity was observed to move across laterally towards the gas–liquid interface, leading to droplet bursting.
Tomita (2014), with a focused ultrasound transducer (of 1 MHz), provided visual evidence (at 50 kfps) for cavitation inside the primary bead of a double-beads fountain/jet to recognize the surface elevation and jet breakup, with their threshold conditions specified, and fine droplets sprayed out of the neck—claimed to be induced by the collapse of capillary waves—between the primary and secondary beads. Simon et al. (2015) utilized also focused transducers over rather wide ranges of ultrasonic frequencies (2.165 mainly, 1.04 and 0.155 MHz) and sound speeds (1.14−1.90 km/s), but with moderate focal acoustic intensities on the order of several , but requiring at least 180, of W/cm2. They provided similar visual evidence (at 5−30 kfps) with the threshold, in the acoustic intensity, for atomization being liquid-dependent.
Droplets bursting and/or mist spreading: In addition to the (rather stable) mound-like structure described so far, the present study concerns acoustic fountains which are not only unstable but also being associated with eventual mist spreading [out of the Finely-Structured Surface Region (FSSR)] as well as liquid ligaments formed due to tip breakup [the Lumped-Crest Region (LCR)] (Tsuchiya et al., 2011; Wang and Tsuchiya, 2022).
Over a wider input-power range of 5−50 W (≅ 0.25−2.5 W/cm2) but at a fixed driving frequency of 0.49 MHz, Kojima et al. (2010) conducted measurements, through a laser Doppler velocimetry (LDV) and sonochemical luminescence, on the spatial distributions of liquid flow and acoustic pressure, respectively. They confirmed—with increasing input power beyond 1.5 W/cm2—that the fountain indeed prevailed with appreciable atomization, along with sonochemical luminescence detected within both the bulk liquid and the fountain.
Simon et al. (2015) reported a non-spherical (triangular) deformation of the fountain beads prior to atomization, demonstrating that cavitation bubbles should be a significant driving force for atomization in beads fountains. Wang et al. (2022) observed the surface oscillations of beads fountain, before atomization set in, from ellipsoid- to diamond-shape and finally to a hexagonal. They suggested in addition that a minimum driving frequency for the beads to be formed was roughly identified to be ≈ 0.8 MHz or higher; however, a systematic evaluation of this lower bound has not been given yet.
In the present study, high-speed, high-resolution visualization is utilized to identify the surface dynamics of different states of acoustic fountain—ranging from a mere protruding state to a mist-associated state of higher aspect ratio—over wider ranges of acoustic parameters (mainly, the excitation frequency and the input power density). The objectives of the study are mainly three fold: to find the relevant acoustic thresholds for the demarcations in the structural variations of free-surface morphology into the fountain; to confirm and extend (to wider acoustic conditions) the size specificity and periodicity exhibited by the beads fountain through both experimental (including fast Fourier transform) and model-based approaches; and to attempt to physically interpret visually observed, additional phenomena such as possible bifurcation.
2. Experimental
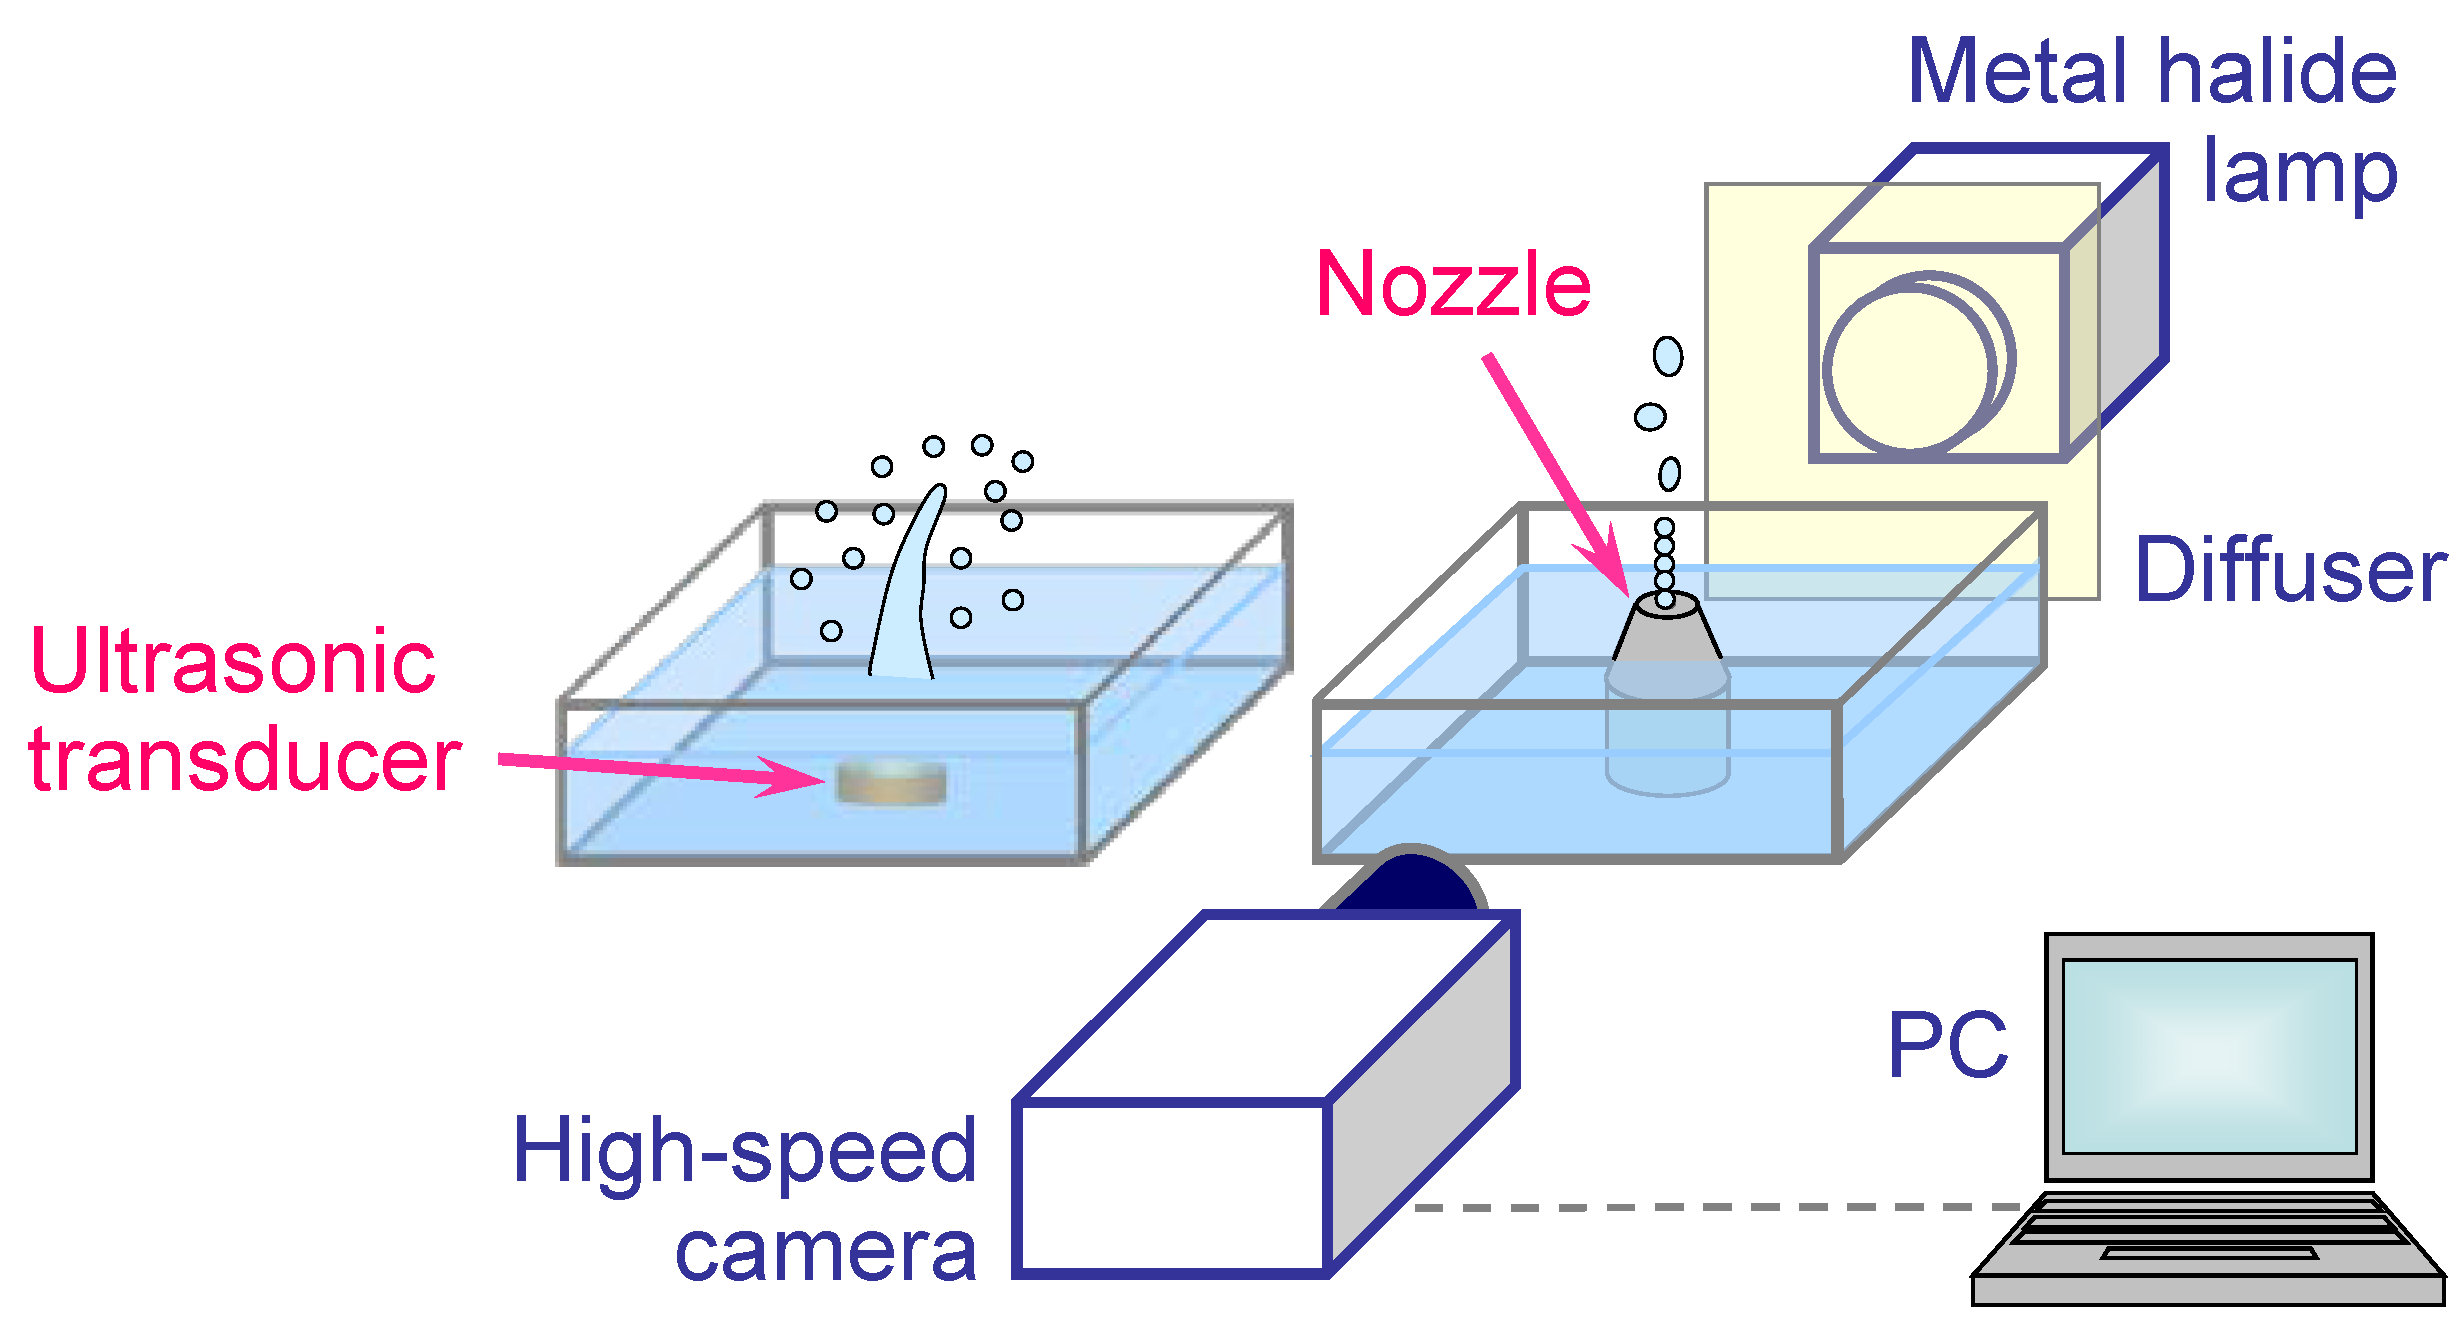
Figure 1 provides a schematic of experimental setup used for visualizing the UsA process. An ultrasonic transducer having a wide range of driving/excitation frequencies [KAIJO QT-011 with frequency shifting/tuning capability:
0.43, adjustable between 0.60 and 0.95 (with an increment of 0.05), 1.0, 1.6, 2.0 and 3.0 MHz] was placed on the bottom of a square vessel with its dimensions 200×200×185(height) mm. For selected runs, on top of the transducer’s oscillating disk (20.0 mm in diameter with an effective diameter of oscillation, 16 mm) was installed directly a Teflon
® nozzle (Wang
et al., 2022) to help stabilize the liquid column. Its installation angle was fixed at 0° (
viz., the ultrasonic irradiation was directed vertically; Wang and Tsuchiya, 2022). The input power applied to the transducer was changed over 1−20 W (its density examined then ranged
0.5−10 W/cm
2).
The other conditions as well as procedure are essentially identical to those in Wang et al. (2022). They are listed here for the sake of completeness: the effective liquid depth kept 25 mm, or 32.5 mm above the vessel bottom; the liquid used being an aqueous ethanol solution with initial concentration of 50 wt% (28 mol%) at 25°C; the UsA operation of at most 10 seconds.
High-speed visualization: A digital camera (Photron FAST CAM MINI AX100) attached with a macro-lens (Nikon Micro-Nikkor 105 mm f/2.8) was used, as in Wang et al. (2022), for imaging the dynamics of liquid protrusion or fountain, as well as their associated phenomena. The image-capturing parameters were: frame rate(s) up to 5,000 fps (with a shortest exposure time of 197 µs) and a resolution of at least 512×512 pixels; in most runs 5 s after the transducer turned on, a 0.2-s period of image data were aquired. A metal halide lamp (Lighterrace MID-25FC) provided backlighting whose non-uniformity was reduced through a sheet of light diffuser (see
Figure 1) between the protrusion/fountain and the lamp.
Image processing: Two types of image analyses were conducted:
dynamic tracking (including time-series data) of the free-surface protrusion and
static outlining (time-averaged, instantaneous shape) of the fountain beads. The former (see
Section 3.1 for the resulting outcome) was realized with an image analysis software (
DItect Dipp Motion) and the latter (see
Section 3.2) with another software (
DItect Dipp Macro). In particular, for the details in a sequence of the procedures for image processing and data acquisition of the latter, refer to Wang et al. (2022). The original images of the liquid surface (both the protrusion and the column) in the air were binarized; including this binarization, the procedure for obtaining image-evaluated feature of an ellipse representing each bead in contact along the liquid column, via a video analysis software (
Keyence Movie Editor), can be found also in Wang et al. (2022).
Time-series data analysis: The same procedure as in Wang et al. (2022) or Wang and Tsuchiya (2022) is used in analyzing a time sequene of images of instantaneous state, or phase —more specifically, the protruding height
. Provided it exhibits fluctuations, it is attempted to apply fast Fourier transform (FFT) to the resulting time-series data/signals
so as to extract the dominant frequency(ies) if any. As conduced by Wang et al. (2022), a given time-domain signal
is to be decomposed into a frequency-domain spectrum
, employing a fast, efficient algorithm (MathWorks MATLAB
® 2022b). The aquired signal corresponding to the former sum of discrete elements,
, sampled at equal intervals, was processed to obtain the latter spectrum:
where the term specifying the inner product will be given by the
-th power of
(Percival and Walden, 2000).
3. Results and Discussion
The UsA sequence of the initiating free-surface protuberance or “mound,” the resulting liquid fountain, followed by its eventual association with mist emergence, is captured in images over wide ranges of experimental conditions. It is thus characterized in a stage-wise manner and discussed from mechanistic viewpoints in both static/time-averaged and dynamic natures, over selected ranges of driving frequencies as broad as
0.43−3.0 MHz and input power densities,
0.5−10 W/cm
2 (see
Section 2).
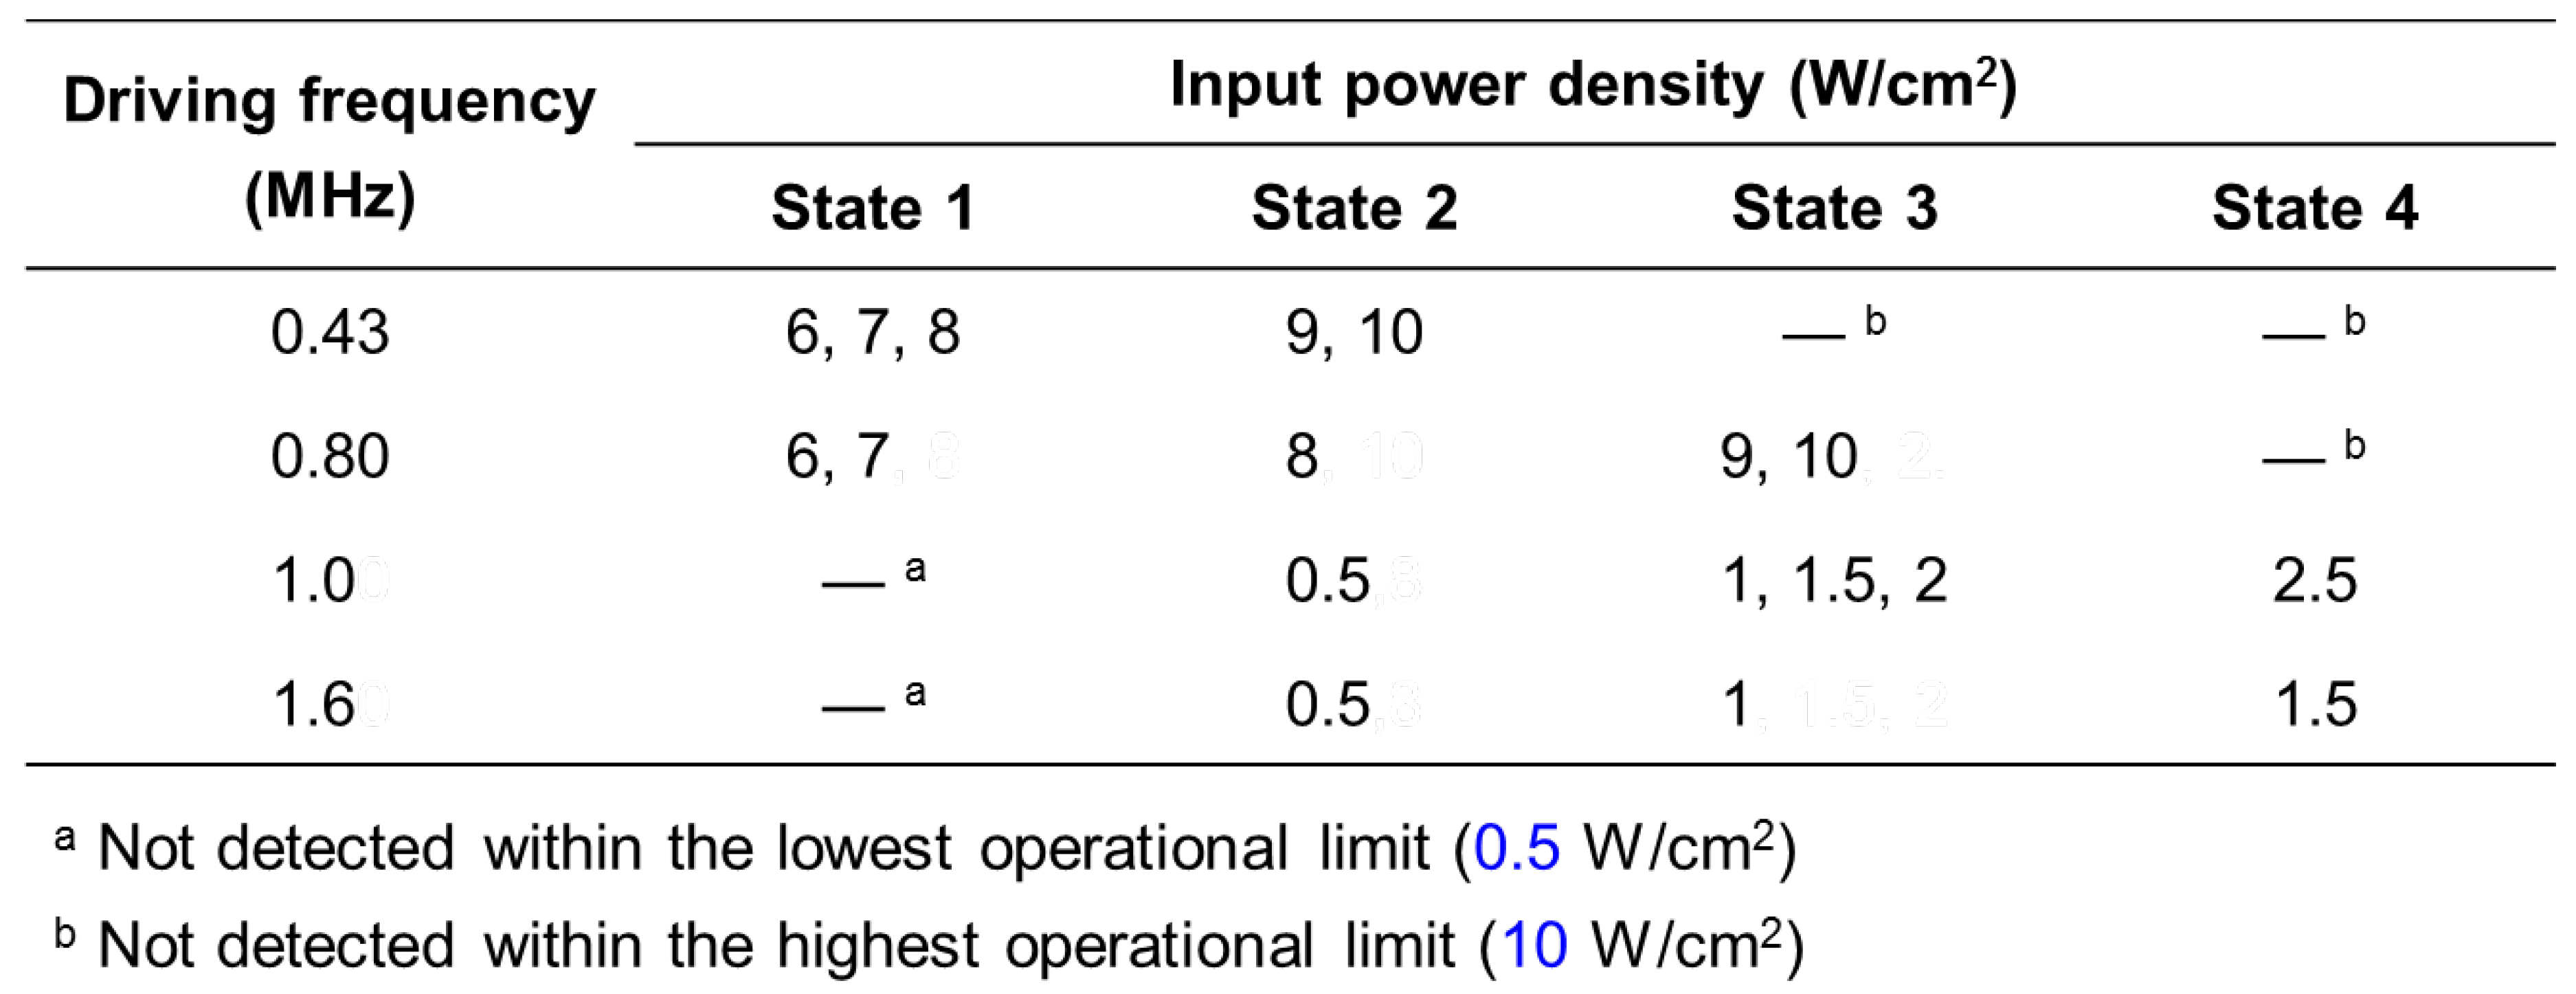
Figure 2 shows typical images of the four states/phases signifying the transitions described in
Section 1, along with the relevant acoustic conditions summarized in
Table 1.
The first state has a shape of rather shallow, smooth mound kept stationary [see
Figure 2(a)] under the sets of acoustic conditions (driving frequencies and input power densities) as given (on the 1st and 2nd columns in
Table 1). As the combination of these two parameters is properly adjusted (3rd column—vs. 1st—in
Table 1), the protrusion becomes sharper with appearance of characteristic waves “dissecting” its surface; its shape as a whole still maintains the bell-like mound [
Figure 2(b)]. With the combination of the parameters in different settings (4th column as well as 1st in
Table 1)—requiring a minimum/threshold driving frequency exceeding 0.43 (as high as 0.80) MHz—a chain of liquid beads will emanate out of the mound [
Figure 2(c)]. As the minimum driving frequency is further raised, such a beads structure would be destabilized, exhibiting a complex structure [
Figure 2(d)]. A similar set of transition states, reported (for water fountaining) by Kim et al. (2021) who applied
focused ultrasound at two distinct frequencies, 0.55 and 1.1 MHz, were termed as “weak, intermediate (stable) and highly forced (explosive)” fountains (see
Section 1). The detailed description of each transition state is provided below in a separate section.
3.1. Free-Surface Protrusion and Its Growth
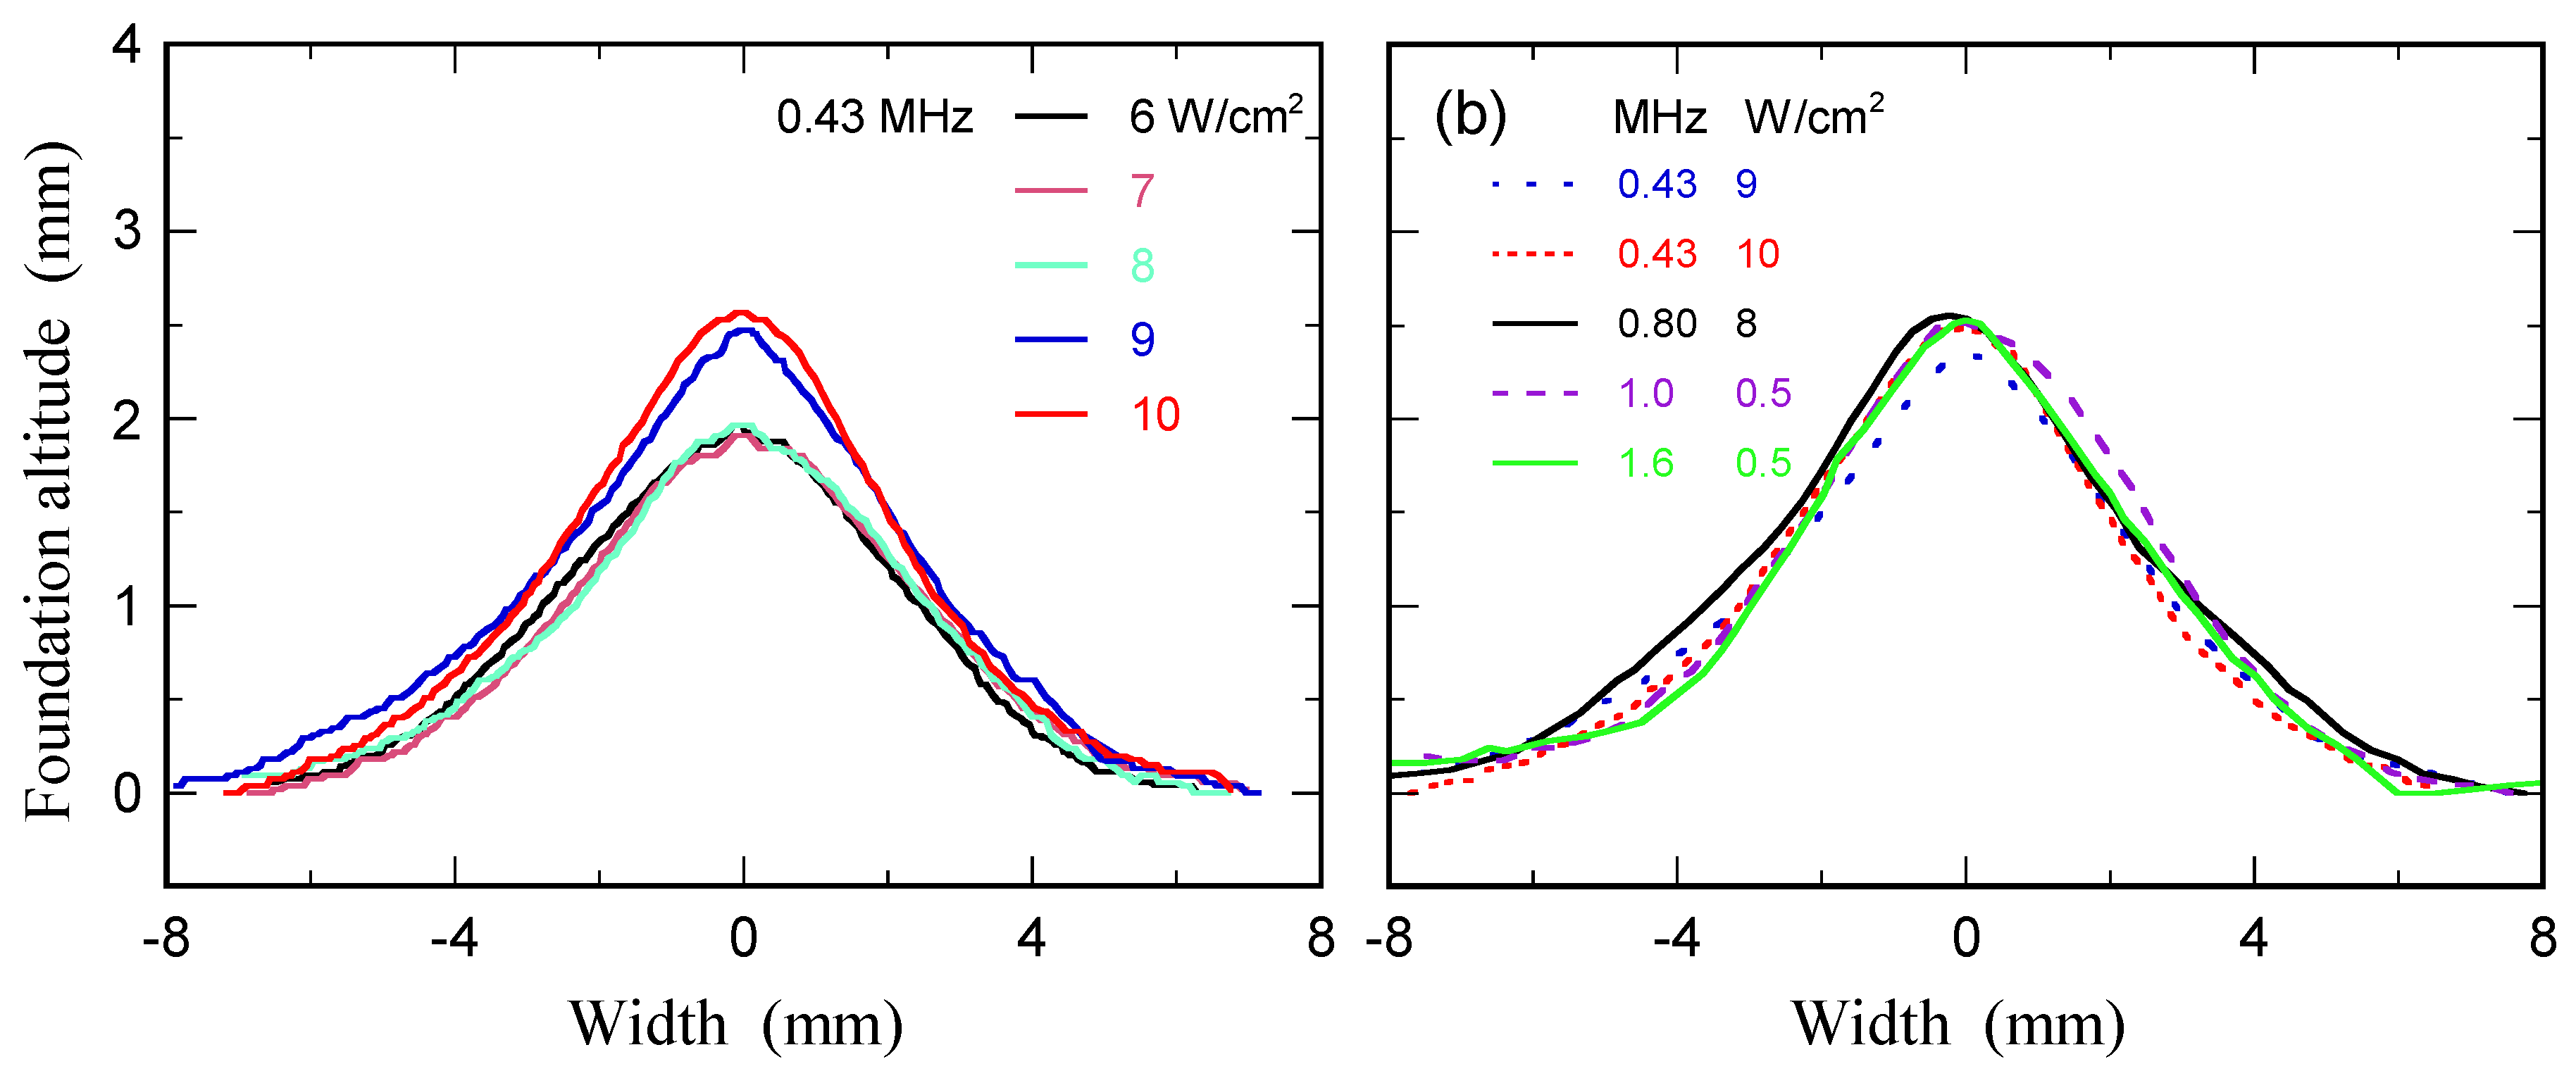
The geometric characterization of the bell-shaped mound of the liquid free surface can be made by tracing its outline, as shown in
Figure 3. As an outcome of the image processing described in
Section 2, the interface boundary/outline extracted, by confining it down to 1 pixel, is provided, each for a specific combination of the two operating parameters: (a) for the lowest driving frequency of 0.43 MHz with varying (over a widest range of) input power density from the minimum of 6 W/cm
2—below which no appreciable protrusion was visually recognized in this study—to 10 W/cm
2; (b) for the proper combinations (listed in
Table 1) to realize the second state [see
Figure 2(b)].
Geometric universality: An important finding to be stressed here [shown in
Figure 3(a)] is that—while the mound exhibits an essentially identical height as well as shape for the input power range of 6−8 W/cm
2—the height will increase
stepwise as the power is raised from 8 to 9 W/cm
2 and again maintains the same
yet new level at 9 and 10 W/cm
2. Similar observations, with quantitative evaluations of the steady-attained height of acoustic fountain, were made by Xu et al. (2016) numerically and Kim et al. (2021) experimentally, who both reported a step increment—with an increase in the acoustic pressure—of
half the ultrasound wavelength. Such a stepwise transition from the 1st to 2nd state identified in this study would correspond to that from the weak to the stable fountain reported by Kim et al. (2021); this transitional regime spanning the states of topologically identical geometries should be a crucial “stage” covering from the induction to the establishment of the Foundation Region (FR; Tsuchiya
et al., 2011) of the general configuration of the UsA fountain. It is to be added here that the bottom diameter, or width, of the protrusion appears to be preserved, due probably to the driving frequency fixed at 0.43 MHz,
i.e., under the same
directivity of ultrasound irradiated.
Another point to be noted in regard to the mound geometry is shown in
Figure 3(b): its outline for the 2nd state,
i.e., the being-established, rather steady/stable FR of the fountain, extracted via image processing, shares essentially the same “universal” shape and—more importantly—height for all the combinations of the two acoustic conditions as listed on the 1st and 3rd columns in
Table 1. In this set of combinations, however, the width of protrusion differs slightly, depending on the driving frequency used; in general, the higher the frequency is, the narrower—with some exception—the width would be.
Protrusion of concentric circles induced on free surface: As can be seen in
Figure 2(b), the mound will “grow”—become higher—with either increasing input power density (at a fixed driving frequency) or vice versa; this process is often observed to concur with the appearance of “regular undulation” (a series of concentric circles) superimposed on the general surface outline of the protrusion, some indication of which could be already recognizable at lower input powers in the 1st state. As claimed by Tsuchiya et al. (2011), who proposed that the vertical distance spanning each “local peak” of the undulation (undulation “pitch”) should correspond to
half the wavelength, a unique feature of such undulation lies in its
regularity being controlled by the frequency—thus the
wavelength—of the propagating ultrasound.
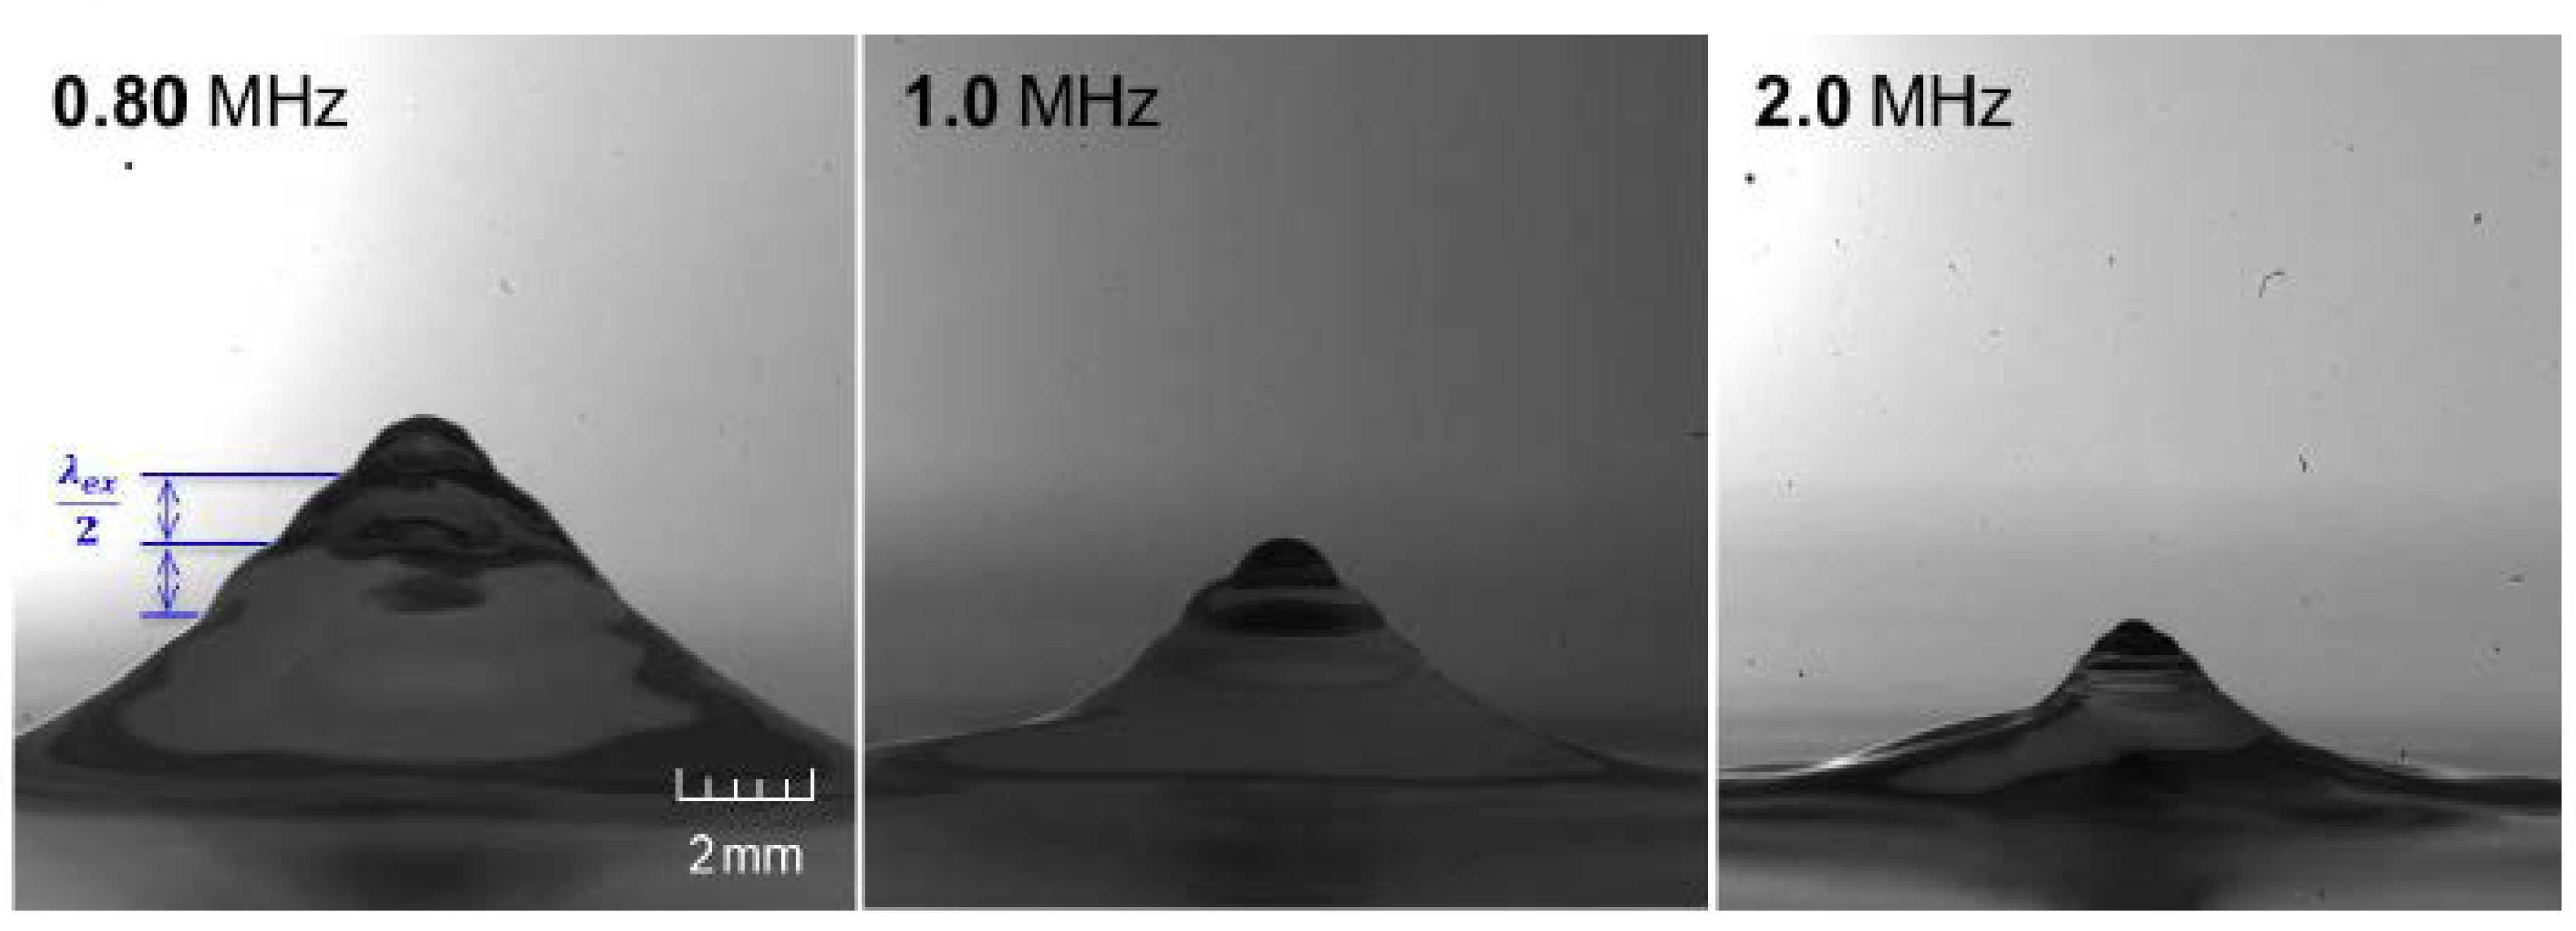
Figure 4 depicts such undulation along the mound surface observed at different driving frequencies. For the driving, or excitation, frequencies of
0.80, 1.0 and 2.0 MHz, the undulation pitches are measured to be 0.90, 0.79 and 0.34 mm, respectively, corresponding to roughly
half the ultrasonic wavelength. Note that the pertaining wavelengths (
—as excited) are evaluated to be 1.84, 1.47 and 0.74 mm, respectively, where the sound speed
of 1,470 m/s in 50-wt% ethanol aqueous solution at 25°C (Mijaković
et al., 2011) is adopted, and also that Tsuchiya et al. (2011) used an ultrasound transducer (Honda Electronics HM-2412) with a driving frequency of 2.4 MHz in water to provide—though limited—the detected undulation having a vertical distance of 0.32 mm for each local peak.
The wave-specific nature—i.e., the characteristic length being strongly dependent on the acoustic wavelength—in a phenomenon of concern, as above, appears to have a playing role in physically describing (almost) every state of the UsA process. In such a description, it is important to realize that the frequency of the ultrasonic wave may not always equal : it has been claimed in the literature that once sufficient instabilities are set in to induce the liquid-column fluctuations observed (in the 3rd state to be described in detail below), there is a tendency to have (e.g., Lang, 1962; Qi et al., 2008; Wang et al., 2022)—otherwise (Tomita, 2014; Simon et al., 2015). In describing the above undulation prevailing in the 2nd state of negligible fluctuating instability, which can be characterized by the vertical span of peak-to-peak distance of the undulation or its pitch, the two pitches were found—and are presumed—to correspond to where .
Height fluctuations: While a first-sight outline of the 2nd-state protrusion appears stable/steady, detailed observations reveal that its height will start fluctuating with small amplitudes—(indication at least of) an onset of an instability, in addition to its surface undulation.
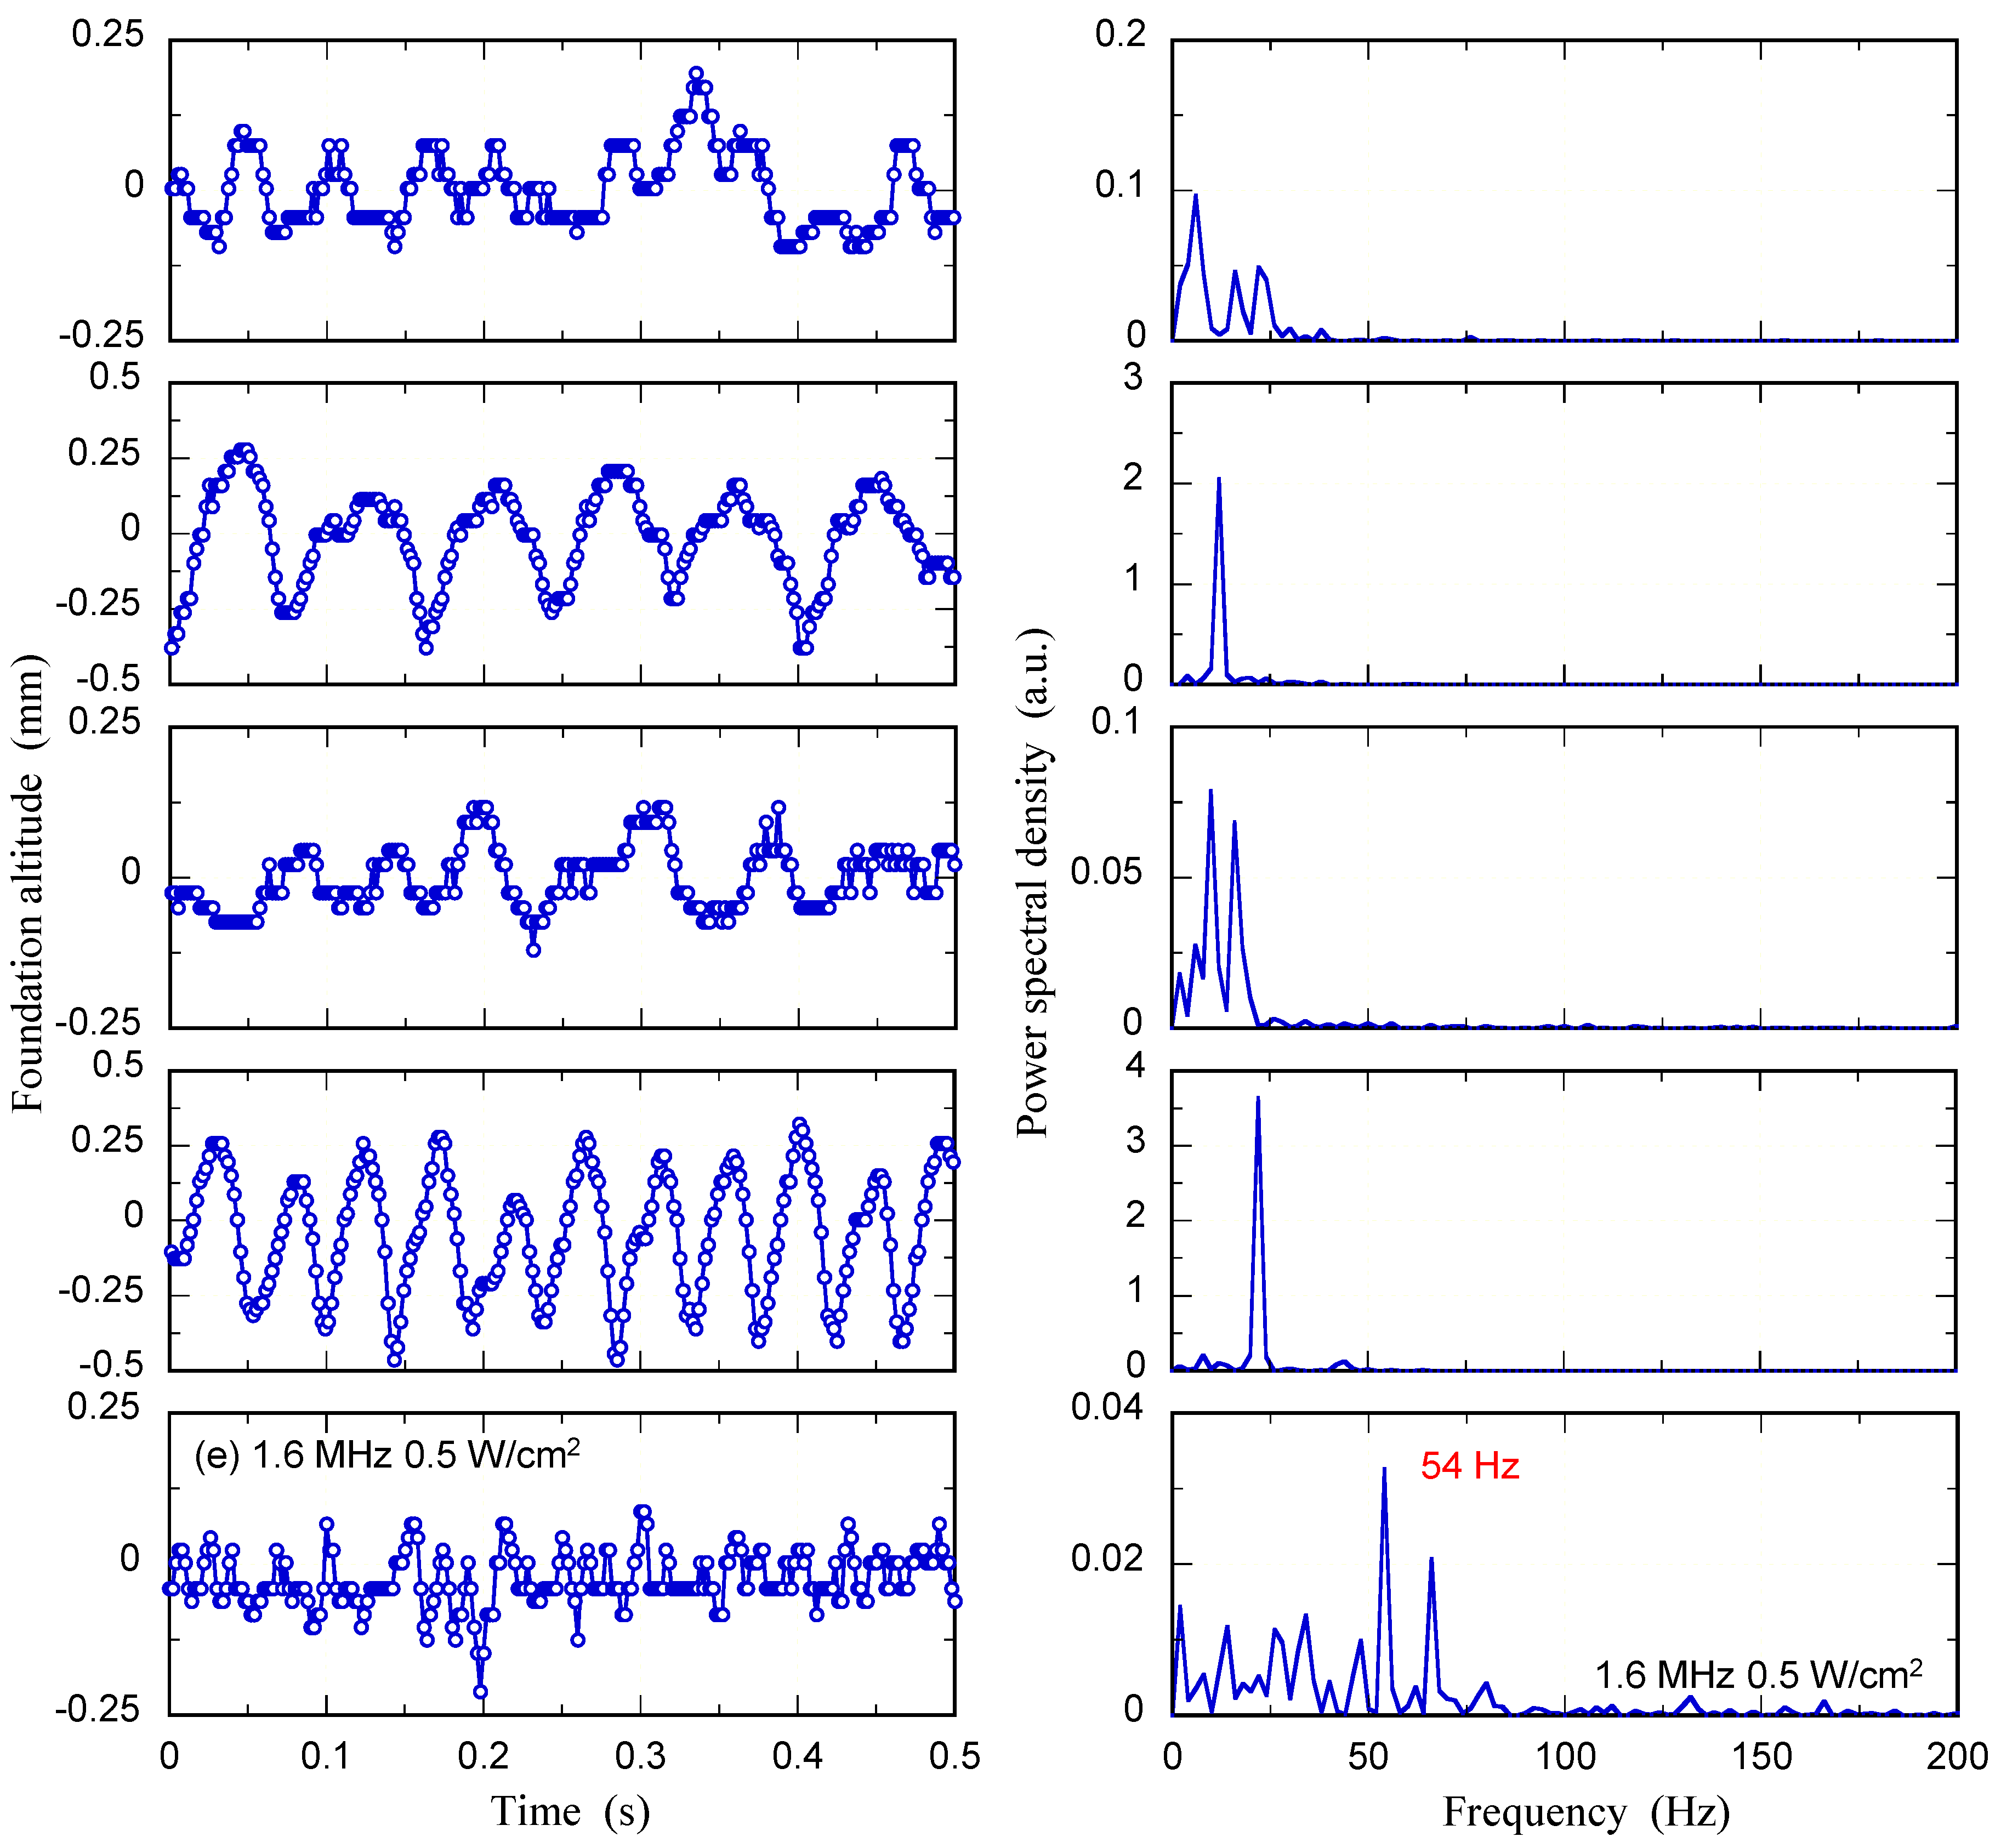
Figure 5 demonstrates typical oscillation patterns exhibited in terms of time-series data/ signals for the protrusion/fountain altitude/height and their corresponding FFT outcomes. The periodicity in the height fluctuations appears to be of “quasi-nature.” At 0.43 MHz, the signals inherently contain a dominant frequency of 6 Hz (in rather a wider range spanning 6−24 Hz) and 12 Hz (in a much narrower range) for 9 and 10 W/cm
2 [
Figure 5(a) and (b)], respectively; the effects of input power density are inconclusive, though some critical shift in periodic trend appears to exist between these two values. As the driving frequency is raised from 0.43 to 0.80, 1.0 and 1.6 MHz, the dominant frequency of height fluctuations tends to increase from 6 to 10, 22 and 54 Hz; the assigned values of the input power density here are irrelevant in discussing the trend for this set of data attaining the 2nd state (see
Table 1).
Bulk-liquid cavitation: As stated in
Section 1 repeatedly, obtaining the information regarding the concurrent formation of cavitation—along with the structural transitioning of the free surface from flat to protruding to jetting—should be quite helpful (Simon
et al., 2015; Aikawa and Kudo, 2021). While it is extremely difficult in the present study to capture any images of cavitation bubbles inside the protuberance, doing so through the bulk liquid above the UsA transducer up to the free surface has been attempted.
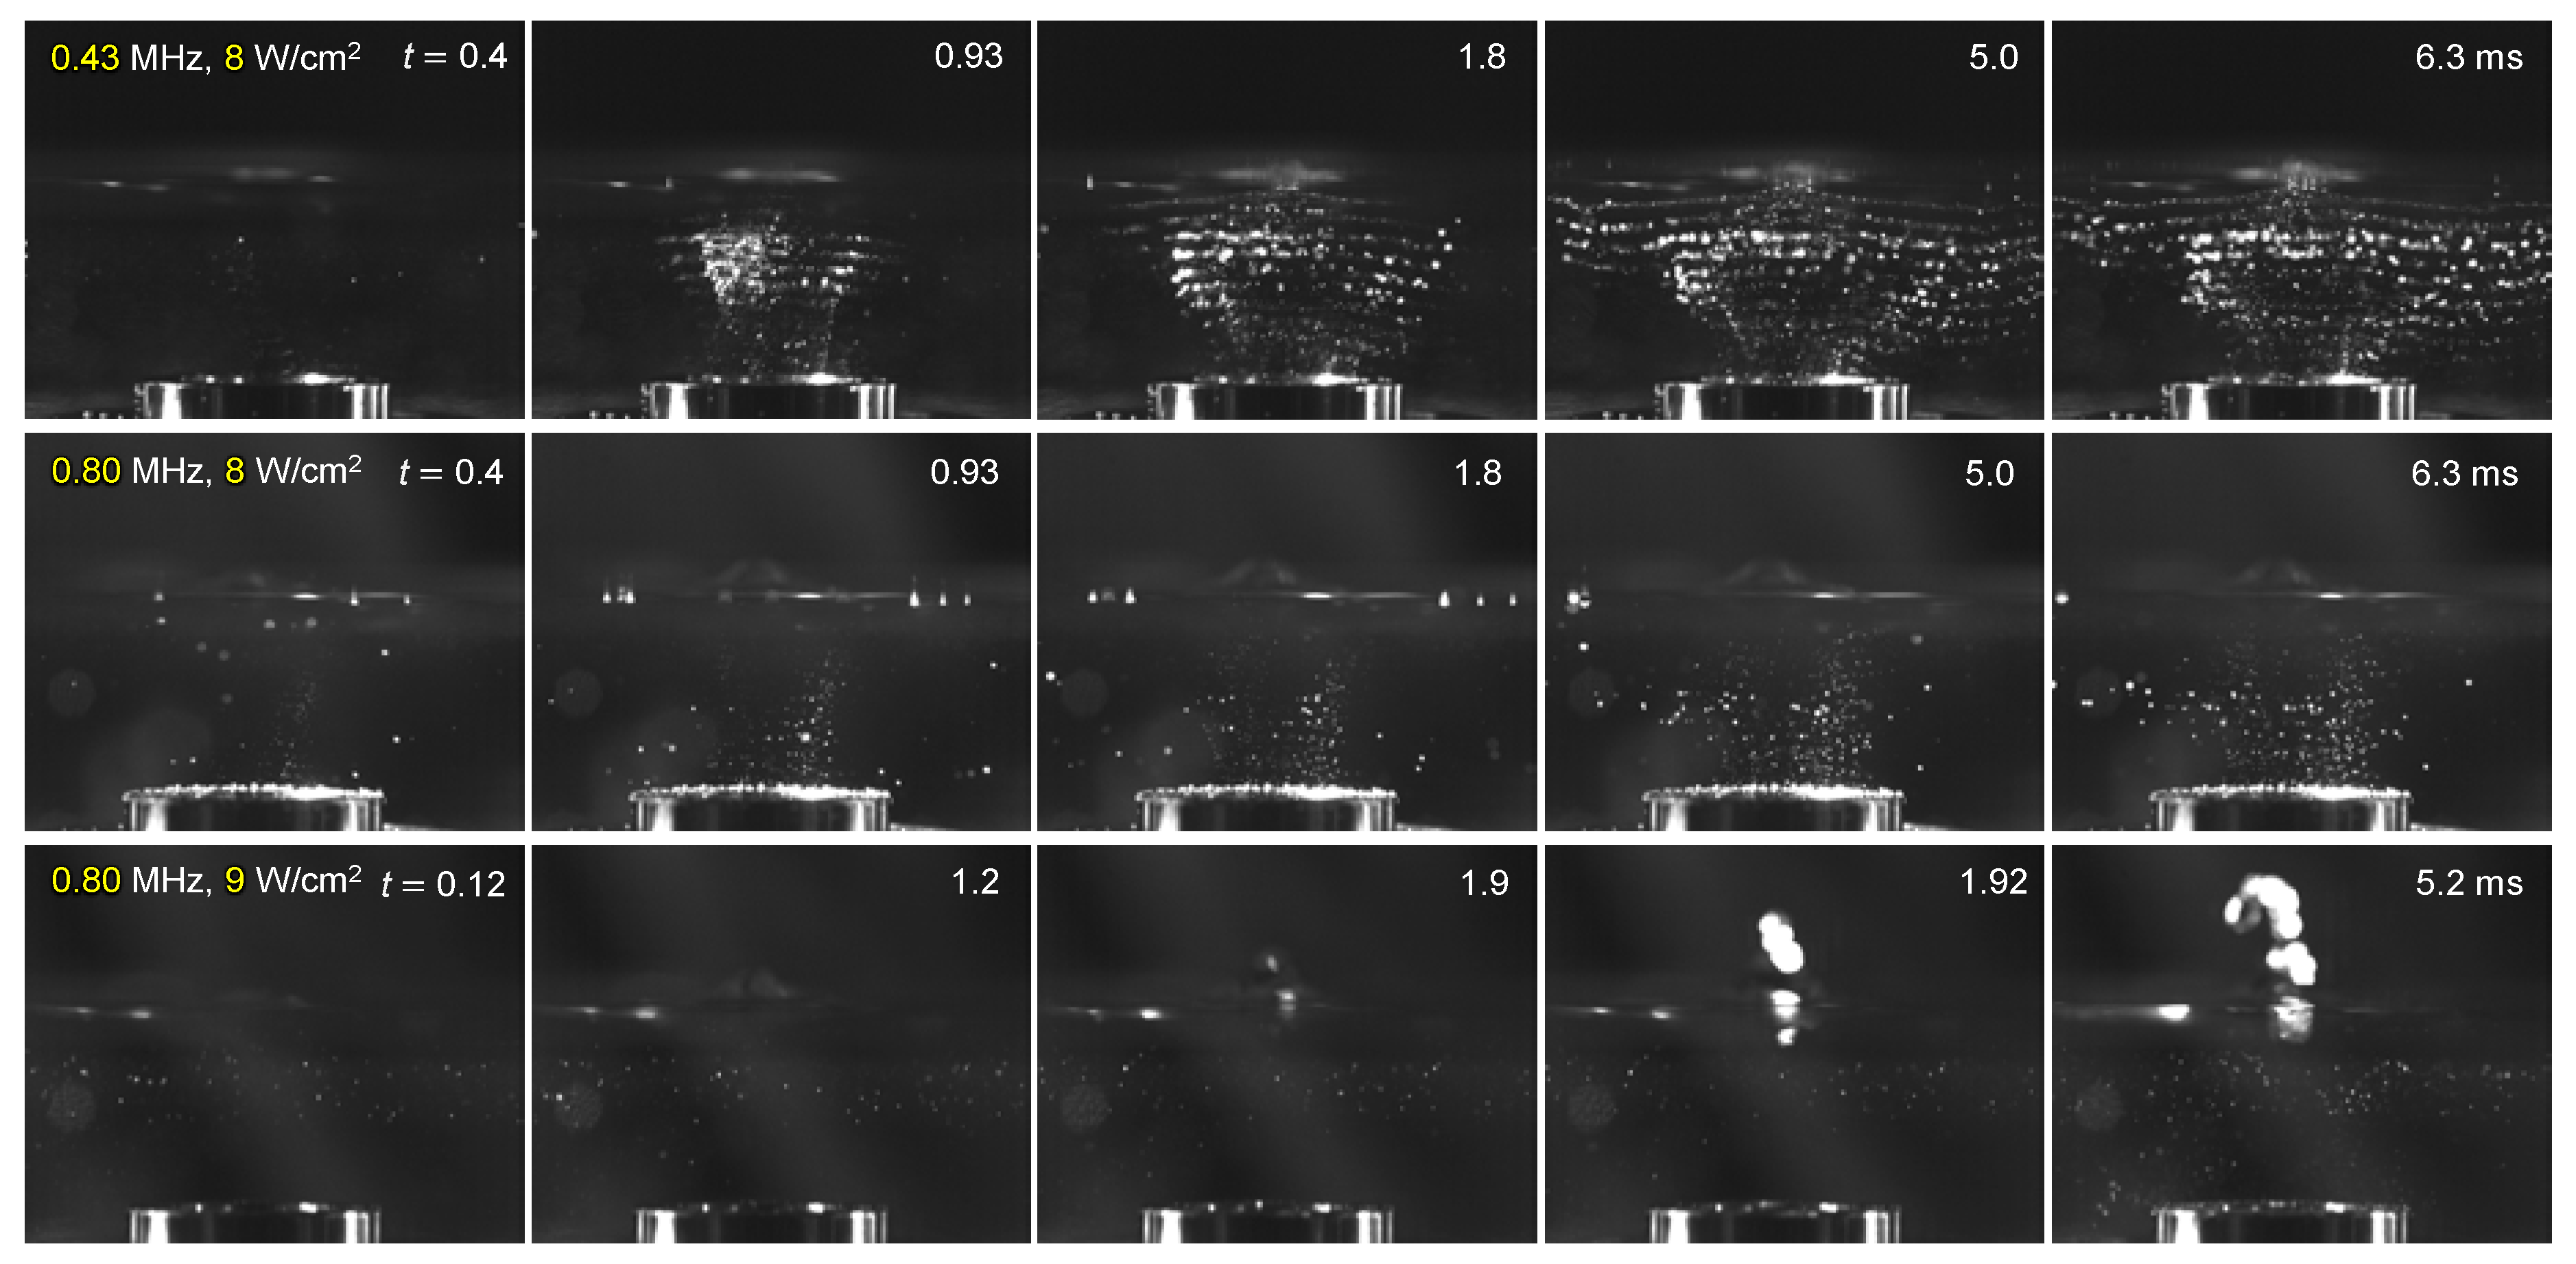
Figure 6 shows the spatial distribution of bubbles, which should have originated from cavitation, generated within the bulk liquid and captured via side-lighting. Note that two sets of comparisons are made in terms of two-parameters (
) combinations: different
’s of 0.43 and 0.80 MHz for a given
of 8 W/cm
2; and different
’s of 8 and 9 W/cm
2 for a fixed
of 0.80 MHz. In the first series of images (top row), the bubbles appear encircling around the vertical axis of acoustic wave propagation in a standing-wave pattern (for
0.93 ms with
being the time elapsed after the UsA transducer turned on). As the time has exceeded 1.8 ms, some ripples begin to appear on the liquid surface (not recognizable in the figure); the bubbles then spread out appreciably towards the vessel wall as they approach the free surface (
5.0 ms), prior to the free surface to start rising into a mound (appreciation of the 1st state, 6.3 ms).
) specified from (a) to (e).
For the same
(8 W/cm
2) but with
raised to 0.80 MHz (middle row), the free-surface rippling was recognizable at 0.4 ms; a bell-shaped mound with some undulation was observed to start developing at 0.93 ms (2nd state). In comparison to the first case, some additional information has been obtained: The size of the visible bubbles was significantly reduced at the higher
; Despite faint streaks between nodes being identified, the standing-wave structure was clearly disrupted; The bubbles were mainly localized near the transducer with no obvious tendency to spread. Maintaining
(0.80 MHz) while increasing
to 9 W/cm
2 (bottom row), a developing protrusion began to appear as early as at 0.12 ms, having resulted in the solid formation of a beads fountain at 1.92 ms. An apparent structure of the standing wave was no longer identifiable in the images; only randomly dispersed/migrating bubbles of very limited number could be identified closer to the liquid surface. Note that such a series of cavitation-associated behaviors in the bulk liquid would resemble those reported by Lee et al. (2011), who investigated the mechanism of liquid flow by monitoring the spatial distribution of visible bubbles, for a similar range of
but different
values (see
Section 1).
Further discussion regarding the dynamic behavior of the bulk-phase cavitation bubbles are possible such that: Those visible bubbles would be expelled from the pressure antinodes and become trapped at adjacent pressure nodes due to active bubbles merged by actions of the primary and secondary Bjerknes forces (Lee et al., 2011). The larger bubbles or bubble clusters/clouds generated via coalescence can scatter and attenuate the ultrasound wave (Choi et al., 2019). It is generally known that the size of bubbles will decrease with increasing ultrasound frequency (Leighton, 1994; Laborde et al., 1998; Yasui, 2002; Brotchie et al., 2009; Merouani et al., 2015); in the present study, though, no further attempts in this regard have been made in extended ranges of the acoustic operating conditions. To be somewhat conclusive, however, in light of the difference in bubble flow between 8 and 9 W/cm2 at 0.80 MHz, it could be presumed under the present conditions that acoustic streaming is most likely responsible for reaching the instability-associated fountain formation. The large “gap” in the applied power density detected between 0.80 MHz (9 W/cm2) and 1.0 MHz (1 W/cm2) further implies that, behind the mechanism of acoustic fountain formation, there could be some “unforeseen” thresholding factor(s) responsible for it, which should be clarified in an upcoming work.
3.2. Characterization of Emanating Beads Fountain
In regard to a chain of beads emanating out of the foundation-like region [FR alone when no appreciable fluctuating instabilities are apparent yet, or Bumpy-Surface Region (BSR) on top of it otherwise; Tsuchiya et al., 2011; Wang and Tsuchiya, 2022], some experimental and model-based findings were made in our previous work (Wang et al., 2022). The acoustic pair of conditions were confined to 1−3 MHz mostly and 4−6 W/cm2, in the presence of the stabilizing nozzle, to obtain two quantitative/inherent relationships for: 1) the beads size () vs. (size specificity) and 2) the beads resonance/natural frequency ( or ) vs. (periodicity). The present study is to extend the same line of analyses to a wider range of the paired parameters with or without the nozzle equipped.
Minimum driving frequency for triggering beads fountain: One specific aspect to be clarified in this extended work lies in the uncertainty of minimum driving frequency for realizing the beads fountain (3rd state; see
Figure 2 and
Table 1).
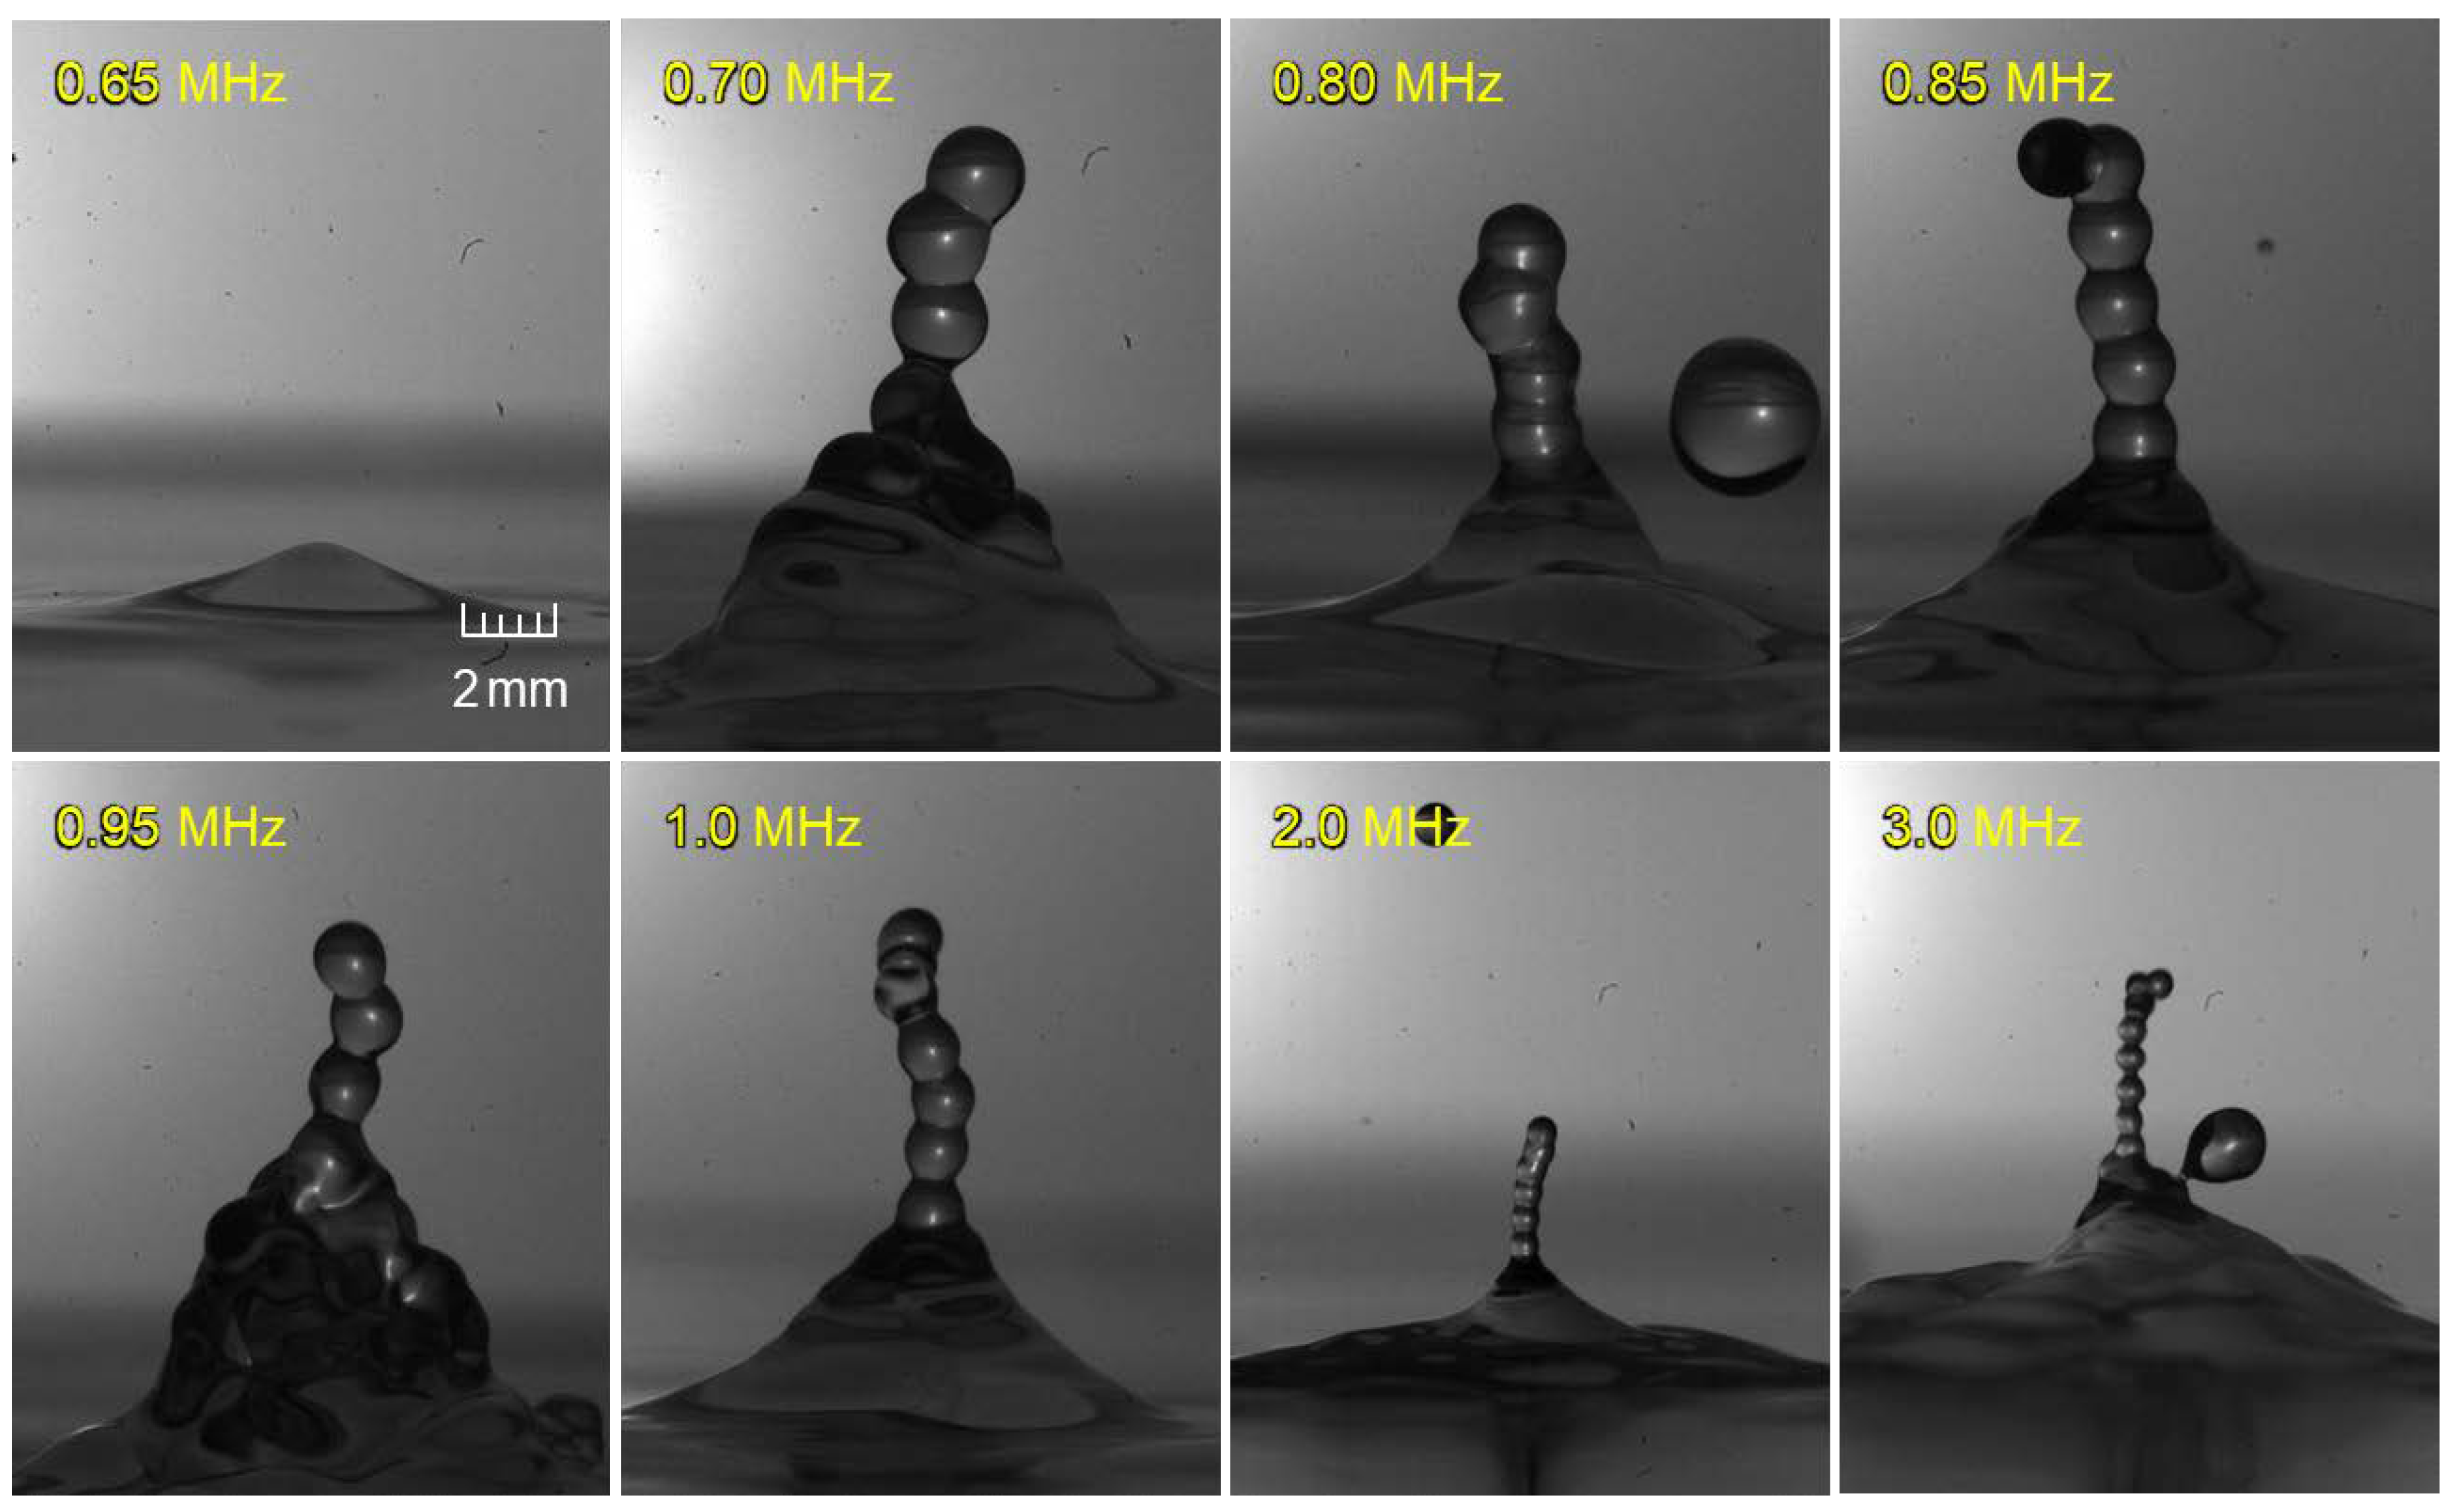
Figure 7 provides a series of images implying the critical role played by the UsA-driving frequency—over the range
0.65−3.0 MHz—in the formation of beads fountain. The specificity as well as uncertainty (associated with utilizing the “frequency shifting/tuning capability” provided on the ultrasonic transducer system; see
Section 2) in
, on the other hand, should be noted to be rather insignificant or even irrelevant over a typical range examined, as reported by Wang et al. (2022). As the driving frequency is increased—except
0.65 MHz, the beads diameter tends to decrease; the extent of reduction can be clearly seen for
1.0 MHz. It is noteworthy that, for this lowest 0.65 MHz tested, no triggering of beads fountain has been detected (on all the images obtained under the same conditions repeated) even at the highest operational limit tested (
10 W/cm
2).
It is to be noted here that Wang et al. (2022) presumed the required frequency
should exceed 0.8 MHz at least, based on their argument that “the pertaining bead diameter
should not exceed the capillary length (
)”:
which depends on the surface tension
and density
of the liquid, and
the gravitational acceleration. As Wang et al. (2022) further argued, having this condition (
) met, the prevalent surface-tension/capillary wave would become less dominant than the gravitational wave. Substituting the liquid properties,
28.8 mN/m and
902 kg/m
3, for the present 50-wt% ethanol aqueous solution at 25°C (Khattab
et al., 2012),
would be estimated to be 1.80 mm, slightly less than the characteristic bead diameter—confirmed (see
Figure 7) to be almost identical to an estimate—
1.84 mm, thus the above-said condition being met for
of 0.80 MHz.
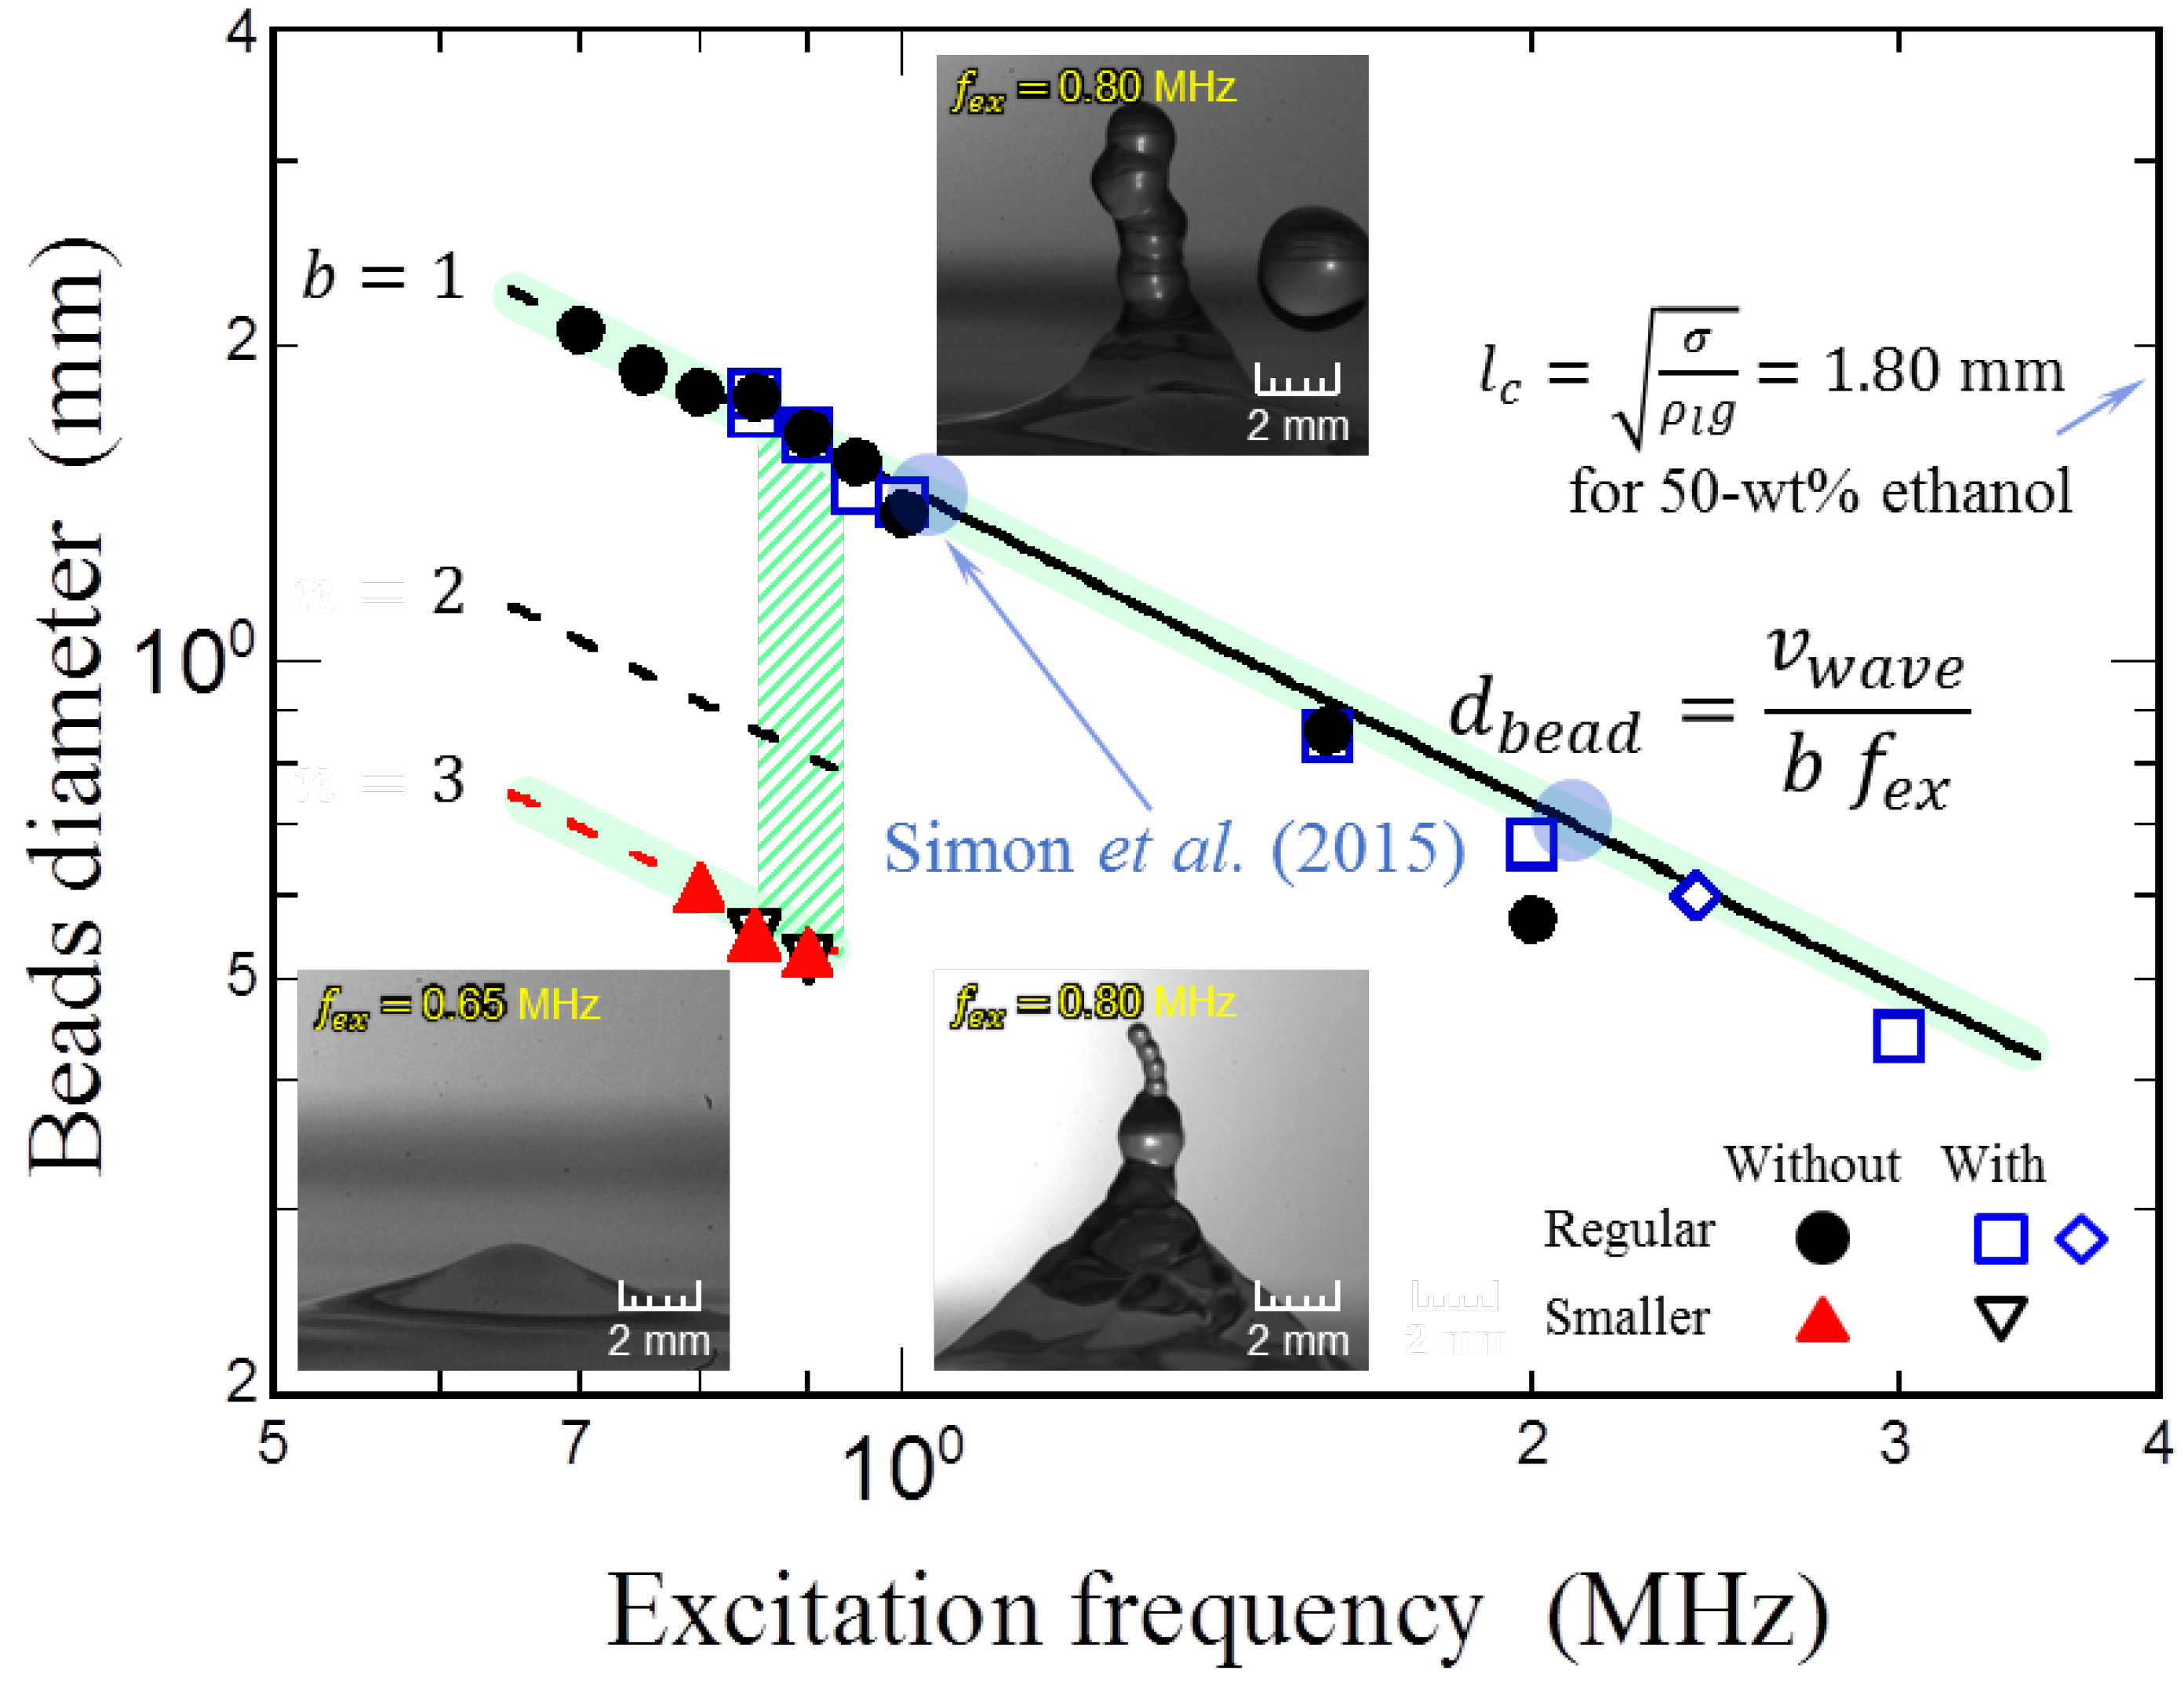
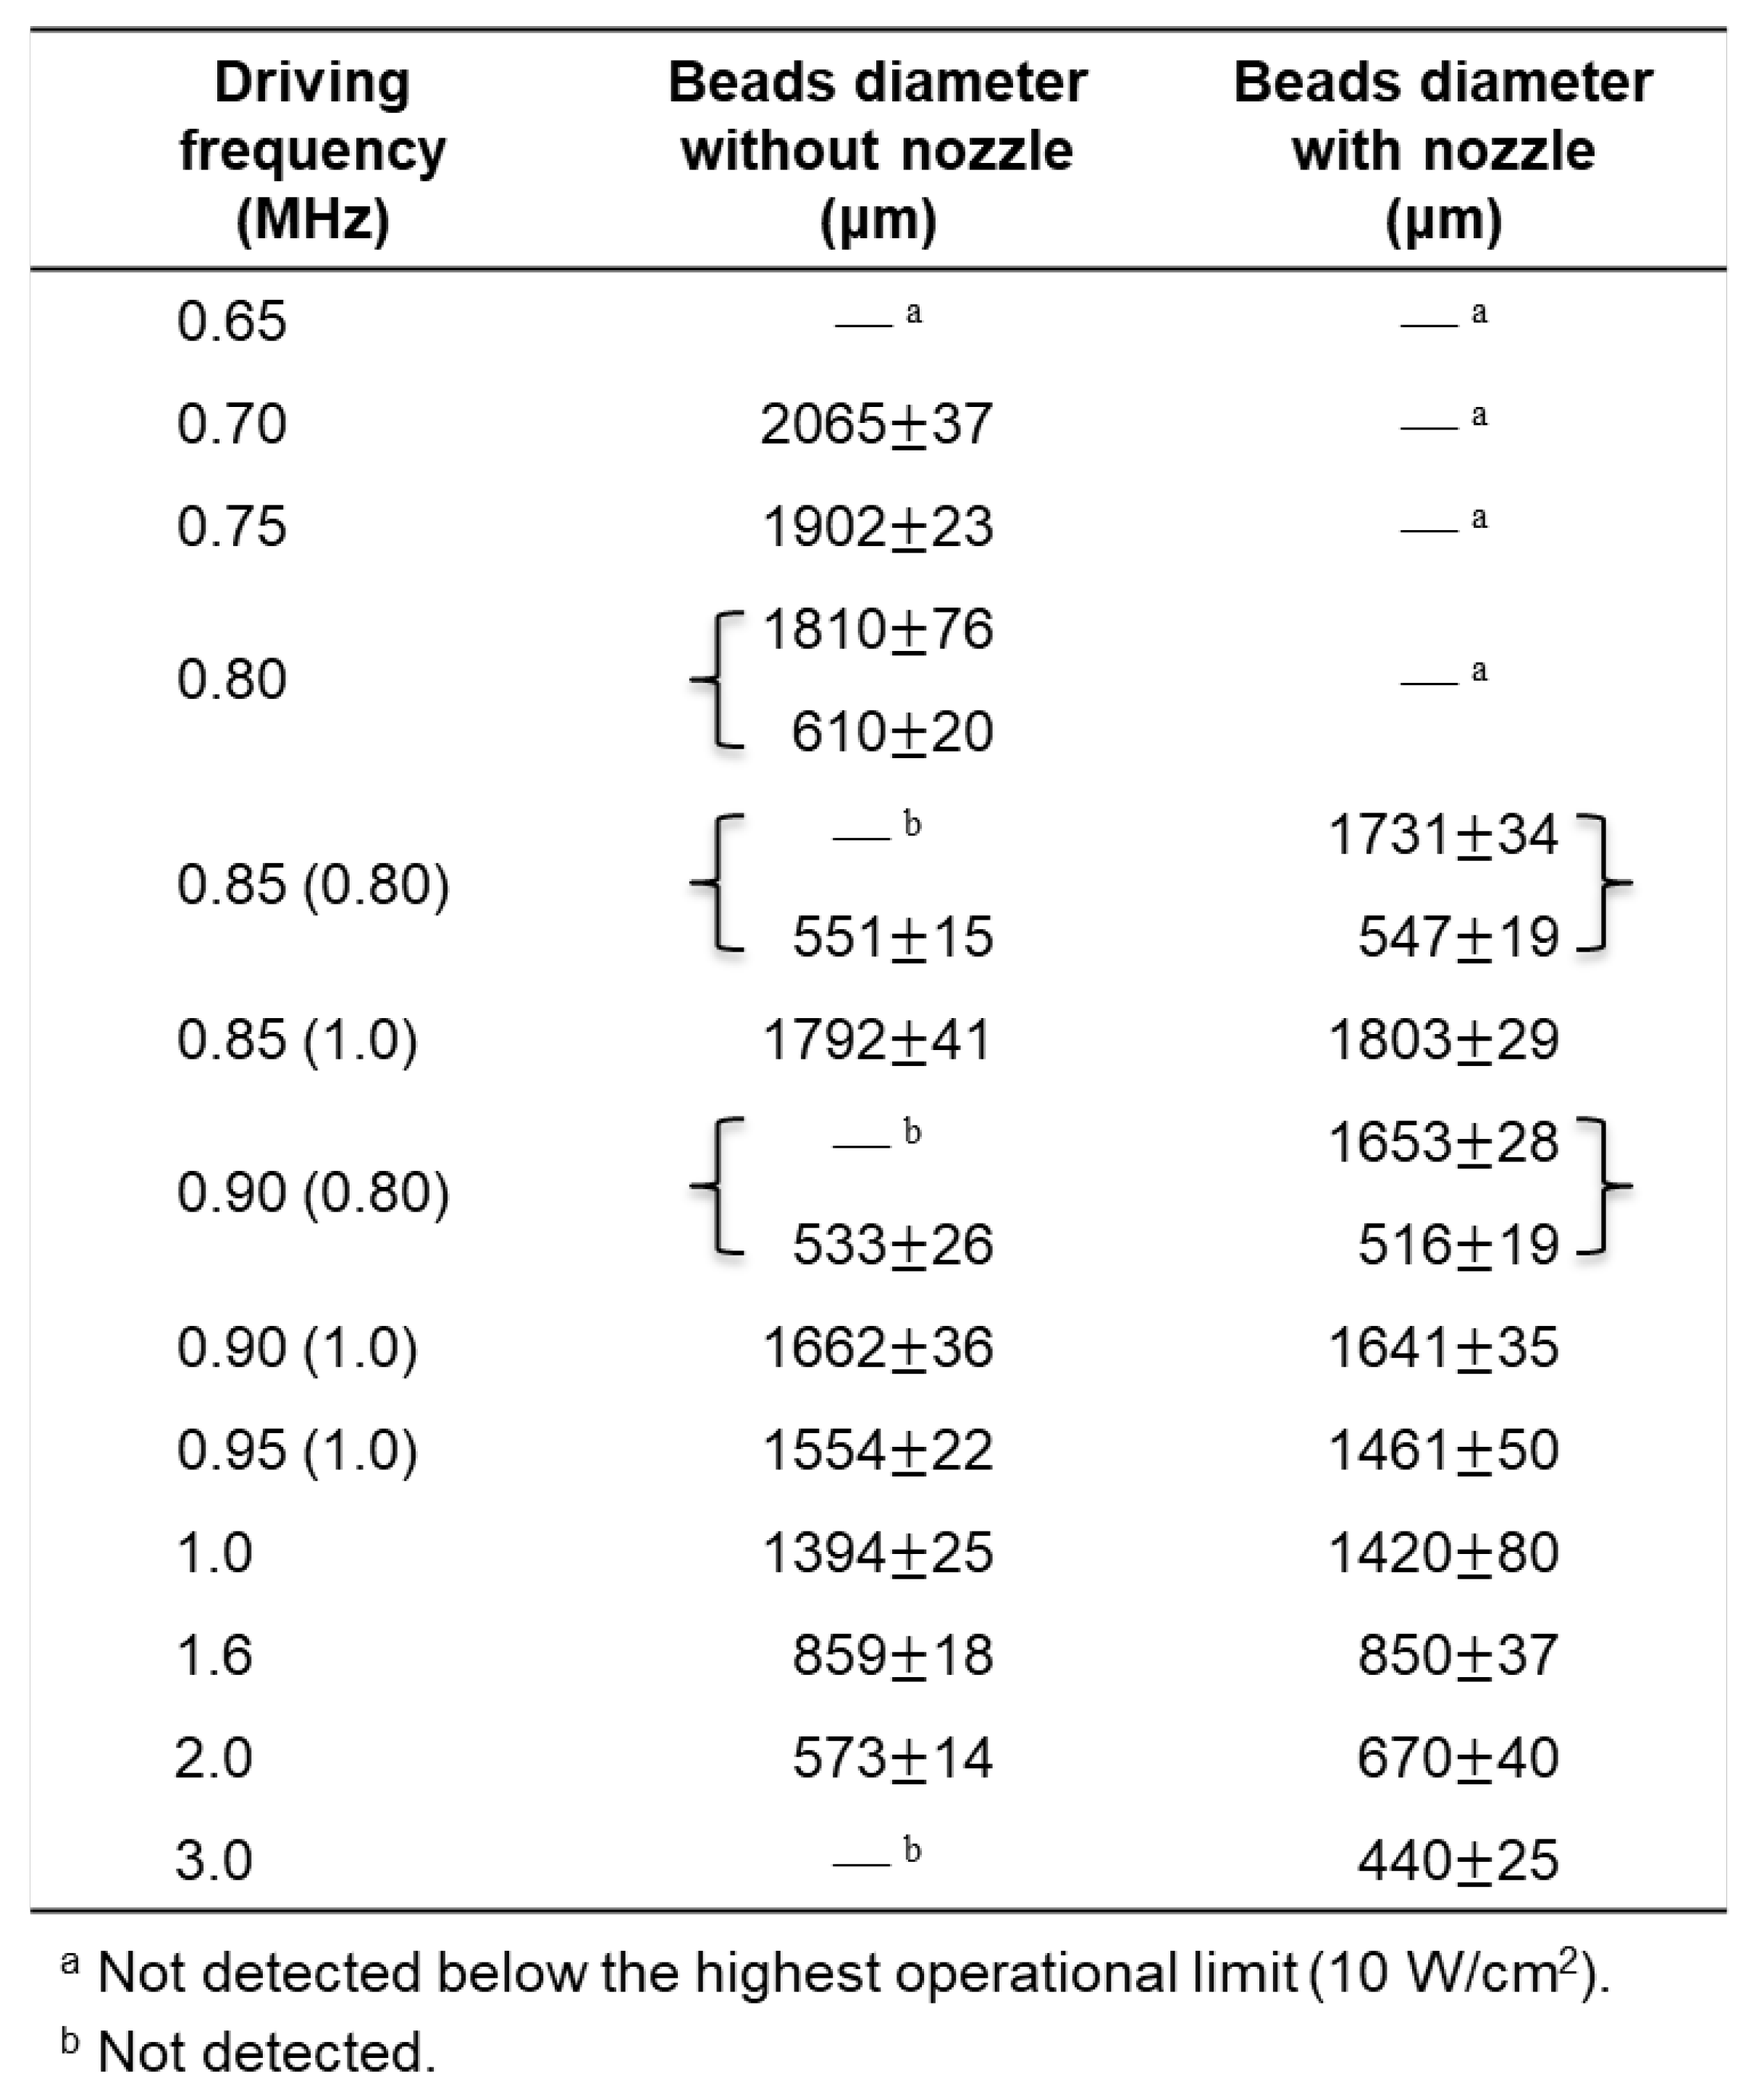
Phase-averaged size specificity of beads fountain: The fountain-beads diameter averaged under each specific condition tested is shown in
Figure 8 as a function of the driving frequency; for ease of specific and detailed comparison between each of the data points, all the obtained values (of standard deviation as well as average) are summarized in
Table 2. Plotted in log-log scale (to “expand” the lower range of the frequency), the trends exhibited by the experimental data can be well represented by straight lines of slope
. Such trends,
i.e.,
increases—in line with the hyperbolic variation—with decreasing
, can be represented by the physical principle—signifying the
inherent traveling wave relationship:
where two parameters
and
are introduced: the former signifies, as stated above (see
Section 3.1 concerning the protrusion of concentric circles induced on the free surface), whether the frequency of the ultrasonic wave
equals
or not; the latter concerns with possible “bifurcation” in
whose onset may occur below some critical excitation frequency. Depending on the fluctuating instabilities set in on the protuberance,
if they are sufficient (States 3 and 4) but
otherwise (States 1 and 2).
It is to be noted in the figure that the beads diameter appears to be not influenced by the presence/ absence of the regulating nozzle equipped. In principle, its value is argued not to exceed the capillary length—in our present ethanol solution 1.80 mm (as detailed above). The experimental results indicate that carefully evaluated [refer to Wang et al. (2022) for its detailed measurement procedure] could take a value as high as 2.07 mm at . While this largest value of might be in the gravitational-wave (rather than capillary-wave) domain, it could be inferred that the minimum driving frequency discussed in the previous “sub-section” would be as low as 0.7 MHz—in comparison to the preliminary value 0.8 MHz proposed by Wang et al. (2022).
It is also noteworthy in
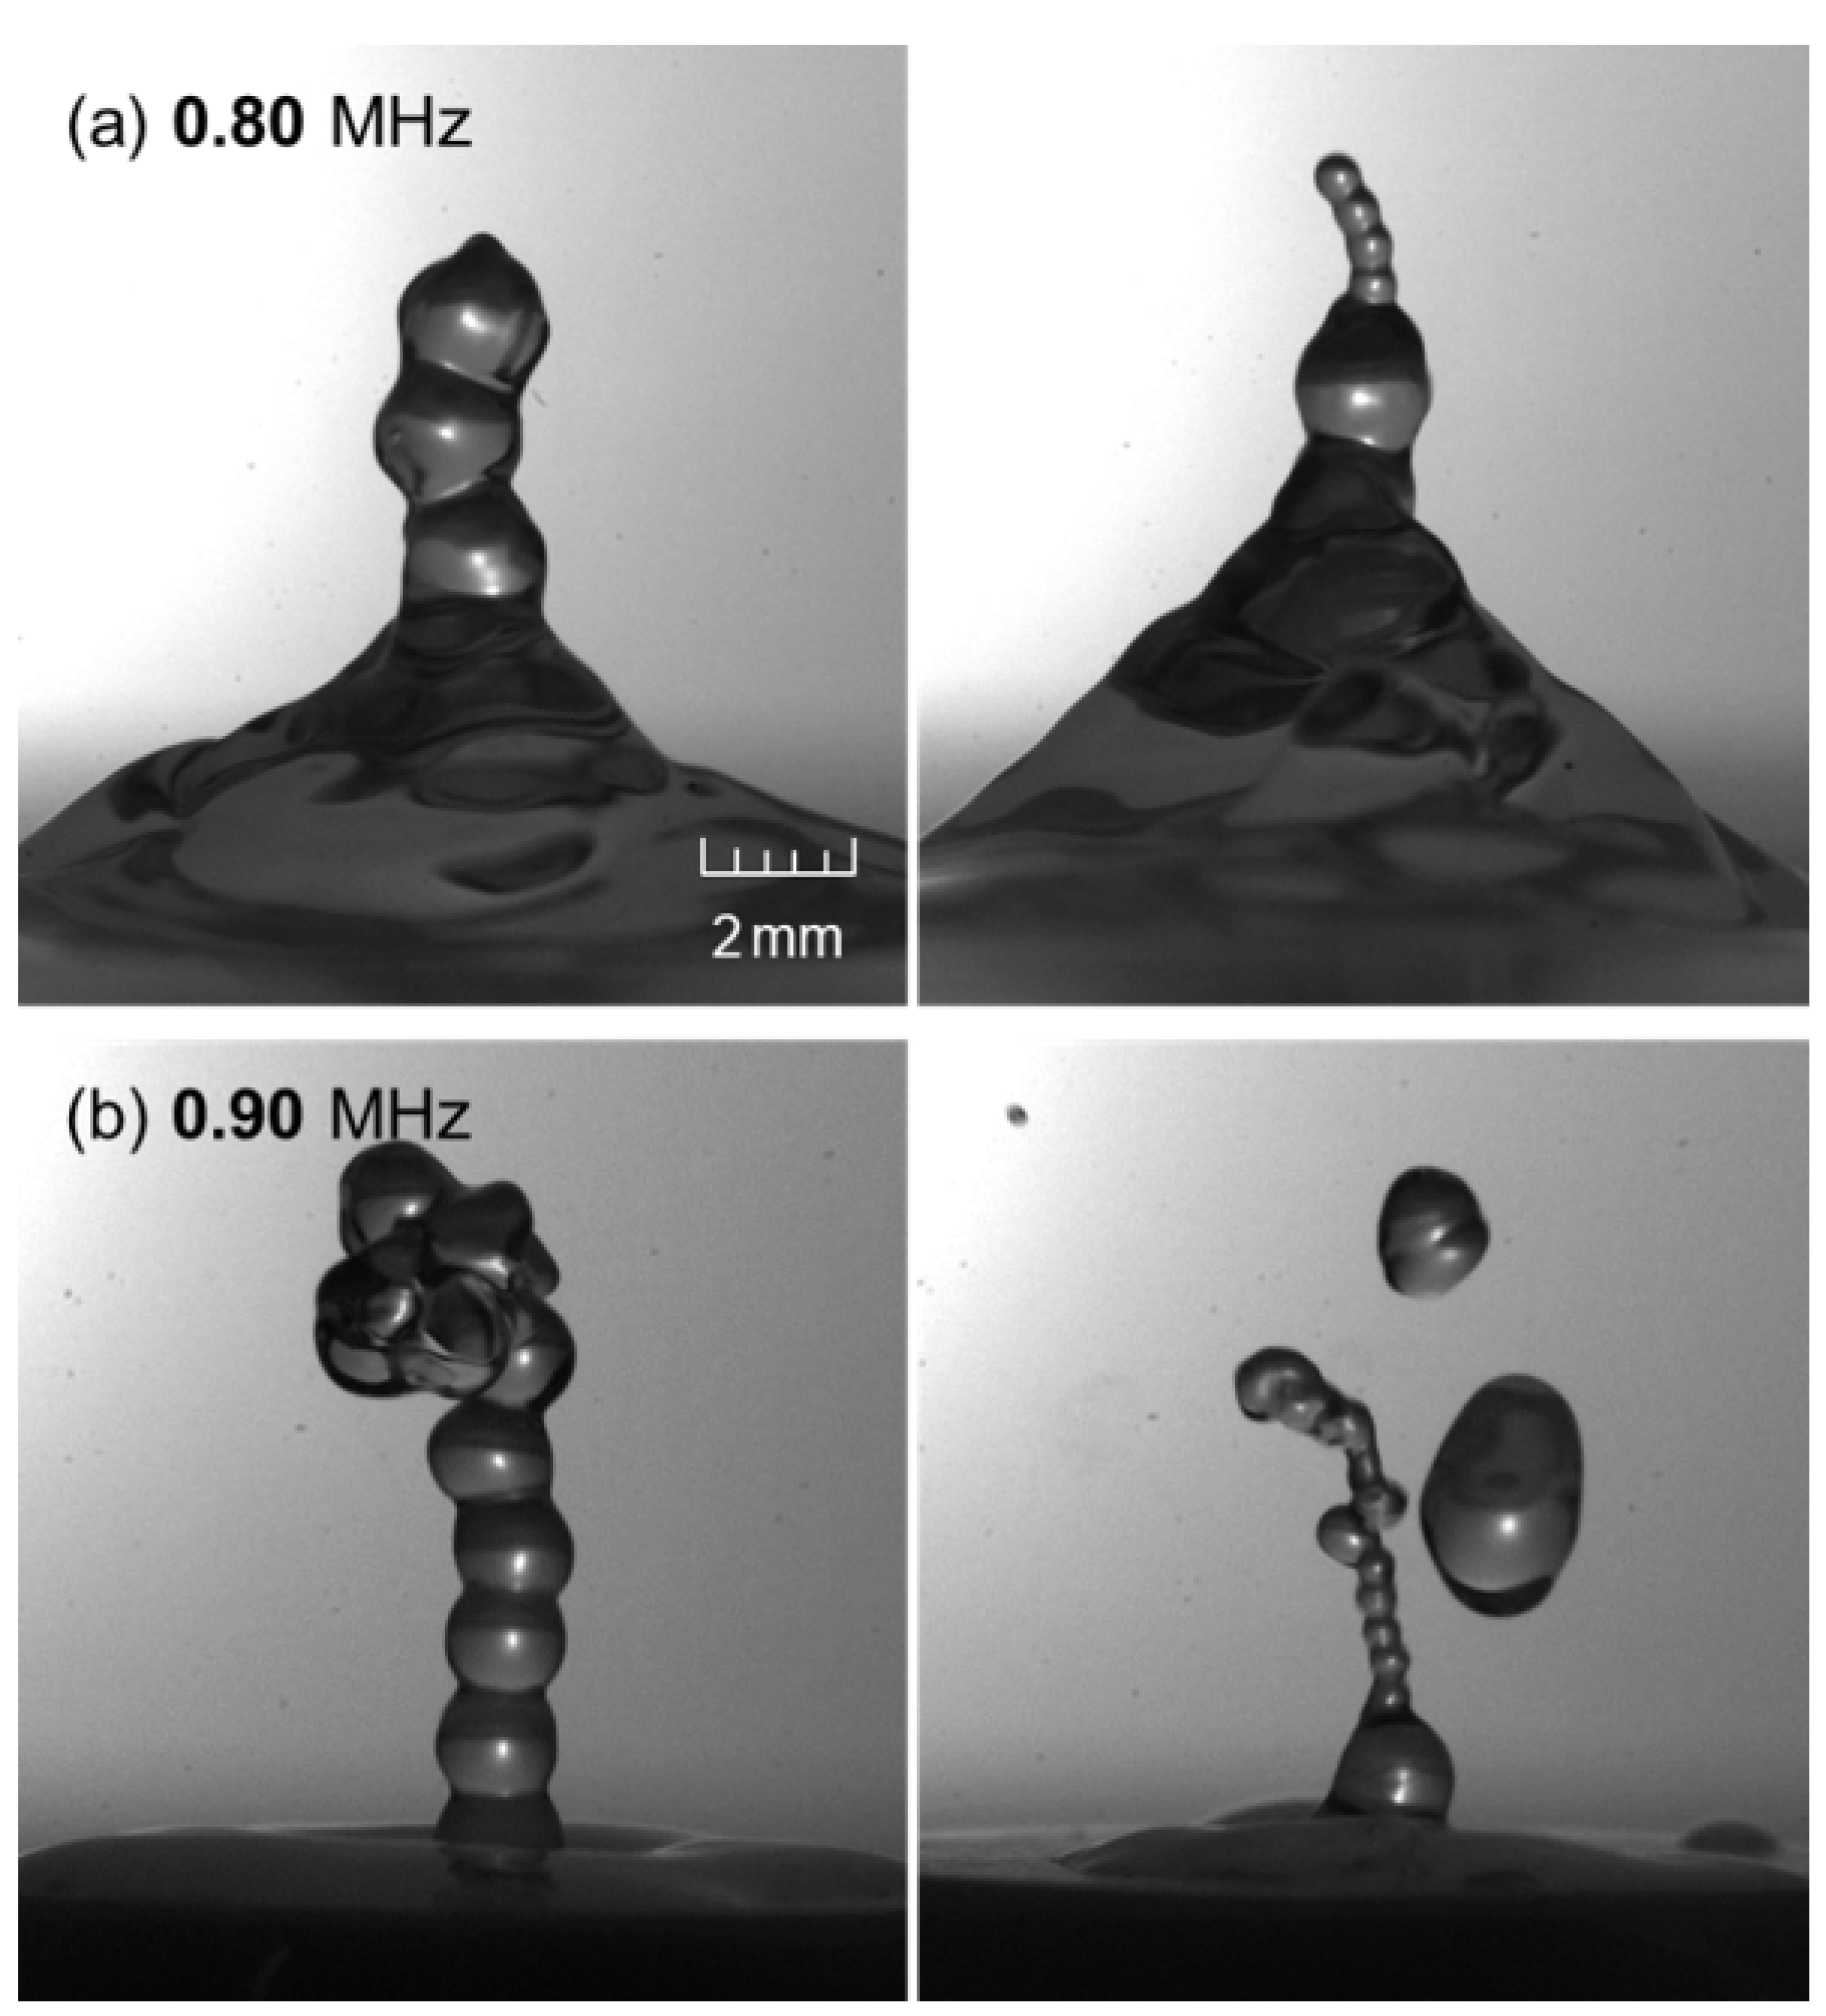
Figure 8 that a separate set of data points shown for the frequencies lower than 0.9−1.0 MHz could be an indication of bifurcation candidate—though not provided with solid evidence at this stage of data taking—requiring further verification. As a piece of partial evidence, shown in
Figure 9, beads with diameters of about one-third the “normal” ones (see the data along the solid line in
Figure 8) could be detected concurrently between 0.80 and 0.90 MHz—plausible bifurcation into the normal-sized beads [
primary beads;
in Eq. (3)] and smaller ones (
secondary beads;
), observed experimentally in a sequence of images to appear alternately.
The appearance of secondary beads is often accompanied by—emanating out of—a single primary bead formed right above the FR (or BSR if present); as mentioned above, the occurrence of such secondary beads will be realized alternately with the primary ones, leading us to a speculative, mechanistic description as follows. As the driving frequency is reduced below a threshold—possibly the above-discussed “bifurcation-inducing” frequency of 0.9 MHz, the “highly excited radial oscillations” would become no longer stable (Simon et al., 2015). The acoustic radiation force then could be insufficient to support the stable prevalence of a fountain solely consisting of a chain of primary beads; in a sense, a solitary “base” primary bead acts as an “energy concentrator” (Simon et al., 2015); the acoustic radiation pressure is effectively trapped inside the base bead and focused towards the tip, producing a chain of recurring secondary beads of roughly (happened-to-be) one-third the diameter of the primary ones. It can be hypothesized then that the relevant threshold for the instability to be set in signifies a shift in the dominant mechanism leading to the beads-emanating state—from acoustic radiation pressure to streaming.
4. Concluding Remarks
In irradiating ultrasound under wide ranges of operating conditions—specifically, the driving frequency 0.43−3.0 MHz and the input power density 0.5−10 W/cm2—the UsA process is confirmed to go through a sequence of four states of transition: the onset of protrusion, the appearance of undulation, the triggering of beads-fountain emergence, and the induction of droplets bursting. In this study, the following specific findings are made:
The threshold (lower-bound) values for the set of acoustic operating parameters () are determined visually to be: (0.43 MHz, 6 W/cm2) or (0.80 MHz, 6 W/cm2) for the protrusion onset—State 1; (0.43 MHz, 9 W/cm2), (0.80 MHz, 8 W/cm2), (1.0 MHz, 0.5 W/cm2) or (1.6 MHz, 0.5 W/cm2) for the undulation appearance—State 2; (0.80 MHz, 9 W/cm2), (1.0 MHz, 1 W/cm2) or (1.6 MHz, 1 W/cm2) for the beads-fountain triggering—State 3; and (1.0 MHz, 2.5 W/cm2) or (1.6 MHz, 1.5 W/cm2) for the droplets-bursting induction—State 4. To be notable here lies in the large “gap” in the applied power density detected in State 2 as well as State 3 between 0.80 and 1.0 MHz, implying that there could be some drastically different thresholding factor(s) responsible for describing the mechanism of acoustic fountain formation, warranting further research.
Three peculiar characteristics to be pointed out in State 2 are: first, wave-specific nature of the stable-mound undulation pitch, i.e., the vertical span of peak-to-peak distance of the undulated protuberance, quantified with every two pitches corresponding to where ; second, stepwise increase in the steady-attained height of mound with negligible fluctuating instability as the input power is raised critically from the upper bound of State 1 to the lower one of State 2; third, the mound height fluctuating with small amplitudes, in addition to its surface undulation. The last characteristic, having quasi-periodic nature evaluated through the FFT analysis, possesses a dominant frequency increasing with the driving frequency while the input power density would exhibit inconclusive effects.
The 3rd phase, or State 3, is associated with the fountain structure comprising a chain of recurring beads whose size should be scalable to the UsA wavelength. The average beads diameter evaluated experimentally, over the present extended range of the acoustic parameters set, exhibits a general trend that will increase—in line with the hyperbolic variation—with decreasing . This trend has been confirmed to coincide with the wave nature predicable from simple physical principle over the entire range examined in this study—provided would not exceed the capillary length appreciably—corresponding here to the minimum driving frequency as low as 0.7 MHz; an additional characteristic is found concerning possible “bifurcation” in whose onset may occur below some critical .
As an indication of bifurcation, beads with diameters of about one-third the “normal” ones (or the primary beads as predicted above) have been detected intermittently between 0.80 and 0.90 MHz. Such secondary beads, being realized alternately with the primary ones, tend to emanate out of a single primary bead—a solitary “round base” acting as an “energy concentrator”—formed right above the Foundation Region.
